graduation trends - public.uhcl.edu · university of houston-clear lake office of institutional...
TRANSCRIPT

Office of Institutional Effectiveness
Graduation Trends AY 2012-13 – AY 2016-17
Date of Publication: October 2017

University of Houston-Clear Lake Office of Institutional EffectivenessGraduation Trends: AY 2012-13 – AY 2016-17 Date of Publication: October 2017
Index
Page
UHCL Graduation Trends
Total UHCL Summary Report AY 2016-17. . . . . . . . . . . . . . . . . . . . . . . . . . . . . . . . . . . . . . . . . . . . . . . . . . . . . .1
Graduation Trends by Level & by Ethnicity AY 2012-13 – AY 2016-17. . . . . . . . . . . . . . . . . . . . . . . . . . . . . . .2
Graduation Trends by Level & by Gender AY 2012-13 – AY 2016-17. . . . . . . . . . . . . . . .. . . . . . . . . . . . . . . . 3
College of Business Graduation Trends
College of Business Summary Report AY 2016-17. . . . . . . . . . . . . . . . . . . . . . . . . . . . . . . . . . . . . . . . . . . . . . 4
Graduation Trends by Level & by Ethnicity AY 2012-13 – AY 2016-17. . . . . . . . . . . . . . . . . . . . . . . . . . . . . . 5
Graduation Trends by Level, by Degree Type, by Gender AY 2012-13 – AY 2016-17. . . . . . . . . . . . . . . . . . 6
. College of Human Sciences and Humanities Graduation Trends
College of Human Sciences and Humanities Summary Report AY 2016-17. . . . . . . . . . . . . . . .. . . . . . . . . 14
Graduation Trends by Level & by Ethnicity AY 2012-13 – AY 2016-17. . . . . . . . . . . . . . . . . . . . . . . . . . . . . 15
Graduation Trends by Level, by Degree Type, by Gender AY 2012-13 – AY 2016-17. . . . . . . . . .. . . . . . . . 16
College of Science and Engineering Graduation Trends
College of Science & Engineering Summary Report AY 2016-17. . . . . . . . . . . . . . . . . . . . . . . . . . . . . . . . . 10
Graduation Trends by Level & by Ethnicity AY 2012-13 – AY 2016-17. . . . . . . . . . . . . . . . . . . . . . . . . . . . . 11
Graduation Trends by Level, by Degree Type, by Gender AY 2012-13 – AY 2016-17. . . . . . .. . . . . . . . . . . 12
College of Education Graduation Trends
College of Education Summary Report AY 2016-17. . . . . . . . . . . . . . . . . . . . . . . . . . . . . . . . . . . . . . . . . . . . . 7
Graduation Trends by Level & by Ethnicity AY 2012-13 – AY 2016-17. . . . . . . . . . . . . . . . . . . . . . . . . . . . . 8Graduation Trends by Level, by Degree Type, by Gender AY 2012-13 – AY 2016-17. . . . . . . . . . . . . . . . . 9
Page: 1 10/23/2017 MLB-OIE:Graduation Trends AY 2012-13 to AY 2016-17.xlsx
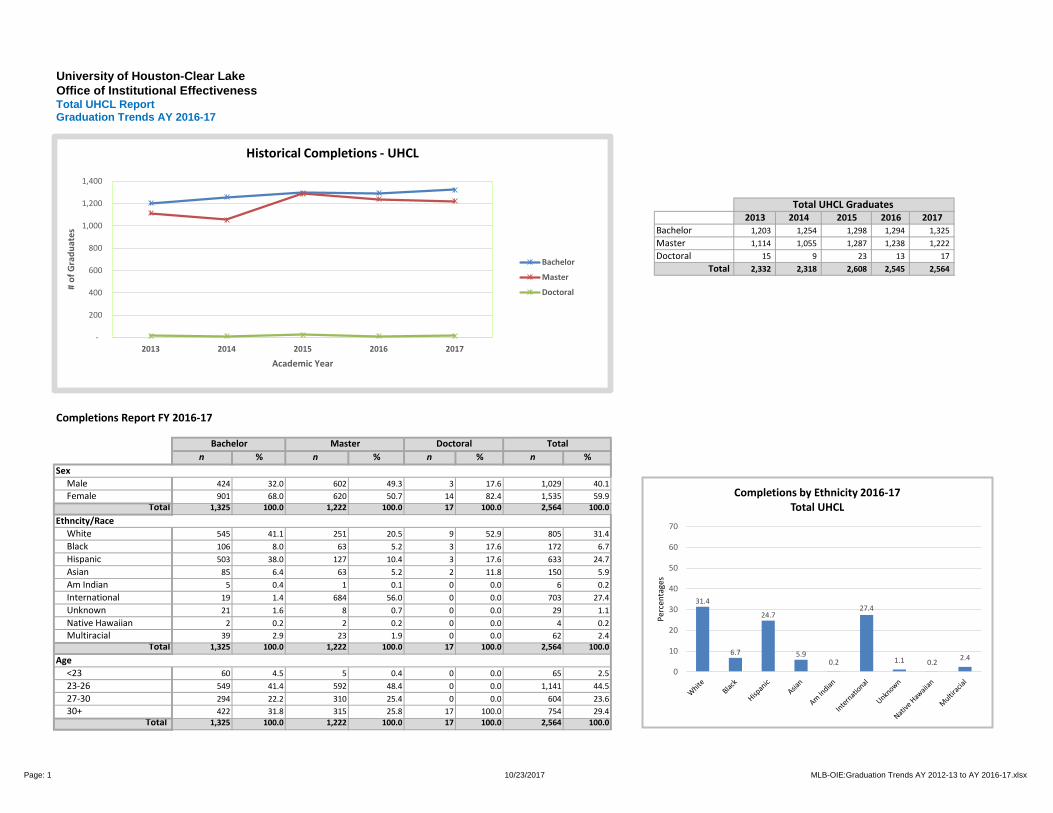
2013 2014 2015 2016 2017Bachelor 1,203 1,254 1,298 1,294 1,325 Master 1,114 1,055 1,287 1,238 1,222 Doctoral 15 9 23 13 17
Total 2,332 2,318 2,608 2,545 2,564
n % n % n % n %
Male 424 32.0 602 49.3 3 17.6 1,029 40.1Female 901 68.0 620 50.7 14 82.4 1,535 59.9
Total 1,325 100.0 1,222 100.0 17 100.0 2,564 100.0
White 545 41.1 251 20.5 9 52.9 805 31.4Black 106 8.0 63 5.2 3 17.6 172 6.7Hispanic 503 38.0 127 10.4 3 17.6 633 24.7Asian 85 6.4 63 5.2 2 11.8 150 5.9Am Indian 5 0.4 1 0.1 0 0.0 6 0.2International 19 1.4 684 56.0 0 0.0 703 27.4Unknown 21 1.6 8 0.7 0 0.0 29 1.1Native Hawaiian 2 0.2 2 0.2 0 0.0 4 0.2Multiracial 39 2.9 23 1.9 0 0.0 62 2.4
Total 1,325 100.0 1,222 100.0 17 100.0 2,564 100.0
<23 60 4.5 5 0.4 0 0.0 65 2.523-26 549 41.4 592 48.4 0 0.0 1,141 44.527-30 294 22.2 310 25.4 0 0.0 604 23.630+ 422 31.8 315 25.8 17 100.0 754 29.4
Total 1,325 100.0 1,222 100.0 17 100.0 2,564 100.0
Sex
Ethncity/Race
Age
University of Houston-Clear LakeOffice of Institutional EffectivenessTotal UHCL ReportGraduation Trends AY 2016-17
Completions Report FY 2016-17
Bachelor Master Doctoral Total
Total UHCL Graduates
-
200
400
600
800
1,000
1,200
1,400
2013 2014 2015 2016 2017
# of
Gra
duat
es
Academic Year
Historical Completions - UHCL
Bachelor
Master
Doctoral
31.4
6.7
24.7
5.90.2
27.4
1.1 0.2 2.4
0
10
20
30
40
50
60
70
Perc
enta
ges
Completions by Ethnicity 2016-17Total UHCL
Page: 2 10/23/2017 MLB-OIE:Graduation Trends AY 2012-13 to AY 2016-1716.xlsx
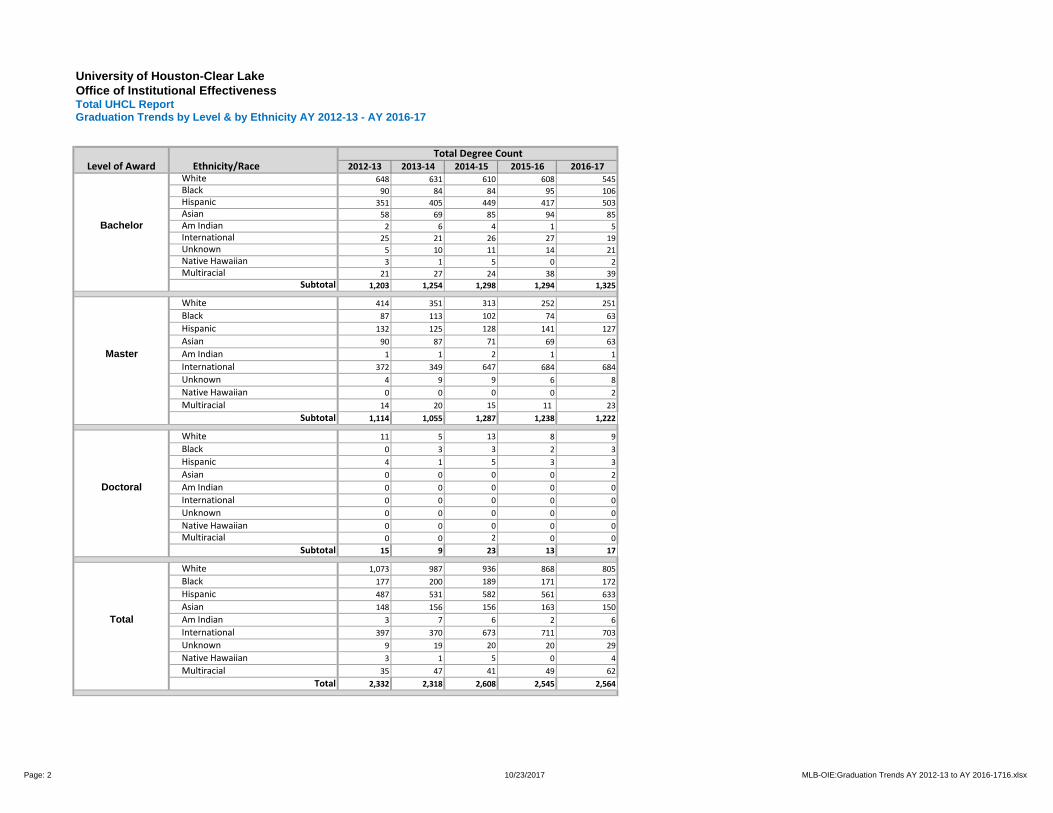
2012-13 2013-14 2014-15 2015-16 2016-17White 648 631 610 608 545Black 90 84 84 95 106Hispanic 351 405 449 417 503Asian 58 69 85 94 85
Bachelor Am Indian 2 6 4 1 5International 25 21 26 27 19Unknown 5 10 11 14 21Native Hawaiian 3 1 5 0 2Multiracial 21 27 24 38 39
Subtotal 1,203 1,254 1,298 1,294 1,325
White 414 351 313 252 251Black 87 113 102 74 63Hispanic 132 125 128 141 127Asian 90 87 71 69 63
Master Am Indian 1 1 2 1 1International 372 349 647 684 684Unknown 4 9 9 6 8Native Hawaiian 0 0 0 0 2Multiracial 14 20 15 11 23
Subtotal 1,114 1,055 1,287 1,238 1,222
White 11 5 13 8 9Black 0 3 3 2 3Hispanic 4 1 5 3 3Asian 0 0 0 0 2
Doctoral Am Indian 0 0 0 0 0International 0 0 0 0 0Unknown 0 0 0 0 0Native Hawaiian 0 0 0 0 0Multiracial 0 0 2 0 0
Subtotal 15 9 23 13 17
White 1,073 987 936 868 805Black 177 200 189 171 172Hispanic 487 531 582 561 633Asian 148 156 156 163 150
Total Am Indian 3 7 6 2 6International 397 370 673 711 703Unknown 9 19 20 20 29Native Hawaiian 3 1 5 0 4Multiracial 35 47 41 49 62
Total 2,332 2,318 2,608 2,545 2,564
University of Houston-Clear LakeOffice of Institutional EffectivenessTotal UHCL ReportGraduation Trends by Level & by Ethnicity AY 2012-13 - AY 2016-17
Level of Award Ethnicity/RaceTotal Degree Count

Page: 3 10/23/2017 MLB-OIE:Graduation Trends AY 2012-13 to AY 2016-17.xlsx
2012-13 2013-14 2014-15 2015-16 2016-17Male 362 372 400 403 424
Bachelor Female 841 882 898 891 901Subtotal 1,203 1,254 1,298 1,294 1,325
Male 509 418 607 640 602Master Female 605 637 680 598 620
Subtotal 1,114 1,055 1,287 1,238 1,222
Male 5 1 8 1 3Doctoral Female 10 8 15 12 14
Subtotal 15 9 23 13 17
Male 876 791 1,015 1,044 1,029Total Female 1,456 1,527 1,593 1,501 1,535
Total 2,332 2,318 2,608 2,545 2,564
University of Houston-Clear LakeOffice of Institutional EffectivenessTotal UHCL ReportGraduation Trends by Level & by Gender AY 2012-13 - AY 2016-17
Level of Award SexTotal Degree Count
Page: 4 10/23/2017 MLB-OIE:Graduation Trends AY 2012-13 to AY 2016-17.xlsx
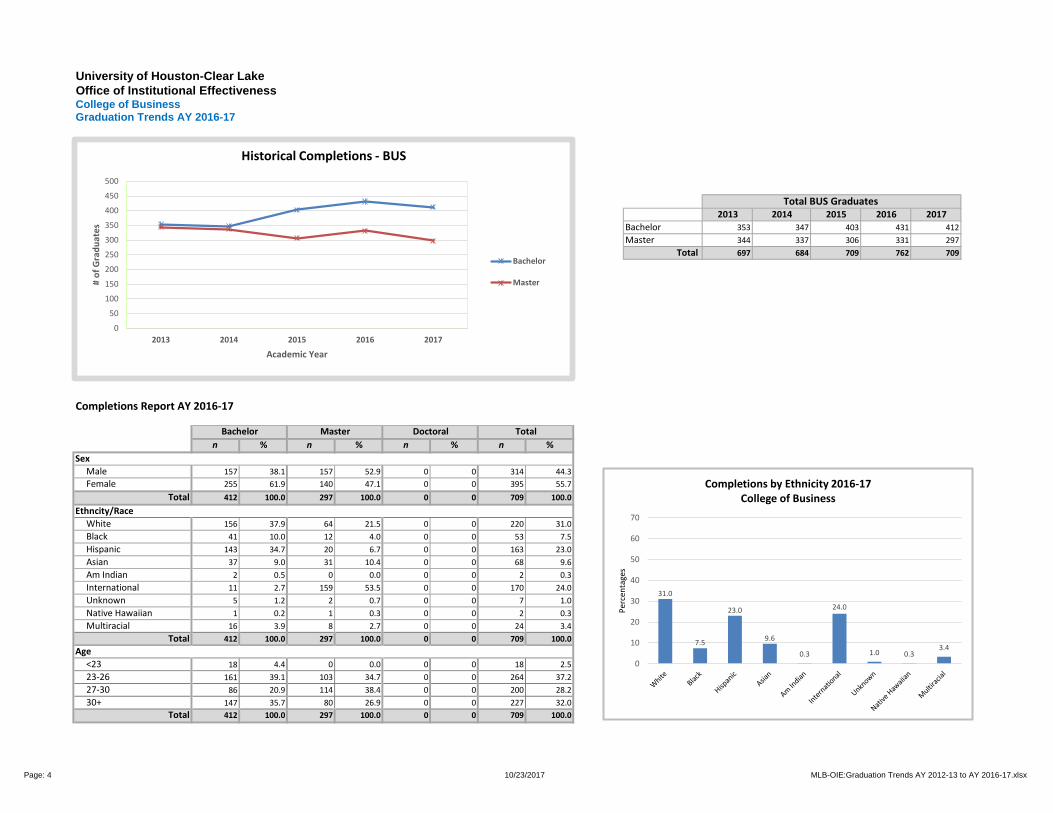
2013 2014 2015 2016 2017Bachelor 353 347 403 431 412Master 344 337 306 331 297
Total 697 684 709 762 709
n % n % n % n %
Male 157 38.1 157 52.9 0 0 314 44.3Female 255 61.9 140 47.1 0 0 395 55.7
Total 412 100.0 297 100.0 0 0 709 100.0
White 156 37.9 64 21.5 0 0 220 31.0Black 41 10.0 12 4.0 0 0 53 7.5Hispanic 143 34.7 20 6.7 0 0 163 23.0Asian 37 9.0 31 10.4 0 0 68 9.6Am Indian 2 0.5 0 0.0 0 0 2 0.3International 11 2.7 159 53.5 0 0 170 24.0Unknown 5 1.2 2 0.7 0 0 7 1.0Native Hawaiian 1 0.2 1 0.3 0 0 2 0.3Multiracial 16 3.9 8 2.7 0 0 24 3.4
Total 412 100.0 297 100.0 0 0 709 100.0
<23 18 4.4 0 0.0 0 0 18 2.523-26 161 39.1 103 34.7 0 0 264 37.227-30 86 20.9 114 38.4 0 0 200 28.230+ 147 35.7 80 26.9 0 0 227 32.0
Total 412 100.0 297 100.0 0 0 709 100.0
Sex
Ethncity/Race
Age
University of Houston-Clear LakeOffice of Institutional EffectivenessCollege of BusinessGraduation Trends AY 2016-17
Completions Report AY 2016-17
Bachelor Master Doctoral Total
Total BUS Graduates
0
50
100
150
200
250
300
350
400
450
500
2013 2014 2015 2016 2017
# of
Gra
duat
es
Academic Year
Historical Completions - BUS
Bachelor
Master
31.0
7.5
23.0
9.6
0.3
24.0
1.0 0.33.4
0
10
20
30
40
50
60
70
Perc
enta
ges
Completions by Ethnicity 2016-17College of Business

Page: 5 10/23/2017 MLB-OIE:Graduation Trends AY 2012-13 to AY 2016-17.xlsx
2012-13 2013-14 2014-15 2015-16 2016-17White 176 153 169 168 156Black 22 29 28 32 41Hispanic 104 110 134 144 143Asian 28 34 40 54 37
Bachelor Am Indian 1 1 1 0 2International 13 13 16 18 11Unknown 0 3 5 4 5Native Hawaiian 2 0 1 0 1Multiracial 7 4 9 11 16
Subtotal 353 347 403 431 412
White 125 112 88 83 64Black 15 16 17 18 12Hispanic 35 31 18 28 20Asian 51 55 39 38 31
Master Am Indian 0 0 0 0 0International 115 116 139 157 159Unknown 0 3 1 1 2Native Hawaiian 0 0 0 0 1Multiracial 3 4 4 6 8
Subtotal 344 337 306 331 297
White 301 265 257 251 220Black 37 45 45 50 53Hispanic 139 141 152 172 163Asian 79 89 79 92 68
Total Am Indian 1 1 1 0 2International 128 129 155 175 170Unknown 0 6 6 5 7Native Hawaiian 2 0 1 0 2Multiracial 10 8 13 17 24
Total 697 684 709 762 709
University of Houston-Clear LakeOffice of Institutional EffectivenessCollege of BusinessGraduation Trends by Level & by Ethnicity AY 2012-13 - AY 2016-17
Level of Award Ethnicity/RaceTotal Degree Count

Page: 6 10/23/2017 MLB-OIE:Graduation Trends AY 2012-13 to AY 2016-17.xlsx
2012-13 2013-14 2014-15 2015-16 2016-17 2012-13 2013-14 2014-15 2015-16 2016-17 2012-13 2013-14 2014-15 2015-16 2016-17Accounting BS 42 26 39 33 20 75 61 68 69 62 117 87 107 102 82Accounting BS - Pearland 0 0 3 5 0 1 7 8 4 7 1 7 11 9 7Accounting BS PB 3 2 3 5 5 5 1 2 3 3 8 3 5 8 8Accounting BS PB - Pearland 0 0 0 0 0 0 2 0 0 0 0 2 0 0 0Environmental Management BS 7 4 8 8 7 2 8 7 3 4 9 12 15 11 11Finance BS 18 19 27 21 22 8 12 5 14 14 26 31 32 35 36Finance BS Online 2 4 3 2 8 3 1 0 3 1 5 5 3 5 9Finance BS PB 0 1 0 0 0 0 2 0 1 0 0 3 0 1 0Finance BS PB - Online 0 0 0 0 0 0 0 0 2 0 0 0 0 2 0General Business BS 7 11 10 7 10 11 15 13 17 26 18 26 23 24 36General Business BS Online 1 1 5 4 4 2 3 8 8 10 3 4 13 12 14Healthcare Admin BS PB 1 1 0 0 0 2 0 1 0 0 3 1 1 0 0Healthcare Administration BS 5 9 6 8 4 26 31 32 53 40 31 40 38 61 44Healthcare Services BAS 0 2 3 3 2 4 7 6 12 10 4 9 9 15 12Legal Studies BS 3 2 4 5 8 12 12 15 12 13 15 14 19 17 21Legal Studies BS PB 26 0 0 0 0 43 0 1 0 0 69 0 1 0 0Management BS 12 23 12 21 30 7 34 55 38 35 19 57 67 59 65Management BS - Pearland 0 1 1 1 3 1 1 1 0 1 1 2 2 1 4Management BS PB 0 1 0 0 0 0 0 0 0 0 0 1 0 0 0Marketing BS 1 7 13 12 12 0 11 14 22 21 1 18 27 34 33Marketing BS PB 0 0 0 0 0 0 0 0 0 1 0 0 0 0 1Mgmt Information Systems BS 6 15 16 20 19 9 2 10 9 4 15 17 26 29 23Mgmt Information Systems BS PB 0 0 0 1 2 0 0 0 0 0 0 0 0 1 2Political Science BS 0 0 0 0 0 0 0 0 0 0 0 0 0 0 0Professional Accounting BS 2 4 1 1 1 6 4 3 4 3 8 8 4 5 4
Subtotal 136 133 154 157 157 217 214 249 274 255 353 347 403 431 412
Accounting MS 17 18 17 10 13 31 36 29 15 14 48 54 46 25 27Business Admin MBA-Online 15 15 13 13 9 16 21 9 11 13 31 36 22 24 22Business Administration MBA 54 46 43 30 33 53 41 34 23 19 107 87 77 53 52Environmental Management MS 4 3 1 6 4 3 1 4 4 1 7 4 5 10 5Finance MS 13 11 7 9 8 12 12 6 4 1 25 23 13 13 9Finance MS-Online 2 1 1 0 2 0 1 2 4 1 2 2 3 4 3Healthcare Administration MHA 12 10 9 13 7 20 17 11 19 13 32 27 20 32 20Healthcare BusAdmin MHA/MBA 20 18 9 12 5 13 21 13 16 9 33 39 22 28 14Human Resource Mgmt MA-Online 3 1 1 1 3 10 7 5 10 9 13 8 6 11 12Management Information Syst MS 26 24 52 91 72 12 25 36 35 57 38 49 88 126 129Professional Accounting MS 2 4 1 1 1 5 4 3 4 3 7 8 4 5 4
Subtotal 168 151 154 186 157 175 186 152 145 140 343 337 306 331 297
Note: Degree names followed by PB are Post-Baccalaureate degree programs only. Degree names followed by Pearland are Pearland campus programs only. Degree names followed by Online are online degree programs only.
University of Houston-Clear LakeOffice of Institutional EffectivenessCollege of BusinessGraduation Trends by Level, by Degree Type, by Gender AY 2012-13 - AY 2016-17
Level ofAward Degree Name
Male Female Total Degree Count
Bachelor
Master

Page: 7 10/23/2017 MLB-OIE:Graduation Trends AY 2012-13 to AY 2016-17.xlsx
2013 2014 2015 2016 2017Bachelor 272 280 279 245 229Master 167 171 167 116 149Doctoral 15 9 23 13 17
Total 454 460 469 374 395
n % n % n % n %
Male 12 5.2 27 18.1 3 17.6 42 10.6Female 217 94.8 122 81.9 14 82.4 353 89.4
Total 229 100.0 149 100.0 17 100.0 395 100.0
White 96 41.9 67 45.0 9 52.9 172 43.5Black 9 3.9 19 12.8 3 17.6 31 7.8Hispanic 113 49.3 46 30.9 3 17.6 162 41.0Asian 5 2.2 5 3.4 2 11.8 12 3.0Am Indian 1 0.0 1 0.0 0 0.0 2 0.0International 0 0.0 4 2.7 0 0.0 4 1.0Unknown 1 0.4 1 0.7 0 0.0 2 0.5Native Hawaiian 0 0.0 0 0.0 0 0.0 0 0.0Multiracial 4 1.7 6 4.0 0 0.0 10 2.5
Total 229 100.0 149 100.0 17 100.0 395 100.0
<23 5 2.2 0 0.0 0 0.0 5 1.323-26 93 40.6 13 8.7 0 0.0 106 26.827-30 56 24.5 31 20.8 0 0.0 87 22.030+ 75 32.8 105 70.5 17 100.0 197 49.9
Total 229 100.0 149 100.0 17 100.0 395 100.0
Total COE Graduates
Sex
Ethncity/Race
Age
University of Houston-Clear LakeOffice of Institutional EffectivenessCollege of EducationGraduation Trends AY 2016-17
Completions Report AY 2016-17
Bachelor Master Doctoral Total
0
50
100
150
200
250
300
2013 2014 2015 2016 2017
# of
Gra
duat
es
Academic Year
Historical Completions - COE
Bachelor
Master
Doctoral
43.5
7.8
41.0
3.0 0.0 1.0 0.5 0.02.5
0
10
20
30
40
50
60
70
Perc
enta
ges
Completions by Ethnicity 2016-17College of Education
Page: 8 10/23/2017 MLB-OIE:Graduation Trends AY 2012-13 to AY 2016-17.xlsx
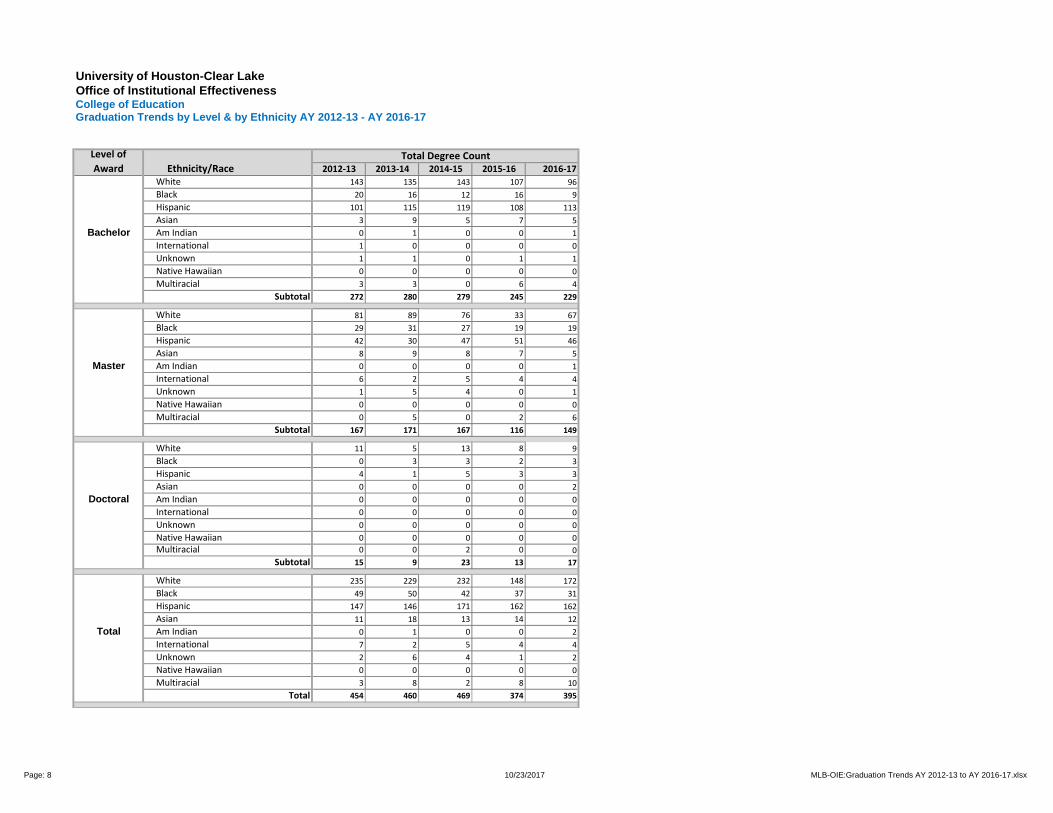
2012-13 2013-14 2014-15 2015-16 2016-17White 143 135 143 107 96Black 20 16 12 16 9Hispanic 101 115 119 108 113Asian 3 9 5 7 5
Bachelor Am Indian 0 1 0 0 1International 1 0 0 0 0Unknown 1 1 0 1 1Native Hawaiian 0 0 0 0 0Multiracial 3 3 0 6 4
Subtotal 272 280 279 245 229
White 81 89 76 33 67Black 29 31 27 19 19Hispanic 42 30 47 51 46Asian 8 9 8 7 5
Master Am Indian 0 0 0 0 1International 6 2 5 4 4Unknown 1 5 4 0 1Native Hawaiian 0 0 0 0 0Multiracial 0 5 0 2 6
Subtotal 167 171 167 116 149
White 11 5 13 8 9Black 0 3 3 2 3Hispanic 4 1 5 3 3Asian 0 0 0 0 2
Doctoral Am Indian 0 0 0 0 0International 0 0 0 0 0Unknown 0 0 0 0 0Native Hawaiian 0 0 0 0 0Multiracial 0 0 2 0 0
Subtotal 15 9 23 13 17
White 235 229 232 148 172Black 49 50 42 37 31Hispanic 147 146 171 162 162Asian 11 18 13 14 12
Total Am Indian 0 1 0 0 2International 7 2 5 4 4Unknown 2 6 4 1 2Native Hawaiian 0 0 0 0 0Multiracial 3 8 2 8 10
Total 454 460 469 374 395
University of Houston-Clear LakeOffice of Institutional EffectivenessCollege of EducationGraduation Trends by Level & by Ethnicity AY 2012-13 - AY 2016-17
Level ofAward Ethnicity/Race
Total Degree Count

Page: 9 10/23/2017 MLB-OIE:Graduation Trends AY 2012-13 to AY 2016-17.xlsx
2012-13 2013-14 2014-15 2015-16 2016-17 2012-13 2013-14 2014-15 2015-16 2016-17 2012-13 2013-14 2014-15 2015-16 2016-17EC Program Leadership BAS 0 0 0 0 0 7 4 2 3 3 7 4 2 3 3Educator of Young Children BAS 0 0 0 0 0 6 0 2 2 2 6 0 2 2 2Interdisc Studies - Pearland 0 1 1 1 0 6 15 30 22 21 6 16 31 23 21Interdisciplinary Studies BS 13 15 0 10 12 239 244 0 206 190 252 259 0 216 202Young Children w/Disabilit BAS 0 0 12 0 0 1 1 232 1 1 1 1 244 1 1
Subtotal 13 16 13 11 12 259 264 266 234 217 272 280 279 245 229
Counseling MS 5 5 5 1 0 30 32 28 31 9 35 37 33 32 9Counseling MS - Alief 0 0 2 3 0 1 6 5 4 0 1 6 7 7 0Counseling MS - Pearland 0 1 1 0 3 1 2 2 7 15 1 3 3 7 18Curriculum and Instruction MS 3 1 0 1 1 7 12 4 4 10 10 13 4 5 11Early Childhood Education MS 0 0 0 1 1 20 21 15 10 10 20 21 15 11 11Educational Management MS 3 6 6 2 8 27 16 16 18 30 30 22 22 20 38Educational Management MS-Online 0 0 0 0 1 0 0 0 1 0 0 0 0 1 1Educational Mgmt MS -Pearland 0 1 2 0 1 3 4 6 4 2 3 5 8 4 3Educational Mgmt MS-Alief ISD 6 5 4 1 5 7 9 11 3 10 13 14 15 4 15Educational Mgmt MS-Galena Park. 0 0 0 0 0 0 0 0 0 1 0 0 0 0 1Educational Mgmt MS-San Jac N. 0 1 1 1 0 0 10 2 0 2 0 11 3 1 2Educational Mgt MS-Cinco Ranch 3 0 2 1 0 10 7 4 3 0 13 7 6 4 0Instructional Tech MS - Online 2 4 4 3 1 10 11 5 2 5 12 15 9 5 6Instructional Technology MS 2 1 1 1 1 7 3 3 4 2 9 4 4 5 3Multicultural Studies in Ed MS 1 0 3 0 4 4 5 15 3 17 5 5 18 3 21Reading MS 0 0 0 1 0 7 3 0 1 2 7 3 0 2 2School Library/Info Science MS 1 1 1 0 1 7 4 19 5 7 8 5 20 5 8
Subtotal 26 26 32 16 27 141 145 135 100 122 167 171 167 116 149
Educational Leadership EdD 5 1 6 1 2 10 8 9 9 13 15 9 15 10 15Educational Leadership EdD-CR 0 0 2 0 0 0 0 6 3 1 0 0 8 3 1Educational Leadership EdD-FB 0 0 2 0 1 0 0 6 3 0 0 0 8 3 1
Subtotal 5 1 8 1 3 10 8 15 12 14 15 9 23 13 17
Bachelor
Master
Doctoral
Note: Degree names followed by PB are Post-Baccalaureate degree programs only. Degree names followed by Pearland are Pearland campus programs only. Degree names followed by Online are online degree programs only. Alief, Alvin, San Jac N, and Cinco Ranch are satellite campuses of UHCL.
University of Houston-Clear LakeOffice of Institutional EffectivenessCollege of EducationGraduation Trends by Level, by Degree Type, by Gender AY 2012-13 - AY 2016-17
Level ofAward Degree Name
Male Female Total Degree Count

Page: 10 10/23/2017 MLB-OIE:Graduation Trends AY 2012-13 to AY 2016-17.xlsx
2013 2014 2015 2016 2017Bachelor 146 146 169 184 192Master 330 305 561 574 579
Total 476 451 730 758 771
n % n % n % n %
Male 110 57.3 355 61.3 0 0 465 60.3Female 82 42.7 224 38.7 0 0 306 39.7
Total 192 100.0 579 100.0 0 0 771 100.0
White 81 42.2 31 5.4 0 0 112 14.5Black 5 2.6 10 1.7 0 0 15 1.9Hispanic 66 34.4 12 2.1 0 0 78 10.1Asian 26 13.5 15 2.6 0 0 41 5.3Am Indian 0 0.0 0 0.0 0 0 0 0.0International 5 2.6 507 87.6 0 0 512 66.4Unknown 2 1.0 0 0.0 0 0 2 0.3Native Hawaiian 1 0.5 1 0.2 0 0 2 0.3Multiracial 6 3.1 3 0.5 0 0 9 1.2
Total 192 100.0 579 100.00 0 0 771 100.0
<23 7 3.6 4 0.7 0 0 11 1.423-26 105 54.7 426 73.6 0 0 531 68.927-30 46 24.0 105 18.1 0 0 151 19.630+ 34 17.7 44 7.6 0 0 78 10.1
Total 192 100.0 579 100.0 0 0 771 100.0
Sex
Ethncity/Race
Age
University of Houston-Clear LakeOffice of Institutional EffectivenessCollege of Science and Engineering Graduation Trends AY 2016-17
Completions Report AY 2016-17
Bachelor Master Doctoral Total
Total CSE Graduates
0
100
200
300
400
500
600
700
2013 2014 2015 2016 2017
# of
Gra
duat
es
Academic Year
Historical Completions - CSE
Master
Bachelor
14.5
1.9
10.15.3
0.0
66.4
0.3 0.3 1.20
10
20
30
40
50
60
70
Perc
enta
ges
Completions by Ethnicity 2016-17College of Science and Engineering

Page: 11 10/23/2017 MLB-OIE:Graduation Trends AY 2012-13 to AY 2016-17.xlsx
2012-13 2013-14 2014-15 2015-16 2016-17White 75 75 78 94 81Black 7 5 8 14 5Hispanic 35 42 47 39 66Asian 15 10 25 22 26
Bachelor Am Indian 1 2 1 1 0International 9 5 5 8 5Unknown 0 2 1 2 2Native Hawaiian 0 0 2 0 1Multiracial 4 5 2 4 6
Subtotal 146 146 169 184 192
White 55 40 37 38 31Black 10 16 15 5 10Hispanic 4 13 10 11 12Asian 19 10 9 12 15
Master Am Indian 0 0 0 0 0International 242 222 487 507 507Unknown 0 1 1 0 0Native Hawaiian 0 0 0 0 1Multiracial 0 3 2 1 3
Subtotal 330 305 561 574 579
White 130 115 115 132 112
Black 17 21 23 19 15Hispanic 39 55 57 50 78Asian 34 20 34 34 41
Total Am Indian 1 2 1 1 0International 251 227 492 515 512Unknown 0 3 2 2 2Native Hawaiian 0 0 2 0 2Multiracial 4 8 4 5 9
Total 476 451 730 758 771
University of Houston-Clear LakeOffice of Institutional EffectivenessCollege of Science and Engineering Graduation Trends by Level & by Ethnicity AY 2012-13 - AY 2016-17
Level ofAward Ethnicity/Race
Total Degree Count

Page: 12 10/23/2017 MLB-OIE:Graduation Trends AY 2012-13 to AY 2016-17.xlsx
2012-13 2013-14 2014-15 2015-16 2016-17 2012-13 2013-14 2014-15 2015-16 2016-17 2012-13 2013-14 2014-15 2015-16 2016-17Biol BA with 7-12 Life Science 0 0 1 4 2 0 0 2 4 4 0 0 3 8 6Biol BA with 8-12 Life Science 0 1 0 0 0 6 1 1 0 0 6 2 1 0 0Biological Sciences BA 1 2 3 3 0 6 8 9 1 2 7 10 12 4 2Biological Sciences BS 8 13 10 15 14 28 15 26 19 37 36 28 36 34 51Biological Sciences BS PB 0 0 1 0 0 0 0 1 0 0 0 0 2 0 0Chemistry BA 1 0 1 0 0 1 2 0 0 0 2 2 1 0 0Chemistry BS 2 2 1 3 4 2 3 3 5 2 4 5 4 8 6Chemistry BS PB 0 0 0 0 0 0 0 0 0 0 0 0 0 0 0Computer Engineering BS 6 7 15 20 19 1 2 5 3 5 7 9 20 23 24Computer Engineering BS PB 0 1 0 0 2 0 0 0 0 1 0 1 0 0 3Computer Information System BS 13 8 18 12 6 3 4 1 0 0 16 12 19 12 6Computer Science BS 11 10 12 24 21 1 1 1 5 4 12 11 13 29 25Computer Science BS PB 1 0 0 0 2 0 0 0 3 0 1 0 0 3 2Environmental Science BS 3 6 7 8 10 9 11 7 15 9 12 17 14 23 19Environmental Science BS PB 0 0 3 0 1 0 0 0 0 0 0 0 3 0 1Information Technology BAS 6 17 11 5 12 0 6 7 1 2 6 23 18 6 14Information Technology BAS PB 0 0 1 1 0 0 0 0 0 0 0 0 1 1 0Information Technology BAS-Pearland 0 0 0 1 0 0 0 0 0 0 0 0 0 1 0Math BA with 4-8 Mathematics 0 2 0 1 2 2 3 0 1 2 2 5 0 2 4Math BA with 7-12 Mathematics 0 0 0 2 0 0 0 0 3 1 0 0 0 5 1Math BA with 8-12 Mathematics 1 0 0 0 0 2 1 1 0 0 3 1 1 0 0Math BS with 7-12 Mathematics 0 0 0 0 0 0 0 3 1 1 0 0 3 1 1Math BS with 8-12 Mathematics 1 0 0 0 0 1 1 2 0 0 2 1 2 0 0Mathematical Science BA 6 2 1 0 2 7 2 1 0 1 13 4 2 0 3Mathematical Science BA PB 0 0 0 0 0 1 0 1 0 0 1 0 1 0 0Mathematical Science BS 8 4 2 9 7 3 6 3 6 11 11 10 5 15 18Physics BS 5 5 7 9 6 0 0 0 0 0 5 5 7 9 6Physics PB 0 0 1 0 0 0 0 0 0 0 0 0 1 0 0
Subtotal 73 80 95 117 110 73 66 74 67 82 146 146 169 184 192
University of Houston-Clear LakeOffice of Institutional EffectivenessCollege of Science and Engineering Graduation Trends by Level, by Degree Type, by Gender AY 2012-13 - AY 2016-17
Level ofAward Degree Name
Male Female Total Degree Count
Bachelor

Page: 13 10/23/2017 MLB-OIE:Graduation Trends AY 2012-13 to AY 2016-17.xlsx
2012-13 2013-14 2014-15 2015-16 2016-17 2012-13 2013-14 2013-14 2015-16 2016-17 2012-13 2013-14 2014-15 2015-16 2016-17Level ofAward Degree Name
Male Female Total Degree Count
Biological Sciences MS 10 3 6 7 4 13 12 15 7 10 23 15 21 14 14Biotechnology MS 17 6 8 9 10 23 14 25 17 10 40 20 33 26 20Chemistry MS 3 12 16 8 4 9 13 10 11 5 12 25 26 19 9Computer Engineering MS 35 23 82 79 103 8 13 37 21 38 43 36 119 100 141Computer Information System MS 3 2 5 9 7 2 3 2 1 5 5 5 7 10 12Computer Science MS 82 40 75 55 54 21 31 46 40 59 103 71 121 95 113Engineering Management MS 17 21 18 51 55 3 10 9 28 28 20 31 27 79 83Engineering Mgmt MS-Online 1 4 0 1 4 0 2 2 0 2 1 6 2 1 6Environmental Science MS-Online 2 1 1 5 3 0 1 1 4 2 2 2 2 9 5Environmental Science MS 10 13 4 8 7 12 15 12 9 9 22 28 16 17 16Mathematical Science MS 2 3 4 1 1 1 2 3 0 2 3 5 7 1 3Physics MS 2 1 3 2 3 1 2 0 3 1 3 3 3 5 4Software Engineering MS 27 30 112 123 85 10 8 48 56 46 37 38 160 179 131Software Engineering MS-Online 6 5 4 0 0 0 0 1 1 0 6 5 5 1 0Statistics MS 1 3 2 4 5 1 3 2 5 3 2 6 4 9 8Systems Engineering MS 6 7 5 6 10 2 2 3 3 4 8 9 8 9 14
Subtotal 224 174 345 368 355 106 131 216 206 224 330 305 561 574 579
Note: Degree names followed by PB are Post-Baccalaureate degree programs only. Degree names followed by Pearland are Pearland campus programs only. Degree names followed by Online are online degree programs only.
Master
Page: 14 10/23/2017 MLB-OIE:Graduation Trends AY 2012-13 to AY 2016-17.xlsx
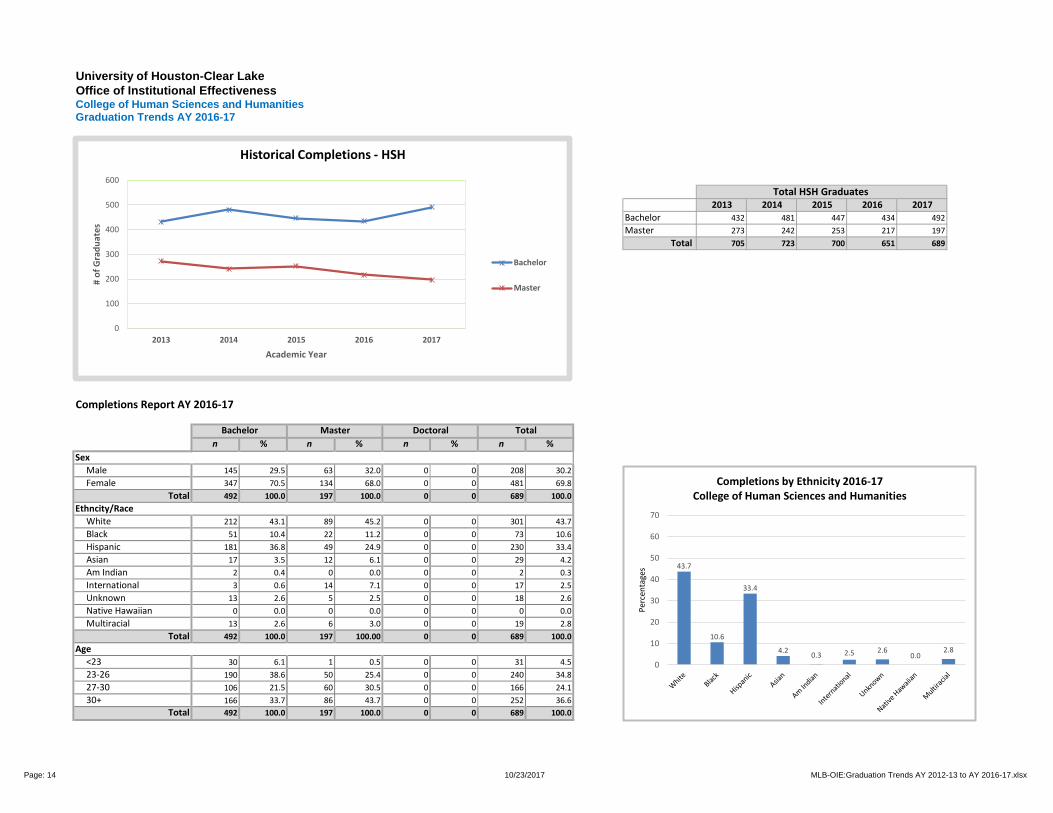
2013 2014 2015 2016 2017Bachelor 432 481 447 434 492Master 273 242 253 217 197
Total 705 723 700 651 689
n % n % n % n %
Male 145 29.5 63 32.0 0 0 208 30.2Female 347 70.5 134 68.0 0 0 481 69.8
Total 492 100.0 197 100.0 0 0 689 100.0
White 212 43.1 89 45.2 0 0 301 43.7Black 51 10.4 22 11.2 0 0 73 10.6Hispanic 181 36.8 49 24.9 0 0 230 33.4Asian 17 3.5 12 6.1 0 0 29 4.2Am Indian 2 0.4 0 0.0 0 0 2 0.3International 3 0.6 14 7.1 0 0 17 2.5Unknown 13 2.6 5 2.5 0 0 18 2.6Native Hawaiian 0 0.0 0 0.0 0 0 0 0.0Multiracial 13 2.6 6 3.0 0 0 19 2.8
Total 492 100.0 197 100.00 0 0 689 100.0
<23 30 6.1 1 0.5 0 0 31 4.523-26 190 38.6 50 25.4 0 0 240 34.827-30 106 21.5 60 30.5 0 0 166 24.130+ 166 33.7 86 43.7 0 0 252 36.6
Total 492 100.0 197 100.0 0 0 689 100.0
Sex
Ethncity/Race
Age
University of Houston-Clear LakeOffice of Institutional EffectivenessCollege of Human Sciences and Humanities Graduation Trends AY 2016-17
Completions Report AY 2016-17
Bachelor Master Doctoral Total
Total HSH Graduates
0
100
200
300
400
500
600
2013 2014 2015 2016 2017
# of
Gra
duat
es
Academic Year
Historical Completions - HSH
Bachelor
Master
43.7
10.6
33.4
4.2 0.3 2.5 2.60.0
2.8
0
10
20
30
40
50
60
70
Perc
enta
ges
Completions by Ethnicity 2016-17College of Human Sciences and Humanities
Page: 15 10/23/2017 MLB-OIE:Graduation Trends AY 2012-13 to AY 2016-17.xlsx
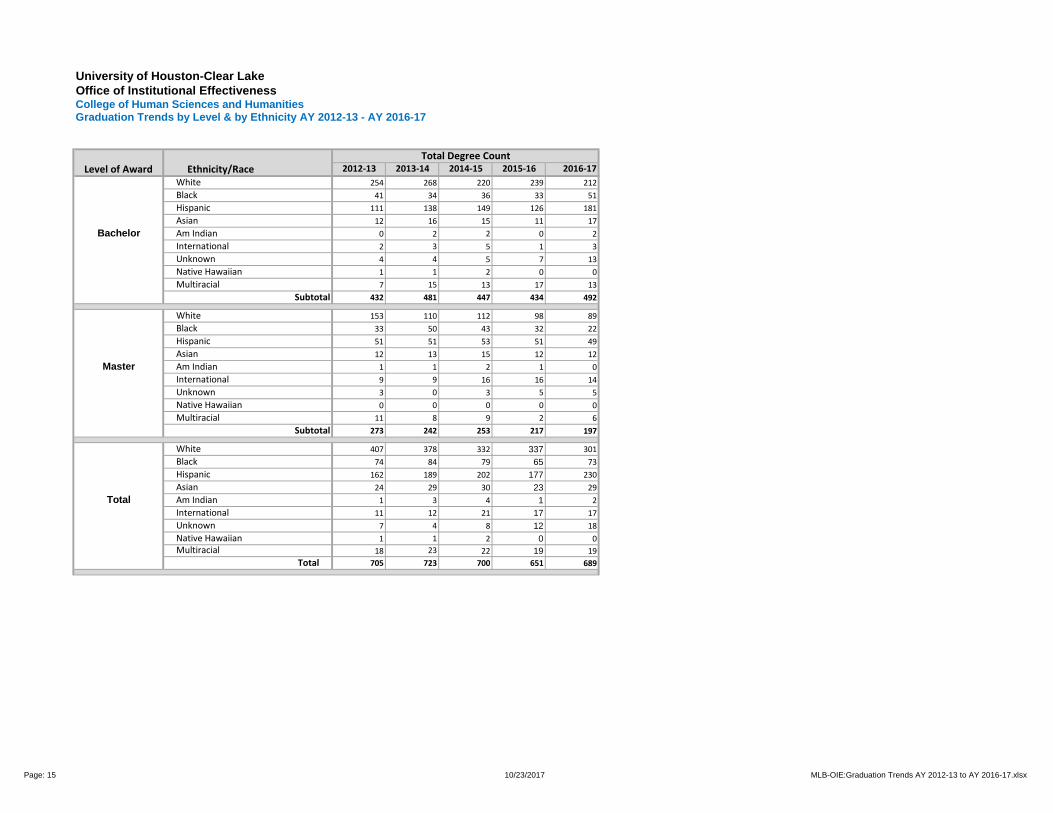
2012-13 2013-14 2014-15 2015-16 2016-17White 254 268 220 239 212Black 41 34 36 33 51Hispanic 111 138 149 126 181Asian 12 16 15 11 17
Bachelor Am Indian 0 2 2 0 2International 2 3 5 1 3Unknown 4 4 5 7 13Native Hawaiian 1 1 2 0 0Multiracial 7 15 13 17 13
Subtotal 432 481 447 434 492
White 153 110 112 98 89Black 33 50 43 32 22Hispanic 51 51 53 51 49Asian 12 13 15 12 12
Master Am Indian 1 1 2 1 0International 9 9 16 16 14Unknown 3 0 3 5 5Native Hawaiian 0 0 0 0 0Multiracial 11 8 9 2 6
Subtotal 273 242 253 217 197
White 407 378 332 337 301Black 74 84 79 65 73Hispanic 162 189 202 177 230Asian 24 29 30 23 29
Total Am Indian 1 3 4 1 2International 11 12 21 17 17Unknown 7 4 8 12 18Native Hawaiian 1 1 2 0 0Multiracial 18 23 22 19 19
Total 705 723 700 651 689
University of Houston-Clear LakeOffice of Institutional EffectivenessCollege of Human Sciences and Humanities Graduation Trends by Level & by Ethnicity AY 2012-13 - AY 2016-17
Level of Award Ethnicity/RaceTotal Degree Count

Page: 16 10/23/2017 MLB-OIE:Graduation Trends AY 2012-13 to AY 2016-17.xlsx
2012-13 2013-14 2014-15 2015-16 2016-17 2012-13 2013-14 2014-15 2015-16 2016-17 2012-13 2013-14 2014-15 2015-16 2016-17Anthropology BS 4 3 1 0 1 8 12 9 7 3 12 15 10 7 4Anthropology BS PB 0 0 0 0 0 0 0 0 1 0 0 0 0 1 0Art and Design BFA 9 12 7 9 6 22 26 18 19 22 31 38 25 28 28Art and Design BFA PB 0 0 1 1 0 0 0 1 0 0 0 0 2 1 0Art and Design BFA/Art EC-12 0 0 2 0 0 3 4 5 5 10 3 4 7 5 10Behavioral Science BS 13 11 8 10 14 12 8 16 12 19 25 19 24 22 33Behavioral Science BS PB 1 0 0 0 0 0 0 0 0 0 1 0 0 0 0Behavioral Science BS-Pearland 0 0 0 0 0 1 2 3 3 3 1 2 3 3 3Communication BA 12 12 10 8 15 12 18 21 20 30 24 30 31 28 45Communication BA PB 1 0 0 0 0 0 0 0 0 0 1 0 0 0 0Criminology BS 9 10 13 9 18 19 15 20 18 22 28 25 33 27 40Criminology BS - Online 0 2 1 2 0 0 4 2 3 0 0 6 3 5 0Criminology BS - Pearland 1 1 1 3 1 0 4 3 3 4 1 5 4 6 5Fitness & Human Perform BS PB 0 0 0 0 0 1 0 0 0 0 1 0 0 0 0Fitness & Human Performance BS 25 27 26 16 30 36 46 34 32 33 61 73 60 48 63Geography BS 7-12 SocStudies 0 0 0 0 0 0 1 0 0 0 0 1 0 0 0Geography BS 8-12 SocStudies 0 0 1 0 0 0 0 0 0 0 0 0 1 0 0Geography BS 2 2 2 3 6 4 5 0 3 3 6 7 2 6 9History BA 26 16 8 15 18 15 14 16 17 12 41 30 24 32 30History BA 7-12 Soc Studies 0 1 11 2 3 0 0 1 2 2 0 1 12 4 5Historty BA 7-12 Hist Cert 0 0 0 1 0 0 0 0 2 2 0 0 0 1 2History BA 8-12 Soc Studies 3 7 2 0 0 5 7 2 0 0 8 14 4 0 0History BA with 8-12 Hist Cert 1 0 1 0 0 0 0 0 0 0 1 0 1 0 0Humanities BA 5 6 4 4 1 19 11 14 5 3 24 17 18 9 4Literature BA 3 2 6 5 9 13 17 15 17 8 16 19 21 22 17Literature BA PB 0 0 0 0 0 0 0 0 1 0 0 0 0 1 0Litr BA 4-8 Eng Lang Arts/Read 0 0 1 0 0 1 3 1 0 0 1 3 2 0 0Litr BA 7-12 Engl Lang Arts 0 0 3 0 1 0 0 1 8 4 0 0 4 8 5Litr BA 8-12 Engl Lang Arts 2 1 0 0 0 6 6 2 0 0 8 7 2 0 0Nursing BSN-Pearland 0 0 0 0 3 0 0 0 5 14 0 0 0 5 17Nursing BSN-Pearland PB 0 0 0 0 0 0 0 0 0 2 0 0 0 0 2Political Science BS 2 0 1 0 0 3 1 0 1 0 5 1 1 1 0Psychology BS 11 13 17 19 14 59 74 54 60 111 70 87 71 79 125Psychology BS - Pearland 0 1 1 1 0 6 9 15 16 7 6 10 16 17 7Psychology BS PB 0 0 0 0 0 0 1 0 0 0 0 1 0 0 0Psychology BS PB - Pearland 0 1 0 0 0 0 0 0 1 0 0 1 0 1 0Psychology BS-Online 0 0 3 0 0 4 9 16 13 0 4 9 19 13 0Psychology BS-Sugar Land 2 2 2 1 0 14 9 12 6 2 16 11 14 7 2Public Service Leadership BS 2 7 1 0 2 2 3 1 3 2 4 10 2 3 4Public Srvc Leadership-Online 0 2 4 1 1 0 1 1 4 0 0 3 5 5 1Social Work BSW 1 0 0 2 1 12 12 18 20 14 13 12 18 22 15Sociology BS 5 4 0 6 1 14 14 5 10 13 19 18 5 16 14Women's Studies BA 0 0 0 0 0 1 2 3 1 1 1 2 3 1 1Women's Studies BA PB 0 0 0 0 0 0 0 0 1 1 0 0 0 0 1
Subtotal 140 143 138 118 145 292 338 309 316 347 432 481 447 434 492
University of Houston-Clear LakeOffice of Institutional EffectivenessCollege of Human Sciences and Humanities Graduation Trends by Level, by Degree Type, by Gender AY 2012-13 - AY 2016-17
Level ofAward Degree Name
Male Female Total Degree Count
Bachelor

Page: 17 10/23/2017 MLB-OIE:Graduation Trends AY 2012-13 to AY 2016-17.xlsx
2012-13 2013-14 2014-15 2015-16 2016-17 2012-13 2013-14 2014-15 2015-16 2016-17 2012-13 2013-14 2014-15 2015-16 2016-17Level ofAward Degree Name
Male Female Total Degree Count
Behavior Analysis MA 1 1 1 0 1 7 8 5 10 8 8 9 6 10 9Behavioral Science MA 2 0 0 1 0 6 7 1 3 1 8 7 1 4 1Behavioral Science MA-Pearland 0 0 0 0 0 0 0 2 0 0 0 0 2 0 0Clinical Psychology MA 9 3 4 1 1 14 16 11 17 12 23 19 15 18 13Criminology MA 3 5 4 6 3 16 8 13 10 6 19 13 17 16 9Criminology MA - Pearland 2 0 2 1 0 4 6 3 3 3 6 6 5 4 3Cross-Cultural Studies MA 4 1 2 1 2 10 7 9 3 6 14 8 11 4 8Digital Media Studies - MA 13 9 5 4 10 16 13 14 16 12 29 22 19 20 22Exercise and Health Science MS 15 10 12 9 15 8 9 4 9 10 23 19 16 18 25Family Therapy MA 2 4 1 1 0 24 15 12 9 7 26 19 13 10 7History MA 7 7 7 8 2 1 4 8 1 2 8 11 15 9 4Humanities MA 15 6 11 5 8 8 11 8 5 2 23 17 19 10 10Indust/Organizational Psy MA 4 5 11 13 4 12 20 27 19 10 16 25 38 32 14Literature MA 10 8 3 3 5 15 13 5 6 4 25 21 8 9 9Psychology MA 1 5 8 10 9 19 12 26 21 26 20 17 34 31 35Psychology MA - Pearland 0 0 0 1 0 2 1 2 2 3 2 1 2 3 3Psychology MA - Sugar Land 1 0 1 0 0 5 2 6 0 1 6 2 7 0 1School Psychology SSP 1 1 0 1 1 11 11 10 11 8 12 12 10 12 9Sociology MA 0 2 4 5 2 5 12 11 2 13 5 14 15 7 15
Subtotal 90 67 76 70 63 183 175 177 147 134 273 242 253 217 197
Note: Degree names followed by PB are Post-Baccalaureate degree programs only. Degree names followed by Pearland are Pearland campus programs only. Degree names followed by Online are online degree programs only. Cape Center and Sugar Land are satellite campuses of UHCL.
Master