graduate students, negative perfectionism, perceived
TRANSCRIPT
GRADUATE STUDENTS, NEGATIVE PERFECTIONISM, PERCEIVED STRESS,
AND DISORDERED EATING BEHAVIORS
Except where reference is made to the work of others, the work described in this dissertation is my own or was done in collaboration with my advisory committee. This
dissertation does not include proprietary or classified information.
________________________________________________ Carmilya A. Wilson
Certificate of Approval:
______________________________ ______________________________ Jamie S. Carney Randolph B. Pipes, Chair Professor Professor Special Education, Rehabilitation Special Education, Rehabilitation and Counseling/School Psychology and Counseling/School Psychology ______________________________ ______________________________ Annette S. Kluck George T. Flowers Assistant Professor Dean Special Education, Rehabilitation Graduate School and Counseling/School Psychology
GRADUATE STUDENTS, NEGATIVE PERFECTIONISM, PERCEIVED STRESS,
AND DISORDERED EATING BEHAVIORS
Carmilya Wilson
A Dissertation
Submitted to
the Graduate Faculty of
Auburn University
in Partial Fulfillment of the
Requirements for the
Degree of
Doctor of Philosophy
Auburn, Alabama May 09, 2009
iii
GRADUATE STUDENTS, NEGATIVE PERFECTIONISM, PERCEIVED STRESS,
AND DISORDERED EATING BEHAVIORS
Carmilya A. Wilson
Permission is granted to Auburn University to make copies of this dissertation at its discretion, upon request of individuals or institutions and at their expense. The author
reserves all publication rights.
___________________________________ Signature of Author
___________________________________
Date of Graduation
iv
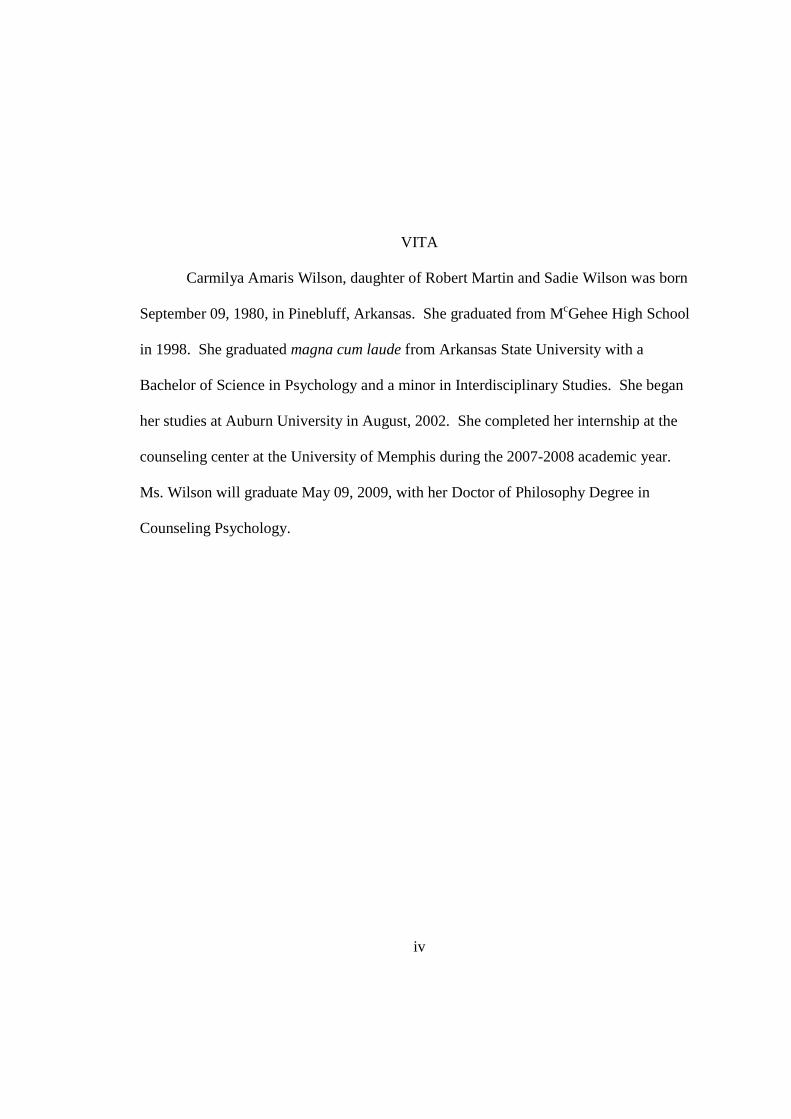
VITA
Carmilya Amaris Wilson, daughter of Robert Martin and Sadie Wilson was born
September 09, 1980, in Pinebluff, Arkansas. She graduated from McGehee High School
in 1998. She graduated magna cum laude from Arkansas State University with a
Bachelor of Science in Psychology and a minor in Interdisciplinary Studies. She began
her studies at Auburn University in August, 2002. She completed her internship at the
counseling center at the University of Memphis during the 2007-2008 academic year.
Ms. Wilson will graduate May 09, 2009, with her Doctor of Philosophy Degree in
Counseling Psychology.
v
GRADUATE STUDENTS, NEGATIVE PERFECTIONISM, PERCEIVED STRESS, &
DISORDERED EATING BEHAVIORS
Carmilya Amaris Wilson
Doctor of Philosophy, May 09, 2009 (B.S., Arkansas State University, 2002)
124 Typed Pages
Directed by Randolph B. Pipes
Much of the literature on Disordered Eating Behaviors has examined their
relationship with different risk factors. Among those factors examined have been
perfectionism and stress. One form of perfectionism, Negative Perfectionism, involves
the discrepancy or failure to meet high standards and order. There is also support for the
relationship between Disordered Eating Behavior and Perceived Stress. One population
presumably affected by Negative Perfectionism and Perceived Stress is graduate students.
Yet, many of the existing studies on Disordered Eating Behaviors have either focused on
or made primary use of individuals at the undergraduate-level and have neglected
graduate student populations. Thus, the current study examined Disordered Eating
vi
Patterns within the graduate population, specifically focusing on Perceived Stress and
Negative Perfectionism.
Participants were 108 female, graduate-level students, from two southern
universities. The current study proposed that Negative Perfectionism, as measured by the
Discrepancy Subscale of the Almost Perfect Scale-Revised (APS-R), would account for
significant variation in Disordered Eating Behaviors, as measured by the three subscales
(Uncontrolled Eating-UE, Cognitive Restraint-CR, and Emotional Eating-EE) of the
Three-Factor Eating Questionnaire (TFEQ-R21), above and beyond variance accounted
for by Perceived Stress, As measured by the Perceived Stress Scale (PSS-10). Also, the
current study proposed that the PSS-10 would account for significant variation in
Disordered Eating Behaviors, as measured by the three subscales (UE, CR, and EE) of
the TFEQ-R21, above and beyond variance accounted for by Negative Perfectionism, as
measured by the Discrepancy Subscale of the APS-R. Scores on the Discrepancy
Subscale accounted for a significant amount of variance on the CR and EE Subscales,
above and beyond the variance accounted for by scores on the PSS-10, but not on the UE
Subscale. Scores on the PSS-10 predicted a significant amount of variance on the UE
and EE Subscales, above and beyond the variance accounted for by the Discrepancy
Subscale, but not on the CR Subscale.
vii
ACKNOWLEDGMENTS
The author would like to thank all individuals who have been involved in her
success. This includes, but is not limited to the staff at the University of Memphis
(CCLT), the Pastoral Institute, CAVHS in Tuskegee, Greater Peace, All People
Fellowship, her friends (i.e., Alycia Adams, Sharell Cannady, Krystal Smith, Carla
Tyner, Chris Carden, Elena Petrova, Auburn cohort, and fellow interns), Alberta Harris,
Elaine Jordan, Jocelyn Vickers, and Mary Diamond. Also, thanks to Thomandra Sam
and Teresa Blevins for their assistance with data collection. In addition, she would like
to thank the current and former staff and support staff (i.e., Sherry Boothe, Nancy Evans,
etc.) within the Special Education, Rehabilitation, and Counseling/School Psychology
Department. She would like to particularly thank Dr. Stadler. She is grateful to her
committee members and feels that she could not have asked for a better committee. She
would like to give a special thanks to Dr. Pipes who has served as both a mentor and role
model and whose promise to “hood” her, gave her renewed determination. Finally, she
would like to thank her family and significant other, Albert Rogers, who have been
beyond patient and supportive. She would like to offer another special thanks to her
parents, particularly her mom who made this all possible through birth, great devotion,
exceptional upbringing, encouragement, and example of how to “walk by faith”. She
would like anyone who has supported her in any kind of way to know that this is
dedicated to them as well, although their names might not be included here.
viii
This dissertation study was prepared in accordance with the Publication Manual of the
American Psychological Association, Fifth Edition (2001).
This dissertation manuscript was prepared using Microsoft Office Word, 2007 Edition.
The data analysis for this dissertation study was conducted through the use of SPSS 15.0,
Graduate Student Version.
x
TABLE OF CONTENTS
INTRODUCTION..................................................................................................................1
LITERATURE REVIEW.........................................................................................................4
FACTORS RELATED TO DISORDERED EATING BEHAVIORS...............................................6
AGE...........................................................................................................................7
ETHNICITY AND CULTURE..........................................................................................7
GENDER...................................................................................................................11
PEER, FAMILY , AND MEDIA INFLUENCE....................................................................14
EMOTIONAL AND PHYSIOLOGICAL FACTORS............................................................15
PSYCHOPATHOLOGY................................................................................................17
PERFECTIONISM, STRESS, AND DISORDERED EATING BEHAVIORS................................19
PERFECTIONISM.......................................................................................................19
STRESS....................................................................................................................24
RATIONALE FOR THE STUDY OF GRADUATE STUDENTS.................................................28
AUTONOMY AND COMPETITIVENESS.......................................................................28
INTRINSIC MOTIVATION AND INTERNAL LOCUS OF CONTROL...................................29
GRADUATE STUDENTS, STRESS, AND PERFECTIONISM..................................................29
HYPOTHESES................................................................................................................33
METHOD..........................................................................................................................35
PARTICIPANTS.............................................................................................................35
x
PROCEDURE.................................................................................................................36
INSTRUMENTS.............................................................................................................39
TFEQ-R21 ........................................................................................................39
APS-R ..............................................................................................................41
PSS-10 .............................................................................................................43
RESULTS..........................................................................................................................46
DETERMINING EFFECT SIZE AND POWER......................................................................46
PRELIMINARY PROCEDURES AND MULTIPLE REGRESSION ...........................................47
HYPOTHESES 1A AND1B ..............................................................................................53
RESULTS OF ANALYSIS OF HYPOTHESES 1A AND 1B .....................................................53
HYPOTHESES 2A AND 2B..............................................................................................54
RESULTS OF ANALYSIS OF HYPOTHESES 2A AND 2B .....................................................54
HYPOTHESES 3A AND 3B..............................................................................................55
RESULTS OF ANALYSIS OF HYPOTHESES 3A AND 3B ....................................................55
SUPPLEMENTARY ANALYSIS........................................................................................56
DISCUSSION.....................................................................................................................57
REVIEW OF FINDINGS...................................................................................................57
LIMITATIONS ...............................................................................................................60
SUMMARY ...................................................................................................................62
IMPLICATIONS .................................................................................................................63
REFERENCES....................................................................................................................65
APPENDICES....................................................................................................................83
xi
A. DEMOGRAPHICS FORM.............................................................................................83
B.THREE-FACTOR EATING QUESTIONNAIRE-R21 ..........................................................85
C. ALMOST PERFECT SCALE-REVISED...........................................................................88
D. PERCEIVED STRESS SCALE.......................................................................................91
E. INFORMATION SHEET...............................................................................................93
F. EXAMPLE OF EMAIL TO INSTRUCTORS......................................................................96
G. SCRIPT.....................................................................................................................98
H. LIST OF AUBURN MENTAL HEALTH PROVIDERS......................................................100
I. LIST OF MEMPHIS MENTAL HEALTH PROVIDERS......................................................102
J. PERMISSION TO USE THE THREE-FACTOR EATING QUESTIONNAIRE-R21..................104
K.PERMISSION TO USE THE ALMOST PERFECT SCALE-REVISED...................................107
L.PERMISSION TO USE THE PERCEIVED STRESS SCALE-10 ...........................................110
xii
LIST OF TABLES
TABLE 1: DEPARTMENTS..................................................................................................38
TABLE 2: MEANS AND STANDARD DEVIATIONS................................................................49
TABLE 3: INTERCORRELATION TABLE OF INDEPENDENT AND DEPENDENT VARIABLES.....49
TABLE 4: HIERARCHICAL REGRESSION ANALYSIS: NEGATIVE PERFECTIONISM AND
PERCEIVED STRESS PREDICTING UNCONTROLLED EATING SCORES...................50
TABLE 5: HIERARCHICAL REGRESSION ANALYSIS: NEGATIVE PERFECTIONISM AND
PERCEIVED STRESS PREDICTING COGNITIVE RESTRAINT SCORES......................51
TABLE 6: HIERARCHICAL REGRESSION ANALYSIS: NEGATIVE PERFECTIONISM AND
PERCEIVED STRESS PREDICTING EMOTIONAL EATING SCORES..........................52
1
INTRODUCTION
Disordered Eating Behaviors present a pervasive problem. The problem is
becoming larger as its prevalence is increasing (Matthews, 2001). Disordered Eating
Behaviors have been linked to an increase in drug usage, misconduct, unhealthy sexual
behaviors, and suicidal attempts (Matthews). In addition to its link to risky behaviors,
Disordered Eating Behaviors can cause substantial physiological damage that at times
can be fatal. Disordered Eating Behaviors typically affect electrolytes, the cardiovascular
system, the gastrointestinal system, the endocrinal system, and the central nervous system
(Robert-McComb, 2001).
Given that Disordered Eating Behaviors present such a great concern and danger,
there is an increased need for more research, which is crucial to prevention and
intervention. The existing literature has investigated the relationship between Disordered
Eating Behaviors and many factors (e.g., age, ethnicity, gender, and psychopathology).
Included among those factors that have been examined are stress and perfectionism
(Harrington, Crowther, Payne Henrickson, & Mickelson, 2006; Sassaroli et al., 2008).
For example, individuals who reported experiencing high amounts of stress were more
likely to engage in disturbed eating practices than individuals who did not. Crowther,
Sanftner, Bonifazi, and Shepherd (2001) found that stressed individuals were more likely
to exhibit disordered eating and to increase their caloric intake. Also, women with eating
disorders perceive their lives to be more stressful than women without eating disorders
2
and believe that they are less capable of handling great amounts of stress (Denisoff &
Endler, 2000; Harrington et al., 2006).
Perfectionism has also been connected to Disordered Eating Behaviors. For
example, underweight women with Anorexia, when compared to women with Anorexia
with their weight restored, obtained higher scores on measurements of perfectionism
(Bastiani, Rao, Wetlzin, & Kaye, 1995). Furthermore high levels of perfectionism have
been associated with Anorexia (Polivy & Herman, 2002). Schwarz, Gairrett, Aruguete,
and Gold (2005) believe that perfectionism is a main feature of individuals with
Disordered Eating Behaviors. Some individuals believe that the disagreement among
researchers regarding the importance of perfectionism stems from the failure to
differentiate between the different types of perfectionism. These researchers distinguish
between positive perfectionism, or the possession of high standards and order, and
between Negative Perfectionism, or the inability to meet those high standards and order
(Slaney, Rice, Mobley, Trippi, & Ashby, 2001). These researchers have found that there
is a positive relationship between Negative Perfectionism and Disordered Eating
Behaviors (Davis, 1997).
Many of the studies on Disordered Eating Behaviors have looked at such
behaviors among adolescents and undergraduates and have not looked at these behaviors
among graduate students. If there are differences between graduate students and
undergraduates, this would raise the question of whether these are two different
populations. If they are indeed different populations, it would be logical to extend the
existing research on Disordered Eating Behaviors to the graduate student population. In
3
fact, graduate students have been described as more autonomous, competitive,
intrinsically-motivated, and as more likely to possess an internal locus of control
(Gardner, 2008; Nordstrom & Segrist, 2009; Vidler & Wood 1981). Graduate school
requires that an individual be more proactive and independent. Graduate students
typically are solely responsible for many decisions that affect their personal and
professional lives, such as courses taken and the management of a household (Fischer &
Zigmond, 1998).
Thus, it appears that there are differences between graduate students and
undergraduates which indicate that it might be worthwhile to examine Disordered Eating
Patterns among graduate students, and there is evidence that Perceived Stress and
Negative Perfectionism may contribute to Disordered Eating in general. Furthermore, it
seems plausible to argue that stress (whether due to the demands of conducting research,
increasing responsibilities, multiple roles as a graduate student, etc.) and perfectionism
(whether due to self selection, activated by increased competitiveness with other high
achieving students, etc.) are likely present in the lives of many graduate students. Hence,
the current study examines the relationship between Disordered Eating Behaviors and
Perceived Stress and Negative Perfectionism within the graduate student population.
4
LITERATURE REVIEW
There are two major types of eating disorders—Anorexia Nervosa and Bulimia Nervosa,
according to the Diagnostic and Statistical Manual of Mental Disorders (DSM-4th edition-
Text Revised) (American Psychiatric Association [APA], 2000). Individuals who do not
meet the diagnostic requirements of the aforementioned eating disorders may fall into a
third category of eating disorders known as an Eating Disorder Not Otherwise Specified
(EDNOS) (APA). Some, who support the eating disorder continuum model, believe that
eating disturbances occur on a continuum, with normal eating-related behaviors on one
end, and Disordered Eating Behavior on the other (Gleaves, Brown, & Warren, 2004;
Scarano & Kalodner-Martin, 1994; Williamson, Gleaves, & Stewart, 2005). Many of
these proponents further believe that there are dimensions, based on symptoms, on which
these disturbances occur (Gleaves et al.; Williamson et al.). For example, eating
disturbances might vary by severity of symptoms on dimensions of binge eating, fear of
fatness/compensatory behaviors, and drive for thinness (Williamson et al., 2002). Based
on the previous example, individuals who receive a diagnosis of Bulimia Nervosa might
be expected to fall on the high end of the continuum for the binge eating dimension, on
the high end of fear of the fatness/compensatory behaviors dimension, and in the middle
to high range on drive for thinness. In contrast, individuals with Anorexia Nervosa,
depending on their subtype (Restricting Type or Binge-Eating/Purging Type), might be
expected to fall on the high or low end of the binge eating continuum, while falling on
5
the high end of fear of fatness/compensatory behaviors and on the high end of drive for
thinness (APA, 2000; Williamson et al.). This was similar to what was found by
Williamson et al. (2002), although these researchers found more support for organizing
such disturbances based on a latent taxon categorization of symptoms than for the use of
dimensionality, or the continuum model.
Although more is known about Anorexia and Bulimia, the more common
Disordered Eating Patterns often observed in outpatient psychotherapy settings fall under
the criteria for the diagnosis of EDNOS (APA, 2000). Compared to Anorexia Nervosa
and Bulimia Nervosa, less is known about these “NOS” disorders (Norring & Palmer,
2005).
Due to the fact that so little is known about these additional disorders, individuals
may display related problematic eating behaviors that go unnoticed or their consequences
may be minimized. However, these maladaptive and often destructive behaviors are still
of concern. The current study is concerned with all disordered patterns of eating related
behaviors, including those that have been formally recognized as eating disorders (i.e.,
Anorexia Nervosa and Bulimia Nervosa), as well as those maladaptive eating-related
behaviors or thoughts of clinical concern that fail to meet the criteria for a formal
diagnosis or which fall under the EDNOS diagnosis. All of these disturbed eating-related
behaviors may be subsumed under the term “Disordered Eating Behavior” (Mutterperl &
Sanderson, 2002; Trattner & Thompson, 2001). For the purpose of the current study,
unless otherwise indicated, all disturbed eating patterns will be referred to hereafter as
Disordered Eating Behaviors or Disordered Eating Patterns.
6
Williamsons et al. (2002) separated participants into six groups: Bulimia Nervosa,
Anorexia Nervosa, Eating Disorder Not Otherwise Specified, Binge Eating Disorder,
Obesity, and normal-weight. These groups provide useful examples of different types of
Disordered Eating Behaviors. The following is an overview of some of the literature
examining relationships between Disordered Eating Behaviors and other factors, ending
with an examination of the relationships between perfectionism and stress and Disordered
Eating Behaviors.
Factors Related to Disordered Eating Behaviors
The literature on Disordered Eating Behaviors is extensive. Much of the literature
is concerned with risk factors associated with the development of Disordered Eating
Behaviors as well as with particular populations in which eating disorders are most
prevalent. For example, among other risk factors, low self-esteem, emphasis on being
thin, unhealthy attempts at dieting, and preoccupation with size, shape, and appearance
have all been identified as risk factors for Anorexia (Dobmeyer & Stein, 2003; Robert-
McComb, 200;). Desire to be accepted socially, low tolerance for and inability to deal
with conflict, difficulty articulating and getting needs met, deficiency in coping skills,
and increased levels of distress have been shown to be factors that have been linked to
Bulimia (Miller, Schmidt, Vaillancourt, McDougall, & Laliberte, 2006; Robert-
McComb). Similar risk factors have been associated with Disordered Eating Behaviors
which meet the DSM-IV-TR description of Eating Disorder Not Otherwise Specified
(Robert-McComb). Some of these factors and their relationship to disordered eating are
discussed in detail below.
7
Age. The usual onset of Anorexia Nervosa is during middle to late adolescence.
Bulimia Nervosa typically has an onset which occurs during late adolescence and early
adulthood. Because eating disorders are most common among adolescents and young
adults, much of the existing literature has focused on these populations. However,
disorders may also occur within younger and older age groups (Matthews, 2001; Michel,
2003; Vander Wal and Thelen, 2000). Even pre-school children seem to be cognizant of
differences in size and weight, tending to associate negative characteristics with being
overweight (Turnbull, Heaslip, & McLeod, 2000; Vander Wal and Thelen, 2000).
Younger individuals are not alone in exhibiting Disordered Eating Patterns. In
addition to preadolescents and adolescents, adult populations have been found to exhibit
Disordered Eating Behaviors or to be at risk for the development of Disordered Eating
Behaviors later in life. In fact, elderly women have also been shown to engage in
bingeing and purging (Matthews, 2001; Michel, 2003). In a separate study, ManejÍas-
Parke, Yager, and Apfeldorf (2008) examined a case of a 72 year-old man with an
EDNOS. Thus, it is important that more attention be given to the study of Disordered
Eating Behaviors throughout different stages of life.
Ethnicity and culture. Although originally thought to primarily affect Caucasian
women, interest has grown in examining Disordered Eating Behaviors in other ethnic
groups. Some have proposed that White women are more at risk for developing an eating
disorder than women from other culture groups (Smith, 1995). Individuals who have
subscribed to this view have stated that White women are more vulnerable to society’s
pressure and to society’s view of the thin body as ideal (Smith). It has been further
8
proposed that because African-American and Hispanic women come from cultures that
place less importance on weight or being thin, they are less likely to be affected (Smith).
In a study by DiGioacchino, Sargent, and Topping (2001), the role of ethnicity in
perceptions of ideal body was examined. Participants were African-American and White
college students. The results revealed that White females were more likely to possess a
distorted perception of their weight and were more likely to view a smaller weight and
size as desirable.
Gluck and Geliebter (2002) studied differences among White, African-American,
and Asian women in reference to perceptions of actual and ideal body as well as
Disordered Eating Patterns. White women’s ideal body differed greatly from their actual
body. The difference for the White women in the study was greater than for either of the
other two groups. African-American women’s ideal body was larger than that of either
White or Asian women.
Although the results of many studies have indicated that body dissatisfaction and
other Disordered Eating Behaviors occur less frequently in minority females, researchers
now realize that all ethnic backgrounds are affected by Disordered Eating Behaviors
(Cummins, Simmons, & Zane, 2005). For example, Vander Wal (2004) completed a
cross-sectional study comparing overweight and obese fourth and fifth-grade African-
American and Hispanic girls with normal weight girls from the same ethnic backgrounds.
In contrast to what is typically found in reports of studies involving White youth and
young minorities, minority participants in this study also reported experiencing pressure
to lose weight. There are even some indications that specific Disordered Eating
Behaviors occur just as frequently in minority groups as in groups of majority. For
9
example, Smith (1995) reviewed studies which indicated that Binge Eating Disorder
(BED) occurs in African-American women at rates similar to that of White women.
Smith proposes that other ethnic minorities such as Native Americans and Hispanics are
susceptible as well. It is even believed that Binge Eating Disorder (BED) occurs in
young African-Americans and Hispanics at a higher rate than in White youth (Smith).
Further understanding regarding the prevalence of Disordered Eating Behavior
among different cultural groups comes from studies that examine disordered eating in
non-Western populations. For example, Cummins et al. (2005) reviewed studies on the
prevalence of Disordered Eating Behaviors among different Asian populations which
resided outside of Western countries and among those Asians which lived in Western
countries. The studies which examined the prevalence of Disordered Eating Patterns in
Asians inside Western countries compared these individuals with other populations
residing inside the same Western countries.
Asian groups studied included individuals from Pakistan, India, Japan, Hong
Kong, Singapore, and China. Results differed based on the location of the Asian
population highlighted. Although the occurrence of diagnosable eating disorders was
lower among Asian women in non-Western locations, the occurrence of eating disorder
symptoms among non-Western Asians was comparable to or greater than the occurrence
in Asian populations of Western countries (Cummins et al., 2005).
When the prevalence of diagnosable eating disorders was compared between
Asian and White adolescents of Great Britain, one study revealed that Asian adolescents
were more likely to be diagnosed with bulimia. Also, Asian adolescents displayed either
comparable or exceedingly higher levels of symptoms than White adolescents.
10
In addition to adolescents, differences between Asian and White women from
Great Britain were examined. Although studies revealed greater levels of restrained
eating in White women from Great Britain, as compared to Asian women from Great
Britain, no studies were found that examined any differences between Asian and White
females from Great Britain in the prevalence of diagnosable eating disorders (Cummins
et al., 2005).
Asian adolescents in the United States, compared to White adolescents in the
United States, produced scores greater on measures of body dissatisfaction and
uncontrollable eating behaviors. For White and Asian women in the United States, the
majority of the studies reviewed concluded that Asian women had lower rates of
diagnosable disorders (Cummins et al., 2005). However, some questions have been
raised about studies that have examined the prevalence of eating disorders and/or
symptoms in non-Western populations such as in Asians (Cummins et al.). One of the
concerns is that some of the instruments used to collect data might not be valid measures
of eating disorders in these populations. In addition, some of the symptoms used to
diagnose individuals from Western countries may not be generalizable or present
accurate information about the presence of these disorders and symptoms in non-Western
populations (Cummins et al.).
Thus based on Cummins et al.’s (2005) review of previous studies, it seemed that
White women from the United States and Asian adolescents from Great Britain were
more likely to have diagnosable eating disorders. Asian women demonstrated greater
dissatisfaction with their bodies than White females from the United States (Cummins et
al.). Even though females from minority groups are diagnosed with eating disorders less
11
often, they seem to be susceptible to undiagnosed Disordered Eating Behaviors.
Therefore, despite differences in susceptibility and rates of prevalence of specific
Disordered Eating Behaviors, all ethnic and culture groups seem to be affected.
Gender. Although diagnosable eating disorders do not occur in large rates within
the general population, as previously stated, the occurrence is increasing (Matthews,
2001). Eating disorders occur most often in females. The prevalence of Anorexia
Nervosa within the female population is 0.5%. The prevalence of Bulimia Nervosa
among females is 1% - 3%. In fact, 90 percent of cases of persons with diagnosed
Anorexia and Bulimia are female (APA, 2000).
Some also believe that there is a relationship between sexual orientation, at least
for males, and Disordered Eating Behaviors (Matthews, 2001; Yelland & Tiggemann,
2003). Although females, as compared to males, receive more pressure from society to
conform to an idealized thinness, there is indication that gay males receive similar
pressures as heterosexual females to be thin and as a result, also, possess low self-esteem
and dissatisfaction with their own bodies (Andersen, 1995; Siever, 1994).
Siever found that gay males exhibited greater body dissatisfaction than lesbian
females, heterosexual males, and heterosexual females. Although in Siever’s study,
heterosexual females scored the highest on measures of dissatisfaction, after accounting
for gay males, other studies found that even when compared to gay males, body
dissatisfaction and lowered self-esteem seem to be more pronounced in heterosexual
females (Yelland & Tiggermann, 2003). For example, in a study of gay men,
heterosexual men, and heterosexual women, lower esteem among females was observed
12
(Yelland & Tiggermann). In fact, men were found to hold higher body esteems than
females, regardless of sexual orientation (Yelland & Tiggemann).
In a study consisting of male body-builders and of women diagnosed with
Anorexia, researchers found that although both groups were similar in the degree to
which they valued and obsessed over physical appearance, the male body-builders were
more likely than the women with Anorexia to have higher self-worth (Davis & Scott-
Robertson, 2000).
In addition to lower body satisfaction and self-worth, females tend to possess
more negative attitudes related to dieting and weight. For example, Peñas-Lledó, Sancho,
and Walker found that females’ rationale for exercise was motivated by negative factors,
such as fear of weight gain, more so than males who were more concerned with being in
good health.
Although there is a greater propensity for females to engage in disturbed eating
practices and to hold maladaptive attitudes surrounding weight and size, males also suffer
from eating-related difficulties (APA, 2000). The prevalence of Anorexia Nervosa and
Bulimia Nervosa among males is about one-tenth of that among females (Murnen &
Smolak, 1997). However, there is some evidence that rates of eating disorders among
members in this population are rising (Matthews, 2001).
Differences between men and women, in relation to prevalence of Disordered
Eating Behaviors, may be due to the differences in how eating disorders are exhibited
between males and females. The differences in presentation are in part due to societal
pressures. Whereas females receive social pressures to be thin, heterosexual males tend
to receive pressure to be larger in stature as it is associated with strength and power

13
(Matthews, 2001). Thus, males might engage in weight building, instead of weight
decreasing behaviors as is common in females (Davis & Scott-Robertson, 2000). This
adherence to societal standards might be seen as early as adolescence for some males
(Smolak, Murnen, & Thompson, 2005).
Also, differences exist between males and females in risk factors. One difference
is that males tend to exhibit eating disorders at a later age than females (Matthews, 2001).
In addition, it has been suggested that males with eating disorders might have the
following characteristics: being overweight as a child, dieting, involvement in sports or
professions that require low weight or thinness, and/or being gay (Matthews). In pointing
out psychologically-related factors associated with eating disorders in adolescent males,
Ricciardelli and McCabe (2004) included perfectionism, a decreased sense of self-
esteem, a lack of trust in others, lack of self-awareness, and drug usage.
The pressure placed on males by society to obtain and maintain a larger build can
also be seen in the results of the findings of Leit, Pope, and Gray (2001). Leit et al. were
interested in how society’s opinion of the ideal male figure had evolved over the years.
Pictures of Playgirl male models from 1973 to 1997 were examined and compared.
These researchers observed that male models have become more muscular and concluded
that society desires and encourages men to be more muscular (Leit, et al.).
In summary, although males and females seem to differ in prevalence, risk
factors, and presentation, both are susceptible to Disordered Eating Patterns. It also
appears that heterosexual females and gay males receive similar pressure to adhere to
idealized thin body types, resulting in low body satisfaction and self-esteem.
Heterosexual males also appear to receive pressure, yet of a different sort.
14
Peer, family, and media influence. In a study by Lieberman, Gauvin, Bukowski,
and White (2001), the influence of peer-related factors on body esteem and eating
behaviors in girls was examined. Lieberman and his associates found that such peer-
related influences as teasing and the amount of value placed on weight and shape were
related to participants’ views of their body and their tendencies to engage in problematic
eating behaviors.
Young, McFatter, and Clopton (2001) looked at how aspects of family
functioning, peer attitudes, and media exposure influenced eating behaviors and feelings
associated with their bodies. Media and peer attitudes were found to be related to an
increased probability of Disordered Eating Patterns and beliefs (Young et al.).
In a study of elementary girls, Vander Wal and Thelen (2000) found that these
young girls’ low scores on measures of body esteem were shaped by parental and peer
influence. More specifically, girls’ perception of teasing by peers and parental urging to
control or lose weight were found to be correlated with body dissatisfaction.
Stice, Presnell, and Spangler (2002) examined risk factors associated with binge
eating in girls, ages 13 to 17 years-old. In addition to other factors (i.e., discontentment
with one’s body, greater body mass, increased perceived importance of appearance,
negative emotion, depressive symptoms, and high dieting behaviors), individuals’ view
of pressure to be thin, received from family, friends, and significant others, was shown to
increase susceptibility to binge eating. In addition, Disordered Eating Behaviors of
family, friends, and significant others were also associated with an increased tendency to
binge eat (Stice et al.).
15
However, peer and family may also serve as positive influences as well. In
particular, family and peer can influence an individual’s development of good values
related to eating behaviors and attitudes and can also serve as buffers. Social support is
thought to be essential in preventing, intervening against, and/or neutralizing the effects
of society’s pressure to adopt an idealized view of the thin body (Stice & Whitenton,
2002). Furthermore, lack of social support is thought to be linked to problematic eating
behaviors and distorted body image (Gerner & Peter, 2005; Stice & Whitenton, 2002).
More specifically, Stice and Whitenton (2002) found a direct relationship between level
of peer support, distorted body image, and disturbed eating behaviors. Mainly, as peer
support increased, distortions in body image decreased.
It appears that external influences, such as peer, family, and media all impact
individuals’ beliefs about their bodies and have the capability of increasing or decreasing
susceptibility to Disordered Eating Behaviors. When external influences such as peers,
family, and media attribute increased importance to body image, individuals tend to have
lowered self-esteem, lowered body satisfaction, and to engage in maladaptive eating
behaviors (Meno, Hannum, Espelage, & Low, 2008). Yet these same external influences
can be instrumental in preventing and protecting individuals from the development of
disordered eating patterns.
Emotional and physiological factors. The roles of emotional and physiological
factors have received quite a bit of attention. Perhaps, nowhere else is it more evident
that there are common ideas about a relationship between eating and emotions than in the
frequently used phrase of “emotional eater”. Given the current increased availability of
dieting information and dieting advice, the relationship between physiological cues and

16
eating may also be recognized common knowledge. After all, it is not uncommon to hear
nutritional and diet professionals advise individuals to become more aware of their
physiological cues and to avoid eating when one is not hungry.
Vanderlinden, Dalle Grave, Vandereycken, and Noorduin (2001) conducted a
study in which they examined factors related to binge eating patterns in females. The
results indicated that binge eating was associated with emotional cues, such as boredom,
depression, and anxiety, and with physiological cues, such as sensations of hunger and
desire to eat sweets.
Alpers and Tuschen-Caffier (2001) examined the relationship between negative
emotions (e.g., sadness, anxiety, etc.) and eating. These researchers were interested in
the extent to which negative emotions induced desire to eat in individuals diagnosed with
Bulimia Nervosa, individuals with Panic Disorder, and nonclinical individuals. These
researchers found that individuals with Bulimia experience a great amount of negative
emotional discomfort both preceding and following binge episodes (Alpers & Tuschen-
Caffier). Milligan, Waller, and Andrews (2002) looked at the role of anger in Disordered
Eating Behaviors. They observed that angry individuals ate more.
Stice et al. (2002) arrived at a different conclusion. Among factors assessed by
these researchers was the extent to which depression, anxiety, anger, and emotional
eating predicted binge eating. Although depression predicted onset of binge eating,
anxiety and anger did not.
In conclusion, it is often accepted knowledge that physiological and emotional
cues are related to patterns of disordered eating. However, the accuracy of this accepted
knowledge may be questionable. Some believe that Disordered Eating Behaviors are
17
increased as a result of physical and emotional cues while others have not observed this
relationship.
Psychopathology. There is some indication that there is a relationship between
psychopathology and Disordered Eating Behaviors (Spindler & Milos, 2007). That is,
some psychological disorders may co-occur with and, in some instances, precede a
diagnosis of eating disorders and/or symptoms in some individuals. In fact, some believe
that “while maladaptive eating patterns stem from concerns about body image and
attractiveness, full-blown clinical eating disorders occur only when body concerns co-
exist with other psychopathology” (Robert-McComb, 2001, p. 43).
Obsessiveness is often seen in women with eating disorders (Anderluh,
Tchanturia, Rabe-Hesketh, & Treasure, 2003; Jiménez-Murcia et al., 2007; Polivy &
Herman, 2002). In fact, obsessive tendencies appear to be precursors to eating disorders
and appear to predate eating disorders by about five years (Robert-McComb, 2001;
Vitousek & Manke, 1994).
Speranza et al. (2001) assessed for Obsessive Compulsive Disorder (OCD) in
individuals with an eating disorder diagnosis and individuals without a diagnosis.
Results revealed differences in diagnosis and type of eating disorder based on whether or
not individuals also received a diagnosis of OCD.
McLaren, Gauvin, and Steiger (2001) observed significant interaction effects
between body esteem and personality. More specifically, the interactive effects of
narcissism and heightened concern with weight and appearance proved to be more
indicative of Disordered Eating Patterns than either narcissism or preoccupation with
weight and appearance alone.
18
In another study, Davis and Scott-Robertson (2000) compared women with
Anorexia and competitive male body-builders to the general population. These
researchers found that both groups of participants displayed a higher degree of obsession
over their food intake, exercise regimen, and body image than in the general population.
Additionally, the male body-builders and the women with anorexia possessed more
narcissistic tendencies than in the general population. Thus, there may be an important
relationship between Disordered Eating Behaviors, obsessiveness, and narcissism.
In addition to obsessiveness and narcissism, the relationship between disordered
eating and depression has been examined. For example, among participants in Hrabosky,
Masheb, White, and Grilo’s (2007) study, those who indicated that their self-evaluation
was at least moderately overly influenced by weight and shape obtained higher scores on
a measure of eating disorders than did individuals who indicated minimal to no influence
of their weight and shape on their self-evaluation. The participants who indicated that
their self-worth was determined largely by their shape and weight also scored higher on a
measure of depression than did individuals who reported that their weight and shape had
little to no influence on their self-worth (Hrabosky et al.). Marmorstein, von Ranson,
Iacono, and Malone (2008) suggested that eating disorder pathology predicted depressive
pathology.
In a study by Williamson, Kelley, Davis, Ruggiero, and Blouin (1985), obese
individuals and individuals with Bulimia obtained higher scores on the 7(Pt) and 8(Sc)
scales of the Minnesota Multiphasic Personality Inventory (MMPI) than individuals
without Bulimia or obesity. Participants with Bulimia obtained significantly higher
scores on scale 4(Pd) than controls. Individuals with Bulimia also obtained significantly
19
higher scores than individuals with obesity or than individuals without either Bulimia or
obesity on a measure of depression, on scales 1(Hs), 2(D), and 3(Hy) of the MMPI, and
on all subscales (Somatization, Obsessive-Compulsive, Interpersonal Sensitivity,
Depression, Anxiety, Phobic Anxiety, Paranoid Ideation, and Psychoticism) of the
Symptom Checklist-90 (SCL-90), other than the Hostility subscale.
In summary, psychopathology and Disordered Eating Behavior appear to be
related. Individuals who engage in Disordered Eating Behaviors often also show a
variety of additional symptomology, including obsessiveness, narcissism, and depression.
Another clinical symptom which has received substantial empirical support for its role as
a predictor of disordered eating is perfectionism. The next section of this review
discusses this variable in more detail.
Perfectionism, Stress, and Disordered Eating Behaviors
Perfectionism. Perfectionism is the possession of unusually and often irrationally
high expectations for one’s self (Robert-McComb, 2001). The connection between
perfectionism and Disordered Eating Behaviors has been discussed numerous times
throughout the literature (Garner, Olmstead, & Polivy, 1983; O’Connor & O’Connor,
2004; Sassaroli et al., 2008; Vohs, Bardone, Joiner, Abramson, & Heatherton, 1999).
However, until more recently there seemed to be limited empirical support for a
relationship between perfectionism and Disordered Eating Behaviors (Franco-Paredes,
Mancilla-Diaz, Vásquez-Arévalo, López-Aguiler, & Álvarez-Rayón, 2005; Striegel-
Moore & Bulik, 2005; Vohs et al.). For example, a study involving both male and female
undergraduates revealed that perfectionism was related to various Disordered Eating
Behaviors (e.g., fasting, bingeing, and abuse of diuretics and laxatives) (Forbush,
20
Heatherton, & Keel, 2007). The literature on eating disorders also seems to be divided in
terms of how much importance is attributed to perfectionism as a risk factor. According
to Polivy and Herman (2002), perfectionism is not considered a determining factor.
Joiner, Heatherton, Rudd, and Schmidt (1997) only found perfectionism to be a risk
factor for women with bulimic symptoms when these women also possessed beliefs that
they were overweight.
Others have proposed that perfectionism is a core characteristic of individuals
with Disordered Eating Behaviors (Hewitt, Gordon, & Ediger, 1995; Landa & Bybee,
2007; Schwarz et al., 2005; Striegel-Moore & Bulik, 2005). For example, underweight
women with Anorexia, as compared to women with Anorexia who had weight restored,
scored higher on most measurements of perfectionism (Bastiani et al., 1995). Also,
women with Anorexia who had returned to a normal weight scored higher on
measurements of perfectionism than control individuals without Anorexia (Bastiani et
al.). Kiemle, Slade, and Dewey (1987) found that individuals who obtained higher scores
on a measurement of perfectionism also scored higher on a measure of Disordered Eating
Behaviors.
Still others propose that differences in beliefs about the extent of the role of
perfectionism are due to failure to properly operationalize what is meant by perfectionism
(Franco-Paredes et al., 2005; Hewitt et al., 1995). For example, Hewitt et al. differentiate
between three different forms of perfectionism: self-oriented perfectionism (involving
those expectations and/or pressures that individuals place on themselves), other-oriented
perfectionism (involving those expectations individuals place on others), and socially
prescribed perfectionism (which are those demands placed on individuals by others).
21
Individuals with eating disorders have been shown to possess self-formed beliefs that
they must perfect everything that they do (Hewitt et al.). Hewitt et al. described how an
individual’s overwhelming desire to present one’s self as perfect, to avoid being seen as
imperfect and to avoid discovery of one’s actual imperfection can contribute to
Disordered Eating Behaviors.
Using three different measurements to assess perfectionism, including both self-
report instruments and an interview, Cockell et al. (2002) found an association between
various dimensions and aspects of perfectionism and Anorexia Nervosa. They found that
women who met the criteria for Anorexia scored higher than women with mood disorders
and women without mood disorders on the self-oriented and socially-prescribed
dimensions of the Multidimensional Perfectionism Scale (MPS), on the Interview for
Perfectionistic Behavior (IPB), and on the Nondisclosure of Imperfection Scale of the
Perfectionistic Self-Presentation Scale (PSPS).
Lafferty and Lafferty (1996) make several distinctions between perfectionism and
similar constructs. For example, these authors differentiate between being perfectionistic
and being achievement-oriented. According to these authors:
The concepts of achievement and perfectionism are close in theory but
worlds apart in action. It is the difference between effectiveness and
ineffectiveness, health and illness. Although both aim for excellence, the
perfectionist sets impossible goals, while the achiever sets sights on
realistic and achievable standards. And although both are driven, the
perfectionist has a nervous quality, stemming from an abject fear of
failure, with the desire for success tied to self-worth. The achievement-
22
oriented individual, on the other hand, seeks excitement, and is
invigorated by the fun and challenge of the task, and the opportunity to
learn from failures when they occur. (p. 8)
Portraying a perfect self is of utmost importance to perfectionists. When
perfectionists encounter challenges to their sense of perfectionism, they tend to become
anxious and experience lowered self-esteem (Nagel, 2002). In fact, perfectionists often
project a false sense of superiority in an attempt to mask their actual low sense of self-
worth (Lafferty & Lafferty, 1996). Additionally, they tend to attribute great importance
to seemingly small things and to have an ongoing fear of failure and that their true
imperfections will be discovered (Lafferty & Lafferty). They tend to believe that if they
fail they are worthless (Lafferty & Lafferty). According to Nagel, “since perfectionists
tend to place a value on any action, they catastrophize any outcome which they perceive
as a failure or a threat to their self-esteem….therefore, perfectionists strive to reach high
standards to validate their ego” (Nagel, p. 328). High levels of perfectionism have
especially been linked to Anorexia (Polivy & Herman, 2002; Striegel-Moore & Bulik,
2005; Tyrka, Waldron, Graber, & Brooks-Gunn, 2002).
Differences in opinion about the role of perfectionism as a risk factor for
disordered eating may also stem from failure in the literature to differentiate between
negative and positive perfectionism. Whereas possessing high standards and order are
considered positive perfectionism, the discrepancy or failure to actually meet those high
standards and order is considered Negative Perfectionism (Slaney et al., 2001). Davis
(1997) found that, although there was a positive relationship between normal

23
perfectionism (positive perfectionism) and greater body esteem, when neurotic
perfectionism (Negative Perfectionism) increased body esteem decreased.
As pointed out by Landa and Bybee (2007), in some instances perfectionism may
be useful as it “may prompt individuals to set realistic goals, provide motivation for
achievement, and result in self-satisfaction and success” (p. 85). Yet, perfectionism may
evolve into unrealistic and self-sabotaging expectations as the reality experienced falls
short of one’s exceptionally high expectations, as is the case with Negative Perfectionism
(Robert-McComb, 2001). Thus, although a perfectionistic approach may sometimes be
healthy and may lead to productivity, in some instances, when these standards become
too high and irrational, individuals face the possibility of failure and disappointment
(Robert-McComb). High levels of perfectionism have been associated with Anorexia
(Polivy & Herman, 2002; Striegel-Moore & Bulik, 2005; Tyrka, Waldron, Graber, &
Brooks-Gunn, 2002).
There is some disagreement about how perfectionism relates to disordered eating
(Striegel-Moore & Bulik, 2005). One explanation is that perfectionism is thought to add
to an individual’s susceptibility to an eating disorder by exacerbating individuals’
perceptions of their flaws (Polivy & Herman, 2002). Another related explanation is that
perfectionism is thought to prevent individuals from being able to genuinely present
themselves and that it prevents them from being able to be open about their problems
(Hewitt et al., 1995). Fairburn, Shafran, and Cooper (1999) offered an alternative
explanation centered on control regarding the development of Anorexia. These theorists
proposed that individuals with Anorexia typically feel the need to control different
aspects of their lives (a characteristic of perfectionism), and that these individuals find

24
immediate gratification and reward from the results that they obtain from controlling their
diet and physical appearance. Individuals with Anorexia may feel that their ability to
limit their food intake is the only area of their lives over which they feel that they have
control (Fairburn et al.).
In summary, whereas perfectionism can be positive, in that it provides high
standards for one’s behavior and motivation to strive for excellence, it can also be
negative when those standards are unrealistic. The current study examines the
relationship between Negative Perfectionism and Disordered Eating Behavior. The
relationship between stress and Disordered Eating Behavior is also of interest. The
following is a discussion about the relationship between stress and disordered eating.
Stress. Stress has been defined as “the nonspecific response of the body to any
demand” (Selye, 1976, p. 15). Stress, like the previously mentioned factors, has also
been associated with Disordered Eating Behaviors (Fryer, Wallace, & Kroese, 1997;
Harrington et al., 2006; O’Connor & O’Connor, 2004). For example, individuals who
reported increases in work demands and reported experiencing more stress were also
more likely to increase their caloric and fat intake (Arnett, 2006; McCann, Warnick, &
Knopp, 1990).
In a study by Oliver and Wardle (1999), participants reported either an increase or
decrease in food intake, particularly in relation to snacking behaviors, in the face of
stress. Participants in a study by Kandiah, Yake, Jones, and Meyer (2006) also reported
either an increase or decrease in eating due to changes in their appetite as a result of
stress. Food restriction and decreases in caloric intake have been linked to Disordered
Eating Behaviors (Williamson et al., 2008). These same individuals indicated that they
25
consumed less diversity in terms of food choices when stressed. Jenkins, Rew, and
Sternglanz (2005) found that stress influenced individuals’ unhealthy eating behaviors
but not their healthy eating behaviors. O’Connor, Jones, Conner, McMillan, and Eamonn
(2008) distinguished between consumption of snack and main meal in response to stress.
These researchers found that all forms of stress, with the exception of physical stress (i.e.
infliction of physical pain), which had an inverse relationship, were associated with
reported increases in snacking behaviors and decrease in main meal consumption.
Oliver, Huon, Zadro, and Williams (2001) pointed out that most of the literature
on stress has failed to examine how interpersonal stress affects eating behavior. These
researchers compared eating behavior as a result of being exposed to two different types
of interpersonal interactions—ostracism and argument— in low and high disinhibitors
(individuals who lacked the ability to control their food consumption). According to
these researchers, ostracism occurs when an individual or individuals are excluded or
disregarded by others and an argument consists of “a heated, confrontational form of
interaction” (Oliver et al., p. 20). Although Oliver et al. found no differences in the
amount of food consumed as a result of type of interaction or level of disinhibition,
serving as the target of the ostracism or argument appeared to increase intake of food for
high disinhibitors (Oliver et al.). In a separate study investigating the relationship
between stress and binge eating among African-American and Caucasian women,
Harrington et al. (2006) found that discriminatory stress, or stress experienced as a result
of being discriminated against because of minority status, was significantly related to
binge eating patterns for African-American women.
26
Other studies have indicated that perception of the stressful nature of an event as
well as an individual’s ability to handle the event were important factors which impacted
disordered eating (Sims et al., 2008; Soukup, Beiler, & Terrell, 1990). Studies of women
with eating disorders have found that these women believe that their lives are more
stressful than women without eating disorders and that they are less capable of enduring
high levels of stress (Denisoff & Endler, 2000; Harrington et al., 2006). Crowther, et al.
(2001) conducted a study in which they found that how stress was experienced by the
individual was related to disordered eating and increased caloric intake. Participants in
Crowther et al.’s study were normal weight individuals who engaged in binge eating and
normal weight individuals who did not. When compared with participants who did not
engage in binge eating, binge eating participants reported that they perceived daily
hassles as more stressful (Crowther et al.). Sims et al. obtained similar results when
examining levels of Perceived Stress, as measured by the Perceived Stress Scale (PSS-
10), among a nonclinical sample of African Americans. Sims et al. found that Perceived
Stress was related to increases in tendencies to engage in emotional eating, or eating in
response to negative emotional experiences. Individuals, with higher scores on a measure
of perceived stress who were also classified as overweight or obese, based on measures
of Body Mass Index (BMI), also ate more sweets. Nguyen-Rodriguez, Chou, Unger, and
Spruijt-Metz (2008) also found a positive relationship between Perceived Stress and
emotional eating. In a related study, by Okon, Greene, and Smith (2003), adolescent
females who perceived their family life as stressful were more likely to engage in bulimic
behavior (i.e. bingeing and purging). Some view the behaviors inherent in an eating
disorder (e. g., bingeing) as unhealthy and ineffectual methods of coping (Harrington et
27
al.). These methods are considered ineffective because they only provide temporary
relief of uncomfortable affects or situations (Harrington et al.).
In addition to research examining the relationship between perfectionism and
disordered eating and between stress and disordered eating alone, some studies examined
the combined or interactive relationship between perfectionism and stress and disordered
eating. Sassaroli and Ruggiero (2005) administered the Multidimensional Perfectionism
Scale (MPS) to female, high school students on a regular school day, which represented a
non-stressful occasion, as well as on the day of a test and on the day that test results were
given, which were assumed to represent stressful situations. Whereas concern over
mistakes—one dimension of perfectionism—was related to Disordered Eating Behavior
even in absence of stress, parental criticism— a separate dimension of perfectionism—
was related to eating disorder symptoms only when stress was also present. In a separate
study with a similar design, Ruggiero, Levi, Ciuna, and Sassaroli (2003) found that
although perfectionism was related to body dissatisfaction, regardless of whether or not
stress was a factor, perfectionism was only related to drive for thinness during exposure
to stressful situations. Thus, it appears that, in some situations, stress strengthens the
relationship between Disordered Eating Behaviors and perfectionism.
In summary, both perfectionism and stress have been linked to Disordered Eating
Behaviors. In following sections a brief overview is given of some differences between
graduate students and undergraduates. This brief overview is followed by a discussion of
why stress and perfectionism may be especially prevalent among graduate students.
When combined with literature just reviewed, these discussions help justify the study of
perfectionism and stress in graduate students.
28
Rationale for the Study of Graduate Students
There appear to be important differences between graduate students and
undergraduates. For example, Golde (2005) interviewed graduate students from four
separate fields of study who had left their programs. Among other factors, students who
left their respective graduate programs stated that the graduate experience differed greatly
from that of their undergraduate experience. One obvious difference between
undergraduates and graduate students is that the latter elect to continue with their
education beyond the undergraduate level. According to Friedenberg and Roth (1954),
successful graduate students are competitive and autonomous. In addition, graduate
students are more likely to be intrinsically motivated and to possess an internal locus of
control (Terrell, 2005). The following is a discussion of these differences.
Autonomy and competitiveness. Graduate students typically exhibit good initiative
and are proactive in their own success. To be effective in graduate school, students have
to be able to function independently. In contrast to the undergraduate experience, in
which students are told specifically what courses to take related to their profession,
graduate students are more likely to define their own individual and professional needs
and to shape their studies accordingly (Fischer & Zigmond, 1998; Friedenberg and Roth,
1954). As explained by Gardner (2008), “the transition to independent scholar is part and
parcel of the doctoral education process as well as an integral part of the socialization
process that occurs while in graduate school” (p. 326). Additionally, graduate students
often are individuals who have performed above their peers. Given that graduate school
is typically attended by many highly qualified students, it is plausible to argue that
graduate school tends to select for academically competitive students.
29
Intrinsic motivation and internal locus of control. Vidler and Wood (1981)
compared graduate students and undergraduates and found that graduate students
demonstrated greater intrinsic motivation. Melaney (1987) examined factors related to
why students go to graduate school. Melaney found that among other factors, personal
satisfaction was often a reason for going to graduate school. Graduate students sought
opportunities to further learn and grow professionally. In fact, the graduate students in
Melaney’s study found that their interest in learning and personal fulfillment exceeded
job-related incentives in importance in their decision to attend graduate school.
Anderson and Swazey (1998) obtained similar findings. Nordstrom and Segrist (2009)
found that graduate students had a greater internal locus of control than undergraduates.
That is, graduate students believe that they have some personal affect on their successes
and failures.
Given that there are qualities that distinguish graduate students from
undergraduates, it seems reasonable to extend research on Disordered Eating Behaviors
to the population of graduate students. Furthermore, given that perfectionism and stress
have been identified as possible predictors of Disordered Eating Behaviors, it is
reasonable to ask whether those variables are also worth investigating within the
population of graduate students. This question is addressed in the following section.
Graduate Students, Stress, and Perfectionism
As graduate students, individuals may find themselves facing many unexpected
challenges in both their academic and personal lives. With so many simultaneous
demands on a graduate student’s time, graduate school may be an important source of
stress (Johnson, Batia, & Huan, 2008; “Very Different”). For example, some graduate
30
students may have families for which they are responsible. In addition to their
schoolwork, these individuals are faced with the challenges of maintaining relationships,
maintaining a household, paying bills, etc. (Semenza, 2005; Ülkü-Steiner, Kurtz-Costes,
& Kinlaw, 2000). Having perhaps been dependent upon and having received financial
support from their parents throughout their undergraduate years, these individuals might
find themselves primarily responsible for many aspects of their own welfare. With the
great amount of time devoted to research in graduate school, other areas of an individual's
life may be neglected. The amount of time devoted to studies might interfere with both
the formation of new relationships and with the maintenance of current relationships
(Whitman, 2000). Additionally, graduate students might sacrifice time necessary for self-
care and rejuvenation in the quest to complete the demands of their education. The
potential conflict between academic demands and personal needs could obviously
exacerbate the level of stress in the lives of graduate students.
The rate of graduate school drop-out provides additional evidence for the difficult
and stressful nature of graduate school in comparison to undergraduate school. The
attrition rate for graduate students is such that chances of not completing are quite high
(Gardner, 2008; Golde, 2005). The attrition rate for graduate students (40%-70%) is
comparatively higher than that for undergraduates (10%-40%) (DeBerard, Spielmans, &
Julka, 2004; Gardner; Golde; Porter, 1990).
Graduate students are usually individuals who have excelled and outperformed
their peers throughout their undergraduate studies (Mitchell, 1996). These individuals
might be expected to have a perfectionistic approach to their studies, and perhaps their
lives as well. Yet with all the challenges inherent in graduate school, there are many
31
opportunities to fail or fall short of one’s goal. These perfectionistic individuals might
have to work extra hard in graduate school to maintain their perfect appearances. These
individuals, who prior to now excelled, may find themselves struggling for the first time
simply to complete coursework and to pass courses (Davis, Bissler, and Leiter, 2001;
“Very Different,” 2008). As a result of being in the company of so many highly qualified
students, individuals may experience a greater sense of competition. Individuals who,
throughout their undergraduate years, stood out because of their distinct achievements
might struggle to even be noticed (“Very Different,” 2008). This sense of invisibility
may cause these individuals to question themselves and may possibly threaten their sense
of identity. After all, perfectionists tend to have an ongoing fear that their true imperfect
selves will be discovered (Lafferty & Lafferty, 1996). As previously mentioned, it is
very important to perfectionists that they appear to have everything under control.
Failure to maintain appearances may, in turn, increase anxiety and decrease self-esteem
(Nagel, 2002).
Graduate school is also the time that individuals learn to balance multiple,
sometimes conflicting, roles while maintaining appropriate boundaries. While in
graduate school, individuals work closely with others in positions of authority, at times as
subordinates and at other times as colleagues (Friedlander, Keller, Peca-Baker, & Olk,
1986; Goplerund, 2001; Johnson, Batia, & Huan, 2008). For example, graduate students
often have to fulfill their roles as student, advisee, supervisee, and assistant, at times,
while operating as professional peers at other times. The process of learning to balance
these sometimes conflicting roles in a complementary manner, as is expected of
professionals, can become confusing given that roles often bleed into one another and
32
boundaries sometimes become unclear. Not only must students learn to effectively
juggle these roles, they often do so while being fully cognizant of their vulnerability to
the repercussions of any mishaps. This process might present added stress to graduate
students’ already stressful lives, as the process requires students to constantly change
roles (Dodds, 1986). For perfectionists, the process of learning to manage so many
simultaneous demands while maintaining very high standards can be especially
challenging.
The level of stress and perfectionism experienced by graduate students may be
somewhat different from that of an undergraduate. Graduate school places various
demands on an individual, including responsibility for one’s own financial welfare and
the balancing of numerous roles simultaneously. These demands might cause significant
problems for graduate students as they are confronted with many possibilities for failure.
In summary, there is much evidence for the relationship between perfectionism
and stress and Disordered Eating Behaviors (Denisoff & Endler, 2000; Landa & Bybee,
2007; O’Connor et al., 2008; Robert-McComb, 2001). Although the relationship
between stress and perfectionism and Disordered Eating Behavior has been examined,
this relationship within the graduate student population has not. The current study
examined Disordered Eating Behaviors within the graduate student population,
specifically focusing on Perceived Stress and Negative Perfectionism.

33
HYPOTHESES
As discussed in the literature review, Negative Perfectionism and Perceived Stress
are believed to increase susceptibility to Disordered Eating Behaviors. This relationship
was explored using a population of graduate students. In accordance with the above, it
was hypothesized that:
1a: Negative Perfectionism, as measured by the Discrepancy Subscale of the
Almost Perfect Scale-Revised (APS-R), will account for a significant amount of variance
in Disordered Eating Behavior, as measured by the Uncontrolled Eating Subscale (UE) of
the Three Factor Eating Questionnaire-R21 (TFEQ-R21), above and beyond the variance
accounted for by Perceived Stress, as measured by the Perceived Stress Scale (PSS-10).
1b: Perceived Stress, as measured by the PSS-10, will account for a significant
amount of variance in Disordered Eating Behavior, as measured by the UE Subscale,
above and beyond the variance accounted for by Negative Perfectionism, as measured by
the Discrepancy Subscale of the APS-R.2a: Negative Perfectionism, as measured by the
Discrepancy Subscale of the APS-R, will account for a significant amount of variance in
Disordered Eating Behavior, as measured by the Cognitive Restraint Subscale (CR) of
the TFEQ-R21, above and beyond the variance accounted for by Perceived Stress, as
measured by the PSS-10.
34
2b: Perceived Stress, as measured by the PSS-10, will account for a significant
amount of variance in Disordered Eating Behavior, as measured by the CR Subscale,
above and beyond the variance accounted for by Negative Perfectionism, as measured by
the Discrepancy Subscale of the APS-R.
3a: Negative Perfectionism, as measured by the Discrepancy Subscale of the
APS-R, will account for a significant amount of variance in Disordered Eating Behavior,
as measured by the Emotional Eating Subscale (EE) of the TFEQ-R21, above and beyond
the variance accounted for by Perceived Stress.
3b: Perceived Stress, as measured by the PSS-10, will account for a significant
amount of variance in Disordered Eating Behavior, as measured by the EE Subscale,
above and beyond the variance accounted for by Negative Perfectionism, as measured by
the Discrepancy Subscale.
35
METHOD
Participants
Two hundred and forty-six graduate students from Auburn University and the
University of Memphis were recruited; 160 (23 males and 137 females) agreed to
participate. Since the literature indicates that Disordered Eating Behaviors are presented
differently among males and females and the current study focused on Disordered Eating
Behaviors of females, data from males were removed. Eleven of the remaining
participants were eliminated from the original sample because they provided incomplete
surveys. Also, only individuals who were at least 19 years old, which was the age of
consent in the state of Alabama (18 was age of consent in TN) were allowed to
participate. Since the average age for professional and graduate students ranged from 28
to 34, respectively, the cutoff age for the study was set at 35 (Choy & Cataldi, 2006;
Choy, Geis, & Malizio, 2002). Therefore, only responses from those participants who
were ages 19 through 35 were used and all other surveys were set aside. Eighteen
additional participants were excluded because they were above the age range. The total
number of participants included in the current study was 108. Participants’ ages ranged
from 21 to 35. The mean age was 24.87 and the median was 24. The remaining
participants self-identified as follows: 4.63% Asian, 13.89% Black, 75.93% White, and
5.56% Other. Additionally, of those who identified as Other, 16.7% specified that they
36
were International, 16.7% Indian, and 50% Biracial (Black and White); one (16.7%) did
not specify.
Procedure
Permission, from instructors, to administer surveys to graduate-level classes,
related to a variety of majors on the campuses of Auburn University and the University of
Memphis, was obtained through an email request (See Appendix F). Participants were
from a sample of convenience; however some attempt was made to approach instructors
from classes believed to have high female enrollment and to obtain a representation from
a variety of majors. A list of departments from which participants were approached is
included in Table 1. The data collection took place during spring and summer semesters
of 2008. A script (See Appendix G) briefly describing the study was read aloud to
potential participants. They were instructed to complete instruments outside of
classrooms and to return completed packets at their next class meeting to be collected.
Individuals who chose not to participate were also instructed to return incomplete packets
during their next class meeting. The surveys were estimated to take a maximum of
approximately 15 minutes to complete. Also, a list of local mental health providers was
provided (See Appendices H and I) in case participants experienced any psychological
discomfort as a result of their participation.
The survey consisted of questions related to demographics (i.e., age, sex,
ethnicity, and educational status) (See Appendix A) and a battery of assessment
instruments with questions measuring stress, perfectionism, and participants’ beliefs,

37
attitudes, and behaviors related to disordered eating. Detailed information concerning the
instruments used is listed below.
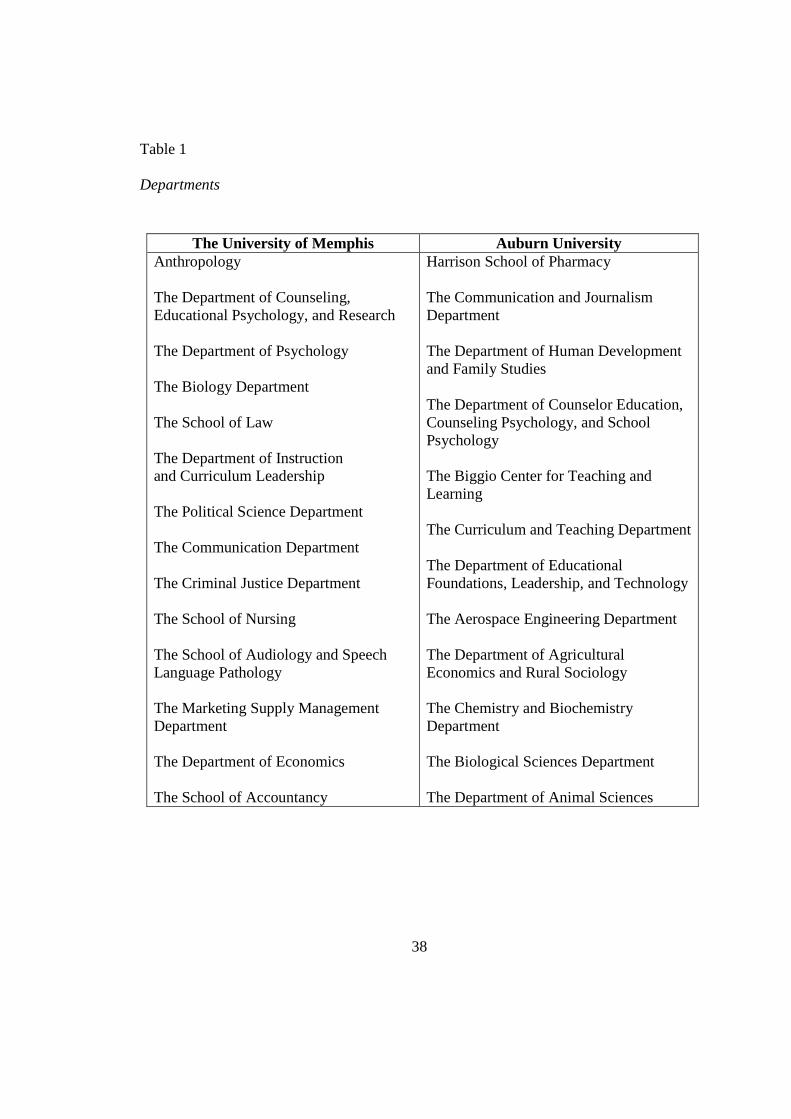
38
Table 1
Departments
The University of Memphis Auburn University Anthropology The Department of Counseling, Educational Psychology, and Research The Department of Psychology The Biology Department The School of Law The Department of Instruction and Curriculum Leadership The Political Science Department The Communication Department The Criminal Justice Department The School of Nursing The School of Audiology and Speech Language Pathology The Marketing Supply Management Department The Department of Economics The School of Accountancy
Harrison School of Pharmacy The Communication and Journalism Department The Department of Human Development and Family Studies The Department of Counselor Education, Counseling Psychology, and School Psychology The Biggio Center for Teaching and Learning The Curriculum and Teaching Department The Department of Educational Foundations, Leadership, and Technology The Aerospace Engineering Department The Department of Agricultural Economics and Rural Sociology The Chemistry and Biochemistry Department The Biological Sciences Department The Department of Animal Sciences
39
Instruments
TFEQ-R21. The Three-Factor Eating Questionnaire-R21 (TFEQ-R21)
(Australian version) (See Appendix B) is a 21-item self-report instrument used to
measure Disordered Eating Behaviors (Stunkard & Messick, 1985). The original Three-
Factor Eating Questionnaire (TFEQ) contains 55 items. It was later reduced to 51 items
(Karlsson et al., 2000), then to 18 items, and finally added to in order to arrive at the
present 21-item revised version (Tholin, Rasmussen, Tynelius, & Karlsson, 2005). Items
1 through 16 are scored on a four-point Likert-type scale ranging from 1 (“definitely
true”) to 4 (“definitely false”). Items 17 through 20 have a unique four-point Likert-type
scale (See Appendix B) (Karlsson et al.). Item 21 is an eight-point Likert-type scale
anchored by “I eat whatever and whenever I want to” (1) and “I am constantly limiting
my food intake, never ‘giving in’” (8). The revised version (TFEQ-R21) is made up of
three subscales: Cognitive Restraint, Emotional Eating, and Uncontrolled Eating (de
Lauzon et al., 2004).
The Cognitive Restraint Subscale measures reported food restriction with the
purpose of influencing weight and shape (de Lauzon et al., 2004). It is comprised of six
items (1, 5, 11, 17, 18, and 21). Although the authors do not discuss any connections, the
Cognitive Restraint Subscale appears to measure certain facets of eating disorders which
might be associated with anorexia within the clinical population (See Appendix B).
The Emotional Eating Subscale assesses the reported tendency to overeat in
response to negative emotions (i.e., anxiety, depression, and loneliness) (de Lauzon et al.,
2004). It is made up of six items (2, 4, 7, 10, 14, and 16).
40
The Uncontrolled Eating Subscale measures the reported inability to maintain
control over eating when hungry or when food is present. It is comprised of nine items
(3, 6, 8, 9, 12, 13, 15, 19, and 20). Although no connection is drawn by the authors, the
Uncontrolled Eating Subscale appears to measure certain facets of eating disorders which
might be associated with bulimia within the clinical population (See Appendix B).
Responses to items 1 through 16 and item 21 are reverse scored. Raw scores for
each subscale are calculated by adding the Likert values for each item in that subscale.
These scores are then transformed by following a formula provided with the instructions
that accompany the instrument. Transformed scores are computed by subtracting the
number of items in the subscale from the raw score, dividing this number by the
difference between the maximum and minimum score, and then multiplying this number
by 100. Transformed scores thus fall in the 0-100 range. As per instructions in the test
manual, an individual's scale score is calculated only if the person has answered at least
one-half of that subscale’s items. Two people failed to answer all items on one of the
subscales but did answer more than one-half of the items on that scale. To compute the
subscale scores for these two individuals, the mean of completed items was computed
and then multiplied by the total number of items in the subscale. These scores were then
transformed using the formula mentioned above. Higher scores indicate more
uncontrolled eating, cognitive restraint, and emotional eating.
In a study (de Lauzon et al., 2004) of 236 male and 284 female participants (ages
14 to 27), the mean for males on the Cognitive Restraint Subscale was 18 (SD = 16) and
the mean for females was 34 (SD = 20). For participants between the ages of 30 and 67,
the mean for males was 22 (SD = 18) and the mean for females was 39 (SD = 21). On the
41
Uncontrolled Eating Subscale, male and female participants (ages 14 to 27) obtained
mean scores of 39 (SD = 19) and 35 (SD = 19), respectively, while male and female
participants (ages 30 to 67) obtained mean scores of 26 (SD = 18) and 27 (SD = 19),
respectively. On the Emotional Eating Subscale, male and female participants (ages 14
to 27) obtained mean scores of 26 (SD = 23) and 46 (SD = 29), respectively, while
participants (ages 30 to 67) obtained mean scores of 22 (SD = 25) for males and 43 (SD =
31) for females. Internal consistency for each subscale was found to range from .76 to
.85, based on Cronbach’s alpha (Karlsson et al., 2000). When correlated with similar
measures, such as the Restraint Scale (RS) and the Dutch Eating Behavior Questionnaire
(DEBQ-R), the TFEQ-R21 convergent validity was high, .74 and .89, respectively
(Allison, Kalinsky, & Gorman, 1992). There was a low correlation between the TFEQ-
R21 and measures of social desirability, such as the Edwards Social Desirability Scale
and the Marlowe-Crowne Social Desirability Scale (MCSD) (Allison et al.). The TFEQ-
R21 takes about 5 minutes to complete.
APS-R. The Almost Perfect Scale-Revised (APS-R) (See Appendix C) is an
instrument created to measure both negative (maladaptive) and positive (adaptive)
dimensions of perfectionism and their implications for counseling. The earlier Almost
Perfect Scale (APS) was created following a review of two qualitative studies in which
the characteristics of high standards, orderliness, and perception of a discrepancy
between those standards and actual performance seemed to be consistent across studies
among individuals who self-described themselves as perfectionists (Slaney et al., 2001).
The revised scale, the APS-R, is a 23-item self-report instrument that is composed of
three subscales: High Standards, Order, and Discrepancy. High Standards is related to

42
having high standards for one’s behavior. Order refers to organization or neatness. The
High Standards and Order subscales are thought to be related to positive features of
perfectionism, whereas Discrepancy, or the degree of perceived inconsistency between
one’s standard of behavior and one’s actual behavior, has been linked to the negative
characteristics of perfectionism. In developing the revised scale (APS-R), principal
component analysis confirmed the presence of three factors corresponding to the three
subscales (Slaney et al.). The total variance accounted for by these three factors was 45%
(Slaney et al.). The final revised version is comprised of seven items which make up the
High Standards subscale (1, 5, 8, 12, 14, 18, and 22), four items which made up the Order
subscale (2, 4, 7, and 10), and 12 items making up the Discrepancy subscale (3, 6, 9, 11,
13, 15, 16, 17, 19, 20, 21, and 23), which is considered to be representative of Negative
Perfectionism (Slaney et al.). Items from the Discrepancy subscale include “I often feel
frustrated because I can’t meet my goals” and “I rarely live up to my high standards”.
Ratings are based on a 7-point scale ranging from strongly disagree (1) to strongly agree
(7) (Mobley, Slaney, & Rice, 2005). Higher scores indicate greater perfectionism.
Normative data for the APS-R was derived from a sample of 1,533
undergraduates (Rice & Ashby, 2007). The mean score on the Discrepancy Subscale was
39.98 (SD = 15.15) for men, and 39.57 for women (SD = 15.50). Whereas scores on the
Discrepancy subscale that were equal to or greater than 45 were considered to be
representative of maladaptive perfectionism (or Negative Perfectionism), scores below 45
on the Discrepancy subscale were considered to represent adaptive perfectionism (Rice &
Ashby). Internal reliability based on Cronbach’s alpha ranged from .82 to .92. Internal
consistency for the three subscales ranged from .85 to .92. At intervals of three weeks
43
and eight to ten weeks, with correlations of .72 to .83 and .76 to .87, respectively, the
APS-R established good test-retest reliability (Rice & Ashby). The APS-R demonstrated
good convergent validity with the Multidimensional Perfectionism Scale (MPS) and the
Frost Multidimensional Perfectionism Scale (FMPS) (Rice & Ashby). It also
demonstrated appropriate concurrent validity with the Center for Epidemiologic
Studies—Depression scale (CES-D) and the Satisfaction With Life Scale (SWLS), with
maladaptive perfectionists, when compared to adaptive perfectionists, being more
depressed and reporting lower life satisfaction. Individuals who had been determined to
have adaptive perfectionism tended to have higher grade point averages (GPA) than those
individuals with maladaptive perfectionism (Rice & Ashby). The APS-R takes about 5
minutes to complete.
PSS-10. The Perceived Stress Scale (PSS-10) (See Appendix D) measures the
extent to which individuals perceive their life circumstances to be stressful (Cohen et al.,
1983). It was created for usage with community samples of individuals possessing at
least a junior high school education. A benefit of this instrument is that it is relatively
straightforward and uncomplicated and contains items that are general, and thus
appropriate for use with many individuals from the general population.
The original version (PSS-14) of the PSS-10 contains 14 items. However, a
factor analysis showed a one-factor solution with 10 of the 14 items (1, 2, 3, 6, 7, 8, 9, 10,
11, and 14) loading well with at least .42 and items 4, 5, 12, and 13 loading poorly (.17,
.33, .11, and .39). The PSS-10, a shorter version, resulted after the scale was reduced to
only the 10 items which loaded at .42 or above (1, 2, 3, 6, 7, 8, 9, 10, 11, and 14) and
when the four items (4, 5, 12, and 13) which had low loadings were removed (Cohen &
44
Williamson, 1988). The remaining items accounted for 48.9% of total variance, as
compared to the original version (41.6%). Four of the items (4, 5, 7, and 8) are positively
worded and the remaining six items (1, 2, 3, 6, 9, and 10) are negatively worded. Internal
consistency for the PSS-10 was determined by Cohen and Williamson to be .78
(Cronbach’s alpha). However, in more recent studies, internal consistency has ranged
from .87 to .89 (Croghan et al., 2006; Roberti, Harrington, & Storch, 2006). The PSS-10
includes items such as “In the last month, how often have you found that you could not
cope with all the things that you had to do?” and “In the last month, how often have you
felt that you were on top of things?” Ratings are based on a five-point scale ranging from
never (0) to very often (4) (Cohen & Williamson). The scores on the positively-phrased
items, 4, 5, 7, and 8, are coded in reverse. After reversing the scores on all positively-
phrased items, scores are then added together (“PSS Scoring,” n.d.). Higher scores
indicate greater Perceived Stress.
Normative information was gathered from a study involving 960 males and 1,427
females from a nonclinical population that were at least 18 years-of-age. The mean was
12.1 (SD = 5.9) among males and 13.7 (SD = 6.6) among females. The PSS-10 has
demonstrated convergent validity with other assessments of stress (Cohen et al., 1983;
Cohen & Williamson, 1988; Roberti et al., 2006). The PSS-10 had a positive, low to
moderate correlation, with intensity of stressful life events and it correlated moderately
with perceptions of stressfulness of life events (Cohen et al.). For example, low to
moderate correlations were found between PSS-10 and the College Student Life-Event
Scale (CSLES), with increased convergent validity (.24 to .49, p < .01) among two of the
three samples when the impact of life events was considered (Cohen et al.). Additionally,
45
the PSS-10 was more highly correlated with physical complaints and psychosomatic
difficulties in comparison to assessments of stressful life events and of perceptions of
stressfulness of life events (.52 to .70, p < .001) (Cohen et al.). Similarly, the PSS-10
was moderately correlated with social anxiety (.37 and .48, p < .001) (Cohen et al.).
There was good discriminant validity between the PSS-10 and the Sensation Seeking
Scale, Form V (SSS-V), the Santa Clara Strength of Religious Faith Questionnaire-Short
Form (SCSRFQ-SF), and the Overt Aggression (OA) subscale of the Adult Aggression
Scale (Roberti et al.). The PSS-10 takes about 5 minutes to complete.
Since the current study was only interested in the relationship between Negative
Perfectionism and Disordered Eating Behaviors, scores on the Almost Perfect Scale-
Revised (APS-R) subscales associated with positive forms of perfectionism--High
Standards and Order--were set aside and only scores on the Discrepancy subscale were
used. Instruments were administered in the following order: the Three-Factor Eating
Questionnaire-R21 (TFEQ-R21), the Almost Perfect Scale-Revised (APS-R), and the
Perceived Stress Scale (PSS-10).
46
RESULTS
Overview
The following section explains the analyses completed to test the hypotheses from
the previous section. The current study sought to demonstrate that there is a significant
relationship between the predictor variables, Perceived Stress and Negative
Perfectionism, and the criterion variable of Disordered Eating Behaviors among graduate
students. The Perceived Stress Scale (PSS-10) measured how stressful individuals
believed their life situations to be. The Discrepancy Subscale of the Almost Perfect
Scale-Revised (APS-R) was used to measure Negative Perfectionism, which was the
difference between one’s standard of behavior and one’s actual behavior. The TFEQ-
R21 is comprised of three separate subscales (Cognitive Restraint, Emotional Eating, and
Uncontrolled Eating). The Cognitive Restraint Subscale was used to measure food
constraint. The Emotional Eating subscale measured the tendency to overeat when
experiencing negative emotions. The Uncontrolled Eating Subscale measured inability to
avoid over eating. The instrument provides separate scores for each.
Determining Effect Size and Power
In order to determine the number of participants necessary to have sufficient
power, the researcher considered both a formula by Green (1991) and the results of a
power analysis completed using the computer program GPOWER (Erdfelder, Faul, &
47
Buchner, 1996; Faul & Erdfelder, 1992). Green suggested beginning with 104
participants and increasing the number by one for each independent variable. Thus, N ≥
104 + m, where m is equal to the number of predictor variables (Cohen, 1988; Green).
Based on the power analysis, using GPOWER (Erdfelder et al.; Faul & Erdfelder), 48
participants were needed, assuming a large effect size, with F(2, 45) = 3.2043 and
Lambda = 16.8 (f2 = .35, Power = .95, p < .05). Thirty-one participants were needed,
assuming a medium effect size as recommended by Cohen, F(2, 28) = 3.34 and Lambda
= 10.85 (f2 = .35, Power = .80, p < .05). The researcher reasoned that it would be better
to follow Green’s recommendation since his recommendation was for a larger number,
thereby increasing the power. Thus, the minimum N for the current study was 106
(Green).
Descriptive Statistics and Intercorrelations
Means, standard deviations, and ranges for the independent and dependent
variables are show in Table 2. Table 3 shows the intercorrelations among the
independent and dependent variables.
Preliminary Procedures and Hierarchical Multiple Regression
Hierarchical multiple regressions were performed to examine the independent
contributions of Perceived Stress and Negative Perfectionism on each dimension
(Uncontrolled Eating--UE, Cognitive Restraint--CR, and Emotional Eating--EE) of the
criterion variable. An interaction term was created to observe any possible interaction
effects, after the predictor variables were centered around their respective means (M =
40.98 for the Discrepancy Subscale and M = 17.66 for Perceived Stress Scale). Next,
48
scores from the Perceived Stress Scale and the Discrepancy Subscale were entered as
predictor variables into the first step of each hierarchical regression performed for each
dimension of the dependent variable (UE, CR, and EE). The newly created interaction
term was entered in the second step. The results of the regressions are shown in Tables 4,
5, and 6.
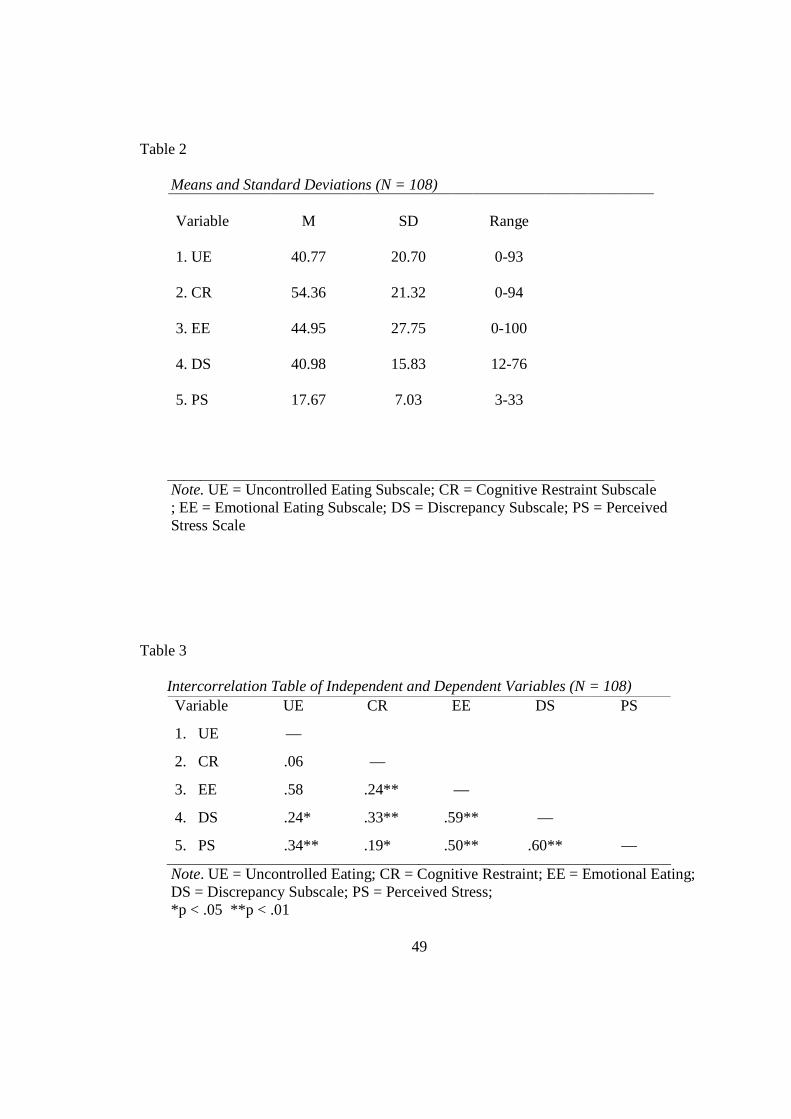
49
Table 2
Means and Standard Deviations (N = 108) Variable 1. UE 2. CR 3. EE 4. DS 5. PS
M
40.77
54.36
44.95
40.98
17.67
SD
20.70
21.32
27.75
15.83
7.03
Range
0-93
0-94
0-100
12-76
3-33
Note. UE = Uncontrolled Eating Subscale; CR = Cognitive Restraint Subscale ; EE = Emotional Eating Subscale; DS = Discrepancy Subscale; PS = Perceived Stress Scale
Table 3
Intercorrelation Table of Independent and Dependent Variables (N = 108)
Note. UE = Uncontrolled Eating; CR = Cognitive Restraint; EE = Emotional Eating; DS = Discrepancy Subscale; PS = Perceived Stress; *p < .05 **p < .01
Variable UE CR EE DS PS
1. UE —
2. CR .06 —
3. EE .58 .24** —
4. DS .24* .33** .59** —
5. PS .34** .19* .50** .60** —
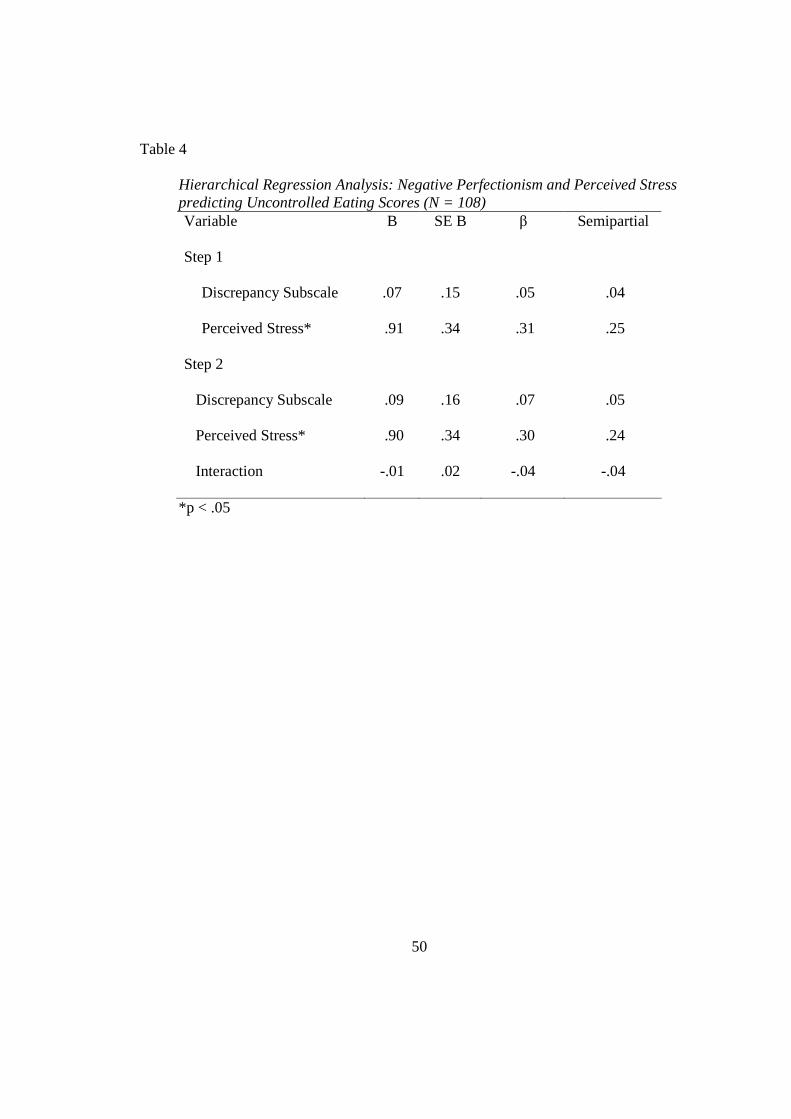
50
Table 4
Hierarchical Regression Analysis: Negative Perfectionism and Perceived Stress predicting Uncontrolled Eating Scores (N = 108) Variable B SE B β Semipartial Step 1
Discrepancy Subscale .07 .15 .05 .04
Perceived Stress* .91 .34 .31 .25
Step 2
Discrepancy Subscale .09 .16 .07 .05
Perceived Stress* .90 .34 .30 .24
Interaction -.01 .02 -.04 -.04
*p < .05
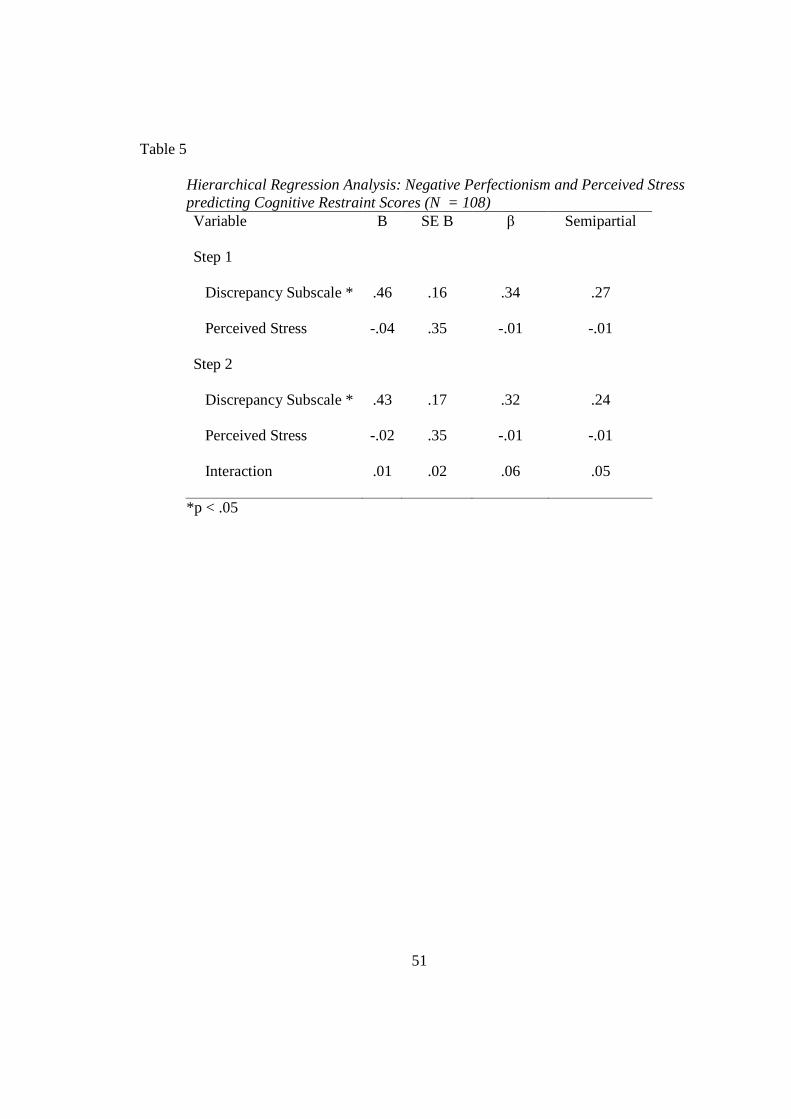
51
Table 5
Hierarchical Regression Analysis: Negative Perfectionism and Perceived Stress predicting Cognitive Restraint Scores (N = 108) Variable B SE B β Semipartial
Step 1
Discrepancy Subscale * .46 .16 .34 .27
Perceived Stress -.04 .35 -.01 -.01
Step 2
Discrepancy Subscale * .43 .17 .32 .24
Perceived Stress -.02 .35 -.01 -.01
Interaction .01 .02 .06 .05
*p < .05
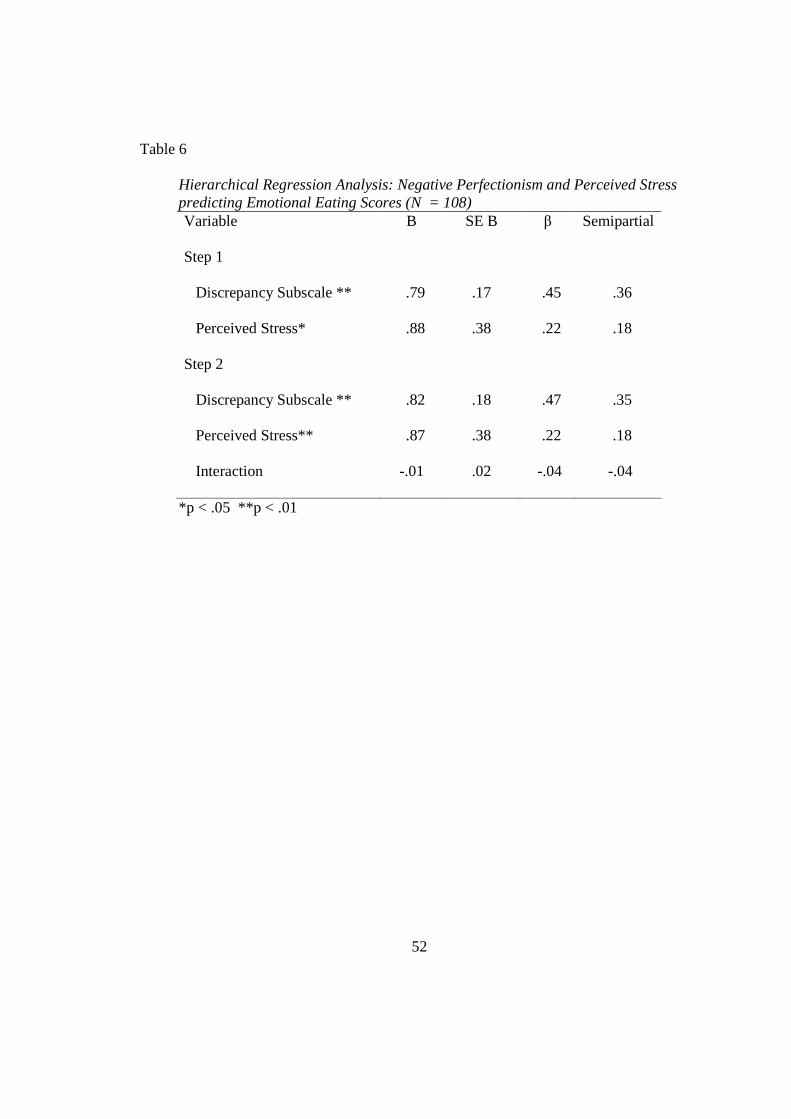
52
Table 6
Hierarchical Regression Analysis: Negative Perfectionism and Perceived Stress predicting Emotional Eating Scores (N = 108) Variable B SE B β Semipartial
Step 1
Discrepancy Subscale ** .79 .17 .45 .36
Perceived Stress* .88 .38 .22 .18
Step 2
Discrepancy Subscale ** .82 .18 .47 .35
Perceived Stress** .87 .38 .22 .18
Interaction -.01 .02 -.04 -.04
*p < .05 **p < .01
53
Hypotheses Restated and Results Together, Perceived Stress, as measured by the PSS-10, and Negative
Perfectionism, as measured by the Discrepancy Subscale, accounted for a significant
amount of the variance in the Uncontrolled Eating Subscale (UE) with R2 = .12 and
Adjusted R2 = .10, F(2, 105) = 6.87, p < .05. These predictor variables also accounted for
a significant amount of variance in the Cognitive Restraint Subscale (CR) with R2 = .11
and Adjusted R2 = .09, F(2, 105) = 6.56, p < .05 and in the Emotional Eating Subscale
(EE) with R2 = .38 and Adjusted R2 = .36, F(2, 105) = 31.68, p < .001.
Hypotheses 1a and 1b
1a: Negative Perfectionism, as measured by the Discrepancy Subscale of the
Almost Perfect Scale-Revised (APS-R), will account for a significant amount of variance
in Disordered Eating Behavior, as measured by the UE Subscale of the TFEQ-R21, above
and beyond the variance accounted for by the PSS-10, with high scores on the
Discrepancy Subscale being associated with high scores on the UE Subscale.
1b: Perceived Stress, as measured by the PSS-10, will account for a significant
amount of variance in Disordered Eating Behavior, as measured by the UE Subscale of
the TFEQ-R21, above and beyond the variance accounted for by the Discrepancy
Subscale, with high scores on the PSS-10 being associated with high scores on the UE
Subscale.
Results of Analysis of Hypotheses 1a and 1b:
As shown in Table 4, scores on the PSS-10 accounted for a significant amount of
variance (6.3%; r = .25, b = .91, SEB = .34, β = .31, p < .01) on the UE Subscale, above
54
and beyond the variance accounted for by the Discrepancy Subscale. Scores on the
Discrepancy Subscale did not account for a significant amount of unique variance on the
UE Subscale (b = .07, SEB = .15, β = .05, p = .66) above and beyond the variance
accounted for by PSS-10. Thus, Perceived Stress predicted a significant amount of
unique variance in Uncontrolled Eating, but Negative Perfectionism did not. The
findings suggest that the greater the perceived stress experienced by participants, the less
likely they were able to control their eating.
Hypotheses 2a and 2b
2a: Negative Perfectionism, as measured by the Discrepancy of the APS-R, will
account for a significant amount of variance in Disordered Eating Behavior, as measured
by the Cognitive Restraint Subscale (CR) of the TFEQ-R21, above and beyond the
variance accounted for by the PSS-10, with high scores on the Discrepancy Subscale
being associated with high scores on the CR Subscale.
2b: Perceived Stress, as measured by the PSS-10, will account for a significant
amount of variance in Disordered Eating Behavior, as measured by the CR Subscale of
the TFEQ-R21, above and beyond the variance accounted for by the Discrepancy
Subscale, with high scores on the PSS-10 being associated with high scores on the CR.
Results of Analysis of Hypotheses 2a and 2b:
As shown in Table 5, scores on the Discrepancy Subscale accounted for 7.3% (r =
.27, b = .46, SEB = .16, β = .34, p < .01) of the variance on the CR Subscale, above and
beyond the variance accounted for by the PSS-10. The PSS-10 did not account for a
significant amount of the variance on the CR (b = -.04, SEB = .35, β = -.01, p = .92),
above and beyond the variance accounted for by the Discrepancy Subscale. Thus,
55
Negative Perfectionism did predict a significant amount of unique variance in Cognitive
Restraint, but Perceived Stress did not. According to these results, the greater the
discrepancy between participants’ preferred standards and their perception of the
standards they had obtained, the more likely they were to restrict their food intake to
manage their weight.
Hypotheses 3a and 3b
3a: Negative Perfectionism, as measured by the Discrepancy Subscale of the
APS-R, will account for a significant amount of variance in Disordered Eating Behavior,
as measured by the Emotional Eating Subscale (EE) of the TFEQ-R21, above and beyond
the variance accounted for by the PSS-10, with high scores on the Discrepancy Subscale
being associated with high scores on the EE.
3b: Perceived Stress, as measured by the PSS-10, will account for a significant
amount of variance in Disordered Eating Behavior, as measured by the Emotional Eating
Subscale (EE) of the TFEQ-R21, above and beyond the variance accounted for by the
Discrepancy Subscale, with high scores on the PSS-10 being associated with high scores
on the EE Subscale.
Results of Analysis of Hypotheses 3a and 3b:
As shown in Table 6, scores on the Discrepancy Subscale accounted for 13% (r =
.36, b = .79, SEB = .17, β = .45, p < .01) of the variance on the EE, above and beyond the
variance accounted for by the PSS-10. Scores on the PSS-10 accounted for 3.2% (r = .18,
b = .88, SEB = .38, β = .22, p < .05) of the variance on the EE, above and beyond the
variance accounted for by the Discrepancy Subscale. Therefore, both Negative
Perfectionism and Perceived Stress predicted a significant amount of unique variance in
56
Emotional Eating. Based on these results, the greater the stress experienced and the
greater the discrepancy between participants’ high standards and their obtainment of
those high standards, the more likely they were to overeat in response to negative
emotions.
Supplementary Analysis
Although a specific hypothesis was not created to test for whether either
independent variable moderated the other, it was logical to ask whether there was a
significant interaction between the two. To examine this, an interaction term was created
and entered into the regression equation (Tables 4, 5, and 6). The interaction between
scores on the PSS-10 and on the Discrepancy Subscale was insignificant for the UE, CR,
and EE Subscales. Since the interaction effect was not significant, it was determined that
neither independent variable moderated the other on Uncontrolled Eating, Cognitive
Restraint, or Emotional Eating.
57
DISCUSSION
Review of Findings
The current study examined the relationship between Perceived Stress, Negative
Perfectionism, and Disordered Eating Behaviors among graduate students. More
specifically, the current study sought to test the hypothesis that an individual’s perception
of how stressful her life is (measured by the PSS-10) and the discrepancy between one’s
desired and actual performance (Discrepancy Subscale of the APS-R) would account for
a significant amount of unique variance in the amount of food restriction the individual
engaged in to control her weight and shape (Cognitive Restraint Subscale-CR of the
TFEQ-R21). Also, the current study sought to test the hypothesis that an individual’s
perception of how stressful her life is and the discrepancy between the individual’s
desired and actual performance would account for a significant amount of unique
variance in one’s ability to refrain from over eating (Uncontrolled Eating Subscale-UE of
the TFEQ-R21). In addition, this study sought to test the hypothesis that an individual’s
perception of how stressful her life is and the discrepancy between one’s desired and
actual performance would account for a significant amount of unique variance in the
individual’s propensity to overeat when experiencing negative emotions (Emotional
Eating Subscale-EE of the TFEQ-R21). Based on the results, Perceived Stress was
significantly and uniquely related to graduate students’ tendency to eat uncontrollably
(UE) and to eat in response to experiences of negative emotions (EE). Thus, the more
58
stressful participants perceived their lives to be, the more difficulty they reported having
with controlling what they ate. Graduate students who reported higher Negative
Perfectionism were not only more likely to eat more in response to negative emotions
(EE), but they also were likely to limit the foods that they ate (CR). These findings were
consistent with other studies in which a significant relationship between stress and binge
eating (Crowther et al., 2001; Harrington et al., 2006; Nguyen-Rodriguez et al., 2008;
Sims et al., 2008) and between perfectionism and anorexia was observed (Cockell et al.,
2002; Kiemle et al., 1987; Polivy & Herman, 2002; Striegel-Moore & Bulik, 2005; Tyrka
et al., 2002).
In comparison to studies involving samples of undergraduates, the correlations in
the current study were either roughly identical or somewhat weaker. For example in a
study by Harrington et al. (2006), the relationship between Perceived Stress, as measured
by the Perceived Stress Scale (PSS-14), and binge eating, as measured by The Eating
Expectancies Inventory (EEI), was small but roughly equal to the partial correlation
between Perceived Stress and Uncontrolled Eating in the current study. Yet, the
relationship between Perceived Stress and binge eating in Harrington et al.’s study was
greater than the correlation between Perceived Stress and Emotional Eating in the current
study. In Harrington et al.’s study, Perceived Stress accounted for a greater percentage of
the variance in binge eating. In the current study, Perceived Stress accounted for only
3.2% of the variance in Emotional Eating, as measured by the TFEQ-R21. In comparison
to the normative sample, the scores on the Perceived Stress Scale (PSS-10) in the current
study were, on average, higher. It should be noted that the Uncontrolled Eating Scale
59
appears to measure aspects of bulimia (See Appendix B) while the Cognitive Restraint
Scale appears to measure aspects of anorexia.
Holston and Cashwell (2000) found a moderate zero-order correlation between
neurotic perfectionism (possession of unrealistically high standards and fear of failure)
(Mitzman, Slade, & Dewey, 1994), as measured by the Neurotic Perfectionism
Questionnaire (NPQ), and Disordered Eating Behavior, as measured by the Eating
Disorders Inventory (EDI). In the current study, the correlations between Negative
Perfectionism and Cognitive Restraint, and between Negative Perfectionism and
Emotional Eating were weak to moderate. Although the above mentioned instruments
appear to be very similar, any comparisons or conclusions should be made with caution.
Although less variance in scores on a measure of disordered eating (assessed
using the three scales of the TFEQ-R21) was explained by variance in scores on a
measure of Negative Perfectionism (Discrepancy Scale of the APS-R) and a measure of
Perceived Stress (PSS-10), it appears that on average, graduate students obtain scores
comparable to undergraduates on the measures used in the current study. For example
the mean in this current study was 40.98 on the Discrepancy Subscale, while the mean in
Rice and Ashby’s (2007) study was 39.80. The standard deviation in both studies was
approximately 15 to 16. In the current study the mean for Perceived Stress was 17.67,
and the mean in Croghan et al.’s (2006) study was 17.7. The standard deviation in both
studies was approximately 7. The means in the current study on a measure of Disordered
Eating (TFEQ-R21) were 40.77 (SD = 20.70) for Uncontrolled Eating, 54.36 (SD =
21.32) for Cognitive Restraint, and 44.95 (SD = 27.75) for Emotional Eating, while the
60
means in Mosher and Danoff-Burg’s (2008) study for Uncontrolled Eating was 38.17 (SD
= 19.36), for Cognitive Restraint was 42.55 (SD = 27.66), and for Emotional Eating was
32.14 (SD = 29.26) on the TFEQ-R18. The TFEQ-R18 and the TFEQ-R21 only differ by
three items which were added to the TFEQ-R18 to create the TFEQ-R21. Because of the
way the means are computed, one would expect slightly lower scores on the TEFQ R18.
When we compare the current study to the Mosher and Danoff-Burg’s (2008) study, we
see comparable mean values. It should be noted that neither the graduate students in the
current study nor the undergraduate students in Rice and Ashby’s study obtained mean
scores on the Discrepancy Scale of the APS-R that indicated maladaptive (negative)
perfectionism.
Although many studies have examined the relationship between Disordered
Eating Behaviors and Perceived Stress and between disordered eating and Negative
Perfectionism, none—to the researcher’s knowledge—have examined these relationships
among graduate students. The current study sought to provide useful information for
better understanding of Disordered Eating Behaviors within the graduate population.
More information about implications and suggestions concerning how this information
might be useful is included following the summary.
Limitations
One limitation of the current study was that this study relied on self-report. As is the
case with all surveys, there was a chance of response bias. That is, participants may have
over- or underreported their experiences. For example, with regard to reporting of
Disordered Eating Behaviors, participants might have been motivated to under-report such
61
behaviors. In general, participants might have responded in a socially-desirable manner or
may have exaggerated their difficulties. Thus, their responses might not accurately reflect
their true response. However, Allison, Kalinsky, and Gorman (1992) found that scores on
the TFEQ-R21 did not correlate significantly with measures of social desirability.
Additional limitations were related to the demographics of the sample. One such
problem was that the sample size was small. A larger sample would have increased the
power of the independent variables to predict changes in the dependent variable, thereby
decreasing the likelihood of committing a Type II error—or of failing to find an effect
when one is actually present. Thus, it might be beneficial in the future to recruit a larger
sample size. Also, the sample was one of convenience. Thus, generalizability is limited
to some extent by non-random sampling. Attempts were made to recruit from classes
that were anticipated to have high female enrollment. Thus, experiences of other female
graduate students may not have been well represented. Furthermore, by design, only
females were included in this study. As previously discussed, Disordered Eating
Behaviors also occur in males. Other studies are needed to extend the knowledge base
about males and disordered eating.
The sample consisted largely of White females (75.93%). Therefore the results
might not be generalizable to other ethnic and/or culture groups. It might be worthwhile to
recruit samples with larger numbers of ethnic minorities to understand better how these
predictors work with diverse populations.
Also, the mean in the current study on a measure of Negative Perfectionism (the
APS-R) did not reflect a serious problem as it was below the recommended cutoff for
62
Negative Perfectionism. This raises questions as to how restricted the range on Negative
Perfectionism is.
Finally, the current study proposed that Perceived Stress would predict
Disordered Eating Behaviors. The Perceived Stress Scale (PSS-10) was used to measure
the extent to which life circumstances were believed to be stressful. This instrument may
not account for the unique stressors of graduate school. It might be beneficial, in future
studies, to use a measure of stress that takes into account conditions specific to graduate
school (i.e., the Graduate Stress Inventory) (Rocha-Singh, 1994).
Summary
In summary, the relationships between Disordered Eating Behaviors and many
factors have been examined and described throughout the literature. Several factors have
been linked to Disordered Eating Behaviors. Perceived Stress and Negative
Perfectionism are two factors that have been found to be related to Disordered Eating
Behaviors. Until now, these relationships have been largely examined in adolescent and
undergraduate populations. The current study examined the relationship between
Disordered Eating Behaviors and Perceived Stress and between Disordered Eating
Behaviors and Negative Perfectionism among graduate students. The three subscales of
the TFEQ-R21 (Uncontrolled Eating, Cognitive Restraint, and Emotional Eating) were
used to measure Disordered Eating Behaviors. The Discrepancy Scale of the Almost
Perfect Scale-Revised (APS-R) was used to measure Negative Perfectionism and the
Perceived Stress Scale (PSS-10) was used to measure Perceived Stress. The results of
hierarchical regressions indicated that Perceived Stress uniquely predicted increases in
63
Uncontrolled Eating and Emotional Eating while Negative Perfectionism uniquely
predicted increases in Cognitive Restraint and Emotional Eating in graduate students.
Although these findings were significant, the actual amount of variance accounted for
was rather low. Even though the current study had limitations, its purpose was to fill a
gap in the literature by examining Disordered Eating Behaviors among graduate students.
It is the researcher’s hope that the current study might, in addition to increasing
awareness, lead to an increase in resources for the prevention and intervention of
Disordered Eating Behaviors among graduate students.
Implications
Directions for future studies. Although the current study’s focus was not on
differences between graduate and undergraduate students, it might be worthwhile to
empirically compare these two populations. Also, the current study only examined the
relationship between Negative Perfectionism, Perceived Stress, and Disordered Eating
Behaviors among females. It might be useful to look at differences between men and
women. Additionally, since more variance was accounted for by Perceived Stress in
Harrington et al.’s (2006) study with undergraduates than in the current study of graduate
students, future studies might focus on specific types of stressors (e.g., finance) rather
than on general stress. Also, the predictor variables, Negative Perfectionism and
Perceived Stress, only explained a small amount of variance in each dimension (CR, UE,
and EE) of the criterion variable, Disordered Eating Behaviors. Thus, it is possible that
variance in Disordered Eating Behaviors might be better accounted for in graduate
students by other factors, such as living conditions or financial concerns (e.g., loans, etc.).
64
Usefulness of findings . These findings might be useful to professionals who aid in
the prevention and intervention of Disordered Eating Behaviors. This includes, but may
not be limited to, mental health professionals, medical professionals, and educational
professionals. For example, instructors, advisors, and supervisors (i.e., for residencies,
practicums, and assistantships) often work in close proximity to graduate students. Thus,
they might have a crucial role in the early detection of a student at risk for, or suffering
from, Disordered Eating Behaviors.
This information might also be useful to mental and medical health professionals.
Often times, these professionals may come in contact with graduate students who present
with other concerns. If health professionals, such as nurses, physicians, psychologists,
and psychiatrists better understand the relationship between Perceived Stress, Negative
Perfectionism, and Disordered Eating Behaviors, they might be better able to identify
individuals at risk. Their role in prevention and intervention could be essential since, by
virtue of their professions, these individuals are more likely to interact with students
within an environment (e.g., psychotherapy) that might be perceived as one of safety and
which might be conducive to students’ willingness to share and openly discuss their
symptoms and concerns.
65
REFERENCES
Allison, D., Kalinsky, L., & Gorman, B. (1992). A comparison of the psychometric
properties of three measures of dietary restraint. Psychological Assessment, 4,
391-398.
Alpers, G., & Tuschen-Caffier, B. (2001). Negative feelings and the desire to eat in
bulimia nervosa. Eating Behaviors, 2, 339-352. Retrieved July 07, 2006, from
PsycARTICLES database.
American Psychiatric Association. (2000). Diagnostic and statistical manual of mental
disorders (4th ed., text rev.). Washington, DC: American Psychiatric Association.
Anderluh, M., Tchanturia, K., Rabe-Hesketh, S., & Treasure, J. (2003). Childhood
obsessive-compulsive personality traits in adult women with eating disorders:
Defining a broader eating disorder phenotype. American Journal of Psychiatry,
160, 242-247. Retrieved September 8, 2008, from the American Psychiatry
Association website.
Anderson, M., & Swazey, J. (1998). Reflections on the graduate student experience: An
overview. New Directions for Higher Education, 101, 3-13. Retrieved March 25,
2009, from Wiley Interscience database.
Arnett, J. L. (2006). Psychology and health. Canadian Psychology, 47, 19-32. Retrieved
May 10, 2006, from PsycARTICLES database.
66
Bastiani, A., Rao, R., Wetlzin, T., & Kaye, W. (1995). Perfectionism in anorexia nervosa.
International Journal of Eating Disorders, 17, 147-152. Retrieved April 18, 2007,
from PsycINFO database.
Choy, S. P., Geis, S., & Malizio, A. G. (2002). Student financing of graduate and first-
professional education, 1990-2000: Profiles of students in selected degree
programs and their use of assistantships (NCES No. 2002-166, pp. 1-171).
Retrieved April 02, 2009, from the National Center for Education Statistics
website.
Choy, S., & Cataldi, E. (2006). Student financing of graduate and first-professional
Education, 2003-04: Profiles of students in selected degree programs and part-
time students (NCES No. 2006-185, pp. 1-139). Retrieved April 02, 2009, from
the National Center for Education Statistics website.
Cockell, S., Hewitt, P., Seal, B., Sherry, S., Goldner, E., Flett, G., et al. (2002). Trait and
self-presentational dimensions of perfectionism among women with anorexia
nervosa. Cognitive Therapy and Research, 26, 745-758. Retrieved April 18, 2007,
from PsycINFO database.
Cohen, J. (1988). Statistical power analysis for the behavioral sciences (2nd ed.). New
York: Academic.
Cohen, S., Kamarck, T., & Mermelstein, R. (1983). A global measure of perceived stress.
Journal of Health and Social Behavior, 24, 385-396.
Cohen, S., & Williamson, G. (1988). Perceived stress in a probability sample of the U.S.
In S. Spacapam & S. Oskamp (Eds.), The social psychology of health: Claremont
67
symposium on applied social psychology (pp. 31-67). Newbury Park, CA: Sage.
Croghan, I., Bronars, C., Patten, C., Schroeder, D., Nirelli, L., Thomas, J., et al. (2006). Is
smoking related to body image satisfaction, stress, and self-esteem in young
adults? American Journal of Health Behavior, 30, 322-333. Retrieved September
22, 2008, from Ebscohost database.
Crowther, J., Sanftner, J., Bonifazi, D., & Shepherd, K. (2001). The role of daily hassles
in binge eating. International Journal of Eating Disorders, 29, 449-454. Retrieved
April 19, 2007, from PsycINFO database.
Cummins, L., Simmons, A., & Zane, N. (2005). Eating disorders in Asian populations: A
critique of current approaches to the study of culture, ethnicity, and eating
disorders. American Journal of Orthopsychiatry, 75, 553-574.
Davis, C. (1997). Normal and neurotic perfectionism in eating disorders: An interactive
model. International Journal of Eating Disorders, 22, 421-426. Retrieved April
18, 2007, from PsycINFO database.
Davis, C., & Scott-Robertson, L. (2000). A psychological comparison of females with
anorexia nervosa and competitive male bodybuilders: Body shape ideals in the
extreme. Eating Behaviors, 1, 33-46. Retrieved July 07, 2006, from
PsycARTICLES database.
Davis, S., Bissler, D., & Leiter, J. (2001). Leveling the playing field: An orientation to
graduate study in sociology. Teaching Sociology, 29, 454-462. Retrieved March
18, 2009, from Ebscohost database.
DeBerard, M., Spielmans, G., & Julka, D. (2004). Predictors of academic achievement
68
and retention among college freshmen: A longitudinal study. College Student
Journal, 38, 66-80. Retrieved March 24, 2009, from Ebscohost database.
De Lauzon, B., Romon, M., Deschamps, V., Lafay, L., Borys, J., Karlsson, J., et al.
(2004). The three-factor eating questionnaire-r18 is able to distinguish among
different eating patterns in a general population. Journal of Nutrition, 134, 2372-
2380.
Denisoff, E., & Endler, N. (2000). Life experiences, coping, and weight preoccupation
in young adult women. Canadian Journal of Behavioural Science, 32, 97-103.
DiGioacchino, R., Sargent, R., & Topping, M. (2001). Body dissatisfaction among White
and African American male and female college students. Eating Behaviors, 2, 39-
50. Retrieved July 07, 2004, from PsycARTICLES database.
Dobmeyer, A., & Stein, D. (2003). A prospective analysis of eating disorder risk factors:
Drive for thinness, depressed mood, maladaptive cognitions and ineffectiveness.
Eating Behaviors 4, 135-147. Retrieved September 8, 2008, from ScienceDirect
database.
Dodds, J. (1986). Supervision of psychology trainees in field placements. Professional
Psychology: Research and Practice, 17, 296-300.
Erdfelder, E., Faul, F., & Buchner, A. (1996). GPOWER: A general power analysis
program. Behavior Research Methods, Instruments, and Computers, 28, 1-11.
Fairburn, C., Shafran, R., & Cooper, Z. (1999). A cognitive behavioural theory of
anorexia nervosa. Behaviour Research and Therapy, 37, 1-13.
Faul, F., & Erdfelder, E. (1992). GPOWER: A priori, post-hoc, and compromise power
69
analyses for MS-DOS (Version 2.0) [Computer software]. Bonn, Federal
Republic of Germany: Bonn University, Department of Psychology. Available
from http://www.psycho.uni-duesseldorf.de/aap/projects/gpower/
Fischer, B., & Zigmond, M. (1998). Survival skills for graduate school and beyond. New
Directions for Higher Education, 101, 29-40. Retrieved March 25, 2009, from
Wiley Interscience database.
Forbush, K., Heatherton, T., & Keel, P. (2007). Relationships between perfectionism and
specific disordered eating behaviors. International Journal of Eating Disorders,
40, 37-41.
Franco-Paredes, K., Mancilla-Diaz, J., Vásquez-Arévalo, R., López-Aguiler, X., &
Álvarez-Rayón, G. (2005). Perfectionism and eating disorders: A review of the
literature. European Eating Disorders Review, 13, 61-70. Retrieved April 16,
2007, from PsycINFO database.
Friedlander, M. L., Keller, K. E., Peca-Baker, T. A., & Olk, M. A. (1986). Effects of role
conflict on counselor trainees' self-statements, anxiety level, and performance.
Journal of Counseling Psychology, 33, 73-77. Retrieved December 1, 2008, from
Ebscohost database.
Fryer, S., Wallace, G., & Kroese, B. (1997). Stress, coping, and disturbed eating attitudes
in teenage girls. International Journal of Eating Disorders, 22, 427-436.
Retrieved April 20, 2007, from PsycINFO database.
Gardner, S. (2008). “What’s too much and what’s too little?”: The process of becoming
70
an independent researcher in doctoral education. The Journal of Higher
Education, 79, 326-350.
Garner, D., Olmstead, M., & Polivy, J. (1983). Development and validation of a
multidimensional eating disorder inventory for anorexia nervosa and bulimia.
International Journal of Eating Disorders, 2, 15–34.
Gerner, B., & Peter, H. (2005). The relationship between friendship factors and
adolescent girls’ body image concern, body dissatisfaction, and restrained eating.
International Journal of Eating Disorders, 37, 313-320. Retrieved June 09, 2006,
from PsycARTICLES database.
Gleaves, B., Brown, J., & Warren, C. (2004). The continuity/discontinuity models of
eating disorders: A review of the literature and implications for assessment,
treatment, and prevention. Behavior Modification, 28, 739-762. Retrieved March
26, 2009, from Ebscohost databse.
Gluck, M., & Geliebter, A. (2002). Racial/ethnic differences in body image and eating
behaviors. Eating Behaviors, 3, 143-151. Retrieved June 09, 2006, from
PsycARTICLES database.
Golde, C. (2005). The role of the department and discipline in doctoral student attrition:
Lessons from four departments. The Journal of Higher Education, 76, 669-700.
Retrieved August 24, 2008, from Academic Search Premier database.
Green, S. B. (1991). How many subjects does it take to do a regression analysis?
Multivariate Behavioral Research, 26, 499-510.
Harrington, E., Crowther, J., Payne Henrickson, H., & Mickelson, K. (2006). The
71
relationship among trauma stress, ethnicity, and binge eating. Cultural Diversity
and Ethnic Minority Psychology, 12, 212-229. Retrieved June 09, 2006, from
PsycARTICLES database.
Hewitt, P., Gordon, L., & Ediger, E. (1995). Perfectionism traits and perfectionistic self-
presentation in eating disorder attitudes, characteristics, and symptoms.
International Journal of Eating Disorders, 18, 317-326. Retrieved June 09, 2006,
from PsycARTICLES database.
Holston, J., & Cashwell, C. (2000). Family functioning and eating disorders among
college women: A model of prediction. Journal of College Counseling, 3, 5-16.
Retrieved September 12, 2008, from Ebscohost database.
Hrabosky, J. I., Masheb, R. M., White, M.A., & Grilo, C. M. (2007). Overvaluation of
shape and weight in binge eating disorder. Journal of Consulting and Clinical
Psychology, 75, 175-180. Retrieved November 29, 2008, from PsycARTICLES
database.
Jenkins, S., Rew, L., & Sternglanz, W. (2005). Eating behaviors among school-age
children associated with perceptions of stress. Issues in Comprehensive Pediatric
Nursing, 28, 175-191. Retrieved April 20, 2007, from PsycINFO database.
Jiménez-Murcia, S., Fernández-Aranda, F., Raich, R., Alonso, P., Krug, I., Jaurrieta, N.,
et al. (2007). Obsessive-compulsive and eating disorders: Comparison of clinical
and personality features. Psychiatry and Clinical Neurosciences, 61, 385-391.
Retrieved September 8, 2008, from Ebscohost database.
Johnson, B., Batia, A. S., & Huan, J. (2008). Perceived stress among graduate students:
72
Roles, responsibilities, and social support. (Survey). Virginia Association of
Health, Physical Education, Recreation, and Dance Journal, 29(3), 31-36.
Retrieved December 1, 2008, from Academic OneFile database.
Joiner, T., Heatherton, T., Rudd, M., & Schmidt, N. (1997). Perfectionism, perceived
weight status, and bulimic symptoms: Two studies testing a diathesis-stress
model. Journal of Abnormal Psychology, 106, 145-153. Retrieved April 18, 2007,
from PsycINFO database.
Kandiah, J., Yake, M., Jones, J., & Meyer, M. (2006). Stress influences appetite and
comfort food preferences in college women. Nutrition Research, 26, 118-123.
Retrieved April 20, 2007, from PsycINFO database.
Karlsson, J., Persson, L-O., Sjöström, L., & Sullivan, M. (2000). Psychometric properties
and factor structure of the Three-Factor Eating Questionnaire (TFEQ) in obese
men and women: Results from the Swedish Obese Subjects (SOS) study.
International Journal of Obesity, 24, 1715-1725.
Kiemle, G., Slade, P., & Dewey, M. (1987). Factors associated with abnormal eating
attitudes and behaviors: Screening individuals at risk of developing an eating
disorder. International Journal of Eating Disorders, 6, 713-724. Retrieved April
18, 2007, from PsycINFO database.
Lafferty, J. C., & Lafferty, L. F. (1996). Perfectionism: A sure cure for happiness.
Plymouth, MI: Human Synergistics, Inc.
Landa, C., & Bybee, J. (2007). Adaptive elements of aging: Self-image discrepancy,
perfectionism, and eating problems. Developmental Psychology, 43, 83-93.

73
Leit, R., Pope, H., & Gray, J. (2001). Cultural expectations of muscularity in men: The
evolution of playgirl centerfolds. International Journal of Eating Disorders, 29,
90-93. Retrieved June 09, 2006, from PsycARTICLES database.
Lieberman, M., Gauvin, L., Bukowski, W., & White, D. (2001). Interpersonal influence
and disordered eating behaviors in adolescent girls: The role of peer modeling,
social reinforcement, and body-related teasing. Eating Behaviors, 2, 215-236.
Retrieved July 07, 2006, from PsycARTICLES database.
ManejÍas-Parke, S., Yager, J., & Apfeldorf, W. (2008). Severe eating disorder initially
diagnosed in a 72 year-old man. International Journal of Eating Disorders, 41,
376-379. Retrieved March 02, 2008, from Wiley Interscience database.
Marmorstein, N. R., von Ranson, K. M., Iacono, W. G., & Malone, S. M. (2008).
Prospective associations between depressive symptoms and eating disorder
symptoms among adolescent girls. International Journal of Eating Disorders, 41,
118-123. Retrieved December 1, 2008, from Wiley InterScience database.
Matthews, D. (2001). Eating disorders sourcebook: Basic consumer health information
about eating disorders, including information about anorexia nervosa, bulimia
nervosa, binge eating, body dysmorphic disorder, pica, laxative abuse, and night
eating syndrome along with information about causes, adverse effects, and
treatment and prevention issues, and featuring a section on concerns specific to
children and adolescents, a glossary, and resources for further help and
information. Detroit, MI: Omnigraphics.
McCann, B., Warnick, G., & Knopp, R. (1990). Changes in plasma lipids & dietary
74
intake accompanying shifts in perceived workload & stress. Psychosomatic
Medicine, 52, 97-108.
McLaren, L., Gauvin, L., & Steiger, H. (2001). A two-factor model of disordered eating.
Eating Behaviors, 2, 51-65. Retrieved July 07, 2006, from PsycARTICLES
database.
Melaney, G. (1987). Why students pursue graduate education, how they find out about a
program, and why they apply to a specific school. College and University, 62,
247-258.
Meno, C., Hannum, J., Espelage, D., & Low, K. (2008). Familial and individual variables
as predictors of dieting concerns and binge eating in college females. Eating
Behaviors, 9, 91-101. Retrieved August 16, 2008, from ScienceDirect database.
Michel, D., & Willard S. (2003). When dieting becomes dangerous: A guide to
understanding and treating anorexia and bulimia. New Haven, CT: Yale
University Press.
Miller, J., Schmidt, L., Vaillancourt, T., McDougall, P., & Laliberte, M. (2006).
Neuroticism and introversion: A risky combination for disordered eating among a
non-clinical sample of undergraduate women. Eating Behaviors, 7, 69-78.
Retrieved September 8, 2008, from ScienceDirect database.
Milligan, R., Waller, G., & Andrews, B. (2002). Eating disturbances in female prisoners:
The role of anger. Eating Behaviors, 3, 123-132. Retrieved July 07, 2006, from
PsycARTICLES database.
Mitchell, L. (1996). The ultimate grad school survival guide. Princeton, NJ: Peterson’s.
75
Mitzman, S., Slade, R., & Dewey, M. (1994). Preliminary development of a
questionnaire designed to measure neurotic perfectionism in eating disorders.
Journal of Clinical Psychology, 50, 516-520. Retrieved September 12, 2008, from
Ebscohost database.
Mobley, M., Slaney, R., & Rice, K. (2005). Cultural validity of the almost perfect scale-
revised for African American college students. Journal of Counseling
Psychology, 52, 629-639.
Mosher, C.E., & Danoff-Burg, S. (2008). Agentic and communal personality traits:
Relations to disordered eating behavior, body shape concern, and depressive
symptoms. Eating Behaviors, 9, 497-500. Retrieved January 28, 2009, from
ScienceDirect database.
Murnen, S. K., & Smolak, L. (1997). Femininity, masculinity, and disordered eating: A
meta-analytic review. International Journal of Eating Disorders, 22, 231-242.
Retrieved June 06, 2006, from PsycARTICLES database.
Mutterperl, J., & Sanderson, C. (2002). Mind over matter: Internalization of the thinness
norm as a moderator of responsiveness to norm misperception education in
college women. Health Psychology, 21, 519-523.
Nagel, M. (2002). Perfectionism, mood states, and disordered eating in female athletes
and performers. Lewiston, NY: Edwin Mellen Press.
Nguyen-Rodriguez, S., Chou, C., Unger, J., & Spruijt-Metz, D. (2008). BMI as a
moderator of perceived stress and emotional eating in adolescents. Eating
Behaviors, 9, 238-246. Retrieved August 16, 2008, from ScienceDirect database.
76
Nordstrom, C., & Segrist, D. (2009). Predicting the likelihood of going to graduate
school: The importance of locus of control. College Student Journal,43, 200-206.
Retrieved March 22, 2009, from
http://findarticles.com/p/articles/mi_m0FCR/is_1_43/ai_n31415100
Norring, C., & Palmer, B. (Eds.) (2005). Ednos: Eating disorders not otherwise specified.
New York: Routledge.
O’Connor, D., Jones, F., Conner, M., McMillan, B., & Eamonn, F. (2008). Effects of
daily hassles and eating style on eating behavior. Health Psychology, 27(Suppl.
1), 20-31. Retrieved March 02, 2008, from PsycARTICLES database.
O’Connor, D., & O’Connor, R. (2004). Perceived changes in food intake in response to
stress: The role of conscientiousness. Stress and Health, 20, 279-291. Retrieved
April 19, 2007, from PsycINFO database.
Okon, D., Greene, A., & Smith, J. (2003). Family interactions predict intraindividual
symptom variation for adolescents with bulimia. International Journal of Eating
Disorders, 34, 450-457. Retrieved April 19, 2007, from PsycINFO database.
Oliver, G., & Wardle, J. (1999). Perceived effects of stress on food choice. Physiological
Behavior, 66, 511-515.
Oliver, K., Huon, G., Zadro, L., & Williams, K. (2001). The role of interpersonal stress in
overeating among high and low disinhibitors. Eating Behaviors, 2, 19-26.
Retrieved July 07, 2006, from PsycARTICLES database.
Peñas-Lledó, E., Sancho, L., & Walker, G. (2002). Eating attitudes and the use of
alcohol, tobacco, and exercise among male and female adolescents. Eating
77
Behaviors, 3, 101-111. Retrieved July 10, 2006, from PsycARTICLES database.
Polivy, J., & Herman, C. P. (2002). Causes of eating disorders. In S. T. Fiske (Ed.).
Annual Review of Psychology (pp. 187-213). Palo Alto, CA: Annual Reviews.
Porter, O. (1990). Undergraduate completion and persistence at four-year colleges and
universities: Detailed findings. Washington, DC: National Institute of
Independent Colleges and Universitites.
PSS scoring. (n.d.). Retrieved November 11, 2006, from
http://www.psy.cmu.edu:16080/~scohen/
Ricciardelli, L., & McCabe, M. (2004). A biopsychosocial model of disordered eating
and the pursuit of muscularity in adolescent boys. Psychological Bulletin, 130,
179-205.
Rice, K., & Ashby, J. (2007). An efficient method for classifying perfectionists. Journal
of Counseling Psychology, 54, 72-85.
Robert-McComb, J. (Ed.). (2001). Eating disorders in women and children: Prevention,
stress management, and treatment. Boca Raton: CRC Press.
Roberti, J. W., Harrington, L. N., & Storch, E. A. (2006). Further psychometric support
for the 10-item version of the perceived stress scale. Journal of College
Counseling, 9, 135-147. Retrieved October 1, 2008, from Ebscohost database.
Rocha-Singh, I. (1994). Perceived stress among graduate students: Development and
validation of the graduate stress inventory. Educational and Psychological
Measurement, 54, 714-727.
Ruggiero, G., Levi, D., Ciuna, A., & Sassaroli, S. (2003). Stress situation reveals an
78
association between perfectionism and drive for thinness. International Journal of
Eating Disorders, 34, 220-226. Retrieved April 16, 2007, from PsycINFO
database.
Sassaroli, S., Lauro, L., Ruggiero, G., Mauri, M., Vinai, P., & Frost, R. (2008).
Perfectionism in depression, obsessive-compulsive disorder and eating disorders.
Behaviour Research and Therapy, 46, 757-765. Retrieved September 8, 2008,
from ScienceDirect database.
Sassaroli, S., & Ruggiero, G. (2005). The role of stress in the association between low
self-esteem, perfectionism, and worry, and eating disorders. International Journal
of Eating Disorders, 37, 135-141. Retrieved April 16, 2007, from PsycINFO
database.
Scarano, G., & Kalodner-Martin, C. (1994). A description of the continuum of eating
disorders: Implications for intervention and research. Journal of Counseling and
Development, 72, 356-361. Retrieve March 26, 2009, from Ebscohost database.
Schwarz, H., Gairrett, R., Aruguete, M., & Gold, E. (2005). Eating attitudes, body
dissatisfaction, and perfectionism in female college athletes. North American
Journal of Psychology, 7, 345-352. Retrieved April 18, 2007, from PsycINFO
database.
Selye, H. (1976). Stress in health and disease. Boston: Butterworths. Semenza, G. (2005). The graduate study for the twenty-first century: How to build an
academic career in the humanities. New York: Palgrave Macmillan.
Siever, M. D. (1994). Sexual orientation and gender as factors in socioculturally
79
acquired vulnerability to body dissatisfaction and eating disorders. Journal of
Consulting and Clinical Psychology, 62, 252-260.
Sims, R., Gordon, S., Garcia, W., Clark, E., Monye, D., Callender, C., et al. (2008).
Perceived stress and eating behaviors in a community-based sample of African-
Americans. Eating Behaviors, 9, 137-142. Retrieved March 01, 2008, from
ScienceDirect database.
Slaney, R., Ashby, J., & Trippi, J. (1995). Perfectionism: Its measurement and career
relevance. Journal of Career Assessment, 3, 279-297.
Slaney, R., Rice, K., Mobley, M., Trippi, J., & Ashby, J. (2001). The revised almost
perfect scale. Measurement and Evaluation in Counseling and Development, 34,
130–145.
Smith, D. E. (1995). Binge eating in ethnic minority groups. Addictive Behaviors, 20,
695-703.
Smolak, L., Murnen, S., & Thompson, J. (2005). Sociocultural influences and muscle
building in adolescent boys. Psychology of Men & Masculinity, 6, 227-239.
Retrieved June 06, 2006, from PsycARTICLES database.
Soukup, V., Beiler, M., & Terrell, F. (1990). Stress, coping style and problem solving
ability among eating disordered inpatients. Journal of Clinical Psychology, 46,
592-599.
Speranza, M., Corcos, M., Godart, N., Loas, G., Guilbaud, O., Jeammet, P., et al. (2001).
Obsessive compulsive disorders in eating disorders. Eating Behavior, 2, 193-207.
Retrieved July 07, 2006, from PsycARTICLES database.
80
Spindler, A., & Milos, G. (2007). Links between eating disorder symptom severity and
psychiatric comorbidity. Eating Behaviors, 8, 364-373. Retrieved August 16,
2008, from ScienceDirect database.
Stice, E., Presnell, K., & Spangler, D. (2002). Risk factors for binge eating onset in
adolescent girls: A 2-year prospective investigation. Health Psychology, 21, 131-
138.
Stice, E., & Whitenton, K. (2002). Risk factors for body dissatisfaction in adolescent
girls: A longitudinal investigation. Developmental Psychology, 38, 669-678.
Striegel-Moore, R. H., & Bulik, C. M. (Eds.). (2005). Special issue on anorexia nervosa
[Special issue]. International Journal of Eating Disorders, 37(1). Retrieved April
18, 2007, from PsycINFO database.
Stunkard, A., & Messick, S. (1985). The three-factor eating questionnaire to measure
dietary restraint, disinhibition, and hunger. Journal of Psychosomatic Research,
29, 71-83.
Terrell, S. (2005). Supporting different learning styles in an online learning environment.
Online Journal of Distance Learning Administration, 8(2). Retrieved April 20,
2009, from http://www.westga.edu/~distance/ojdla/summer82/terrell82.htm .
Tholin, S., Rasmussen, F., Tynelius, P., & Karlsson, J. (2005). Genetic and
environmental influences on eating behaviour: The swedish young male twins
study. American Journal of Clinical Nutritions, 81, 564-569.
81
Trattner, R., & Thompson, R. (2001). Athletes and disordered eating: Four major issues
for the professional psychologist. Professional Psychology: Research and
Practice, 32, 27-33.
Turnbull, J.D., Heaslip, S., & McLeod, H. (2000). Pre-school children’s attitudes
to fat and female stimulus figures. International Journal of Obesity & Related
Metabolic Disorders, 24, 1705-1707.
Tyrka, A., Waldron, I., Graber, J., & Brooks-Gunn, J. (2002). Prospective predictors of
the onset of anorexic and bulimic syndromes. International Journal of Eating
Disorders, 32, 282-290. Retrieved April 18, 2007, from PsycINFO database.
Ülkü-Steiner, B., Kurtz-Costes, B., & Kinlaw, C. (2000). Doctoral student experiences in
gender-balanced and male-dominated graduate programs. Journal of Educational
Psychology, 92, 296-307.
Vander Wal, J. (2004). Eating and body image concerns among average-weight and
obese African American and Hispanic girls. Eating Behaviors, 5, 181-187.
Retrieved July 07, 2006, from PsycARTICLES database.
Vander Wal, J., & Thelen, M. (2000). Predictors of body image dissatisfaction in
elementary-age school girls. Eating Behaviors, 1, 105-122. Retrieved July 07,
2006, from PsycARTICLES database.
Vanderlinden, J., Dalle Grave, R., Vandereycken, W., & Noorduin, C. (2001). Which
factors do provoke binge-eating? An exploratory study in female students. Eating
Behaviors, 2, 79-83. Retrieved July 07, 2006, from PsycARTICLES database.
Very different degree. (2008). Retrieved March 22, 2009, from
82
http://www.embark.com/Articles_old/Pages/AVeryDifferentDegree.aspx .
Vidler, D., & Wood, P. (1981). Differences in curiosity level between undergraduates and
graduate students. College Student Journal, 15, 153-155.
Vitousek, K., & Manke, F. (1994). Personality variables and disorders in anorexia
nervosa and bulimia nervosa. Journal of Abnormal Psychology, 103, 137-147.
Retrieved September 8, 2008, from PsycARTICLES database.
Vohs, K., Bardone, A., Joiner, T., Abramson, L., & Heatherton, T. (1999). Perfectionism,
perceived weight status, and self-esteem interact to predict bulimic symptoms: A
model of bulimic symptom development. Journal of Abnormal Psychology, 108,
695-700.
Whitman, N., Spendlove, D., & Clark, C. (2000). Student stress: Effects and solutions.
Association for the Study of Higher Education, 85. Retrieved March 22, 2009,
from http://www.ericdigests.org/pre-926/stress.htm.
Williamson, D., Gleaves, D., & Stewart, T. (2005). Categorical versus dimensional
models of eating disorders: An examination of the evidence. International
Journal of Eating Disorders, 37, 1-10. Retrieved March 25, 2009, from Ebscohost
database.
Williamson, D., Kelley, M., Davis, C., Ruggiero, L., & Blouin, D. (1985).
Psychopathology of eating disorders: A controlled comparison of bulimic, obese,
and normal subjects. Journal of Consulting and Clinical Psychology, 53, 161-166.
Williamson, D., Martin, C., Anton, S., York-Crowe, E., Han, H., Redman, L. et al.
83
(2008). Is caloric restriction associated with development of eating-disorder
symptoms? Results from the calerie trial. Health Psychology, 27(Suppl. 1), 32-42.
Retrieved April 20, 2009, from PsycARTICLES database.
Williamson, D. Womble, L., Smeets, M., Netemeyer, R., Thaw, J., Kutlesic, V. et al.
(2002). Latent structure of eating disorder symptoms: A factor analytic and
taxometric investigation. American Journal of Psychiatry, 159, 412-418.
Retrieved March 25, 2009, from HighWire Press database.
Young, E., McFatter, R., & Clopton, J. (2001). Family functioning, peer influence, and
media influence as predictors of bulimic behavior. Eating Behaviors, 2, 323-337.

84
APPENDIX A
Demographic Sheet
(created by the researcher)
85
We would like to know more about you. Please complete the following questions. You must be at least 19 years-old to participate. 1. How old are you? _____ 2. What is your current educational status?
A—Undergraduate Student B--Graduate Student 3. Please indicate the group with which you most identify.
A--Black/African-American B--White/Caucasian C--Hispanic/Latin
D--Asian/Pacific Islander E--Native American F--Other:______
4. Please indicate your sex.
A--male B—female
86
APPENDIX B
Three Factor Eating Questionnaire-R21
(Tholin, Rasmussen, Tynelius, & Karlsson, 2005)
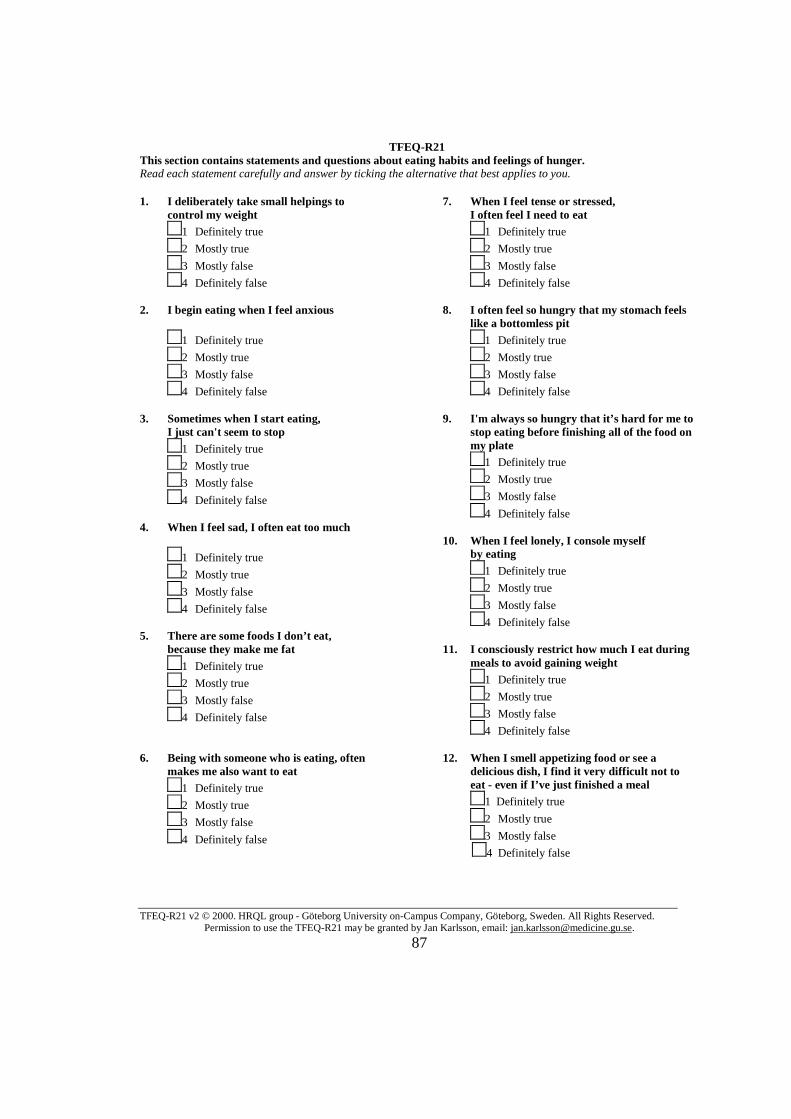
TFEQ-R21 This section contains statements and questions about eating habits and feelings of hunger. Read each statement carefully and answer by ticking the alternative that best applies to you.
TFEQ-R21 v2 © 2000. HRQL group - Göteborg University on-Campus Company, Göteborg, Sweden. All Rights Reserved. Permission to use the TFEQ-R21 may be granted by Jan Karlsson, email: [email protected].
87
1. I deliberately take small helpings to control my weight
1 Definitely true
2 Mostly true
3 Mostly false
4 Definitely false 2. I begin eating when I feel anxious
1 Definitely true
2 Mostly true
3 Mostly false
4 Definitely false 3. Sometimes when I start eating, I just can't seem to stop
1 Definitely true
2 Mostly true
3 Mostly false
4 Definitely false 4. When I feel sad, I often eat too much
1 Definitely true
2 Mostly true
3 Mostly false
4 Definitely false
5. There are some foods I don’t eat, because they make me fat
1 Definitely true
2 Mostly true
3 Mostly false
4 Definitely false
6. Being with someone who is eating, often
makes me also want to eat 1 Definitely true
2 Mostly true
3 Mostly false
4 Definitely false
7. When I feel tense or stressed, I often feel I need to eat
1 Definitely true
2 Mostly true
3 Mostly false
4 Definitely false 8. I often feel so hungry that my stomach feels
like a bottomless pit
1 Definitely true
2 Mostly true
3 Mostly false
4 Definitely false
9. I'm always so hungry that it’s hard for me to stop eating before finishing all of the food on my plate
1 Definitely true
2 Mostly true
3 Mostly false
4 Definitely false
10. When I feel lonely, I console myself by eating
1 Definitely true
2 Mostly true
3 Mostly false
4 Definitely false
11. I consciously restrict how much I eat during meals to avoid gaining weight
1 Definitely true
2 Mostly true
3 Mostly false
4 Definitely false
12. When I smell appetizing food or see a delicious dish, I find it very difficult not to eat - even if I’ve just finished a meal
1 Definitely true
2 Mostly true
3 Mostly false
4 Definitely false
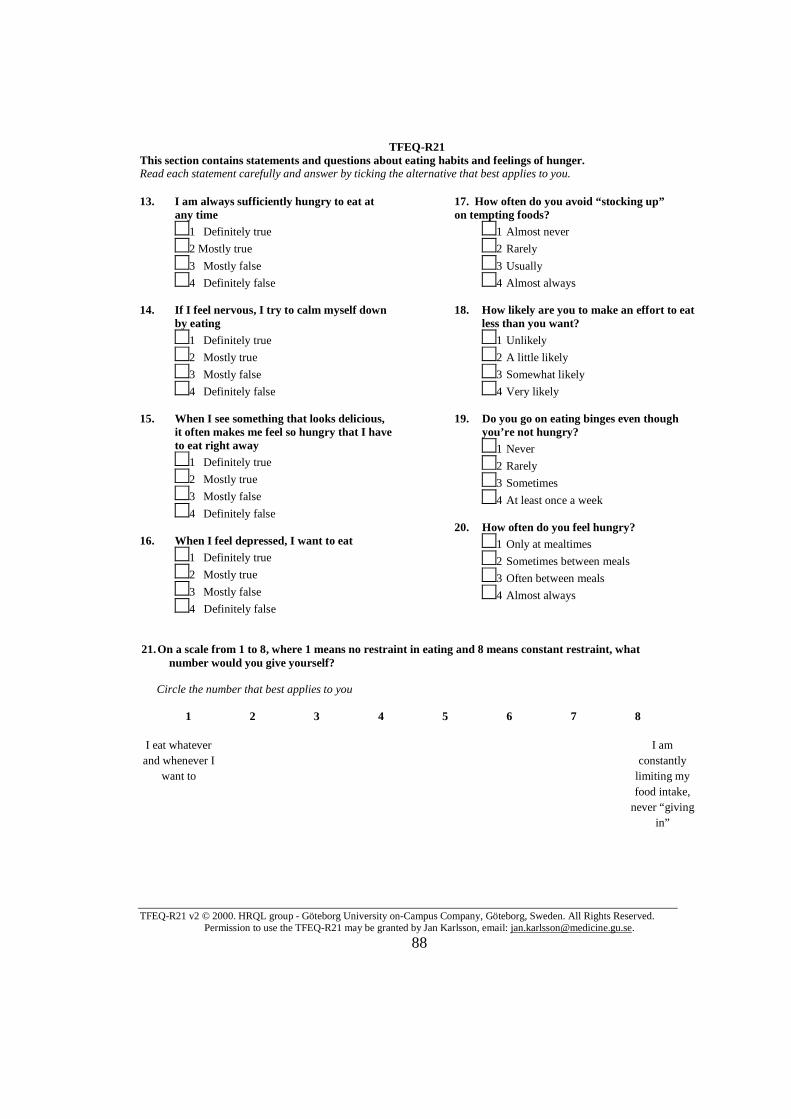
TFEQ-R21 This section contains statements and questions about eating habits and feelings of hunger. Read each statement carefully and answer by ticking the alternative that best applies to you.
TFEQ-R21 v2 © 2000. HRQL group - Göteborg University on-Campus Company, Göteborg, Sweden. All Rights Reserved. Permission to use the TFEQ-R21 may be granted by Jan Karlsson, email: [email protected].
88
13. I am always sufficiently hungry to eat at any time
1 Definitely true
2 Mostly true
3 Mostly false
4 Definitely false
14. If I feel nervous, I try to calm myself down by eating
1 Definitely true
2 Mostly true
3 Mostly false
4 Definitely false
15. When I see something that looks delicious, it often makes me feel so hungry that I have to eat right away
1 Definitely true
2 Mostly true
3 Mostly false
4 Definitely false
16. When I feel depressed, I want to eat
1 Definitely true
2 Mostly true
3 Mostly false
4 Definitely false
17. How often do you avoid “stocking up” on tempting foods?
1 Almost never
2 Rarely
3 Usually
4 Almost always 18. How likely are you to make an effort to eat
less than you want?
1 Unlikely
2 A little likely
3 Somewhat likely
4 Very likely 19. Do you go on eating binges even though
you’re not hungry? 1 Never
2 Rarely
3 Sometimes
4 At least once a week 20. How often do you feel hungry?
1 Only at mealtimes
2 Sometimes between meals
3 Often between meals
4 Almost always
21. On a scale from 1 to 8, where 1 means no restraint in eating and 8 means constant restraint, what
number would you give yourself? Circle the number that best applies to you
1 2 3 4 5 6 7 8
I eat whatever and whenever I
want to
I am constantly
limiting my food intake,
never “giving in”
89
APPENDIX C
Almost Perfect Scale-Revised
(Slaney, Mobley, Trippi, Ashby, & Johnson, 1997)
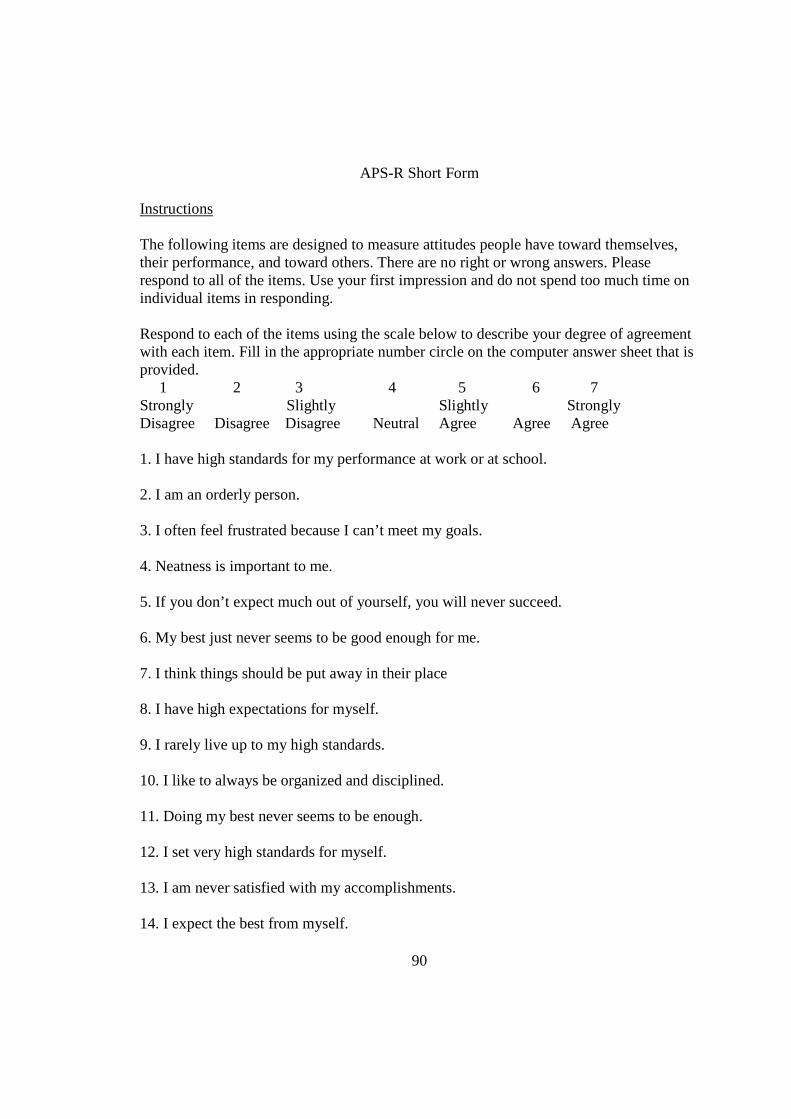
90
APS-R Short Form Instructions The following items are designed to measure attitudes people have toward themselves, their performance, and toward others. There are no right or wrong answers. Please respond to all of the items. Use your first impression and do not spend too much time on individual items in responding. Respond to each of the items using the scale below to describe your degree of agreement with each item. Fill in the appropriate number circle on the computer answer sheet that is provided. 1 2 3 4 5 6 7 Strongly Slightly Slightly Strongly Disagree Disagree Disagree Neutral Agree Agree Agree 1. I have high standards for my performance at work or at school.
2. I am an orderly person.
3. I often feel frustrated because I can’t meet my goals.
4. Neatness is important to me.
5. If you don’t expect much out of yourself, you will never succeed.
6. My best just never seems to be good enough for me.
7. I think things should be put away in their place
8. I have high expectations for myself.
9. I rarely live up to my high standards.
10. I like to always be organized and disciplined.
11. Doing my best never seems to be enough.
12. I set very high standards for myself.
13. I am never satisfied with my accomplishments.
14. I expect the best from myself.
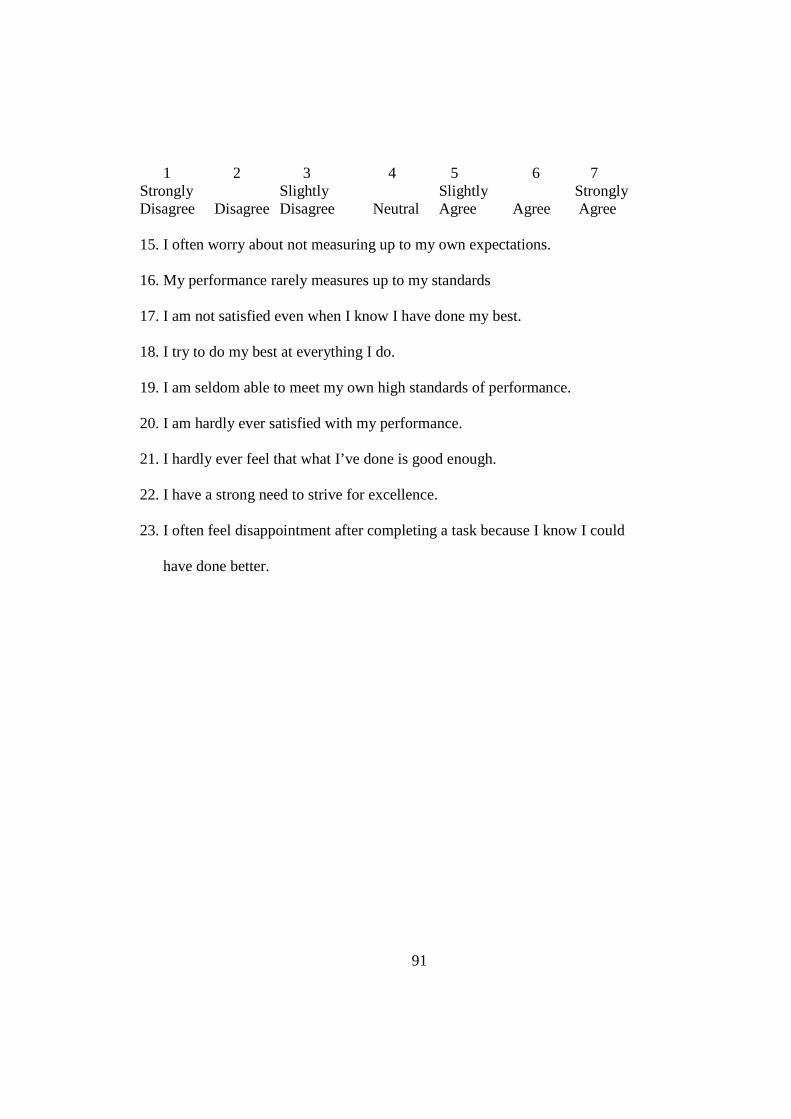
91
1 2 3 4 5 6 7 Strongly Slightly Slightly Strongly Disagree Disagree Disagree Neutral Agree Agree Agree 15. I often worry about not measuring up to my own expectations.
16. My performance rarely measures up to my standards
17. I am not satisfied even when I know I have done my best.
18. I try to do my best at everything I do.
19. I am seldom able to meet my own high standards of performance.
20. I am hardly ever satisfied with my performance.
21. I hardly ever feel that what I’ve done is good enough.
22. I have a strong need to strive for excellence.
23. I often feel disappointment after completing a task because I know I could
have done better.
92
APPENDIX D
Perceived Stress Scale
(Cohen, Kamarck, & Mermelstein, 1983)
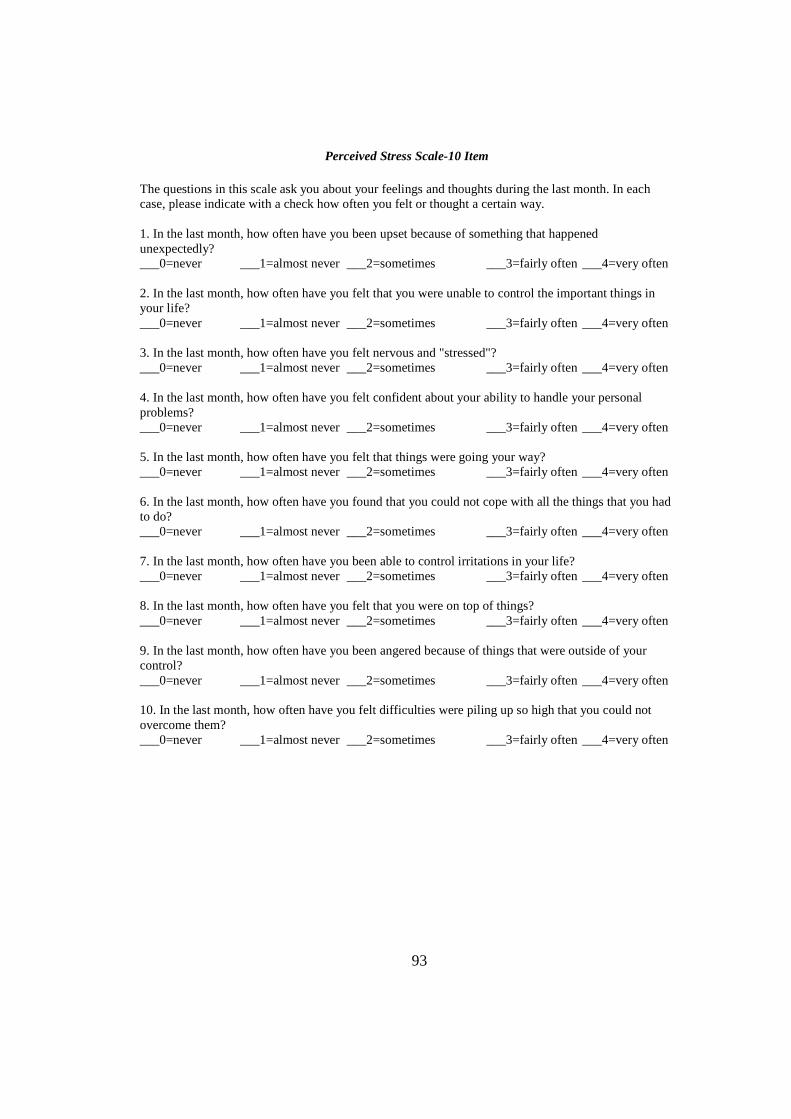
93
Perceived Stress Scale-10 Item The questions in this scale ask you about your feelings and thoughts during the last month. In each case, please indicate with a check how often you felt or thought a certain way. 1. In the last month, how often have you been upset because of something that happened unexpectedly? ___0=never ___1=almost never ___2=sometimes ___3=fairly often ___4=very often 2. In the last month, how often have you felt that you were unable to control the important things in your life? ___0=never ___1=almost never ___2=sometimes ___3=fairly often ___4=very often 3. In the last month, how often have you felt nervous and "stressed"? ___0=never ___1=almost never ___2=sometimes ___3=fairly often ___4=very often 4. In the last month, how often have you felt confident about your ability to handle your personal problems? ___0=never ___1=almost never ___2=sometimes ___3=fairly often ___4=very often 5. In the last month, how often have you felt that things were going your way? ___0=never ___1=almost never ___2=sometimes ___3=fairly often ___4=very often 6. In the last month, how often have you found that you could not cope with all the things that you had to do? ___0=never ___1=almost never ___2=sometimes ___3=fairly often ___4=very often 7. In the last month, how often have you been able to control irritations in your life? ___0=never ___1=almost never ___2=sometimes ___3=fairly often ___4=very often 8. In the last month, how often have you felt that you were on top of things? ___0=never ___1=almost never ___2=sometimes ___3=fairly often ___4=very often 9. In the last month, how often have you been angered because of things that were outside of your control? ___0=never ___1=almost never ___2=sometimes ___3=fairly often ___4=very often 10. In the last month, how often have you felt difficulties were piling up so high that you could not overcome them? ___0=never ___1=almost never ___2=sometimes ___3=fairly often ___4=very often
94
APPENDIX E
Information Sheet
(for Auburn University Institutional Review Board)
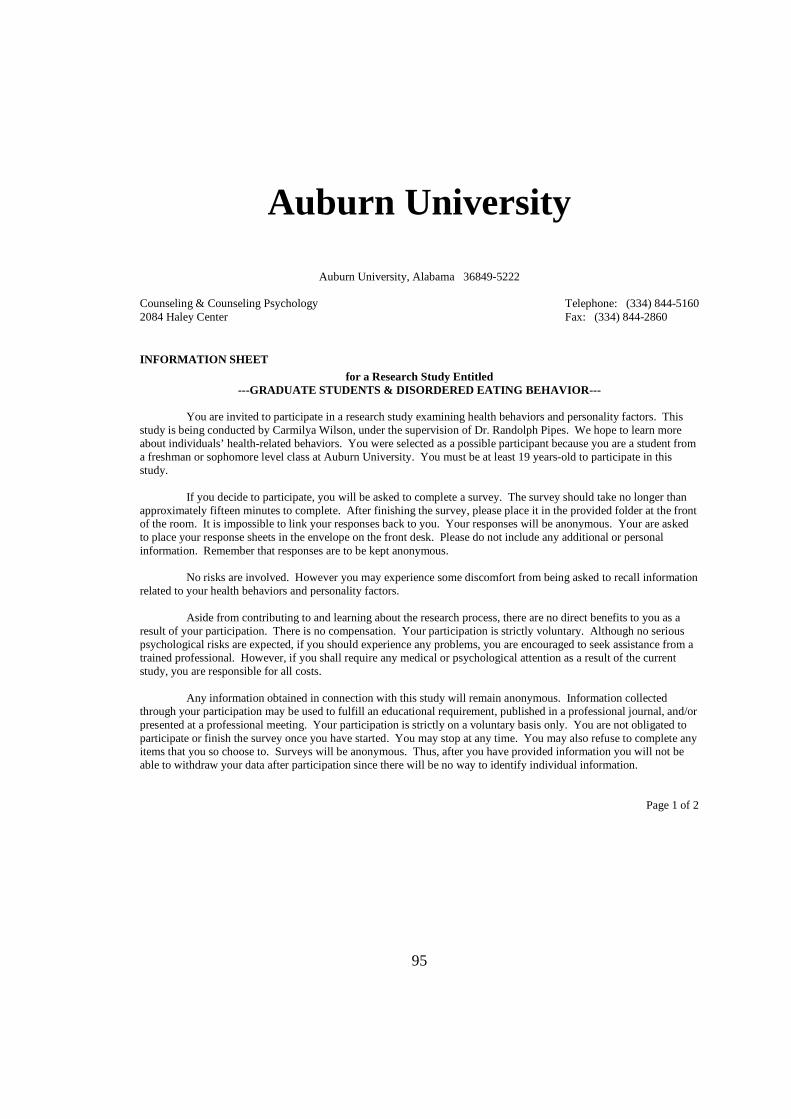
95
Auburn University
Auburn University, Alabama 36849-5222
Counseling & Counseling Psychology Telephone: (334) 844-5160 2084 Haley Center Fax: (334) 844-2860
INFORMATION SHEET
for a Research Study Entitled ---GRADUATE STUDENTS & DISORDERED EATING BEHAVIOR-- -
You are invited to participate in a research study examining health behaviors and personality factors. This study is being conducted by Carmilya Wilson, under the supervision of Dr. Randolph Pipes. We hope to learn more about individuals’ health-related behaviors. You were selected as a possible participant because you are a student from a freshman or sophomore level class at Auburn University. You must be at least 19 years-old to participate in this study. If you decide to participate, you will be asked to complete a survey. The survey should take no longer than approximately fifteen minutes to complete. After finishing the survey, please place it in the provided folder at the front of the room. It is impossible to link your responses back to you. Your responses will be anonymous. Your are asked to place your response sheets in the envelope on the front desk. Please do not include any additional or personal information. Remember that responses are to be kept anonymous. No risks are involved. However you may experience some discomfort from being asked to recall information related to your health behaviors and personality factors. Aside from contributing to and learning about the research process, there are no direct benefits to you as a result of your participation. There is no compensation. Your participation is strictly voluntary. Although no serious psychological risks are expected, if you should experience any problems, you are encouraged to seek assistance from a trained professional. However, if you shall require any medical or psychological attention as a result of the current study, you are responsible for all costs. Any information obtained in connection with this study will remain anonymous. Information collected through your participation may be used to fulfill an educational requirement, published in a professional journal, and/or presented at a professional meeting. Your participation is strictly on a voluntary basis only. You are not obligated to participate or finish the survey once you have started. You may stop at any time. You may also refuse to complete any items that you so choose to. Surveys will be anonymous. Thus, after you have provided information you will not be able to withdraw your data after participation since there will be no way to identify individual information.
Page 1 of 2
96
Your decision whether or not to participate will not jeopardize your future relations with Auburn University or the Department of Counselor Education, Counseling Psychology, and School Psychology. If you have any questions, I invite you to ask them now. If you have questions later, Carmilya Wilson (334-502-7932; [email protected]) and/or Dr. Randolph Pipes (334-844-2883 [email protected]) located in the Department of Counselor Education, Counseling Psychology, and School Psychology (room 2084) of the Haley Center will be happy to answer them.
For more information regarding your rights as a research participant you may contact the Auburn University Office of Human Subjects Research or the Institutional Review Board by phone (334)-844-5966 or e-mail at [email protected] or [email protected]. HAVING READ THE INFORMATION PROVIDED, YOU MUST DECI DE WHETHER OR NOT YOU WISH TO PARTICIPATE IN THIS RESEARCH STUDY. IF YOU DECID E TO PARTICIPATE, THE DATA YOU PROVIDE WILL SERVE AS YOUR AGREEMENT TO DO SO. THI S LETTER IS YOURS TO KEEP. ___________________________________ Investigator’s signature Date ___________________________________ Co-investigator's signature Date
Page 2 of 2

97
APPENDIX F
Example of Email to Instructors
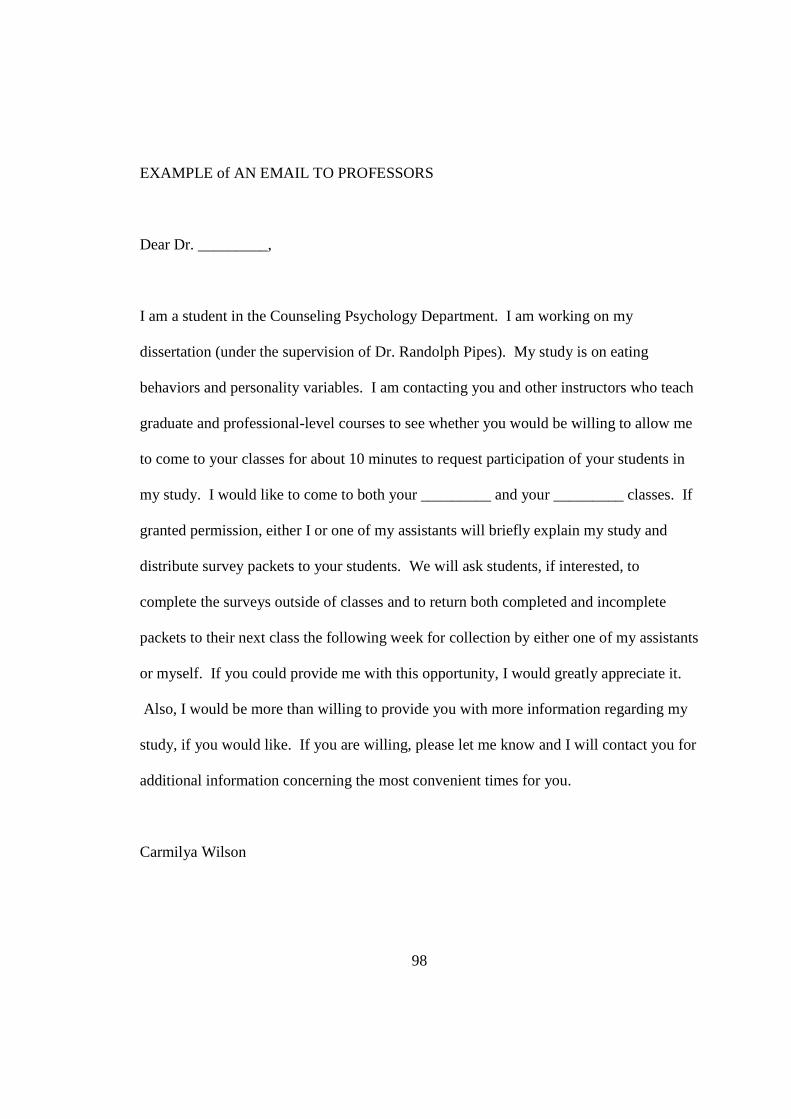
98
EXAMPLE of AN EMAIL TO PROFESSORS
Dear Dr. _________,
I am a student in the Counseling Psychology Department. I am working on my
dissertation (under the supervision of Dr. Randolph Pipes). My study is on eating
behaviors and personality variables. I am contacting you and other instructors who teach
graduate and professional-level courses to see whether you would be willing to allow me
to come to your classes for about 10 minutes to request participation of your students in
my study. I would like to come to both your _________ and your _________ classes. If
granted permission, either I or one of my assistants will briefly explain my study and
distribute survey packets to your students. We will ask students, if interested, to
complete the surveys outside of classes and to return both completed and incomplete
packets to their next class the following week for collection by either one of my assistants
or myself. If you could provide me with this opportunity, I would greatly appreciate it.
Also, I would be more than willing to provide you with more information regarding my
study, if you would like. If you are willing, please let me know and I will contact you for
additional information concerning the most convenient times for you.
Carmilya Wilson

99
APPENDIX G
Script
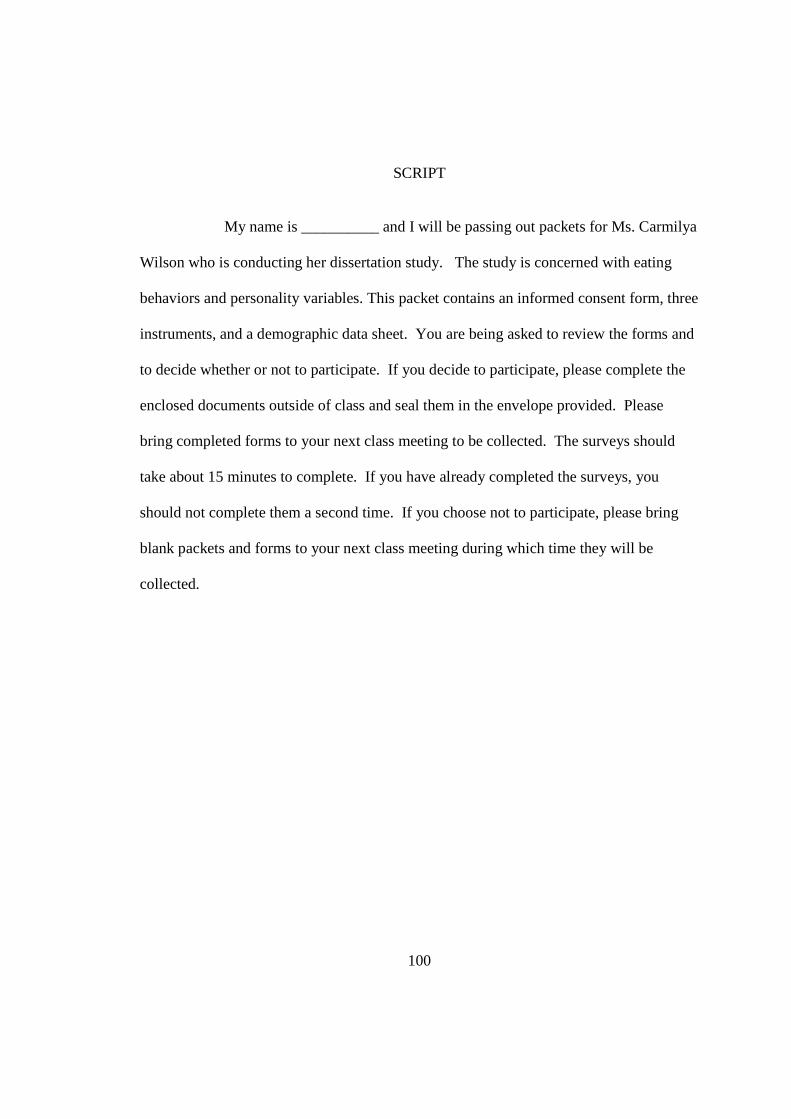
100
SCRIPT
My name is __________ and I will be passing out packets for Ms. Carmilya
Wilson who is conducting her dissertation study. The study is concerned with eating
behaviors and personality variables. This packet contains an informed consent form, three
instruments, and a demographic data sheet. You are being asked to review the forms and
to decide whether or not to participate. If you decide to participate, please complete the
enclosed documents outside of class and seal them in the envelope provided. Please
bring completed forms to your next class meeting to be collected. The surveys should
take about 15 minutes to complete. If you have already completed the surveys, you
should not complete them a second time. If you choose not to participate, please bring
blank packets and forms to your next class meeting during which time they will be
collected.

101
APPENDIX H
List of Auburn Mental Health Providers
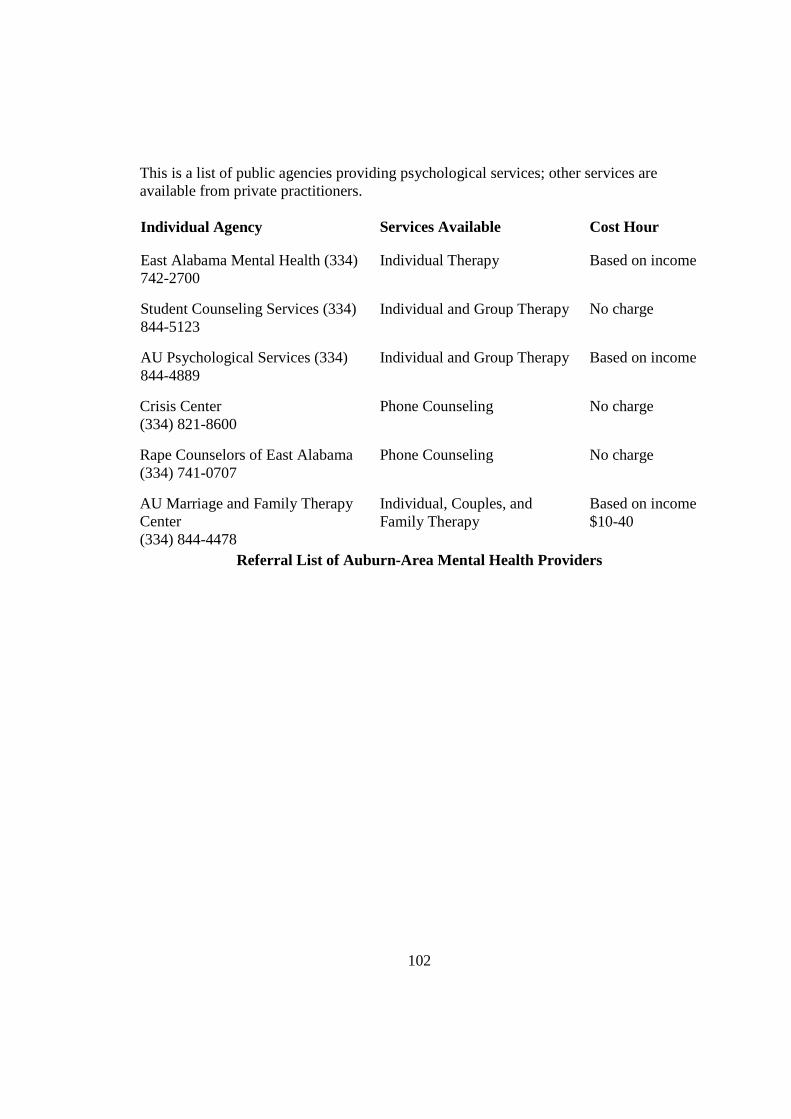
102
This is a list of public agencies providing psychological services; other services are available from private practitioners. Individual Agency Services Available Cost Hour
East Alabama Mental Health (334) 742-2700
Individual Therapy Based on income
Student Counseling Services (334) 844-5123
Individual and Group Therapy No charge
AU Psychological Services (334) 844-4889
Individual and Group Therapy Based on income
Crisis Center (334) 821-8600
Phone Counseling No charge
Rape Counselors of East Alabama (334) 741-0707
Phone Counseling No charge
AU Marriage and Family Therapy Center (334) 844-4478
Individual, Couples, and Family Therapy
Based on income $10-40
Referral List of Auburn-Area Mental Health Provider s

103
APPENDIX I
List of Memphis Mental Health Providers
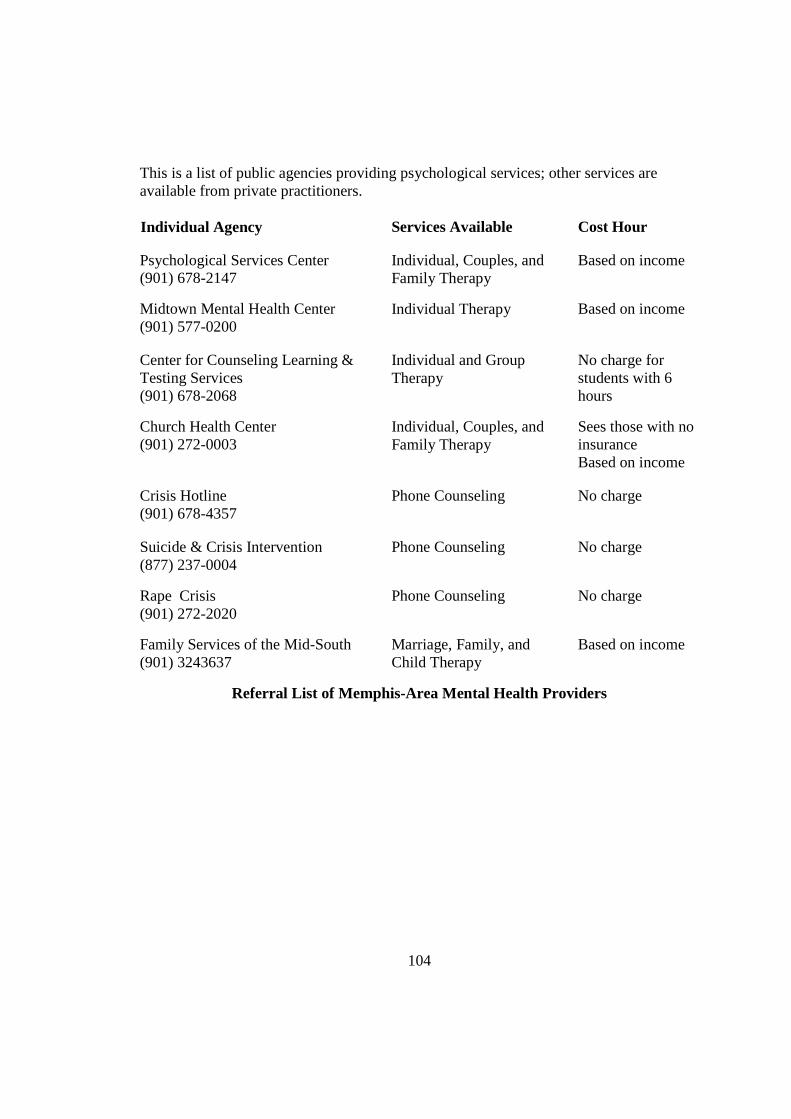
104
This is a list of public agencies providing psychological services; other services are available from private practitioners. Individual Agency Services Available Cost Hour
Psychological Services Center (901) 678-2147
Individual, Couples, and Family Therapy
Based on income
Midtown Mental Health Center (901) 577-0200
Individual Therapy Based on income
Center for Counseling Learning & Testing Services (901) 678-2068
Individual and Group Therapy
No charge for students with 6 hours
Church Health Center (901) 272-0003
Individual, Couples, and Family Therapy
Sees those with no insurance Based on income
Crisis Hotline (901) 678-4357
Phone Counseling No charge
Suicide & Crisis Intervention (877) 237-0004
Phone Counseling No charge
Rape Crisis (901) 272-2020
Phone Counseling No charge
Family Services of the Mid-South (901) 3243637
Marriage, Family, and Child Therapy
Based on income
Referral List of Memphis-Area Mental Health Providers

105
APPENDIX J
Permission to Use the Three Factor Eating Questionnaire-R21
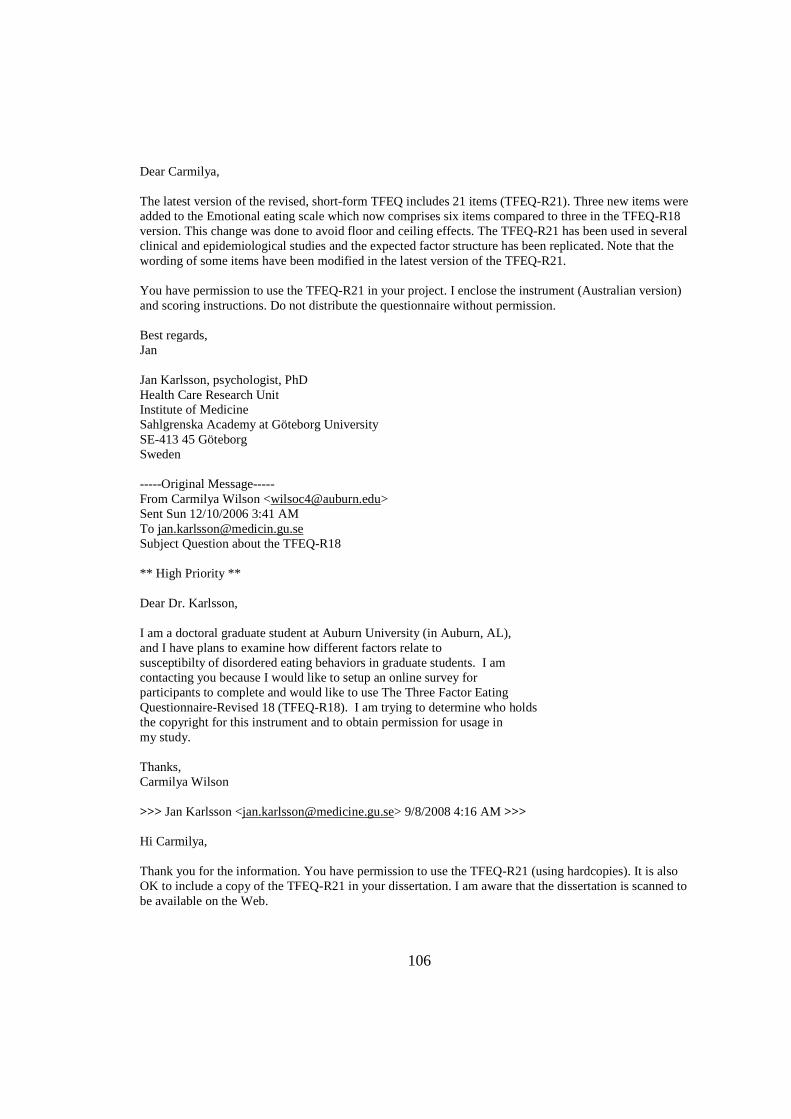
106
Dear Carmilya, The latest version of the revised, short-form TFEQ includes 21 items (TFEQ-R21). Three new items were added to the Emotional eating scale which now comprises six items compared to three in the TFEQ-R18 version. This change was done to avoid floor and ceiling effects. The TFEQ-R21 has been used in several clinical and epidemiological studies and the expected factor structure has been replicated. Note that the wording of some items have been modified in the latest version of the TFEQ-R21. You have permission to use the TFEQ-R21 in your project. I enclose the instrument (Australian version) and scoring instructions. Do not distribute the questionnaire without permission. Best regards, Jan Jan Karlsson, psychologist, PhD Health Care Research Unit Institute of Medicine Sahlgrenska Academy at Göteborg University SE-413 45 Göteborg Sweden -----Original Message----- From Carmilya Wilson <[email protected]> Sent Sun 12/10/2006 3:41 AM To [email protected] Subject Question about the TFEQ-R18 ** High Priority ** Dear Dr. Karlsson, I am a doctoral graduate student at Auburn University (in Auburn, AL), and I have plans to examine how different factors relate to susceptibilty of disordered eating behaviors in graduate students. I am contacting you because I would like to setup an online survey for participants to complete and would like to use The Three Factor Eating Questionnaire-Revised 18 (TFEQ-R18). I am trying to determine who holds the copyright for this instrument and to obtain permission for usage in my study. Thanks, Carmilya Wilson
>>> Jan Karlsson <[email protected]> 9/8/2008 4:16 AM >>>
Hi Carmilya, Thank you for the information. You have permission to use the TFEQ-R21 (using hardcopies). It is also OK to include a copy of the TFEQ-R21 in your dissertation. I am aware that the dissertation is scanned to be available on the Web.
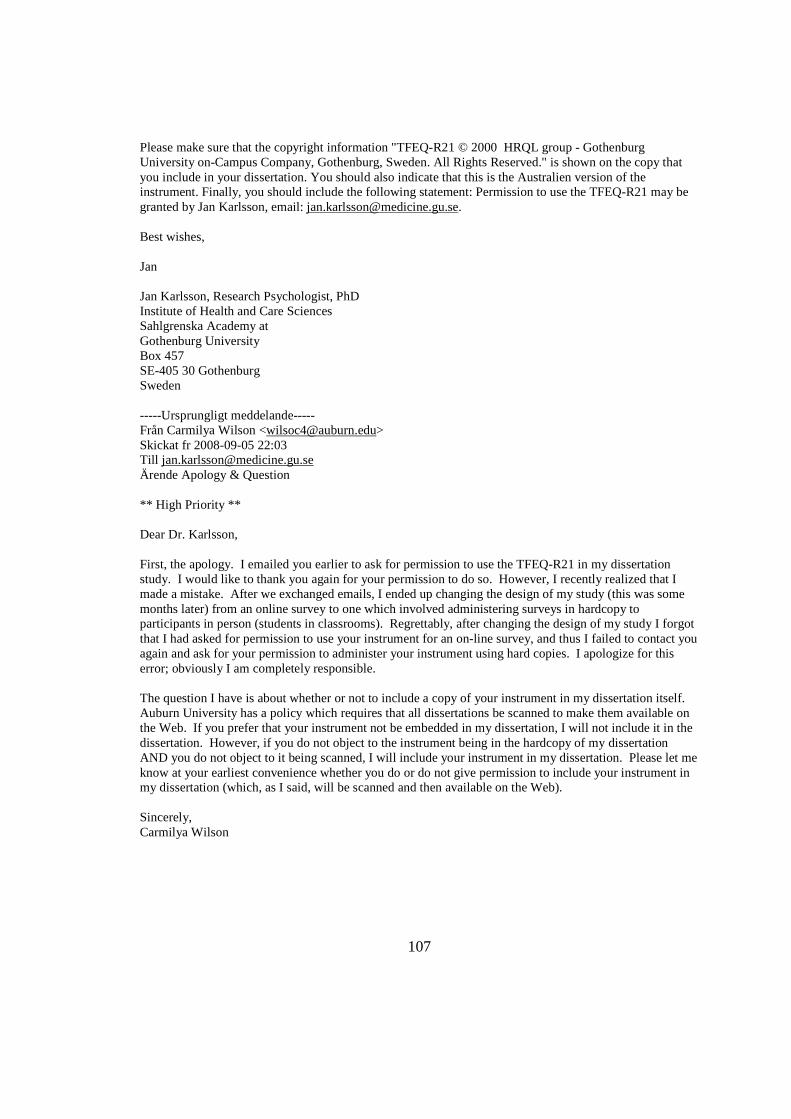
107
Please make sure that the copyright information "TFEQ-R21 © 2000 HRQL group - Gothenburg University on-Campus Company, Gothenburg, Sweden. All Rights Reserved." is shown on the copy that you include in your dissertation. You should also indicate that this is the Australien version of the instrument. Finally, you should include the following statement: Permission to use the TFEQ-R21 may be granted by Jan Karlsson, email: [email protected]. Best wishes, Jan Jan Karlsson, Research Psychologist, PhD Institute of Health and Care Sciences Sahlgrenska Academy at Gothenburg University Box 457 SE-405 30 Gothenburg Sweden -----Ursprungligt meddelande----- Från Carmilya Wilson <[email protected]> Skickat fr 2008-09-05 22:03 Till [email protected] Ärende Apology & Question ** High Priority ** Dear Dr. Karlsson, First, the apology. I emailed you earlier to ask for permission to use the TFEQ-R21 in my dissertation study. I would like to thank you again for your permission to do so. However, I recently realized that I made a mistake. After we exchanged emails, I ended up changing the design of my study (this was some months later) from an online survey to one which involved administering surveys in hardcopy to participants in person (students in classrooms). Regrettably, after changing the design of my study I forgot that I had asked for permission to use your instrument for an on-line survey, and thus I failed to contact you again and ask for your permission to administer your instrument using hard copies. I apologize for this error; obviously I am completely responsible. The question I have is about whether or not to include a copy of your instrument in my dissertation itself. Auburn University has a policy which requires that all dissertations be scanned to make them available on the Web. If you prefer that your instrument not be embedded in my dissertation, I will not include it in the dissertation. However, if you do not object to the instrument being in the hardcopy of my dissertation AND you do not object to it being scanned, I will include your instrument in my dissertation. Please let me know at your earliest convenience whether you do or do not give permission to include your instrument in my dissertation (which, as I said, will be scanned and then available on the Web). Sincerely, Carmilya Wilson

108
APPENDIX K
Permission to Use the Almost Perfect Scale-Revised
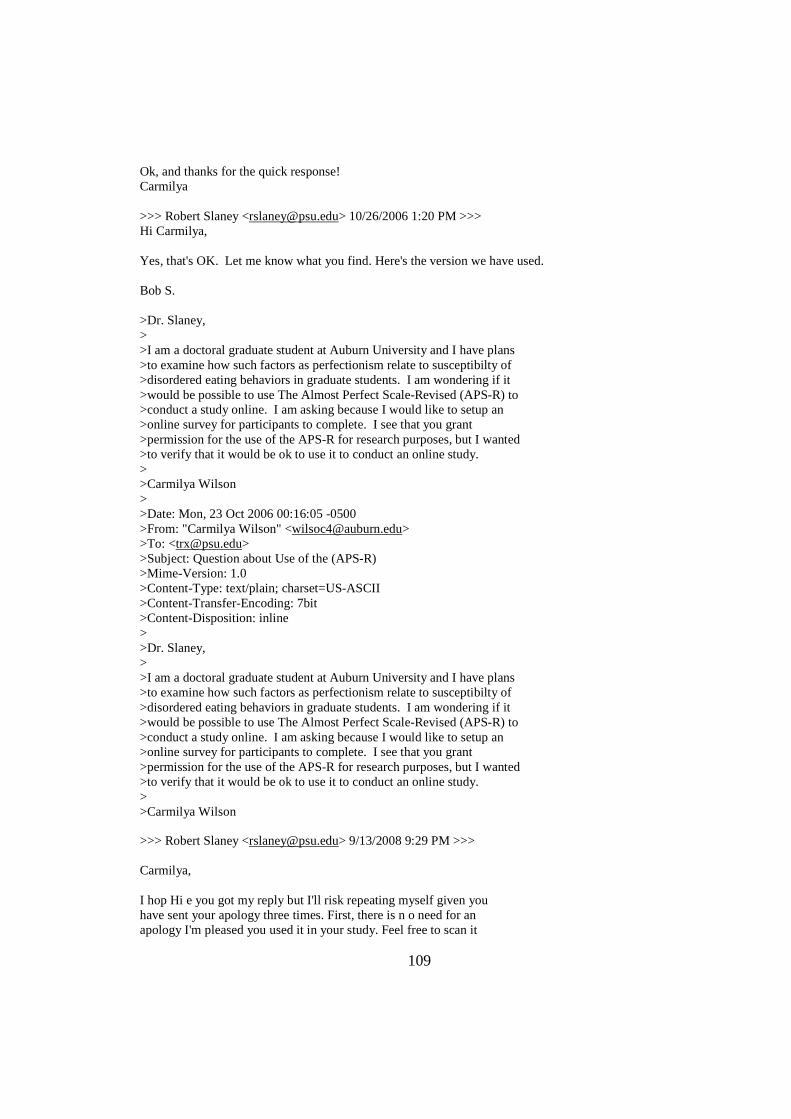
109
Ok, and thanks for the quick response! Carmilya >>> Robert Slaney <[email protected]> 10/26/2006 1:20 PM >>> Hi Carmilya, Yes, that's OK. Let me know what you find. Here's the version we have used. Bob S. >Dr. Slaney, > >I am a doctoral graduate student at Auburn University and I have plans >to examine how such factors as perfectionism relate to susceptibilty of >disordered eating behaviors in graduate students. I am wondering if it >would be possible to use The Almost Perfect Scale-Revised (APS-R) to >conduct a study online. I am asking because I would like to setup an >online survey for participants to complete. I see that you grant >permission for the use of the APS-R for research purposes, but I wanted >to verify that it would be ok to use it to conduct an online study. > >Carmilya Wilson > >Date: Mon, 23 Oct 2006 00:16:05 -0500 >From: "Carmilya Wilson" <[email protected]> >To: <[email protected]> >Subject: Question about Use of the (APS-R) >Mime-Version: 1.0 >Content-Type: text/plain; charset=US-ASCII >Content-Transfer-Encoding: 7bit >Content-Disposition: inline > >Dr. Slaney, > >I am a doctoral graduate student at Auburn University and I have plans >to examine how such factors as perfectionism relate to susceptibilty of >disordered eating behaviors in graduate students. I am wondering if it >would be possible to use The Almost Perfect Scale-Revised (APS-R) to >conduct a study online. I am asking because I would like to setup an >online survey for participants to complete. I see that you grant >permission for the use of the APS-R for research purposes, but I wanted >to verify that it would be ok to use it to conduct an online study. > >Carmilya Wilson >>> Robert Slaney <[email protected]> 9/13/2008 9:29 PM >>>
Carmilya, I hop Hi e you got my reply but I'll risk repeating myself given you have sent your apology three times. First, there is n o need for an apology I'm pleased you used it in your study. Feel free to scan it
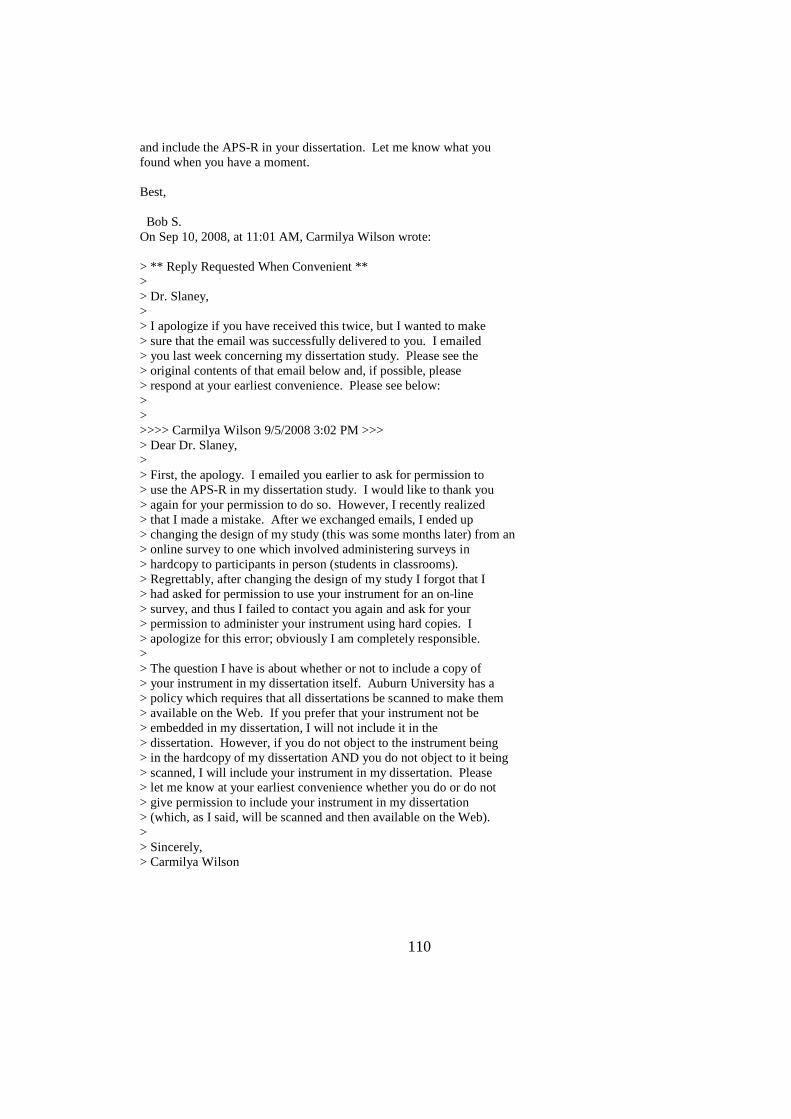
110
and include the APS-R in your dissertation. Let me know what you found when you have a moment. Best, Bob S. On Sep 10, 2008, at 11:01 AM, Carmilya Wilson wrote: > ** Reply Requested When Convenient ** > > Dr. Slaney, > > I apologize if you have received this twice, but I wanted to make > sure that the email was successfully delivered to you. I emailed > you last week concerning my dissertation study. Please see the > original contents of that email below and, if possible, please > respond at your earliest convenience. Please see below: > > >>>> Carmilya Wilson 9/5/2008 3:02 PM >>> > Dear Dr. Slaney, > > First, the apology. I emailed you earlier to ask for permission to > use the APS-R in my dissertation study. I would like to thank you > again for your permission to do so. However, I recently realized > that I made a mistake. After we exchanged emails, I ended up > changing the design of my study (this was some months later) from an > online survey to one which involved administering surveys in > hardcopy to participants in person (students in classrooms). > Regrettably, after changing the design of my study I forgot that I > had asked for permission to use your instrument for an on-line > survey, and thus I failed to contact you again and ask for your > permission to administer your instrument using hard copies. I > apologize for this error; obviously I am completely responsible. > > The question I have is about whether or not to include a copy of > your instrument in my dissertation itself. Auburn University has a > policy which requires that all dissertations be scanned to make them > available on the Web. If you prefer that your instrument not be > embedded in my dissertation, I will not include it in the > dissertation. However, if you do not object to the instrument being > in the hardcopy of my dissertation AND you do not object to it being > scanned, I will include your instrument in my dissertation. Please > let me know at your earliest convenience whether you do or do not > give permission to include your instrument in my dissertation > (which, as I said, will be scanned and then available on the Web). > > Sincerely, > Carmilya Wilson

111
APPENDIX L
Permission to Use the Perceived Stress Scale-10
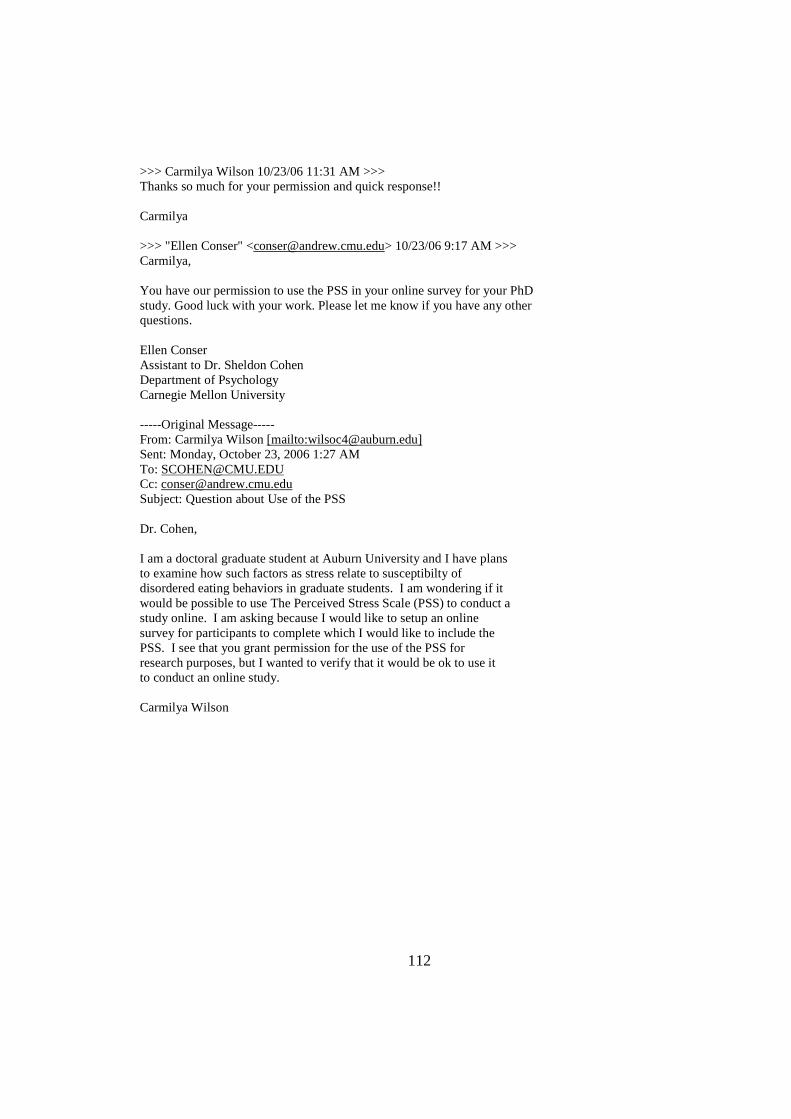
112
>>> Carmilya Wilson 10/23/06 11:31 AM >>> Thanks so much for your permission and quick response!! Carmilya >>> "Ellen Conser" <[email protected]> 10/23/06 9:17 AM >>> Carmilya, You have our permission to use the PSS in your online survey for your PhD study. Good luck with your work. Please let me know if you have any other questions. Ellen Conser Assistant to Dr. Sheldon Cohen Department of Psychology Carnegie Mellon University -----Original Message----- From: Carmilya Wilson [mailto:[email protected]] Sent: Monday, October 23, 2006 1:27 AM To: [email protected] Cc: [email protected] Subject: Question about Use of the PSS Dr. Cohen, I am a doctoral graduate student at Auburn University and I have plans to examine how such factors as stress relate to susceptibilty of disordered eating behaviors in graduate students. I am wondering if it would be possible to use The Perceived Stress Scale (PSS) to conduct a study online. I am asking because I would like to setup an online survey for participants to complete which I would like to include the PSS. I see that you grant permission for the use of the PSS for research purposes, but I wanted to verify that it would be ok to use it to conduct an online study. Carmilya Wilson
113
>>> "Sheldon Cohen" <[email protected]> 9/5/2008 4:57 PM >>> Not a problem for me. sc Sheldon Cohen, PhD, Robert E. Doherty Professor of Psychology Department of Psychology Carnegie Mellon University Pittsburgh, PA 15213 412-268-2336 (phone) 412-268-3294 (fax) -----Original Message----- From: Carmilya Wilson [mailto:[email protected]] Sent: Friday, September 05, 2008 4:04 PM To: [email protected]; [email protected] Subject: Apology & Question Importance: High ** High Priority ** ** Reply Requested When Convenient ** Dear Dr. Cohen, First, the apology. I emailed you earlier to ask for permission to use the PSS-10 in my dissertation study. I would like to thank you again for your permission to do so. However, I recently realized that I made a mistake. After we exchanged emails, I ended up changing the design of my study (this was some months later) from an online survey to one which involved administering surveys in hardcopy to participants in person (students in classrooms). Regrettably, after changing the design of my study I forgot that I had asked for permission to use your instrument for an on-line survey, and thus I failed to contact you again and ask for your permission to administer your instrument using hard copies. I apologize for this error; obviously I am completely responsible. The question I have is about whether or not to include a copy of your instrument in my dissertation itself. Auburn University has a policy which requires that all dissertations be scanned to make them available on the Web. If you prefer that your instrument not be embedded in my dissertation, I will not include it in the dissertation. However, if you do not object to the instrument being in the hardcopy of my dissertation AND you do not object to it being scanned, I will include your instrument in my dissertation. Please let me know at your earliest convenience whether you do or do not give permission to include your instrument in my dissertation (which, as I said, will be scanned and then available on the Web). Sincerely, Carmilya Wilson