graduate seminar - etf · graduate seminar: etf options strategies --- ... ebs, thomson reuters,...
TRANSCRIPT
Graduate Seminar: ETF Options Strategies ---
Hedging Risk, Building Income
Sponsored by:
Moderator
Eric Cott
Director
The Options Industry Council
MODERATOR

Panelists
Blaine Docker
Chief Operating Officer
Main Management
SPEAKER
SPEAKER
Kapil Rathi
Vice President, Options Business Strategy
Bats Global Markets
Michael Khouw
President Chief Strategist
Optimize Advisors &
Business News Contributor for CNBC
SPEAKER
There is a Q&A box on the upper left side of your screen.
Type your question in the lower box and hit Submit.
If you do not see a Q&A box in the upper left corner, please click on the red QA widget on the lower part of your screen.
To talk among other attendees we have included a “Group Chat” function. Please click the brown widget that has 3 people visible.
It’s Easy to Submit a Question
This presentation will be streaming audio through your computer only. If you are not seeing slide movement once the presentation has begun please refresh your screen or hit F5 to refresh. A replay of this presentation and CE Credit information will be sent to you tomorrow via email.
Important Information
If you have any technical difficulty, please click on the Help widget. It has a question mark and covers common technical issues.
Important Information
• Options Overview
• Options on ETFs
• Strategies for the Financial Advisor and their clients
• Income Generation, Hedging and
Concentrated positions
• Volatility
• Q and A
Presentation Outline
Options involve risks and are not suitable for everyone. Prior to buying or selling options, an investor
must receive a copy of Characteristics and Risks of Standardized Options. Individuals should not enter
into options transactions until they have read and understood the risk disclosure document,
Characteristics and Risks of Standardized Options, available by visiting OptionsEducation.org. Copies
may be obtained by contacting your broker or The Options Industry Council at One North Wacker
Drive, Chicago, IL 60606.
In order to simplify the computations, commissions, fees, margin interest and taxes have not been
included in the examples used in these materials. These costs will impact the outcome of all stock and
options transactions and must be considered prior to entering into any transactions. Investors should
consult their tax advisor about any potential tax consequences.
Any strategies discussed, including examples using actual securities and price data, are strictly for
illustrative and educational purposes only and are not to be construed as an endorsement,
recommendation, or solicitation to buy or sell securities. Past performance is not a guarantee of future
results.
LEAPS® is a registered trademark of the Chicago Board Options Exchange, Incorporated. Long-term
Equity AnticiPation SecuritiesSM and WeeklysSM are service marks of the Chicago Board Options
Exchange, Incorporated. Copyright © 2016. The Options Industry Council. All rights reserved.
The Options Industry Council
Who We Are
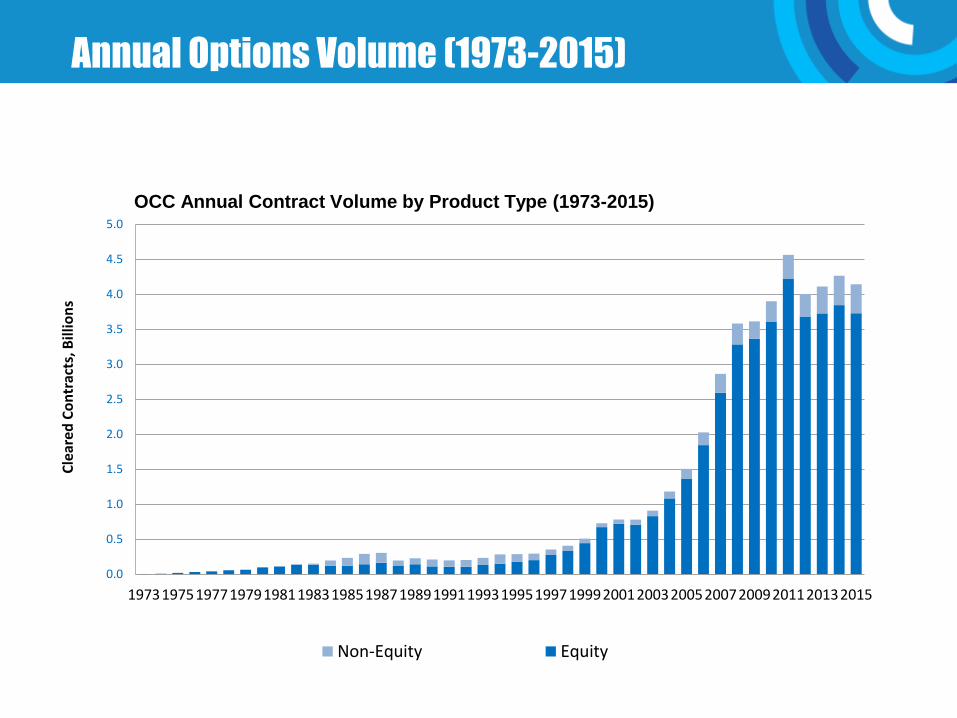
Annual Options Volume (1973-2015)
OCC Annual Contract Volume by Product Type (1973-2015)
0.0
0.5
1.0
1.5
2.0
2.5
3.0
3.5
4.0
4.5
5.0
1973197519771979198119831985198719891991199319951997199920012003200520072009201120132015
Cle
ared
Co
ntr
acts
, Bill
ion
s
Non-Equity Equity
• Options give you more ways to implement your market research
• Options make it possible to target a variety of investment objectives:
− Reduce risk
− Increase income
− Unique tradeoffs
Options Are Tools
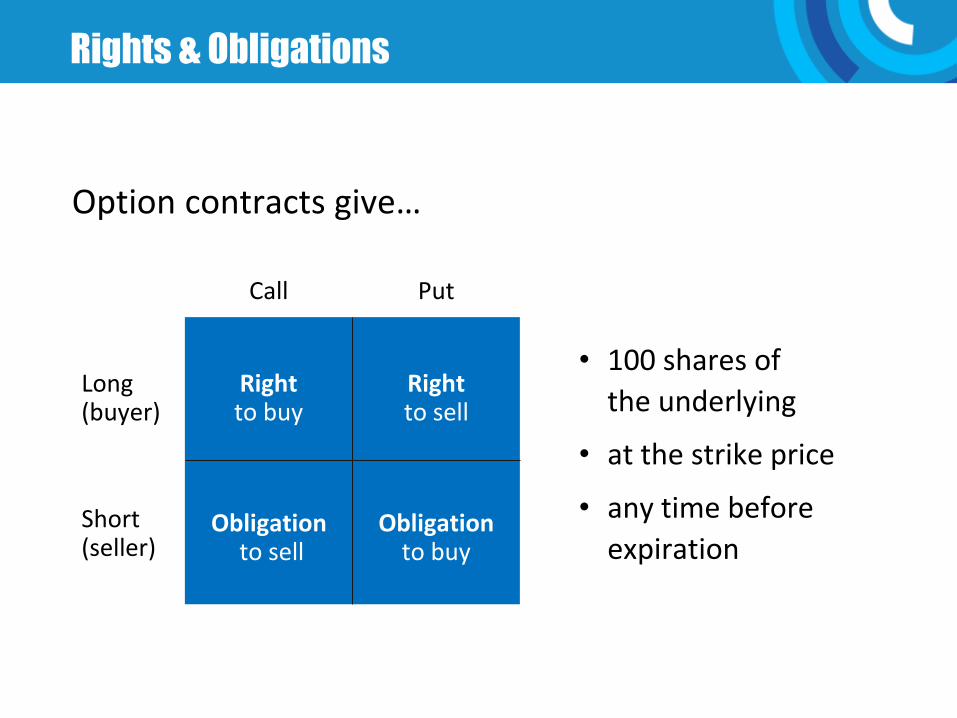
Option contracts give…
• 100 shares of
the underlying
• at the strike price
• any time before
expiration
Call Put
Right to buy
Right to sell
Obligation to buy
Obligation to sell
Short (seller)
Long (buyer)
Rights & Obligations
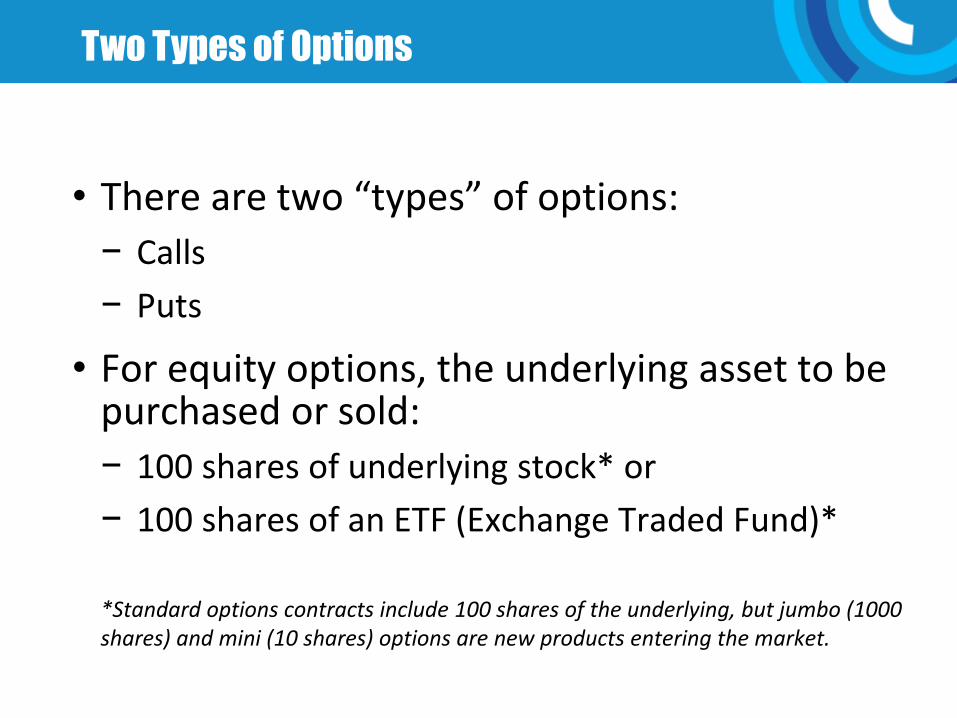
• There are two “types” of options:
− Calls
− Puts
• For equity options, the underlying asset to be purchased or sold:
− 100 shares of underlying stock* or
− 100 shares of an ETF (Exchange Traded Fund)*
*Standard options contracts include 100 shares of the underlying, but jumbo (1000 shares) and mini (10 shares) options are new products entering the market.
Two Types of Options
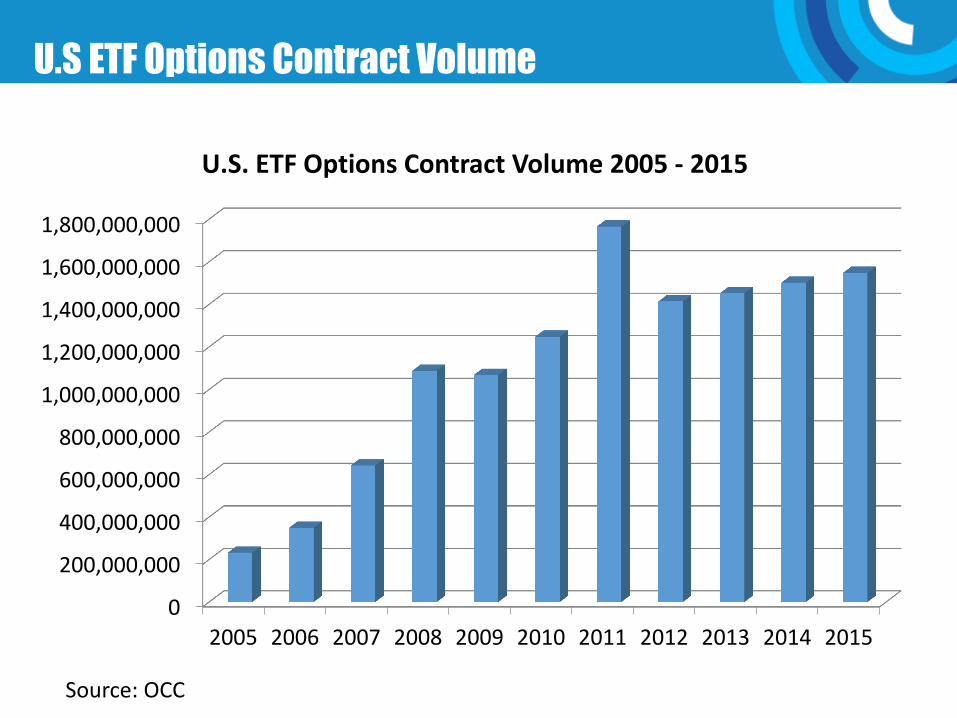
0
200,000,000
400,000,000
600,000,000
800,000,000
1,000,000,000
1,200,000,000
1,400,000,000
1,600,000,000
1,800,000,000
2005 2006 2007 2008 2009 2010 2011 2012 2013 2014 2015
U.S. ETF Options Contract Volume 2005 - 2015
Source: OCC
U.S ETF Options Contract Volume
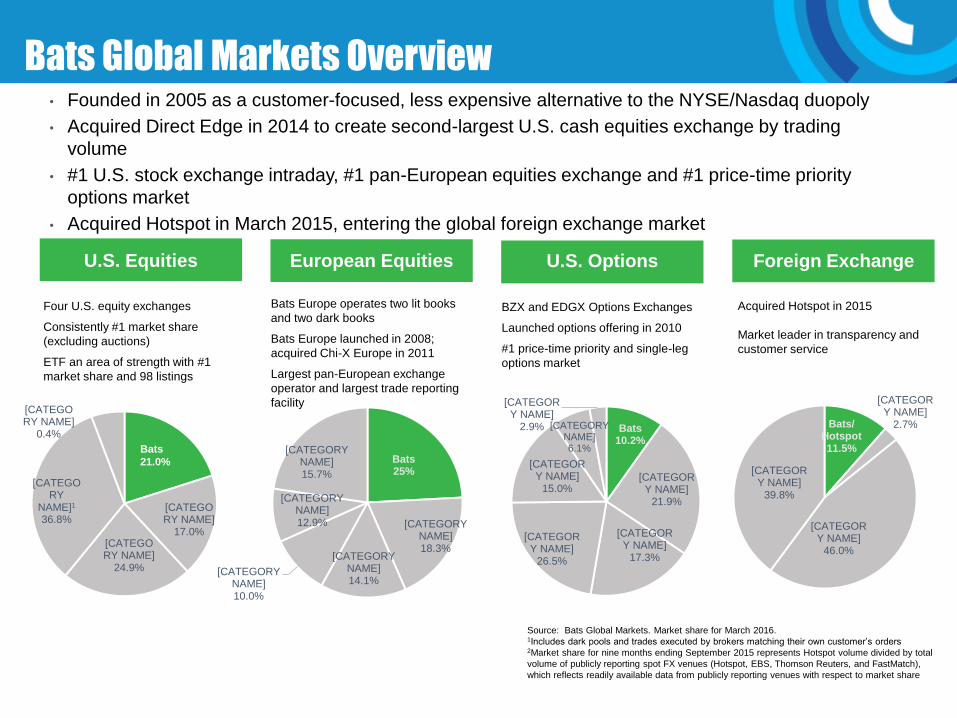
Bats Global Markets Overview • Founded in 2005 as a customer-focused, less expensive alternative to the NYSE/Nasdaq duopoly
• Acquired Direct Edge in 2014 to create second-largest U.S. cash equities exchange by trading
volume
• #1 U.S. stock exchange intraday, #1 pan-European equities exchange and #1 price-time priority
options market
• Acquired Hotspot in March 2015, entering the global foreign exchange market
Four U.S. equity exchanges
Consistently #1 market share
(excluding auctions)
ETF an area of strength with #1
market share and 98 listings
Bats Europe operates two lit books
and two dark books
Bats Europe launched in 2008;
acquired Chi-X Europe in 2011
Largest pan-European exchange
operator and largest trade reporting
facility
BZX and EDGX Options Exchanges
Launched options offering in 2010
#1 price-time priority and single-leg
options market
U.S. Equities European Equities U.S. Options Foreign Exchange
Acquired Hotspot in 2015
Market leader in transparency and
customer service
Bats 25%
[CATEGORY NAME] 18.3%
[CATEGORY NAME] 14.1%
[CATEGORY NAME] 10.0%
[CATEGORY NAME] 12.9%
[CATEGORY NAME] 15.7%
[CATEGORY NAME]
17.0% [CATEGORY NAME]
24.9%
[CATEGORY
NAME]1 36.8%
[CATEGORY NAME]
0.4% Bats
10.2%
[CATEGORY NAME]
21.9%
[CATEGORY NAME]
17.3%
[CATEGORY NAME]
26.5%
[CATEGORY NAME]
15.0%
[CATEGORY NAME] 6.1%
[CATEGORY NAME]
2.9% Bats/ Hotspot 11.5%
[CATEGORY NAME]
2.7%
[CATEGORY NAME]
46.0%
[CATEGORY NAME]
39.8%
Bats
21.0%
Source: Bats Global Markets. Market share for March 2016. 1Includes dark pools and trades executed by brokers matching their own customer’s orders 2Market share for nine months ending September 2015 represents Hotspot volume divided by total
volume of publicly reporting spot FX venues (Hotspot, EBS, Thomson Reuters, and FastMatch),
which reflects readily available data from publicly reporting venues with respect to market share

Leader in ETF volume
16
SM
SM
23.4%
[VALUE]
13.8%
Source: Bats Global Markets (ETFMarketplace.com)
for month of June 2016. Includes volume executed
on exchanges only, including auctions.
The Growth of the Global ETF Market
17
Some key statistics:
• Globally, listed ETFs reached a record $3.2trn at the end of June 2016, according to the consultancy ETFGI.
• Blackrock expects AUM of global ETPs to grow 17% annually through 2019
• Bats predicts global ETF assets will grow to more than $15trn during the next 10 years as they become the preferred “wrapper” for portfolio investment vehicles
• According to Bloomberg, 40% of millennials own ETFs
These are driven by global investment trends:
• Seismic shift from active “stock-picker” management to passive “index-tracking” strategies
• Advanced, automated advisory services (“robo-advisory”) and Fintech services are redefining the cost of investing
Options on ETFs
18
The rise of ETFs is very evident in the U.S. equity options market:
• ETF options now account for $77bn of the total $110bn equity options traded each day
• ETF options therefore account for about 70% of all equity option notional volume, the inverse of the equity market where ETFs account for around 30% of notional volume traded
• Options on the SPY ETF itself account for around $55bn of all equity options volume
Source: Bloomberg data
Our Focus on ETFs
19
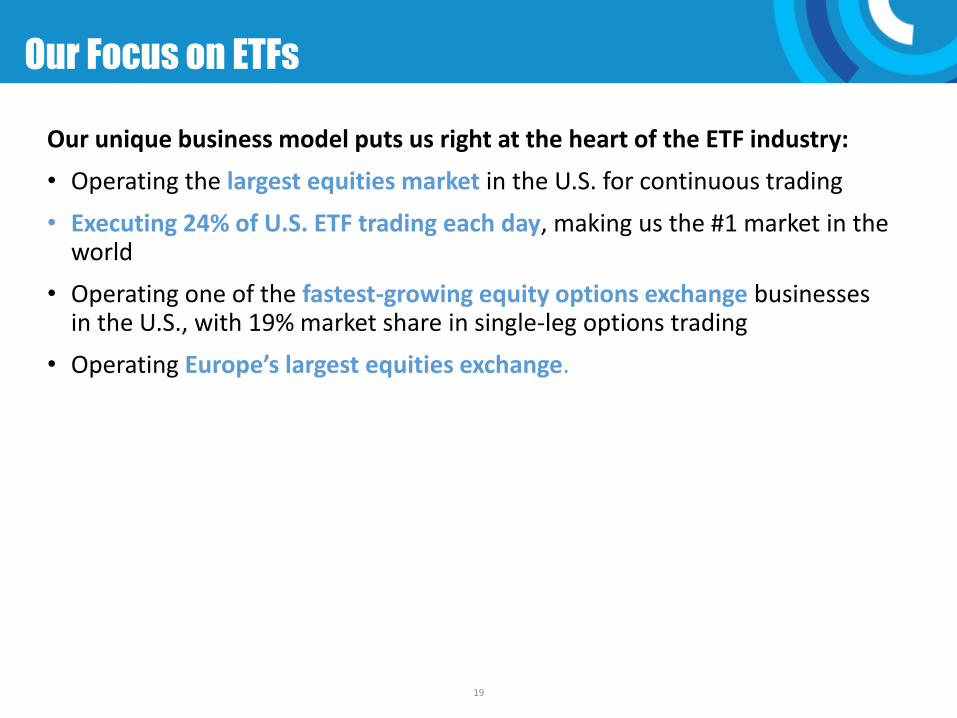
Our unique business model puts us right at the heart of the ETF industry:
• Operating the largest equities market in the U.S. for continuous trading
• Executing 24% of U.S. ETF trading each day, making us the #1 market in the world
• Operating one of the fastest-growing equity options exchange businesses in the U.S., with 19% market share in single-leg options trading
• Operating Europe’s largest equities exchange.
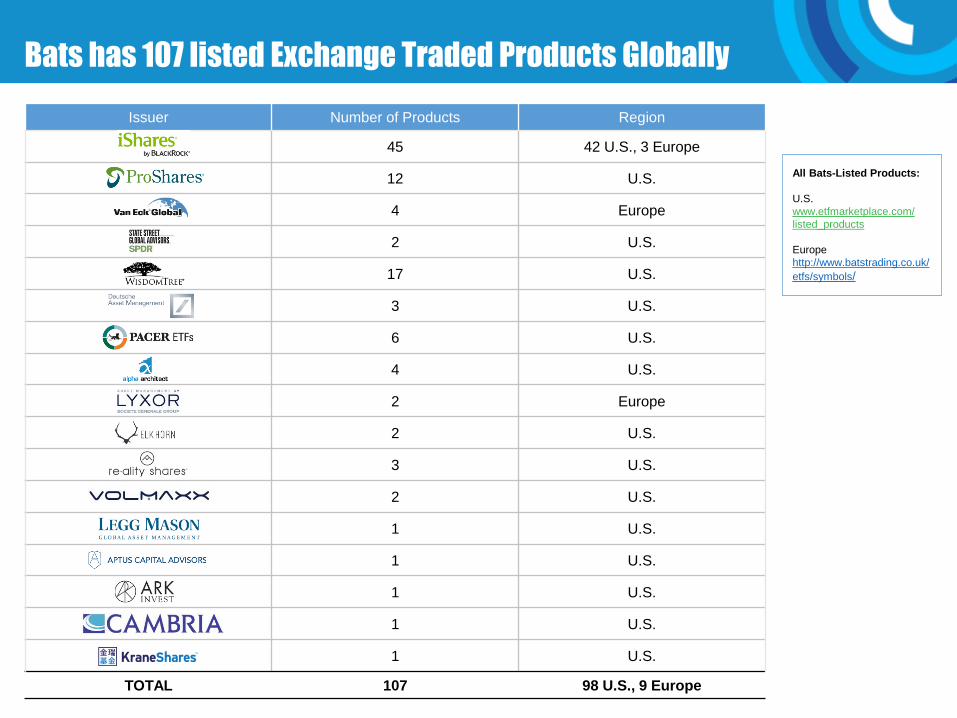
Bats has 107 listed Exchange Traded Products Globally
Issuer Number of Products Region
45 42 U.S., 3 Europe
12 U.S.
4 Europe
2 U.S.
17 U.S.
3 U.S.
6 U.S.
4 U.S.
2 Europe
2 U.S.
3 U.S.
2 U.S.
1 U.S.
1 U.S.
1 U.S.
1 U.S.
1 U.S.
TOTAL 107 98 U.S., 9 Europe
All Bats-Listed Products:
U.S.
www.etfmarketplace.com/
listed_products
Europe
http://www.batstrading.co.uk/
etfs/symbols/

Covered Call Definition
• Covered call: investor simultaneously −Writes (sells) one or more equity call contracts
−Buys equivalent number of underlying shares
−One short call for each 100 long shares
• If stock is bought and call written at same time
−“Covered write” or “buy-write”
• If stock already owned when call is written
−“Overwrite”
Why Write Covered Calls?
• Primary goal – increase returns −Call premium received and kept (assigned or not)
−Generate additional income (over any dividends)
• Investor’s forecast −Neutral to bullish on the underlying stock
−Within a small price range over strategy’s lifetime
• Call premium’s limited downside benefits −Lowers stock’s break-even point (BEP)
−Reduces cost basis for long stock by call premium amount

Covered Call Writer’s Obligations?
• Like any call writer (short call position) −Has the obligation to sell underlying shares
−At strike price
−If assigned
• Assignment (your potential obligation) −Possible at any time before expiration
−Equity options are American-style
• In return for this obligation −Call writer receives and keeps option premium
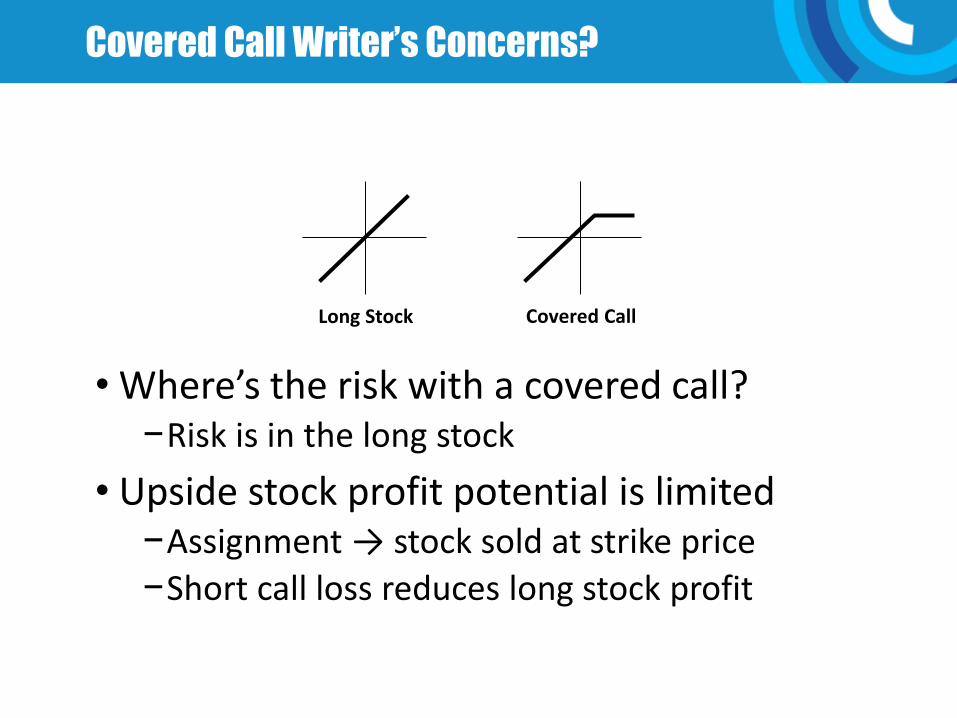
Covered Call Writer’s Concerns?
• Where’s the risk with a covered call? −Risk is in the long stock
• Upside stock profit potential is limited −Assignment → stock sold at strike price
−Short call loss reduces long stock profit
Long Stock Covered Call
Covered Call: ITM vs. OTM
• Writing in-the-money covered call −Defensive and more conservative
−More premium received → more downside protection
−Less upside profit potential
• Writing out-of-the-money covered call −Aggressive and less conservative
−Less premium received → less downside protection
−More upside profit potential
ETF Options Strategies - Income
• Why Options for Income? • Alternative to Fixed Income • Lower Risk than Equity Income • Popular & Tested Strategies
ETF Options Strategies - Income • Covered call or buy-write:
• Short call + long underlying • Earn premium • Forego some upside; almost full downside (On
a Monthly Basis) • Fully collateralized
ETF Options Strategies – Income
• Covered call: Earn income from non-traditional sources
• QQQ • GLD • SLV
ETF Options Strategies - Income
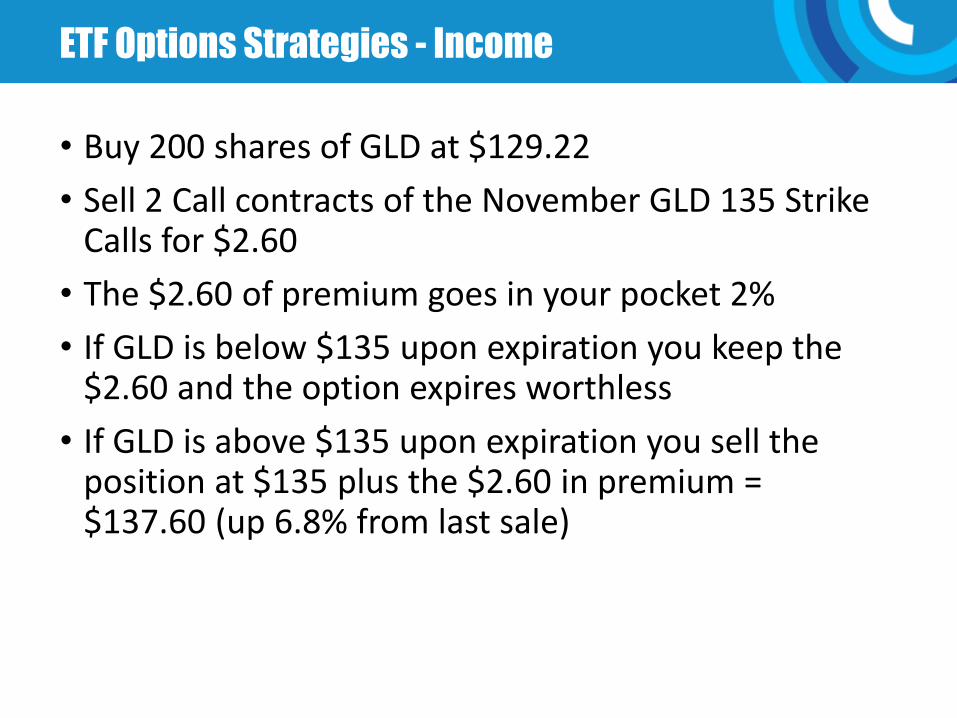
• Buy 200 shares of GLD at $129.22
• Sell 2 Call contracts of the November GLD 135 Strike Calls for $2.60
• The $2.60 of premium goes in your pocket 2%
• If GLD is below $135 upon expiration you keep the $2.60 and the option expires worthless
• If GLD is above $135 upon expiration you sell the position at $135 plus the $2.60 in premium = $137.60 (up 6.8% from last sale)
ETF Options Strategies - Income
• Cash Secured Put Write • Same payoff profile as covered call
• Useful for entering new positions
ETF Options Strategies - Income
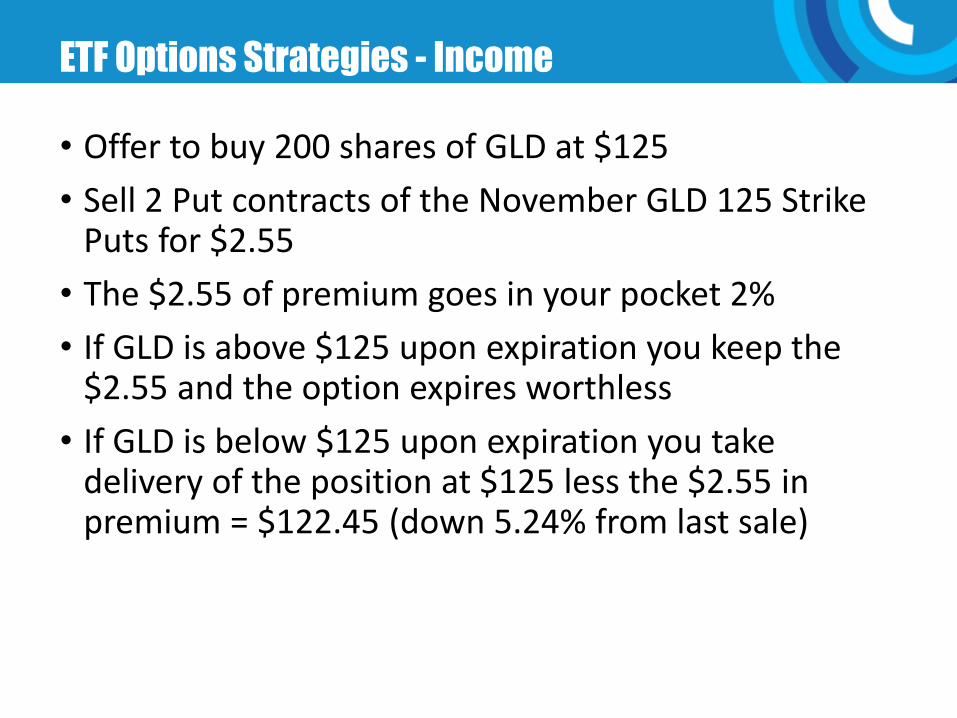
• Offer to buy 200 shares of GLD at $125
• Sell 2 Put contracts of the November GLD 125 Strike Puts for $2.55
• The $2.55 of premium goes in your pocket 2%
• If GLD is above $125 upon expiration you keep the $2.55 and the option expires worthless
• If GLD is below $125 upon expiration you take delivery of the position at $125 less the $2.55 in premium = $122.45 (down 5.24% from last sale)
ETF Options Strategies - Trading
• Bid-ask spreads • Use Limit Orders
• 1 Contract =100 shares of ETF • 1 Mini Contract = 10 shares of ETF
• Brokerage fees
• Mind the ex-date for dividend-paying ETFs
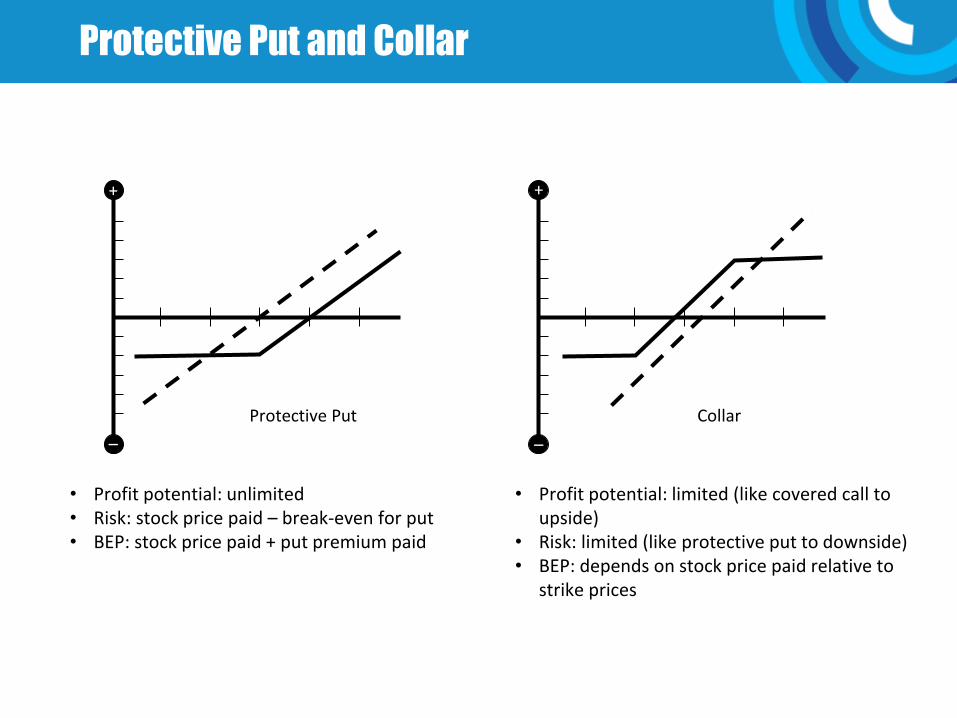
• Profit potential: unlimited • Risk: stock price paid – break-even for put • BEP: stock price paid + put premium paid
• Profit potential: limited (like covered call to upside)
• Risk: limited (like protective put to downside) • BEP: depends on stock price paid relative to
strike prices
Protective Put Collar
+
–
+
–
Protective Put and Collar
Collar: Two Strategies in One
• The 100 shares of stock play a part in both
• On the downside you have a protective put − OTM put purchased
− Grants right to sell shares at put’s strike until expiration
− OTM call will expire worthless
• On the upside you have a covered call − OTM call sold
− Upside profit limited by call’s strike price if assigned
− OTM put will expire worthless
Motivations
• Stock investor has unrealized profits −Wants downside protection for all or part
−Cost of put more than willing to pay for insurance
• Investor feels some upside profit potential remains −Sells OTM call
−Offsets all or part of put cost with premium received
• Investor accepts tradeoff −Limited upside worth downside protection desired

Definition of a Perfect Hedge: Maintain Returns, Eliminate Volatility
Goal: Introduce hedging as a value added proposition
Same returns at lower volatility
Higher returns at same volatility
Challenge
Hedging often introduce negative alpha
Hedging often impacts desired risks exposures
-10%
0%
10%
20%
30%
40%
50%
60%
0.0 1.0 4.0 5.0 2.0 3.0
Time (Years)
Portfolio Returns
Perfectly Hedged Portfolio Returns
How can we generate alpha through the hedging process?
Beta Hedging
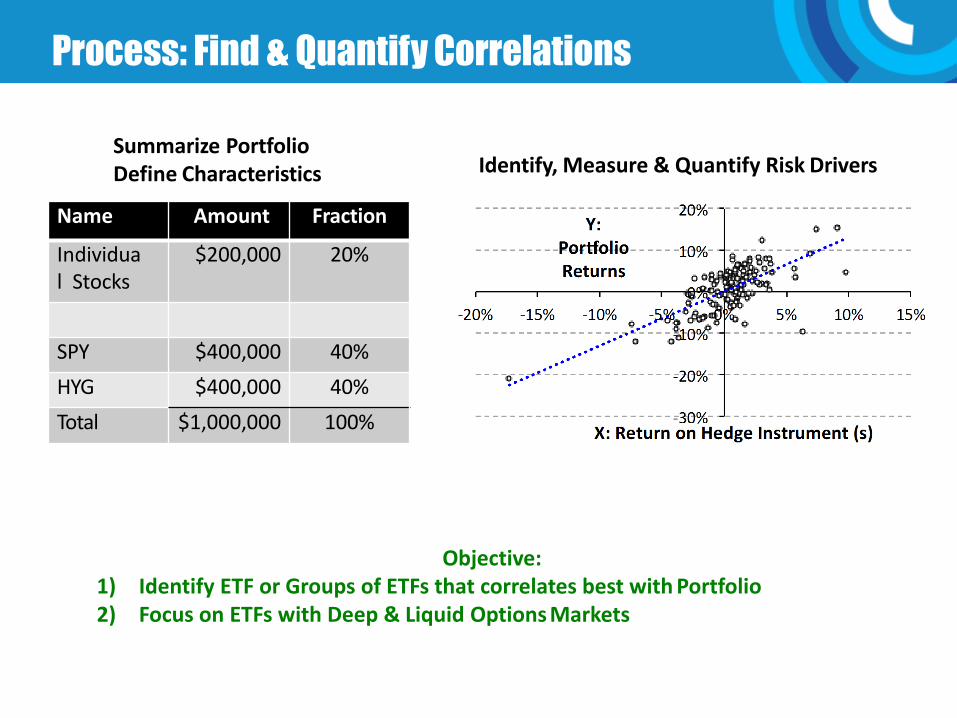
Process: Find & Quantify Correlations
Summarize Portfolio Define Characteristics
Name Amount Fraction
Individual Stocks
$200,000 20%
SPY $400,000 40%
HYG $400,000 40%
Total $1,000,000 100%
Identify, Measure & Quantify Risk Drivers
Objective: 1) Identify ETF or Groups of ETFs that correlates best with Portfolio 2) Focus on ETFs with Deep & Liquid Options Markets
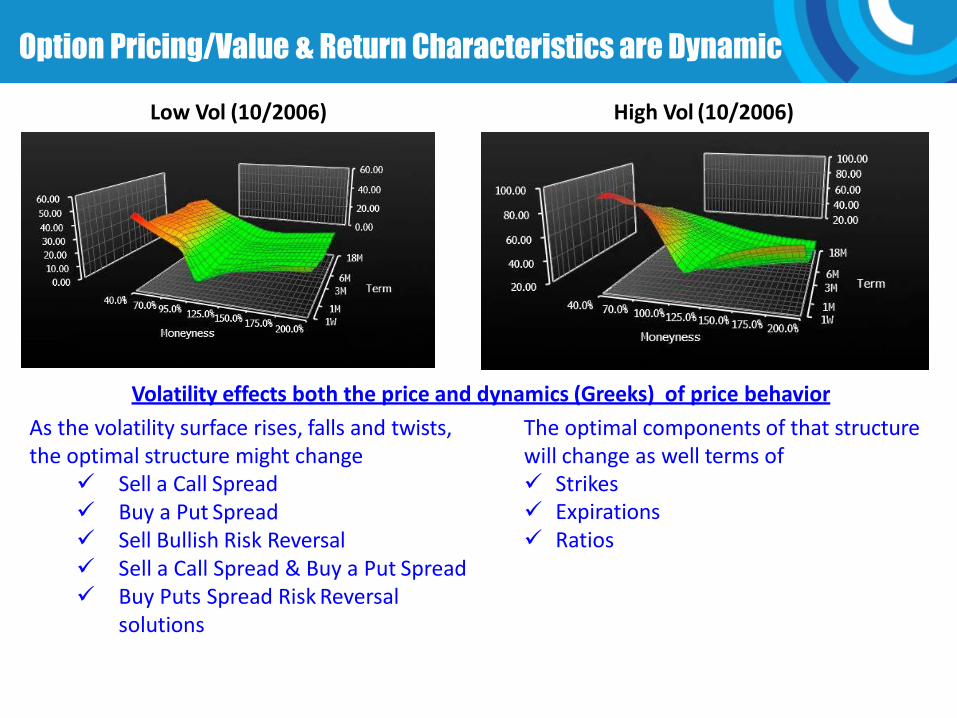
Option Pricing/Value & Return Characteristics are Dynamic
Low Vol (10/2006) High Vol (10/2006)
As the volatility surface rises, falls and twists, the optimal structure might change
Sell a Call Spread Buy a Put Spread Sell Bullish Risk Reversal Sell a Call Spread & Buy a Put Spread Buy Puts Spread Risk Reversal
solutions
The optimal components of that structure will change as well terms of Strikes Expirations Ratios
Volatility effects both the price and dynamics (Greeks) of price behavior
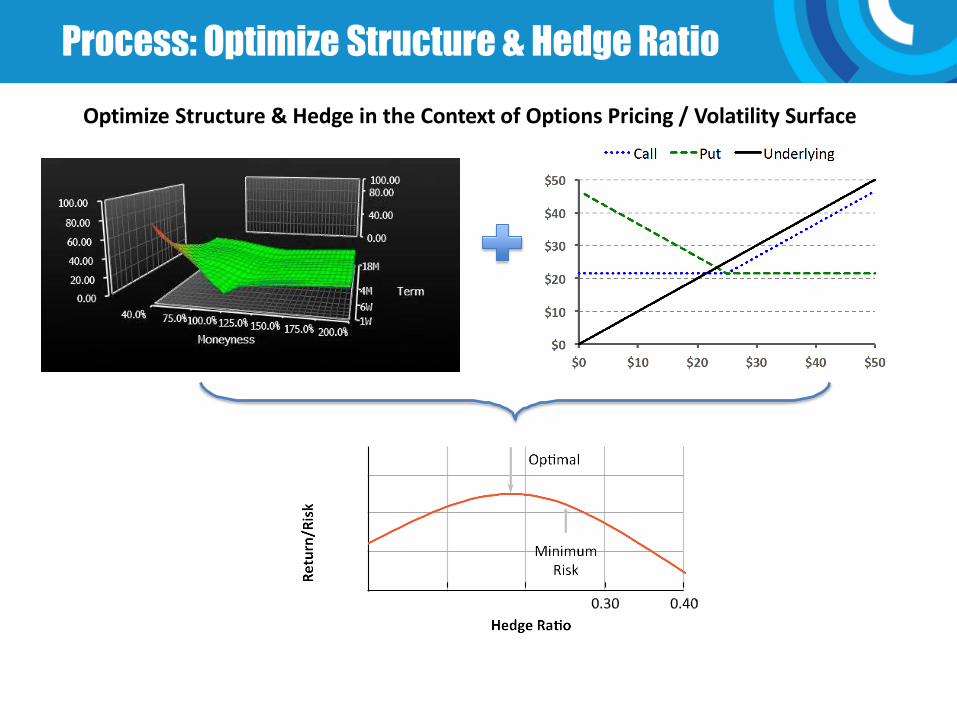
Process: Optimize Structure & Hedge Ratio
Optimize Structure & Hedge in the Context of Options Pricing / Volatility Surface
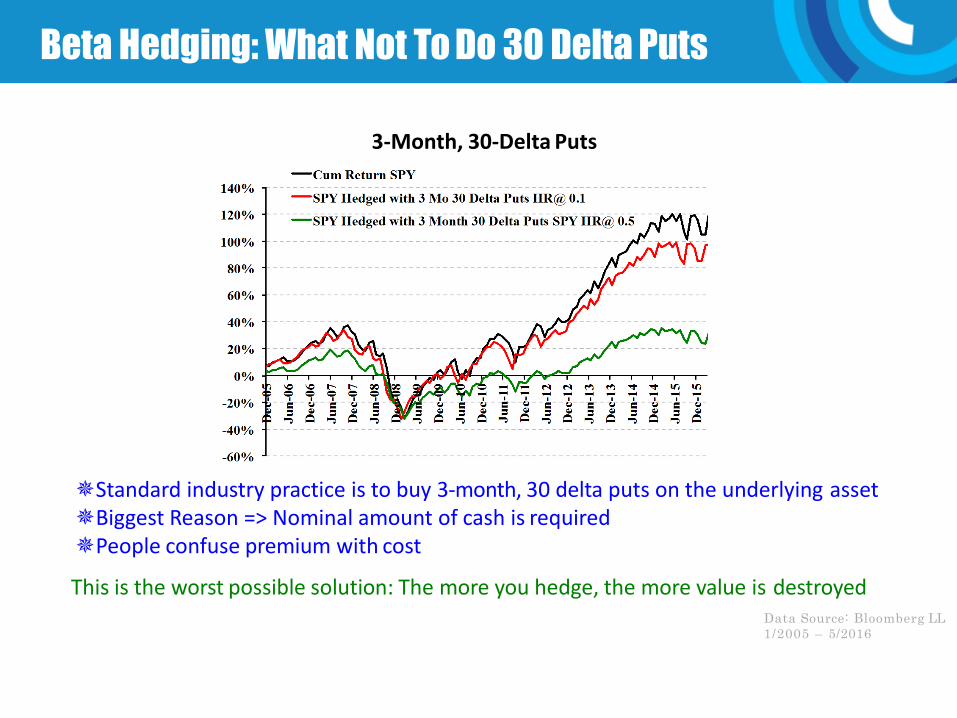
Beta Hedging: What Not To Do 30 Delta Puts
3-Month, 30-Delta Puts
Data Source: Bloomberg LL
1/2005 – 5/2016
Standard industry practice is to buy 3-month, 30 delta puts on the underlying asset Biggest Reason => Nominal amount of cash is required People confuse premium with cost
This is the worst possible solution: The more you hedge, the more value is destroyed
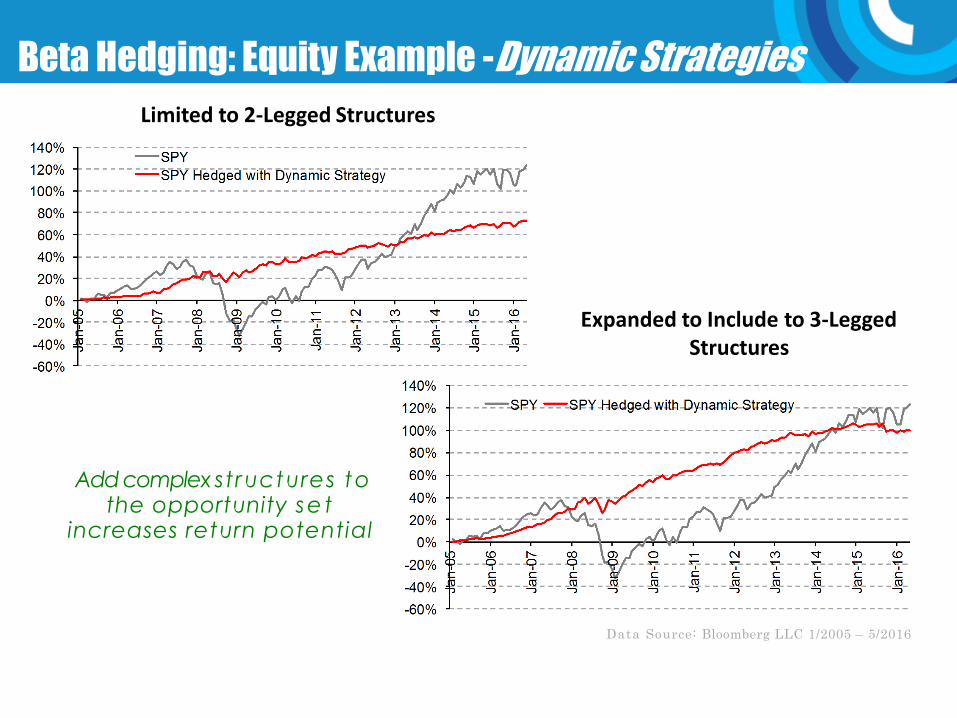
Beta Hedging: Equity Example -Dynamic Strategies
Data Source: Bloomberg LLC 1/2005 – 5/2016
Limited to 2-Legged Structures
Expanded to Include to 3-Legged Structures
Add complex structures to the opportunity se t
increases return potential
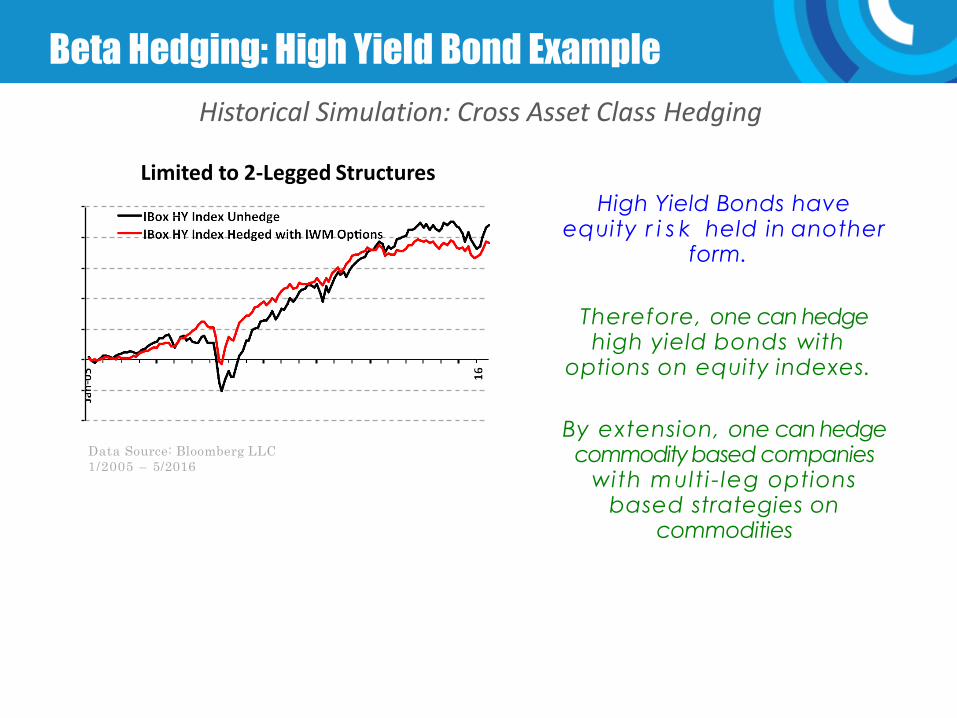
Historical Simulation: Cross Asset Class Hedging
Data Source: Bloomberg LLC
1/2005 – 5/2016
High Yield Bonds have equity r i s k held in another
form.
Therefore, one can hedge high yield bonds with
options on equity indexes.
By extension, one can hedge commodity based companies
with mult i - leg options based strategies on
commodities
Limited to 2-Legged Structures
Beta Hedging: High Yield Bond Example
SPYIX
43
• Bats T3 SPY Volatility Index: A measure of expected 30-day volatility in the SPDR S&P 500 ETF (SPY)
• The SPYIX is calculated using highly active, electronically traded, multiply listed SPY options
• Improvement over the slower, manually traded, floor-based S&P 500 index options used to calculate other volatility benchmarks
• Incorporates a proprietary “price-dragging” technique to capture live options prices; Reduces erratic intraday movement in the index
• SPYIX uses the well-known variance swap methodology to estimate the market's expectation of volatility
• Highly compatible with existing volatility-based futures, options and exchange-traded products
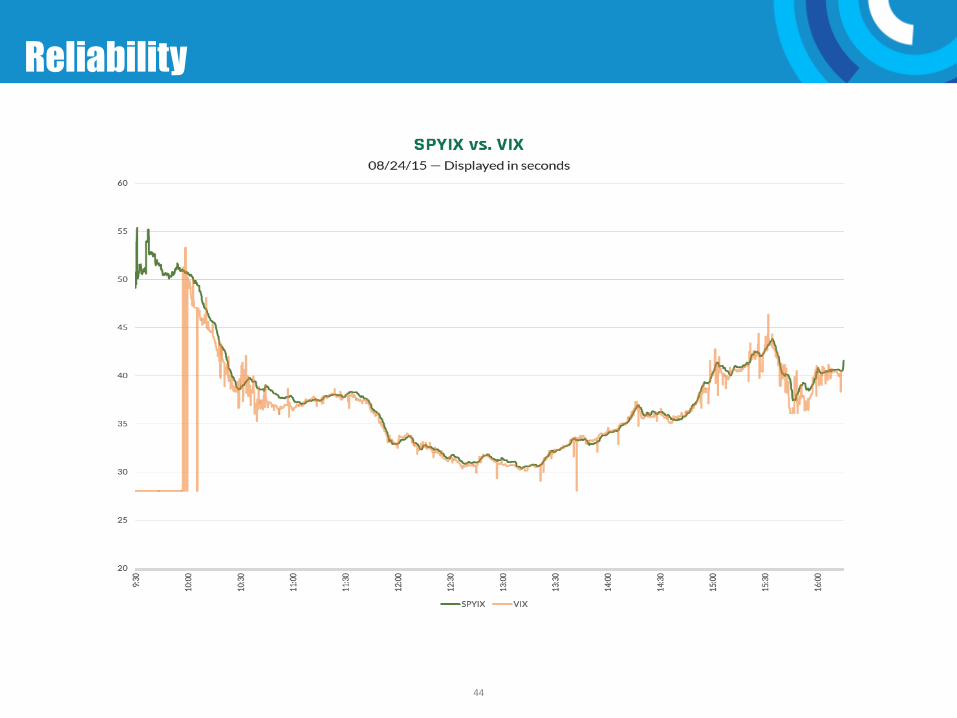
Reliability
44

• www.OptionsEducation.org
• Investor Services: [email protected]
• OIC’s Mobile App
• OIC YouTube Channel
For More Information

Covered Calls Benefits & Tradeoffs
Joe Burgoyne Director, Options Industry Council
Thank you for attending
www.OptionsEducation.org