grades (mmaise), salt lake city, usa. - utah education...
TRANSCRIPT


First published in 2013 by Math Materials Access Improvement for Seventh and Eighth Grades (MMAISE), Salt Lake City, USA. Copyright © 2013, MMAISE. Some rights reserved. This work is published under the Creative Commons Attribution License (“CC BY”) which is available online at http://creativecommons.org/licenses/by/3.0/ and provides permissions for the reusing, revising, remixing, and redistributing of this work. This work is an open educational resource (OER).
8WB5 - 1
2014 University of Utah Middle School Math Project in partnership with the
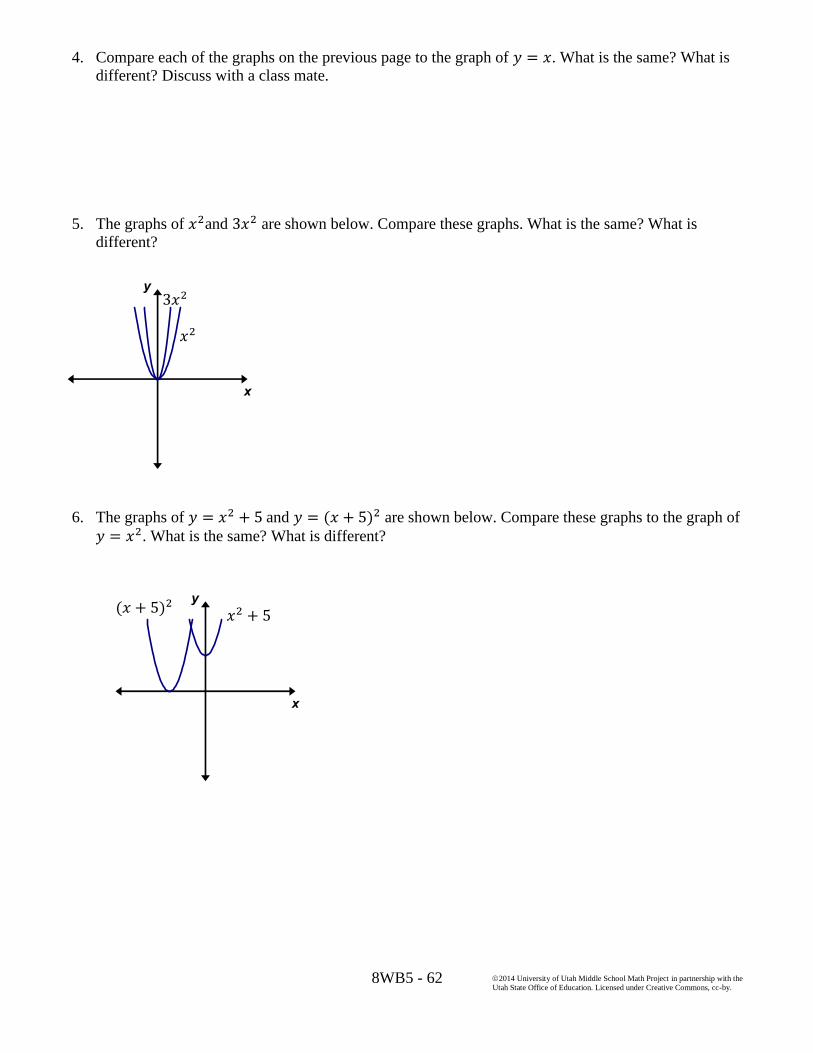
Utah State Office of Education. Licensed under Creative Commons, cc-by.
Table of Contents
CHAPTER 5: FUNCTIONS (3 WEEKS) ........................................................................................................................................... 2 5.0: ANCHOR PROBLEM: WAITING AT THE DMV ............................................................................................................................................ 7 SECTION 5.1: DEFINE FUNCTIONS ....................................................................................................................................................................... 9
5.1a Class Activity: Introduction to Functions .......................................................................................................................................... 10 5.1a Homework: Introduction to Functions ............................................................................................................................................... 15 5.1b Class Activity: Function Machine .......................................................................................................................................................... 18 5.1b Homework: Function Machine ............................................................................................................................................................... 22 5.1c Class Activity: Representations of a Function ................................................................................................................................. 24 5.1c Homework: Representations of a Function ...................................................................................................................................... 29 5.1d Class Activity: Birthdays ............................................................................................................................................................................ 34 5.1d Homework: Birthdays ................................................................................................................................................................................ 37 5.1e Class Activity: More About Functions .................................................................................................................................................. 39 5.1e Homework: More About Functions ...................................................................................................................................................... 43 5.1f Self-Assessment: Section 5.1 ..................................................................................................................................................................... 46
SECTION 5.2: EXPLORE LINEAR AND NONLINEAR FUNCTIONS .................................................................................................................... 49 5.2a Class Activity: Display Designs ............................................................................................................................................................... 50 5.2a Homework: More Patterns – Are They Linear? .............................................................................................................................. 53 5.2b Class Activity: Linear and NonLinear Functions in Context ..................................................................................................... 55 5.2b Homework: Linear and NonLinear Functions in Context .......................................................................................................... 57 5.2d Class Activity: Different Types of Functions ..................................................................................................................................... 60 5.2d Homework: Different Types of Functions .......................................................................................................................................... 64 5.2e Class Activity: Matching Representations of Functions .............................................................................................................. 66 5.2e Homework: Matching Representations of Functions ................................................................................................................... 72 5.2f Self-Assessment: Section 5.2 ..................................................................................................................................................................... 73
SECTION 5.3: MODEL AND ANALYZE A FUNCTIONAL RELATIONSHIP ......................................................................................................... 75 5.3a Class Activity: Constructing Linear Functions ................................................................................................................................ 76 5.3a Homework: Constructing Linear Functions ..................................................................................................................................... 79 5.3b Class Activity: Comparing Linear Functions .................................................................................................................................... 81 5.3b Homework: Comparing Linear Functions ........................................................................................................................................ 86 5.3c Class Activity: Features of Graphs ......................................................................................................................................................... 91 5.3c Homework: Features of Graphs ............................................................................................................................................................. 97 5.3d Class Activity: CBR Activity ...................................................................................................................................................................... 99 5.3d Homework: Stories and Graphs ......................................................................................................................................................... 101 5.3e Class Activity: School’s Out .................................................................................................................................................................... 103 5.3e Homework: School’s Out ........................................................................................................................................................................ 105 5.3f Class Activity: From Graphs to Stories .............................................................................................................................................. 108 5.3f Homework: From Graphs to Stories .................................................................................................................................................. 112 5.3g Class Activity: From Stories to Graphs ............................................................................................................................................ 115 5.3g Homework: From Stories to Graphs ................................................................................................................................................. 119 5.3h Self-Assessment: Section 5.3 ................................................................................................................................................................. 122

8WB5 - 2
2014 University of Utah Middle School Math Project in partnership with the
Utah State Office of Education. Licensed under Creative Commons, cc-by.
Chapter 5: Functions (3 weeks)
Utah Core Standard(s):
Understand that a function is a rule that assigns to each input exactly one output. The graph of a function
is the set of ordered pairs consisting of an input and the corresponding output. (8.F.1)
Interpret the equation 𝑦 = 𝑚𝑥 + 𝑏 as defining a linear function, whose graph is a straight line; give
examples of functions that are not linear. For example, the function 𝐴 = 𝑠2 giving the area of a square as
a function of its side length is not linear because its graph contains the points (1, 1), (2, 4) and (3, 9),
which are not on a straight line. (8.F.3)
Construct a function to model a linear relationship between two quantities. Determine the rate of change
and initial value of the function from a description of a relationship or from two (x, y) values, including
reading these from a table or from a graph. Interpret the rate of change and initial value of a linear
function in terms of the situation it models, and in terms of its graph or a table of values. (8.F.4)
Compare properties of two functions each represented in a different way (algebraically, graphically,
numerically in tables, or by verbal descriptions). For example, given a linear function represented by a
table of values and a linear function represented by an algebraic expression, determine which function
has the greater rate of change. (8.F.2)
Describe qualitatively the functional relationship between two quantities by analyzing a graph (e.g.,
where the function is increasing or decreasing, linear or nonlinear). Sketch a graph that exhibits the
qualitative features of a function that has been described verbally. (8.F.5)
Academic Vocabulary: function, input, output, relation, mapping, independent variable, dependent variable,
linear, nonlinear, increasing, decreasing, constant, discrete, continuous, intercepts
Chapter Overview: In this chapter, the theme changes from that of solving an equation for an unknown
number, to that of “function” that describes a relationship between two variables. Students have been working
with many functional relationships in previous chapters; in this chapter we take the opportunity to formally
define function. In a function, the emphasis is on the relationship between two varying quantities where one
value (the output) depends on another value (the input). We start the chapter with an introduction to the concept
of function and provide students with the opportunity to explore functional relationships algebraically,
graphically, numerically in tables, and through verbal descriptions. We then make the distinction between linear
and nonlinear functions. Students analyze the characteristics of the graphs, tables, equations, and contexts of
linear and nonlinear functions, solidifying the understanding that linear functions grow by equal differences
over equal intervals. Finally, students use functions to model relationships between quantities that are linearly
related. Students will also describe attributes of a function by analyzing a graph and create a graphical
representation given the description of the relationship between two quantities.
Connections to Content:
Prior Knowledge: Up to this point, students have been working with linear equations. They know how to solve,
write, and graph equations. In this chapter, students make the transition to function. In the realm of functions,
we begin to interpret symbols as variables that range over a whole set of numbers. Functions describe situations
where one quantity determines another. In this chapter, we seek to understand the relationship between the two
quantities and to construct a function to model the relationship between two quantities that are linearly related.
Future Knowledge: This chapter builds an understanding of what a function is and gives students the
opportunity to interpret functions represented in different ways, identify the key features of functions, and
construct functions for quantities that are linearly related. This work is fundamental to future coursework where
students will apply these concepts, skills, and understandings to additional families of functions.
8WB5 - 3
2014 University of Utah Middle School Math Project in partnership with the
Utah State Office of Education. Licensed under Creative Commons, cc-by.
MATHEMATICAL PRACTICE STANDARDS
Make sense of
problems and
persevere in
solving them.
On Tamara’s first day of math class, her teacher asked the students to
shake hands with everyone in the room to introduce themselves. There
are 26 students total in the math class. Can you determine the number
of handshakes that took place in Tamara’s math class on the first day
of class? Can the relationship between number of students and the
number of handshakes exchanged be modeled by a linear function?
Justify your answer.
As students grapple with this problem, they will start to look for entry
points to its solution. They may consider a similar situation with fewer
students. They may construct a picture, table, graph, or equation. They
may even act it out, investigating the solution with a concrete model.
Once they have gained entry into the problem, students may look for
patterns and shortcuts that will help them to arrive at a solution either
numerically or algebraically.
Reason
abstractly and
quantitatively.
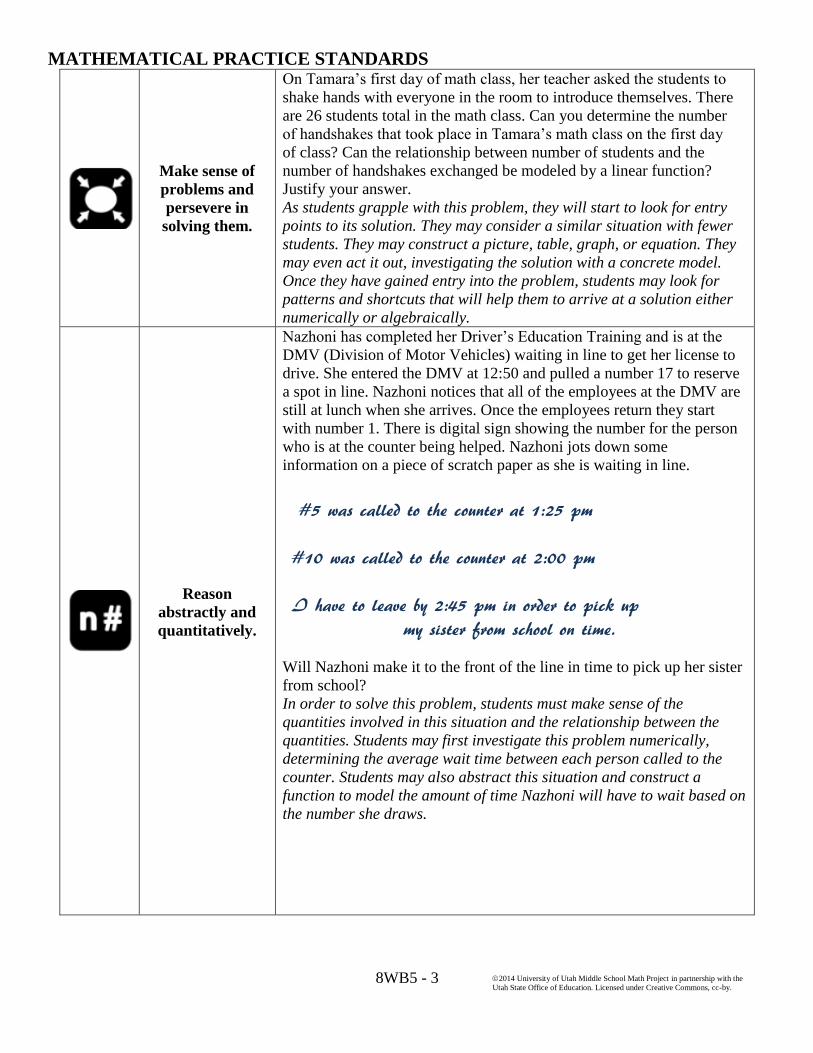
Nazhoni has completed her Driver’s Education Training and is at the
DMV (Division of Motor Vehicles) waiting in line to get her license to
drive. She entered the DMV at 12:50 and pulled a number 17 to reserve
a spot in line. Nazhoni notices that all of the employees at the DMV are
still at lunch when she arrives. Once the employees return they start
with number 1. There is digital sign showing the number for the person
who is at the counter being helped. Nazhoni jots down some
information on a piece of scratch paper as she is waiting in line.
Will Nazhoni make it to the front of the line in time to pick up her sister
from school?
In order to solve this problem, students must make sense of the
quantities involved in this situation and the relationship between the
quantities. Students may first investigate this problem numerically,
determining the average wait time between each person called to the
counter. Students may also abstract this situation and construct a
function to model the amount of time Nazhoni will have to wait based on
the number she draws.
#5 was called to the counter at 1:25 pm #10 was called to the counter at 2:00 pm I have to leave by 2:45 pm in order to pick up my sister from school on time.
8WB5 - 4
2014 University of Utah Middle School Math Project in partnership with the
Utah State Office of Education. Licensed under Creative Commons, cc-by.
Construct viable
arguments and
critique the
reasoning of
others.
Compare and contrast the relationship of the gumball machines at
Vincent Drug and Marley’s Drug Store. If needed revise your conjecture
about what kind of relationship makes a function and what disqualifies a
relationship from being a function.
As students create, modify, and formulate their definition of a function
they are constructing a viable argument that describes their thoughts on
what a function is and what it is not. They make conjectures and build a
logical progression of statements to explore the truth about their
conjectures. They can share their definitions with others and decide
whether they make sense and compare others’ thoughts and ideas to
their own.
Model with
mathematics.
Throughout this chapter, students will apply the mathematics they have
learned to solve problems arising in everyday life, society, and
workplace. The following problems give students the opportunity to use
functions to model relationships between two quantities.
Steve is a lifeguard at a local community pool. Each day at noon, he
records the temperature and the number of people in the pool. Do you
think the relationship between temperature and number of people in the
pool is linear? Why or why not?
Two thousand, five hundred students attend a local high school. School
starts at 8 am and ends at 2:30 pm. Many students stay after school for
clubs, sports, etc. The school has a one-hour lunch at noon and seniors
are allowed to leave campus for lunch. Sketch a graph of the number of
cars in the student parking lot from 6 am to 4 pm.
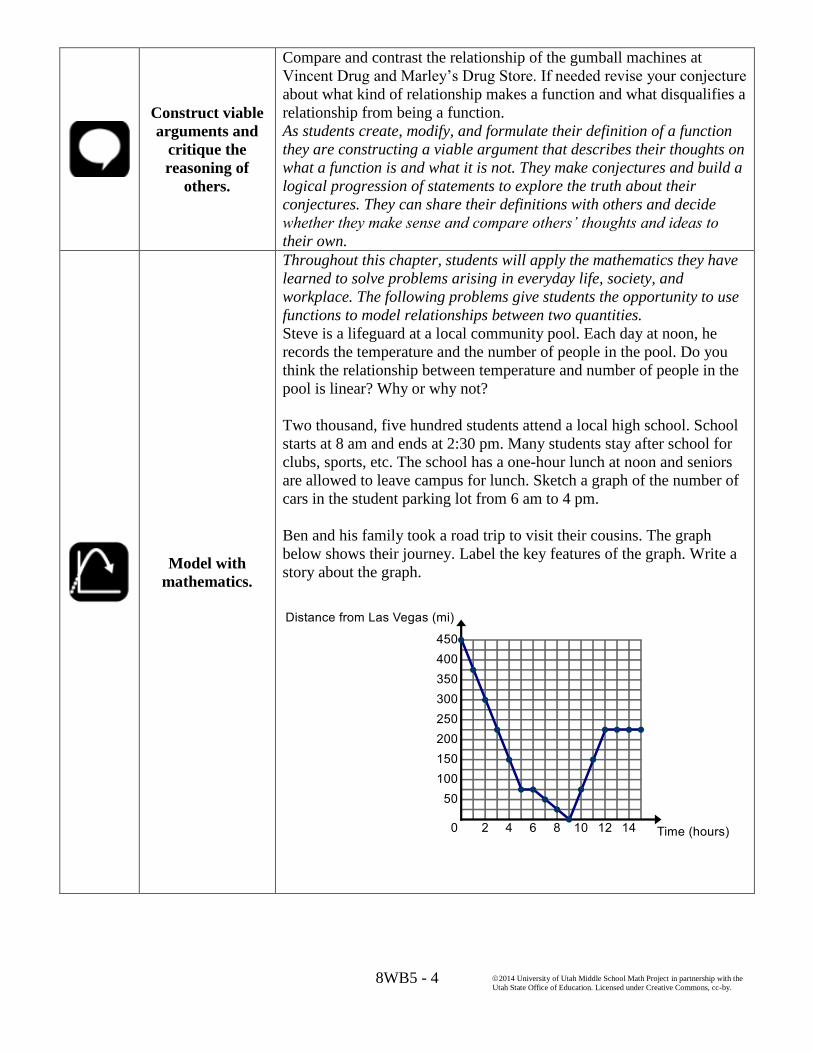
Ben and his family took a road trip to visit their cousins. The graph
below shows their journey. Label the key features of the graph. Write a
story about the graph.

8WB5 - 5
2014 University of Utah Middle School Math Project in partnership with the
Utah State Office of Education. Licensed under Creative Commons, cc-by.
Use appropriate
tools
strategically.
Directions: Determine whether the situations you choose can be
modeled by a linear function or not. Provide evidence to support your
claim. Show your work in the space below.
Mr. Cortez drove at a constant rate for 5 hours. At the end of 2 hours
he had driven 90 miles. After 5 hours, he had driven 225 miles. Can
the relationship between time and distance driven be modeled by a
linear function? Provide evidence to support your claim.
Round 1 of a tennis tournament starts with 64 players. After each
round, half the players have lost and are eliminated from the
tournament. Therefore, in round 2 there are 32 players, in round 3
there are 16 players and so on. Can the relationship between round
number and number of players remaining be modeled by a linear
function? Provide evidence to support your claim.
The first step in constructing a function to model the relationship
between two quantities is to determine what type of model is a potential
fit for the data. At this point, student knowledge of the rate of change of
a linear function is a tool the students rely on to determine whether the
relationship between two quantities can be modeled by a linear
function.
Attend to
precision.
Determine whether each representation describes a function.
Is letter grade a function of percentage scored on a test?
In order to determine whether or not a given representation describes a
function, students must be precise in their understanding of what a
function is.
Shape
Before
Shape
After
Salt Lake City
Provo
Kamas
East HS
Skyline HS
West HS
Timpview HS
Provo HS
South Summit HS
City School
8WB5 - 6
2014 University of Utah Middle School Math Project in partnership with the
Utah State Office of Education. Licensed under Creative Commons, cc-by.
Look for and
make use of
structure.
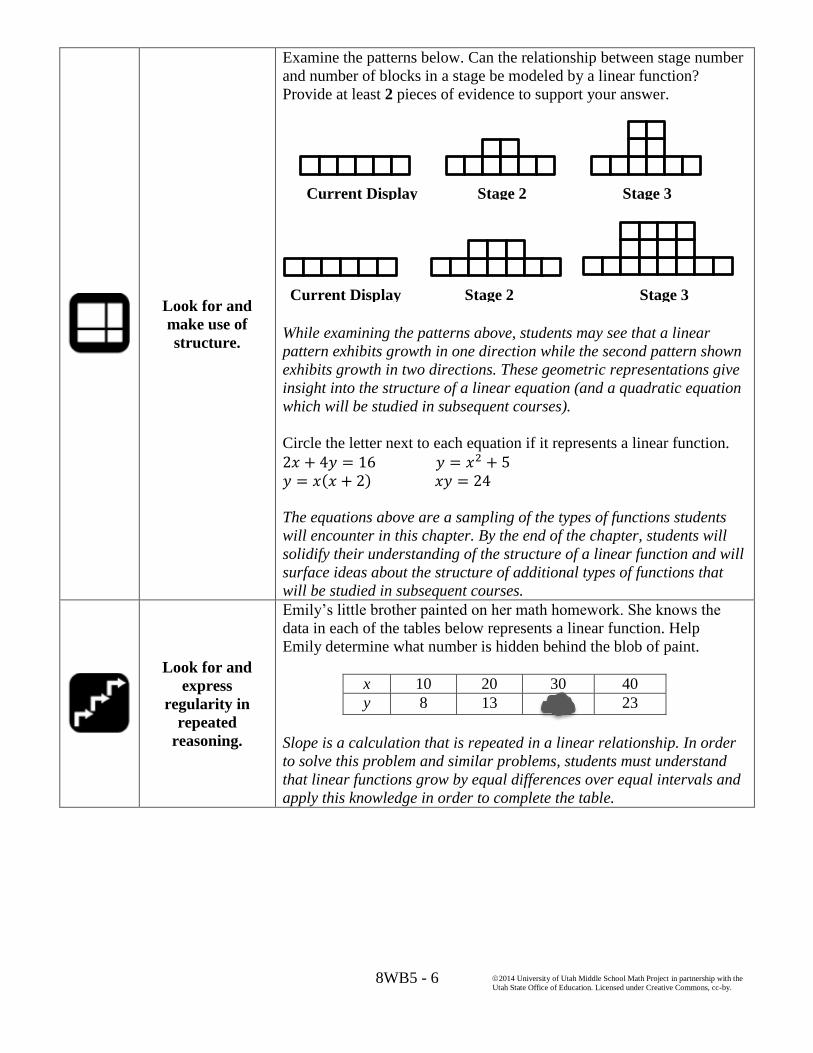
Examine the patterns below. Can the relationship between stage number
and number of blocks in a stage be modeled by a linear function?
Provide at least 2 pieces of evidence to support your answer.
While examining the patterns above, students may see that a linear
pattern exhibits growth in one direction while the second pattern shown
exhibits growth in two directions. These geometric representations give
insight into the structure of a linear equation (and a quadratic equation
which will be studied in subsequent courses).
Circle the letter next to each equation if it represents a linear function.
2𝑥 + 4𝑦 = 16 𝑦 = 𝑥2 + 5
𝑦 = 𝑥(𝑥 + 2) 𝑥𝑦 = 24
The equations above are a sampling of the types of functions students
will encounter in this chapter. By the end of the chapter, students will
solidify their understanding of the structure of a linear function and will
surface ideas about the structure of additional types of functions that
will be studied in subsequent courses.
Look for and
express
regularity in
repeated
reasoning.
Emily’s little brother painted on her math homework. She knows the
data in each of the tables below represents a linear function. Help
Emily determine what number is hidden behind the blob of paint.
x 10 20 30 40
y 8 13 23
Slope is a calculation that is repeated in a linear relationship. In order
to solve this problem and similar problems, students must understand
that linear functions grow by equal differences over equal intervals and
apply this knowledge in order to complete the table.
Current Display
(Stage 1)
Stage 2 Stage 3
Current Display
(Stage 1)
Stage 2 Stage 3

8WB5 - 7
2014 University of Utah Middle School Math Project in partnership with the
Utah State Office of Education. Licensed under Creative Commons, cc-by.
5.0: Anchor Problem: Waiting at the DMV
1. Nazhoni has completed her Driver’s Education Training and is at the DMV (Division of Motor
Vehicles) waiting in line to get her license to drive. She entered the DMV at 12:50 and pulled a number
17 to reserve a spot in line. Nazhoni notices that all of the employees at the DMV are still at lunch when
she arrives. Once the employees return they start with number 1. There is digital sign showing the
number for the person who is at the counter being helped. Nazhoni jots down some information on a
piece of scratch paper as she is waiting in line.
a. Use the picture of the scratch paper above to estimate what time it will be when Nazhomi will
make it to the front of the line. (Note: Assume that each person takes the same amount of
time while being helped at the counter)
b. Will Nazhoni make it to the front of the line in time to pick up her sister from school?
c. What time did the employees return from lunch and begin working.
d. Write an equation that represents the amount of time Nazhoni would have to wait dependent on
the number she draws when she enters the DMV at 12:50.
#5 was called to the counter at 1:25 pm #10 was called to the counter at 2:00 pm I have to leave by 2:45 pm in order to pick up my sister from school on time.
This problem was adapted from a task on Illustrative Mathematics.
8WB5 - 8
2014 University of Utah Middle School Math Project in partnership with the
Utah State Office of Education. Licensed under Creative Commons, cc-by.
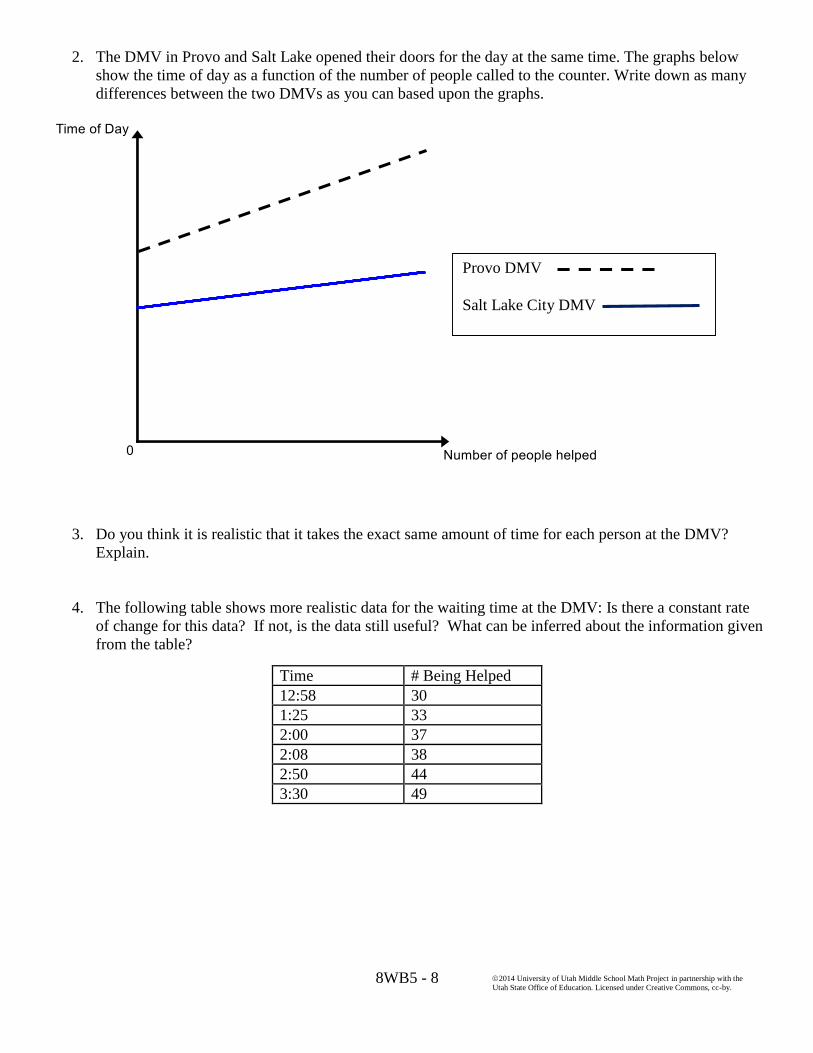
2. The DMV in Provo and Salt Lake opened their doors for the day at the same time. The graphs below
show the time of day as a function of the number of people called to the counter. Write down as many
differences between the two DMVs as you can based upon the graphs.
3. Do you think it is realistic that it takes the exact same amount of time for each person at the DMV?
Explain.
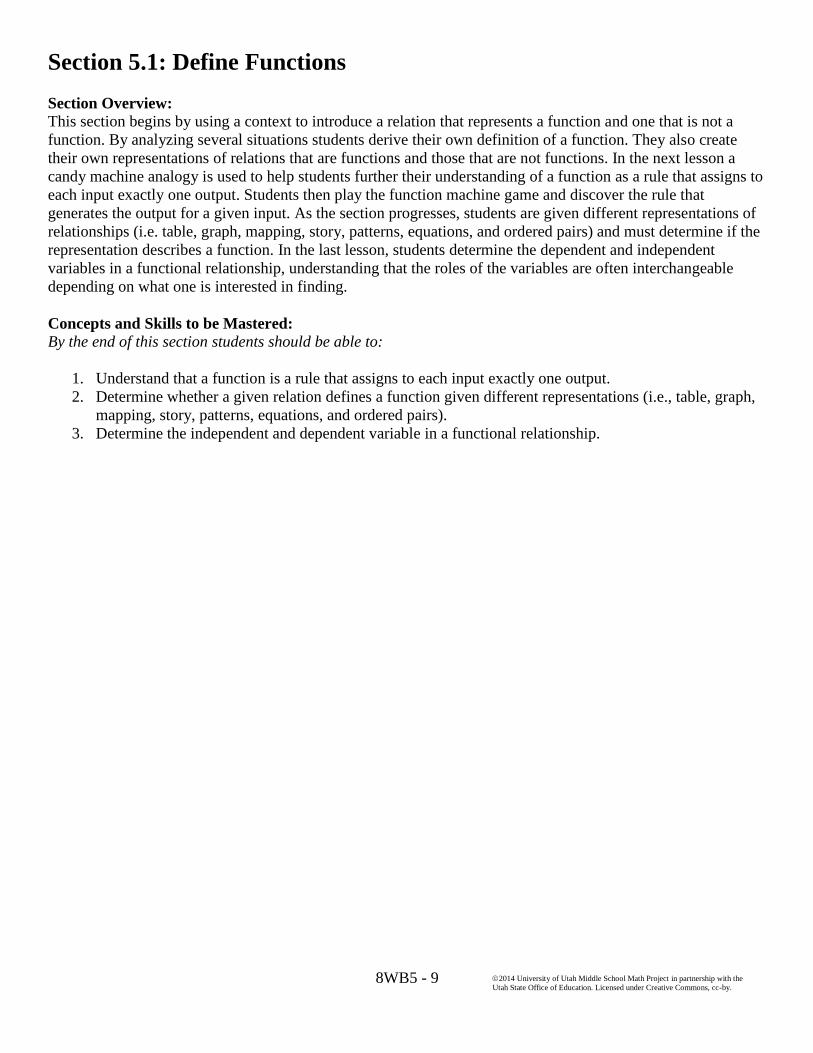
4. The following table shows more realistic data for the waiting time at the DMV: Is there a constant rate
of change for this data? If not, is the data still useful? What can be inferred about the information given
from the table?
Time # Being Helped
12:58 30
1:25 33
2:00 37
2:08 38
2:50 44
3:30 49
Provo DMV
Salt Lake City DMV
8WB5 - 9
2014 University of Utah Middle School Math Project in partnership with the
Utah State Office of Education. Licensed under Creative Commons, cc-by.
Section 5.1: Define Functions
Section Overview:
This section begins by using a context to introduce a relation that represents a function and one that is not a
function. By analyzing several situations students derive their own definition of a function. They also create
their own representations of relations that are functions and those that are not functions. In the next lesson a
candy machine analogy is used to help students further their understanding of a function as a rule that assigns to
each input exactly one output. Students then play the function machine game and discover the rule that
generates the output for a given input. As the section progresses, students are given different representations of
relationships (i.e. table, graph, mapping, story, patterns, equations, and ordered pairs) and must determine if the
representation describes a function. In the last lesson, students determine the dependent and independent
variables in a functional relationship, understanding that the roles of the variables are often interchangeable
depending on what one is interested in finding.
Concepts and Skills to be Mastered: By the end of this section students should be able to:
1. Understand that a function is a rule that assigns to each input exactly one output.
2. Determine whether a given relation defines a function given different representations (i.e., table, graph,
mapping, story, patterns, equations, and ordered pairs).
3. Determine the independent and dependent variable in a functional relationship.
8WB5 - 10
2014 University of Utah Middle School Math Project in partnership with the
Utah State Office of Education. Licensed under Creative Commons, cc-by.
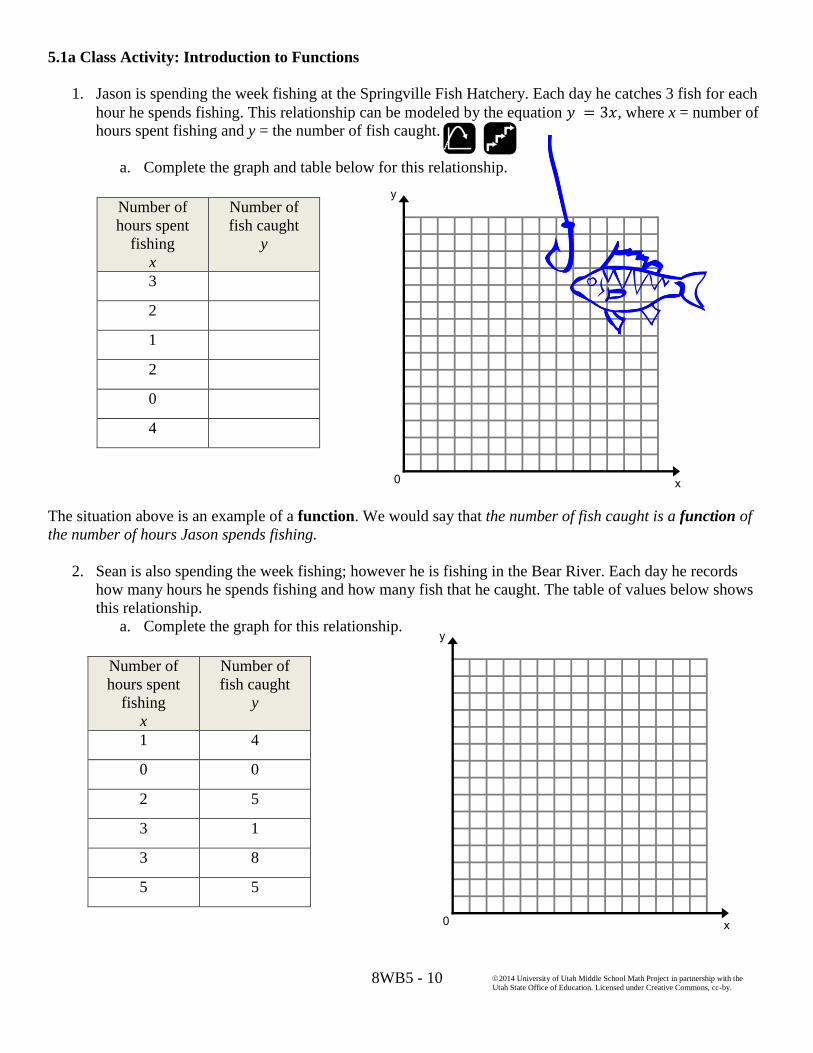
5.1a Class Activity: Introduction to Functions
1. Jason is spending the week fishing at the Springville Fish Hatchery. Each day he catches 3 fish for each
hour he spends fishing. This relationship can be modeled by the equation 𝑦 = 3𝑥, where x = number of
hours spent fishing and y = the number of fish caught.
a. Complete the graph and table below for this relationship.
The situation above is an example of a function. We would say that the number of fish caught is a function of
the number of hours Jason spends fishing.
2. Sean is also spending the week fishing; however he is fishing in the Bear River. Each day he records
how many hours he spends fishing and how many fish that he caught. The table of values below shows
this relationship.
a. Complete the graph for this relationship.
Number of
hours spent
fishing
x
Number of
fish caught
y
3
2
1
2
0
4
Number of
hours spent
fishing
x
Number of
fish caught
y
1 4
0 0
2 5
3 1
3 8
5 5

8WB5 - 11
2014 University of Utah Middle School Math Project in partnership with the
Utah State Office of Education. Licensed under Creative Commons, cc-by.
This situation is an example of a relation that is not a function. The number of fish that Sean catches is not a
function of the number of hours he spends fishing.
3. Compare and contrast the relationship for Jason’s week spent fishing and Sean’s week spent fishing.
Make a conjecture (an educated guess) about what kind of relationship makes a function and what
disqualifies a relation from being a function.
4. Vanessa is buying gumballs at Vincent’s Drug Store. The mapping below shows the relationship
between number of pennies, or x, she puts into the machine and the number of gumballs she gets out, or
y.
a. Complete the graph and table below for this relationship.
b. Write an equation that models this relationship.
This is also an example of a function. We would say that the number of gumballs received is a function of the
number of pennies put in the machine.
x y
Number of
pennies
x
Number of
gumballs
y
1
2
3
4
2
4
6
8

8WB5 - 12
2014 University of Utah Middle School Math Project in partnership with the
Utah State Office of Education. Licensed under Creative Commons, cc-by.
5. Kevin is across town at Marley’s Drug Store. The mapping below relates the number of pennies he puts
into the machine and how many gumballs he get outs.
a. Complete the graph and table below for this relationship.
This situation is an example of a relation that is not a function.
6. Cody is at Ted’s Drug Store. The graph below relates the number of pennies he puts into the machine on
different occasions and how many gumballs he gets out.
a. Explain how this gumball machine works.
b. In this example, is the number of gumballs
received a function of the amount of money
put in? Explain your answer.
x y
Number of
pennies
x
Number of
gumballs
y
1
2
3
2
3
4
6

8WB5 - 13
2014 University of Utah Middle School Math Project in partnership with the
Utah State Office of Education. Licensed under Creative Commons, cc-by.
7. Compare and contrast the relationship of the gumball machines at the different drugstores. If needed
revise your conjecture about what kind of relationship makes a function and what disqualifies a
relationship from being a function.
Below is a formal definition of a function. As you read it compare it to the conjecture you made about what
makes a relation a function.
Refer back to the first two examples. When Jason went fishing, he caught a unique number of fish based on the
number of hours he spent fishing. If you know the number of hours Jason fishes for, you can determine the
number of fish he will catch; therefore the number of fish he catches is a function of the number of hours he
spends fishing. On the other hand, when Sean is fishing, it is not possible to determine the number of fish he
catches based on the number of hours he fishes. On one day, he fished for three hours and caught one fish and
on another day he fished for three hours and caught eight fish. There are two different y values assigned to the x
value of 3 hours. In Sean’s situation, the number of fish he catches is not a function of the number of hours he
spends fishing.
Likewise, the gumball machine at Vincent’s Drug Store represents a function because each penny inserted into
the gumball machine generates a unique amount of gumballs. If you know how many pennies are inserted into
the gumball machine at Vincent’s, you can determine how many gumballs will come out. However, the gumball
machine at Marley’s Drug Store is not a function because there is not a unique number of gumballs generated
based on the number of pennies you put in. One time 2 pennies were inserted and 4 gumballs came out and at
another time 2 pennies were inserted and 3 gumballs came out. You are unable to determine the number of
gumballs that will come out based on how many pennies are put into the machine.
8. Explain in your own words why the number of gumballs received at Ted’s Drug store is not a function
of the amount of money put in. Be specific and give examples to support your reasoning.
Given two variables, x and y, y is a function of x if there is a rule that
determines one unique y value for a given x value.
8WB5 - 14
2014 University of Utah Middle School Math Project in partnership with the
Utah State Office of Education. Licensed under Creative Commons, cc-by.
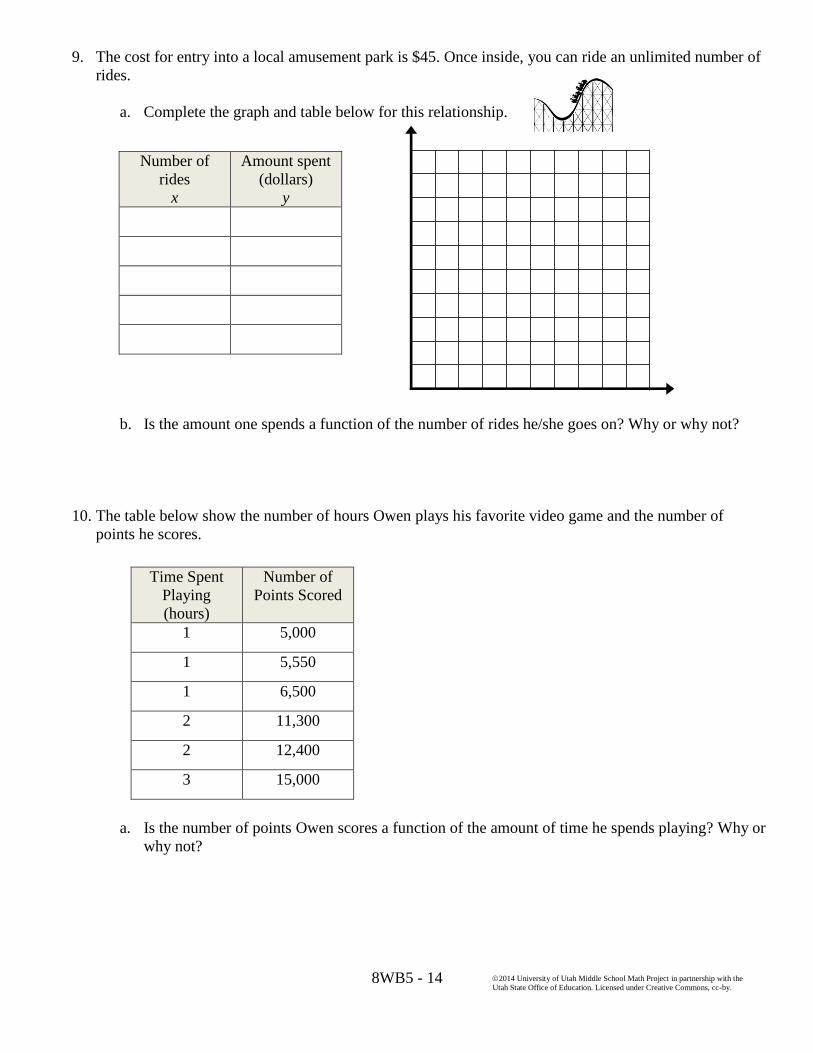
9. The cost for entry into a local amusement park is $45. Once inside, you can ride an unlimited number of
rides.
a. Complete the graph and table below for this relationship.
b. Is the amount one spends a function of the number of rides he/she goes on? Why or why not?
10. The table below show the number of hours Owen plays his favorite video game and the number of
points he scores.
a. Is the number of points Owen scores a function of the amount of time he spends playing? Why or
why not?
Number of
rides
x
Amount spent
(dollars)
y
Time Spent
Playing
(hours)
Number of
Points Scored
1 5,000
1 5,550
1 6,500
2 11,300
2 12,400
3 15,000
8WB5 - 15
2014 University of Utah Middle School Math Project in partnership with the
Utah State Office of Education. Licensed under Creative Commons, cc-by.
5.1a Homework: Introduction to Functions
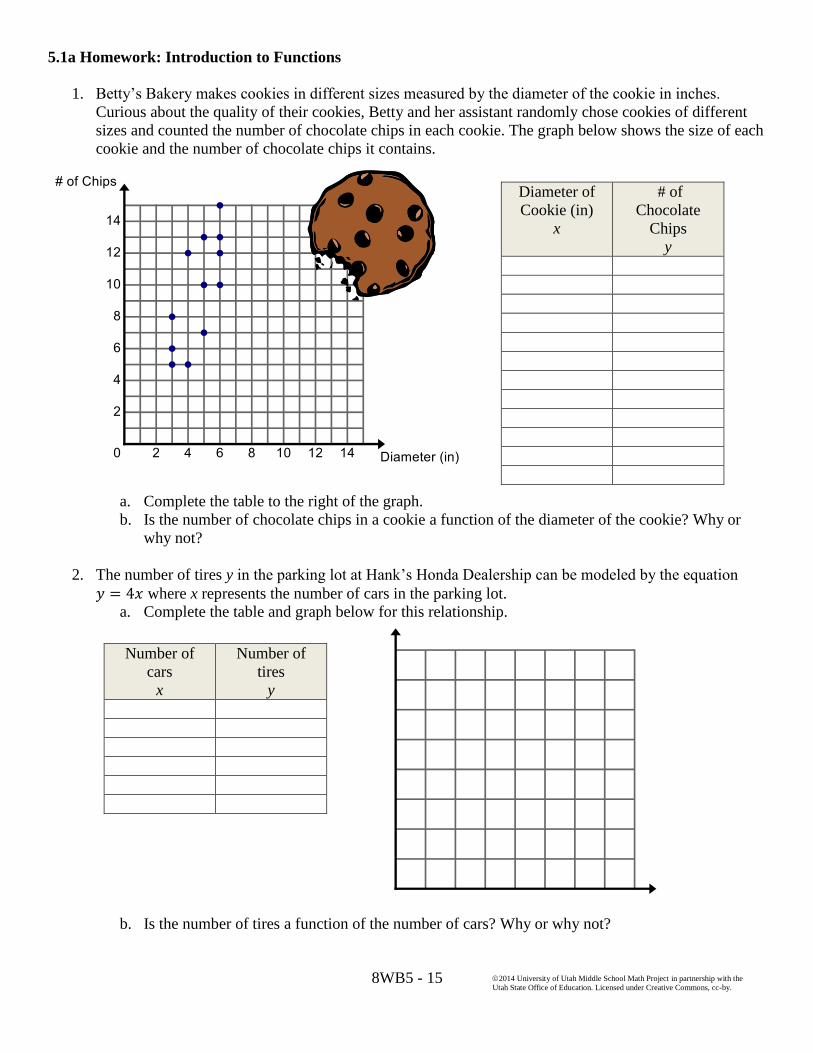
1. Betty’s Bakery makes cookies in different sizes measured by the diameter of the cookie in inches.
Curious about the quality of their cookies, Betty and her assistant randomly chose cookies of different
sizes and counted the number of chocolate chips in each cookie. The graph below shows the size of each
cookie and the number of chocolate chips it contains.
a. Complete the table to the right of the graph.
b. Is the number of chocolate chips in a cookie a function of the diameter of the cookie? Why or
why not?
2. The number of tires y in the parking lot at Hank’s Honda Dealership can be modeled by the equation
𝑦 = 4𝑥 where x represents the number of cars in the parking lot.
a. Complete the table and graph below for this relationship.
b. Is the number of tires a function of the number of cars? Why or why not?
Diameter of
Cookie (in)
x
# of
Chocolate
Chips
y
Number of
cars
x
Number of
tires
y
8WB5 - 16
2014 University of Utah Middle School Math Project in partnership with the
Utah State Office of Education. Licensed under Creative Commons, cc-by.
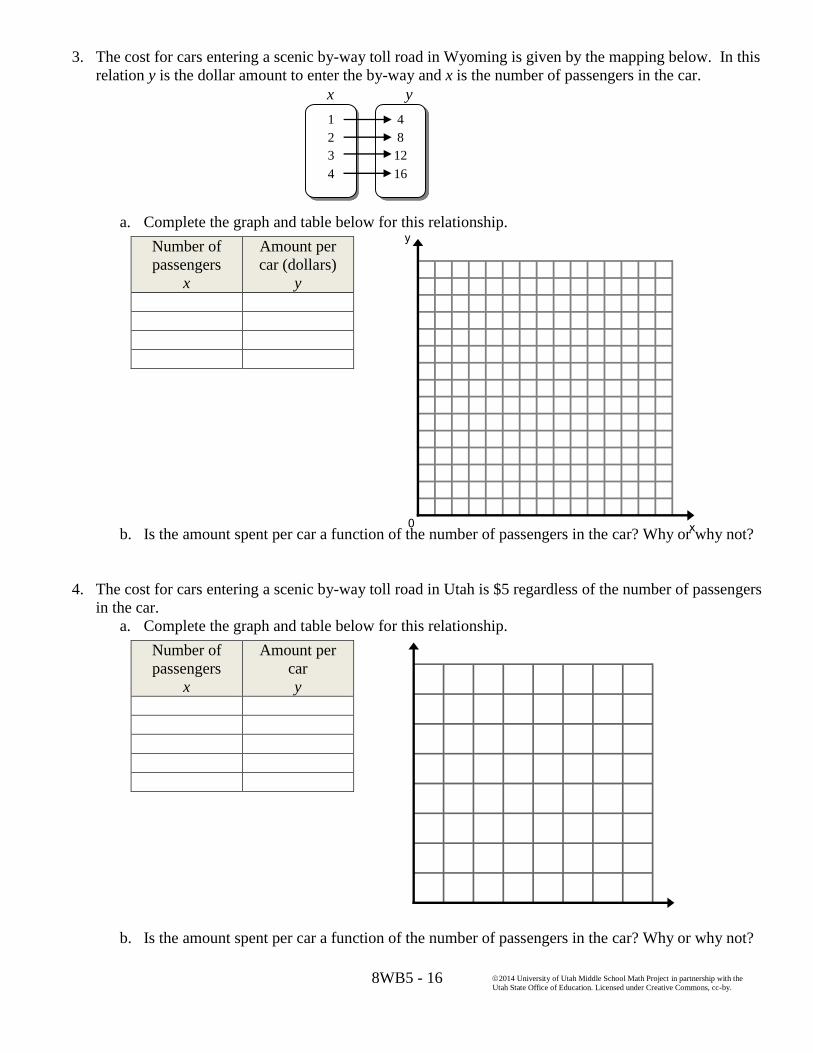
3. The cost for cars entering a scenic by-way toll road in Wyoming is given by the mapping below. In this
relation y is the dollar amount to enter the by-way and x is the number of passengers in the car.
a. Complete the graph and table below for this relationship.
b. Is the amount spent per car a function of the number of passengers in the car? Why or why not?
4. The cost for cars entering a scenic by-way toll road in Utah is $5 regardless of the number of passengers
in the car.
a. Complete the graph and table below for this relationship.
b. Is the amount spent per car a function of the number of passengers in the car? Why or why not?
x y
Number of
passengers
x
Amount per
car (dollars)
y
Number of
passengers
x
Amount per
car
y
1
2
3
4
4
8
12
16

8WB5 - 17
2014 University of Utah Middle School Math Project in partnership with the
Utah State Office of Education. Licensed under Creative Commons, cc-by.
5. Create your own context or story that represents a relation that is a function.
a. Story:
b. Complete the graph and table below for this relationship.
c. Explain why this relation is a function.
6. Create your own context or story that represents a relation that is not a function.
a. Story:
b. Complete the graph and table below for this relationship.
c. Explain why this relation is not a function.
8WB5 - 18
2014 University of Utah Middle School Math Project in partnership with the
Utah State Office of Education. Licensed under Creative Commons, cc-by.
5.1b Class Activity: Function Machine
One way to think about the x and y variables in a functional relationship are as input (x) and output (y) values.
To better understand how input and output values are related in a function consider the following analogy.
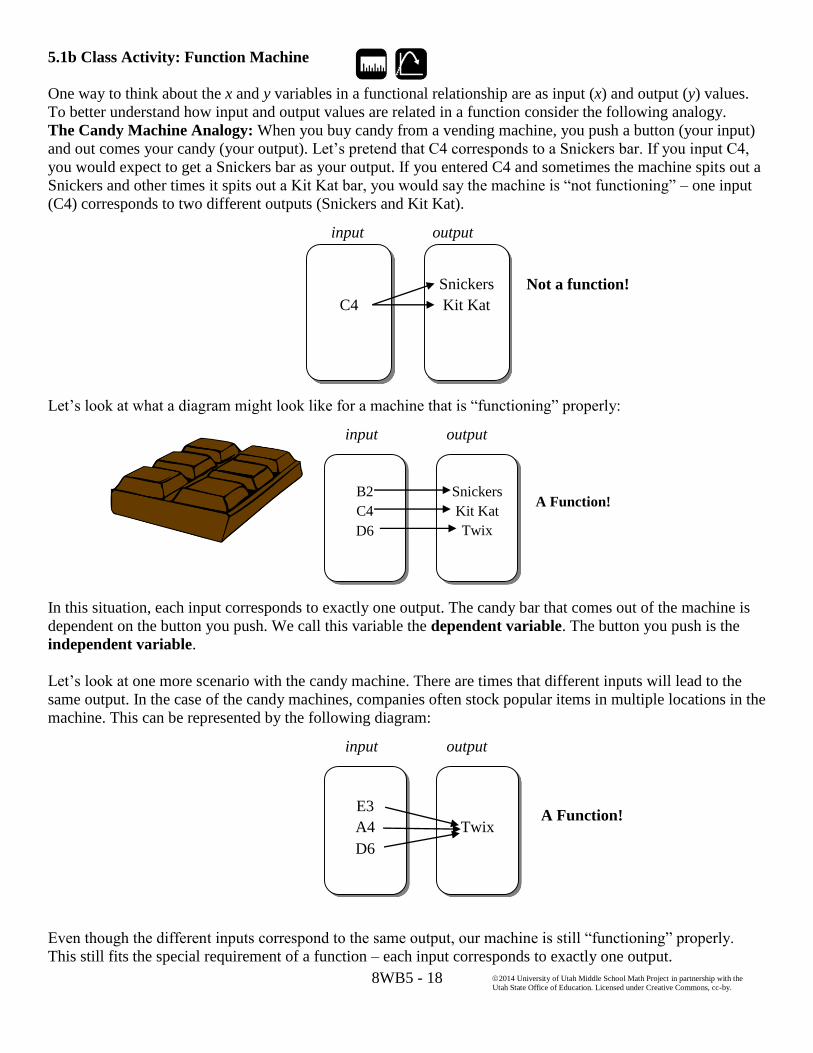
The Candy Machine Analogy: When you buy candy from a vending machine, you push a button (your input)
and out comes your candy (your output). Let’s pretend that C4 corresponds to a Snickers bar. If you input C4,
you would expect to get a Snickers bar as your output. If you entered C4 and sometimes the machine spits out a
Snickers and other times it spits out a Kit Kat bar, you would say the machine is “not functioning” – one input
(C4) corresponds to two different outputs (Snickers and Kit Kat).
Let’s look at what a diagram might look like for a machine that is “functioning” properly:
In this situation, each input corresponds to exactly one output. The candy bar that comes out of the machine is
dependent on the button you push. We call this variable the dependent variable. The button you push is the
independent variable.
Let’s look at one more scenario with the candy machine. There are times that different inputs will lead to the
same output. In the case of the candy machines, companies often stock popular items in multiple locations in the
machine. This can be represented by the following diagram:
Even though the different inputs correspond to the same output, our machine is still “functioning” properly.
This still fits the special requirement of a function – each input corresponds to exactly one output.
input output
input output
input output
Not a function!
C4
Snickers
Kit Kat
A Function!
B2
C4
D6
Snickers
Kit Kat
Twix
A Function!
E3
A4
D6
Twix

8WB5 - 19
2014 University of Utah Middle School Math Project in partnership with the
Utah State Office of Education. Licensed under Creative Commons, cc-by.
THE FUNCTION MACHINE:
In this activity, you will give your teacher a number. He/she will perform
some operations on the number, changing it to a new number. Your goal is
to figure out what rule is being applied to the number. Use the tables below
to keep track of the numbers you give your teacher (inputs) and the
numbers your teacher gives you back (outputs). Once you figure out the
function, write it in the space below the table.
INPUT # OUTPUT # INPUT # OUTPUT # INPUT # OUTPUT #
Function: Function: Function:
INPUT # OUTPUT # INPUT # OUTPUT # INPUT # OUTPUT #
Function: Function: Function:

8WB5 - 20
2014 University of Utah Middle School Math Project in partnership with the
Utah State Office of Education. Licensed under Creative Commons, cc-by.
INPUT # OUTPUT # INPUT # OUTPUT # INPUT # OUTPUT #
Function: Function: Function:
INPUT # OUTPUT # INPUT # OUTPUT # INPUT # OUTPUT #
Function: Function: Function:
8WB5 - 21
2014 University of Utah Middle School Math Project in partnership with the
Utah State Office of Education. Licensed under Creative Commons, cc-by.
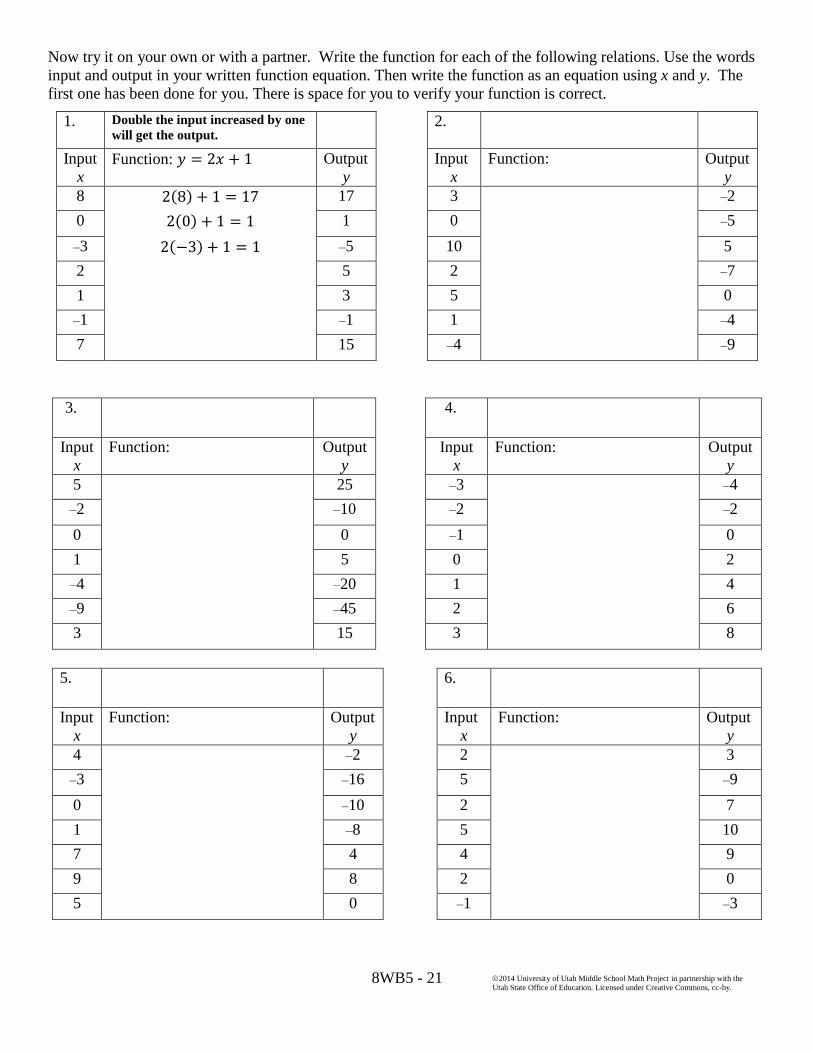
Now try it on your own or with a partner. Write the function for each of the following relations. Use the words
input and output in your written function equation. Then write the function as an equation using x and y. The
first one has been done for you. There is space for you to verify your function is correct.
3. 4.
Input
x
Function: Output
y
Input
x
Function: Output
y
5 25 –3 –4
–2 –10 –2 –2
0 0 –1 0
1 5 0 2
–4 –20 1 4
–9 –45 2 6
3 15 3 8
5. 6.
Input
x
Function: Output
y
Input
x
Function: Output
y
4 –2 2 3
–3 –16 5 –9
0 –10 2 7
1 –8 5 10
7 4 4 9
9 8 2 0
5 0 –1 –3
1. Double the input increased by one
will get the output. 2.
Input
x Function: 𝑦 = 2𝑥 + 1 Output
y
Input
x
Function: Output
y
8 2(8) + 1 = 17 17 3 –2
0 2(0) + 1 = 1 1 0 –5
–3 2(−3) + 1 = 1 –5 10 5
2 5 2 –7
1 3 5 0
–1 –1 1 –4
7 15 –4 –9
8WB5 - 22
2014 University of Utah Middle School Math Project in partnership with the
Utah State Office of Education. Licensed under Creative Commons, cc-by.
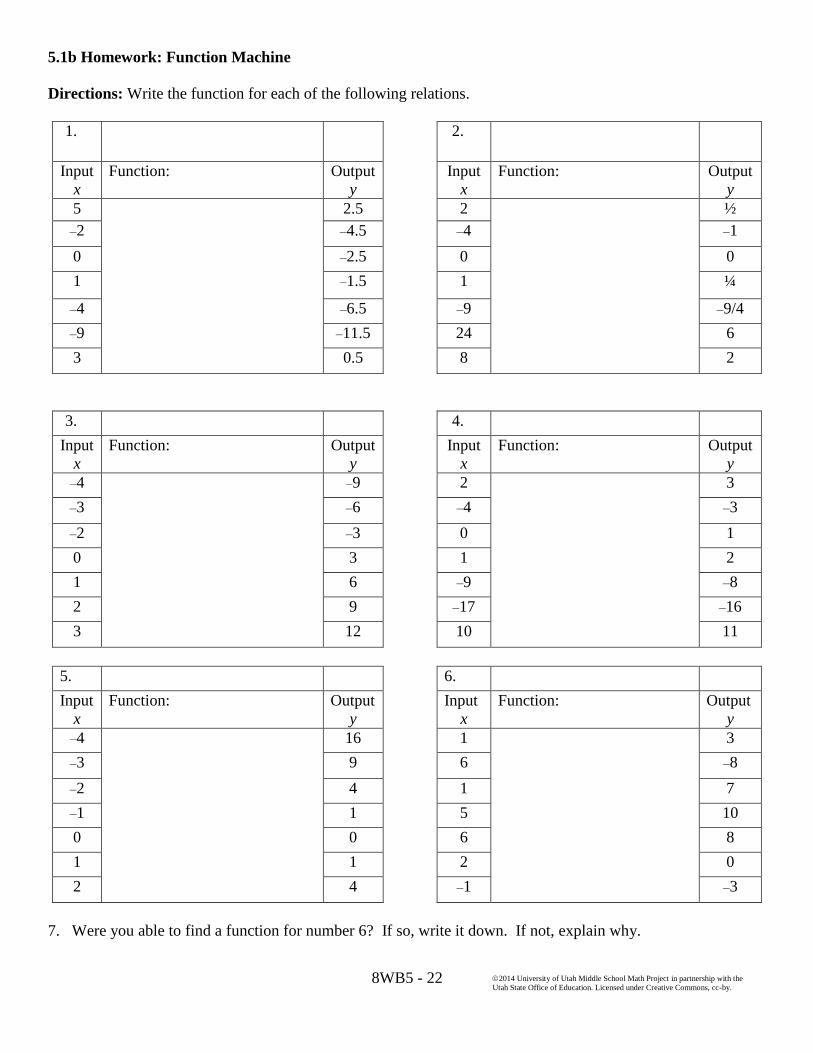
5.1b Homework: Function Machine
Directions: Write the function for each of the following relations.
1. 2.
Input
x
Function: Output
y
Input
x
Function: Output
y
5 2.5 2 ½
–2 –4.5 –4 –1
0 –2.5 0 0
1 –1.5 1 ¼
–4 –6.5 –9 –9/4
–9 –11.5 24 6
3 0.5 8 2
3. 4.
Input
x
Function: Output
y
Input
x
Function: Output
y
–4 –9 2 3
–3 –6 –4 –3
–2 –3 0 1
0 3 1 2
1 6 –9 –8
2 9 –17 –16
3 12 10 11
5. 6.
Input
x
Function: Output
y
Input
x
Function: Output
y
–4 16 1 3
–3 9 6 –8
–2 4 1 7
–1 1 5 10
0 0 6 8
1 1 2 0
2 4 –1 –3
7. Were you able to find a function for number 6? If so, write it down. If not, explain why.
8WB5 - 23
2014 University of Utah Middle School Math Project in partnership with the
Utah State Office of Education. Licensed under Creative Commons, cc-by.
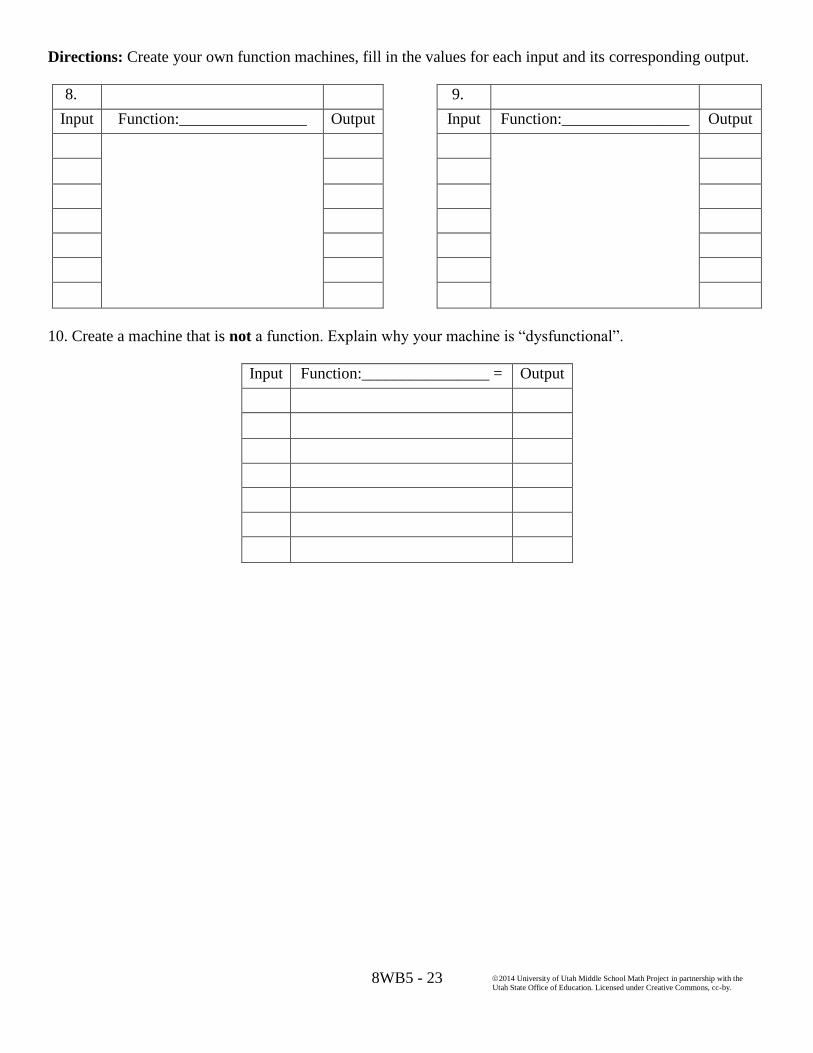
Directions: Create your own function machines, fill in the values for each input and its corresponding output.
8. 9.
Input Function:________________ Output Input Function:________________ Output
10. Create a machine that is not a function. Explain why your machine is “dysfunctional”.
Input Function:________________ = Output

8WB5 - 24
2014 University of Utah Middle School Math Project in partnership with the
Utah State Office of Education. Licensed under Creative Commons, cc-by.
5.1c Class Activity: Representations of a Function
Functions can also be described by non-numeric relations. A mapping is a representation of a function that
helps to better understand non-numeric relations. Study each relation and its mapping below. Then decide if the
relation represents a function. Explain your answer.
1. Input: circumference of finger
Output: ring size
Function? Explain.
2. Input: state a person lives in
Output: the team they root for in college
football
Function? Explain.
3. Write the ordered pairs (circumference, ring
size) that correspond to problem #1.
4. Write the ordered pairs (state a person lives in,
team they root for) that correspond to problem
#2.
5. Input: city student lives in
Output: high school they go to
Function? Explain.
6. Input: Age
Output: Level of Baseball Team
Function? Explain.
Salt Lake City
Provo
Kamas
East HS
Skyline HS
West HS
Timpview HS
Provo HS
South Summit HS
City School
5
6
7
8
9
10
Tee Ball
Minor League
Junior League
Age Baseball
Level
14.1mm
14.9 mm
15.7 mm
16.5 mm
3
4
5
6
Utah
Nevada
Arizona
Cougars
Utes
Sun Devils
Circumference Ring Size
State Team

8WB5 - 25
2014 University of Utah Middle School Math Project in partnership with the
Utah State Office of Education. Licensed under Creative Commons, cc-by.
As we have seen, there are many ways to represent a relation or function. In the following problems, you will be
given one representation of a relation and asked to create additional representations. Then, you will be asked to
determine whether the relation represents a function or not.
7. Story: A candle is 27 centimeters high and burns 3 centimeters per hour. An equation that models this
relation is 𝑐 = 27 − 3ℎ where c is the height of the candle in centimeters and h is the number of hours
the candle has been burning.
a. Express this relation as a table, mapping, graph, and set of ordered pairs.
Table
Time (hours)
h
Height (cm)
c
Mapping
Hours Height
Graph
Set of Ordered Pairs
b. Is the height of the candle a function of the amount of time it has been burning? Explain.
8WB5 - 26
2014 University of Utah Middle School Math Project in partnership with the
Utah State Office of Education. Licensed under Creative Commons, cc-by.
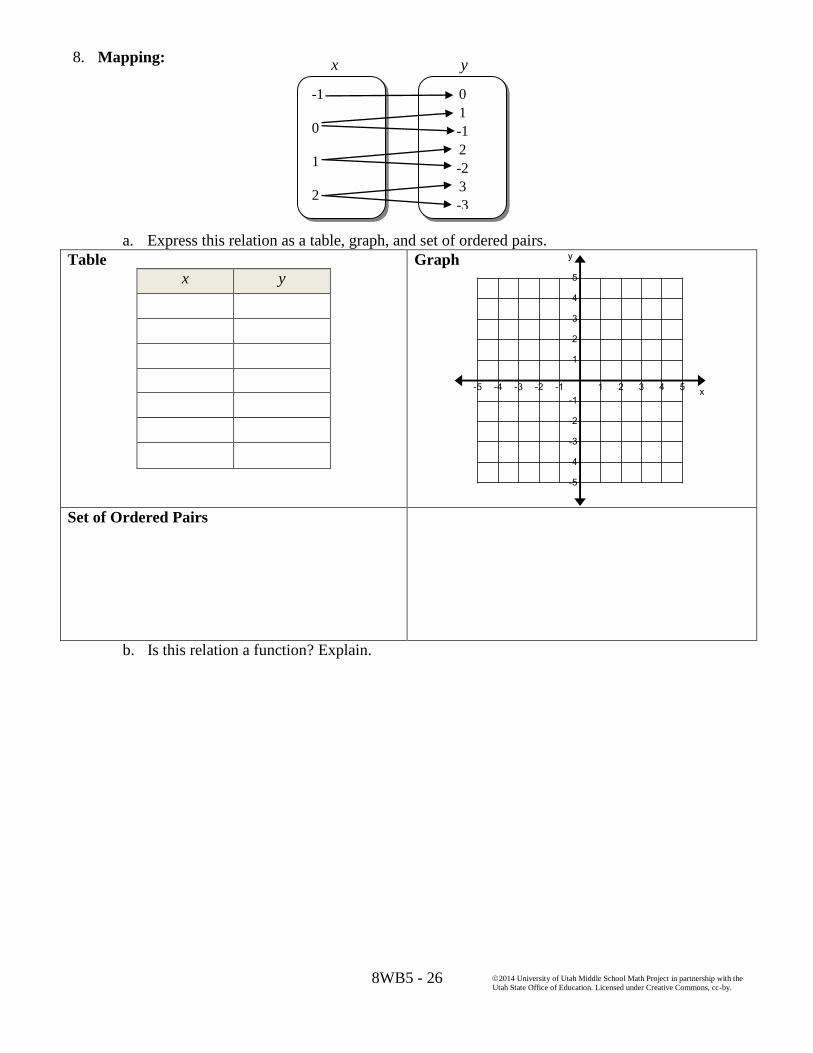
8. Mapping:
a. Express this relation as a table, graph, and set of ordered pairs.
Table
x y
Graph
Set of Ordered Pairs
b. Is this relation a function? Explain.
x y
-1
0
1
2
0
1
-1
2
-2
3
-3
8WB5 - 27
2014 University of Utah Middle School Math Project in partnership with the
Utah State Office of Education. Licensed under Creative Commons, cc-by.
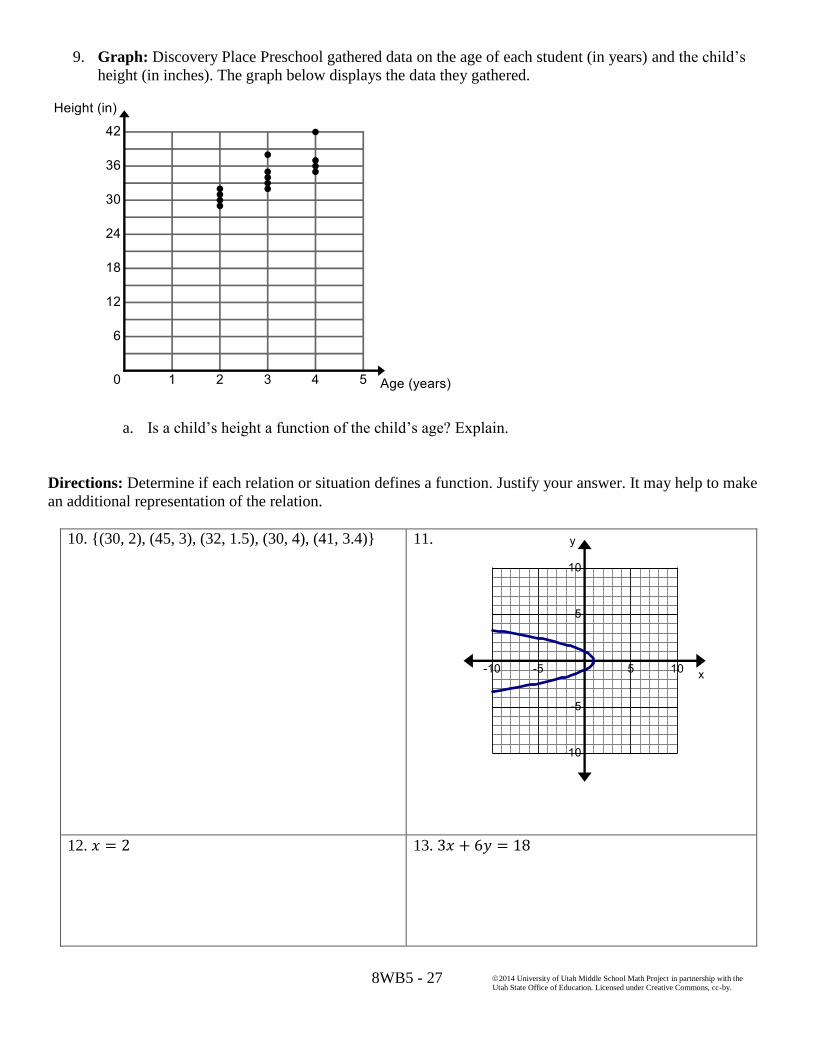
9. Graph: Discovery Place Preschool gathered data on the age of each student (in years) and the child’s
height (in inches). The graph below displays the data they gathered.
a. Is a child’s height a function of the child’s age? Explain.
Directions: Determine if each relation or situation defines a function. Justify your answer. It may help to make
an additional representation of the relation.
10. {(30, 2), (45, 3), (32, 1.5), (30, 4), (41, 3.4)}
11.
12. 𝑥 = 2
13. 3𝑥 + 6𝑦 = 18

8WB5 - 28
2014 University of Utah Middle School Math Project in partnership with the
Utah State Office of Education. Licensed under Creative Commons, cc-by.
14.
Letter Grade Percentage
15. Is letter grade a function of percentage scored on
a test?
16.
Time of
Day Temperature
17. Is time of day a function of the temperature?
18.
Length of
Radius
(cm)
Length of
Diameter
(cm)
0.5 1
1 2
1.5 3
2 4
19. Input: name of city in the U.S.
Output: state city is in
Hint: There are 16 states in the United States that
have a city called Independence.
8:00 AM
12:00 PM
2:00 PM
4:00 PM
7:00PM
65
70
75
80
A
B
D
95%
88%
87%
66%

8WB5 - 29
2014 University of Utah Middle School Math Project in partnership with the
Utah State Office of Education. Licensed under Creative Commons, cc-by.
5.1c Homework: Representations of a Function
1. Use the pattern below to answer the questions that follow.
Pattern:
a. Express this relation as a table, mapping, and graph.
Table
Stage
number
Number of
Smiles
Mapping
Stage Smiles
Graph Set of Ordered Pairs
b. Is this relation a function? Explain how you know.
Stage 1
Stage 2
Stage 3
Stage 4

8WB5 - 30
2014 University of Utah Middle School Math Project in partnership with the
Utah State Office of Education. Licensed under Creative Commons, cc-by.
Directions: Determine if each relation or situation defines a function. Justify your answer.
2. Input: age
Output: shoe size
Function? Explain.
Age Shoe Size
3. Input: number of chairs
Output: number of legs
Function? Explain.
Chairs Legs
4. List the ordered pairs that correspond to
#2: (age, shoe size).
5. List the ordered pairs that correspond to #3:
(number of chairs, number of legs)
6.
Function? Explain.
x y
0.2 1.5
0.4 1.25
0.6 1.5
0.8 1.25
7.
Function? Explain.
13
14
6
7
8
9
1
2
3
4
4
8
12
16
8WB5 - 31
2014 University of Utah Middle School Math Project in partnership with the
Utah State Office of Education. Licensed under Creative Commons, cc-by.
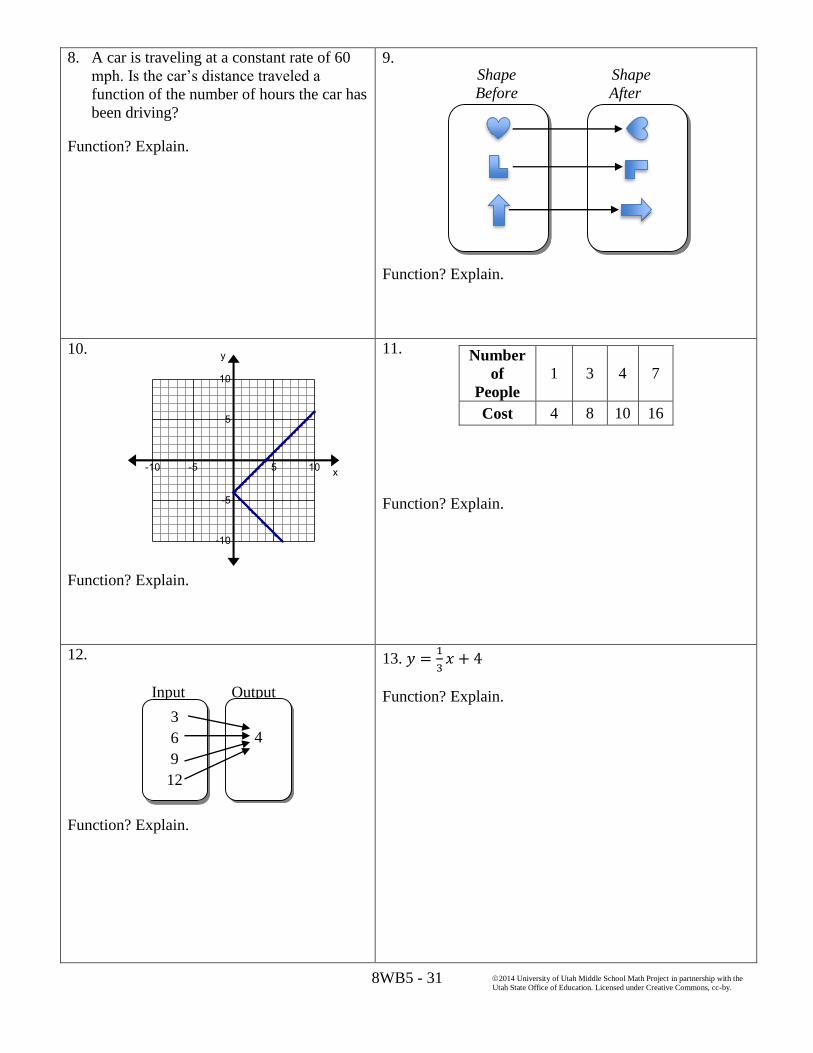
8. A car is traveling at a constant rate of 60
mph. Is the car’s distance traveled a
function of the number of hours the car has
been driving?
Function? Explain.
9.
Function? Explain.
Shape
Before
Shape
After
10.
Function? Explain.
11.
Function? Explain.
Number
of
People
1 3 4 7
Cost 4 8 10 16
12.
Function? Explain.
13. 𝑦 =1
3𝑥 + 4
Function? Explain.
Input Output
3
6
9
12
5
4
78
8WB5 - 32
2014 University of Utah Middle School Math Project in partnership with the
Utah State Office of Education. Licensed under Creative Commons, cc-by.
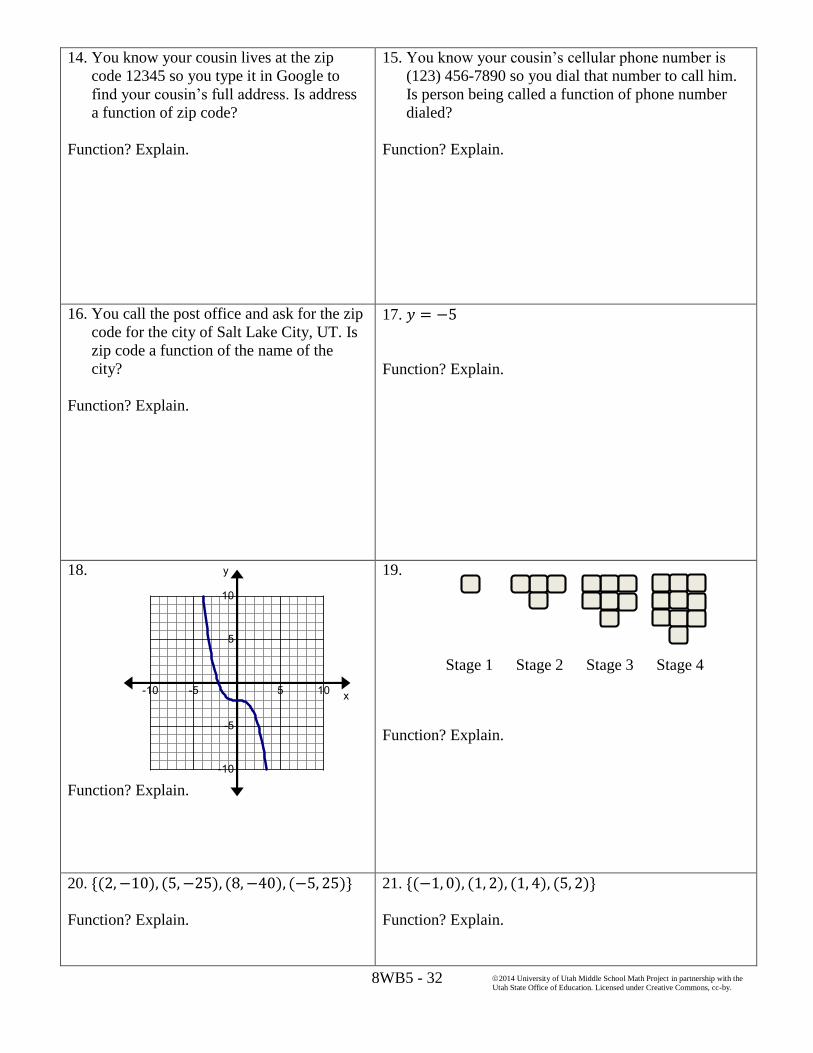
14. You know your cousin lives at the zip
code 12345 so you type it in Google to
find your cousin’s full address. Is address
a function of zip code?
Function? Explain.
15. You know your cousin’s cellular phone number is
(123) 456-7890 so you dial that number to call him.
Is person being called a function of phone number
dialed?
Function? Explain.
16. You call the post office and ask for the zip
code for the city of Salt Lake City, UT. Is
zip code a function of the name of the
city?
Function? Explain.
17. 𝑦 = −5
Function? Explain.
18.
Function? Explain.
19.
Function? Explain.
Stage 1
Stage 2
Stage 3
Stage 4
20. {(2, −10), (5, −25), (8, −40), (−5, 25)}
Function? Explain.
21. {(−1, 0), (1, 2), (1, 4), (5, 2)}
Function? Explain.
8WB5 - 33
2014 University of Utah Middle School Math Project in partnership with the
Utah State Office of Education. Licensed under Creative Commons, cc-by.
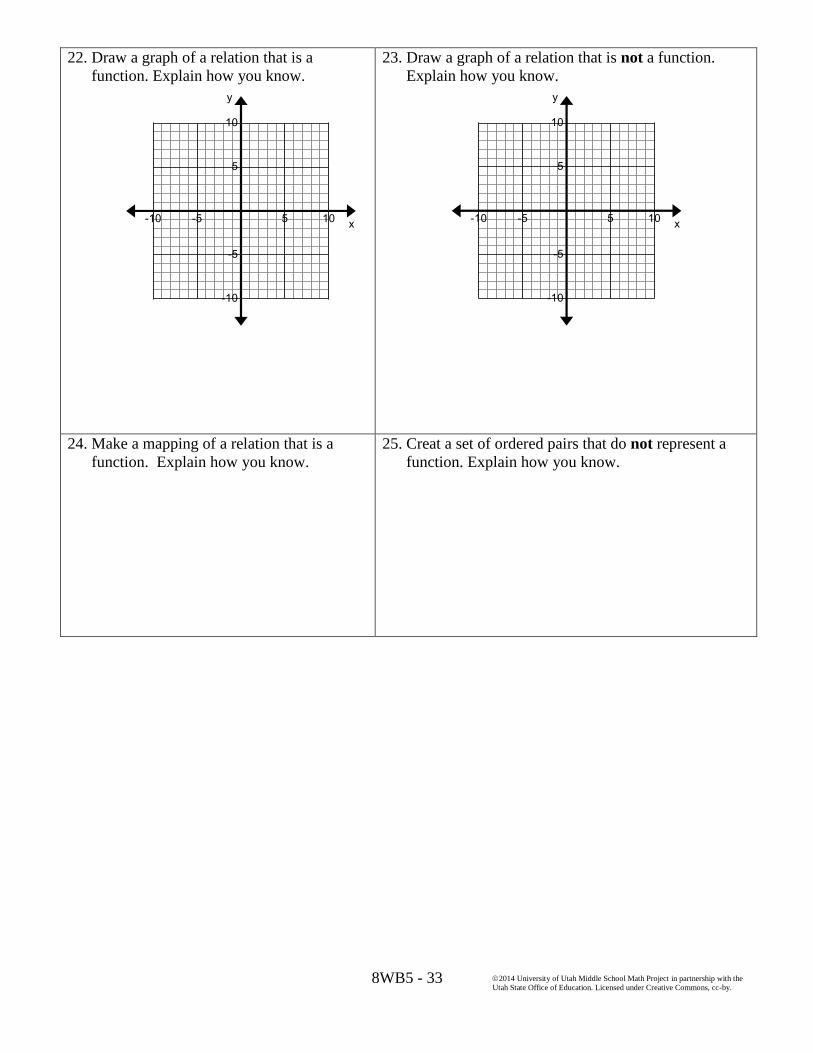
22. Draw a graph of a relation that is a
function. Explain how you know.
23. Draw a graph of a relation that is not a function.
Explain how you know.
24. Make a mapping of a relation that is a
function. Explain how you know.
25. Creat a set of ordered pairs that do not represent a
function. Explain how you know.
8WB5 - 34
2014 University of Utah Middle School Math Project in partnership with the
Utah State Office of Education. Licensed under Creative Commons, cc-by.
5.1d Class Activity: Birthdays
1. Make a mapping that shows the students in your class and their birthdays.
a. Is the birth date of a student a function of the individual student? Justify your answer.
Student Birthday
8WB5 - 35
2014 University of Utah Middle School Math Project in partnership with the
Utah State Office of Education. Licensed under Creative Commons, cc-by.
2. Make a mapping that shows the first name of the students in your class and their birthdays.
b. Is the birth date of a student a function of the student’s first name? Justify your answer.
First Name Birthday
8WB5 - 36
2014 University of Utah Middle School Math Project in partnership with the
Utah State Office of Education. Licensed under Creative Commons, cc-by.
3. Make a mapping, switching the input to be birthday and the output to be student.
a. Is student a function of birth date in your class? Justify your answer.
Birthday Student
8WB5 - 37
2014 University of Utah Middle School Math Project in partnership with the
Utah State Office of Education. Licensed under Creative Commons, cc-by.
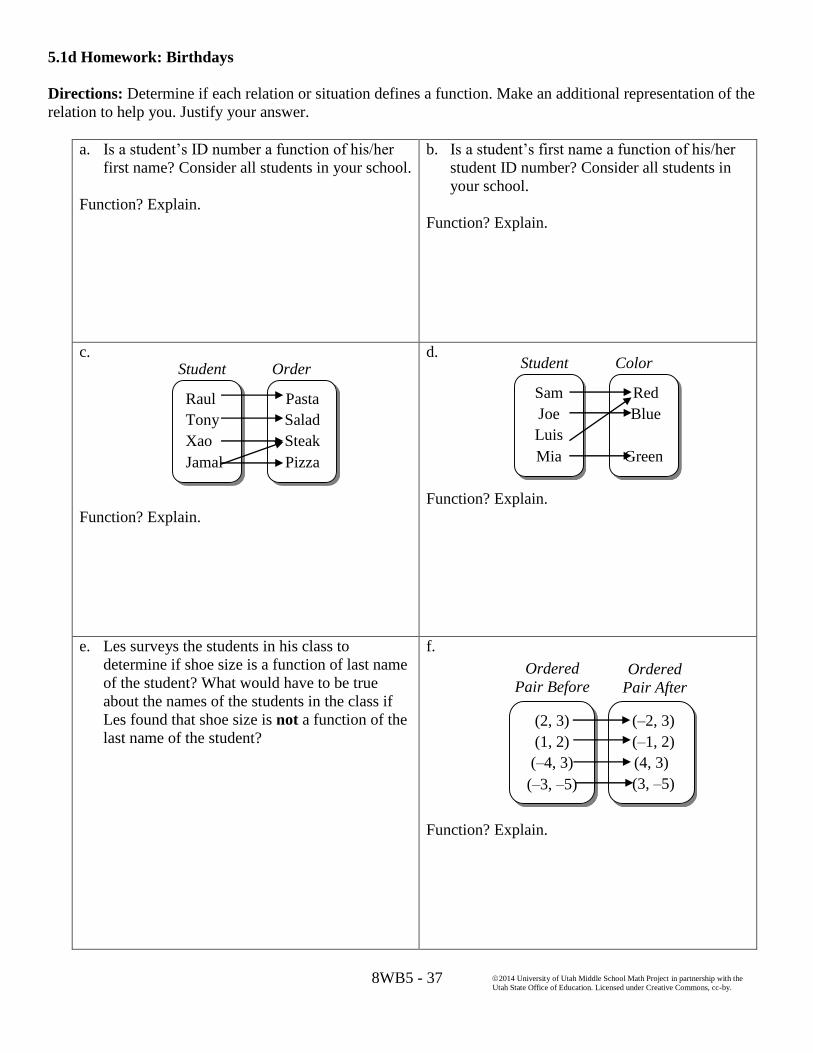
5.1d Homework: Birthdays
Directions: Determine if each relation or situation defines a function. Make an additional representation of the
relation to help you. Justify your answer.
a. Is a student’s ID number a function of his/her
first name? Consider all students in your school.
Function? Explain.
b. Is a student’s first name a function of his/her
student ID number? Consider all students in
your school.
Function? Explain.
c.
Function? Explain.
Student Order
d.
Function? Explain.
Student Color
e. Les surveys the students in his class to
determine if shoe size is a function of last name
of the student? What would have to be true
about the names of the students in the class if
Les found that shoe size is not a function of the
last name of the student?
f.
Function? Explain.
Raul
Tony
Xao
Jamal
Pasta
Salad
Steak
Pizza
Sam
Joe
Luis
Mia
Red
Blue
Green
(2, 3)
(1, 2)
(–4, 3)
(–3, –5)
(–2, 3)
(–1, 2)
(4, 3)
(3, –5)
Ordered
Pair Before Ordered
Pair After

8WB5 - 38
2014 University of Utah Middle School Math Project in partnership with the
Utah State Office of Education. Licensed under Creative Commons, cc-by.
g.
Function? Explain.
h.
Function? Explain.
i. Input: favorite type of music
Output: name
Function? Explain.
j. Input: a pianist’s overall score in a music
competition
Output: ranking
Function? Explain.
Score Ranking
k.
Function? Explain.
Input Output
25 14
30 13
30 12
35 11
l.
Function? Explain.
10
8
7
6
5
Superior
Excellent
Good
Fair
Rock Country Rap
Willie
Jace
Si Jeb
Music Name
Input Output
1/2
2/3
3/4
0
1
3
5
Input Output
3
5
7
8
7
5
3
2
8WB5 - 39
2014 University of Utah Middle School Math Project in partnership with the
Utah State Office of Education. Licensed under Creative Commons, cc-by.
5.1e Class Activity: More About Functions
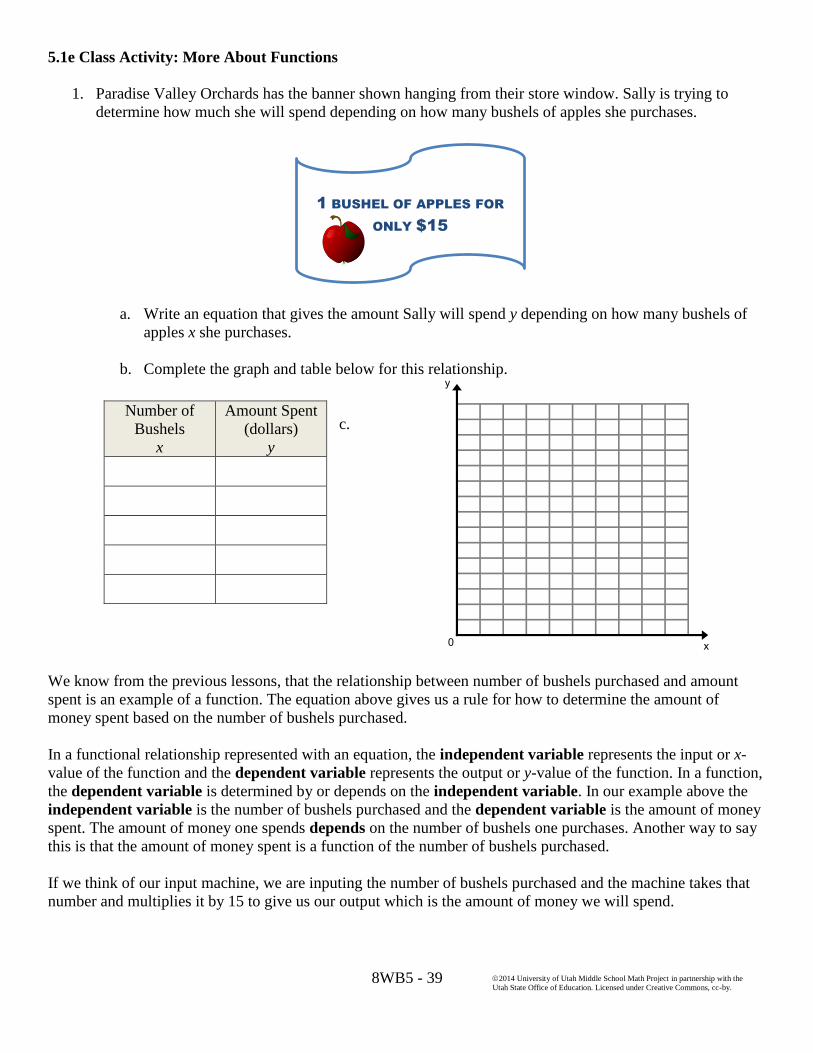
1. Paradise Valley Orchards has the banner shown hanging from their store window. Sally is trying to
determine how much she will spend depending on how many bushels of apples she purchases.
a. Write an equation that gives the amount Sally will spend y depending on how many bushels of
apples x she purchases.
b. Complete the graph and table below for this relationship.
c.
We know from the previous lessons, that the relationship between number of bushels purchased and amount
spent is an example of a function. The equation above gives us a rule for how to determine the amount of
money spent based on the number of bushels purchased.
In a functional relationship represented with an equation, the independent variable represents the input or x-
value of the function and the dependent variable represents the output or y-value of the function. In a function,
the dependent variable is determined by or depends on the independent variable. In our example above the
independent variable is the number of bushels purchased and the dependent variable is the amount of money
spent. The amount of money one spends depends on the number of bushels one purchases. Another way to say
this is that the amount of money spent is a function of the number of bushels purchased.
If we think of our input machine, we are inputing the number of bushels purchased and the machine takes that
number and multiplies it by 15 to give us our output which is the amount of money we will spend.
Number of
Bushels
x
Amount Spent
(dollars)
y
1 BUSHEL OF APPLES FOR
ONLY $15

8WB5 - 40
2014 University of Utah Middle School Math Project in partnership with the
Utah State Office of Education. Licensed under Creative Commons, cc-by.
2. Miguel is taking a road trip and is driving at a constant speed of 65 mph. He is trying to determine how
many miles he can drive based on how many hours he drives.
a. Identify the independent variable in this situation: _____________________________
b. Identify the dependent variable in this situation: ____________________________
c. Complete the graph and table below for this relationship. Make sure you label the columns and
axes in your table and graph.
d. Write an equation that represents this situation: _____________________________
e. In this situation ______________________ is a function of _________________________.
x
y

8WB5 - 41
2014 University of Utah Middle School Math Project in partnership with the
Utah State Office of Education. Licensed under Creative Commons, cc-by.
3. The drama club is selling tickets to the Fall Ball. They use $2 from each ticket sale for food and
decorations.
a. Identify the independent variable in this situation: __________________________
b. Identify the dependent variable in this situation: _________________________
c. Create a table, graph, and equation for this function.
Equation: ______________________
d. Complete the following sentence for this situation.
________________________________ is a function of ________________________________.
4. The average cost of a movie ticket has steadily increased over time.
a. Identify the dependent and independent variables in this functional relationship.
b. Sketch a possible graph of this situation.
x
y
8WB5 - 42
2014 University of Utah Middle School Math Project in partnership with the
Utah State Office of Education. Licensed under Creative Commons, cc-by.
5. Susan is reading her history text book for an upcoming test. She can read 5 pages in 10 minutes. Susan is
interested in determining how many pages she can read based on how long she reads for.
a. Identify the independent variable in this situation: ______________________
b. Identify the dependent variable in this situation: ____________________________
c. Create a representation (table, graph, equation) of this function in the space below.
6. Chris is also reading his history text book for an upcoming test and can also read 5 pages in 10 minutes.
However, Chris is interested in determining how long it will take him to read based on how many pages
he has to read.
a. Identify the independent variable in this situation: _____________________________
b. Identify the dependent variable in this situation: ____________________________
c. Create a representation (table, graph, equation) of this function in the space below.
Directions: Each of the following situations represents a functional relationship between two quantities.
Determine the dependent variable and the independent variable. The first one has been done for you.
7. In warm climates, the average amount of electricity used rises as the daily average temperature increases
and falls as the daily average temperature decreases.
8. The number of calories you burn increases as the number of minutes that you walk increases.
9. The air pressure inside a tire increases with the temperature.
10. As the amount of rain decreases, so does the water level of the river.
11. The total number of jars of pickles that a factory can produce depends on the number of pickles they
receive.
12. The weight of the box increases as the number of books placed inside the box increases.
8WB5 - 43
2014 University of Utah Middle School Math Project in partnership with the
Utah State Office of Education. Licensed under Creative Commons, cc-by.
5.1e Homework: More About Functions
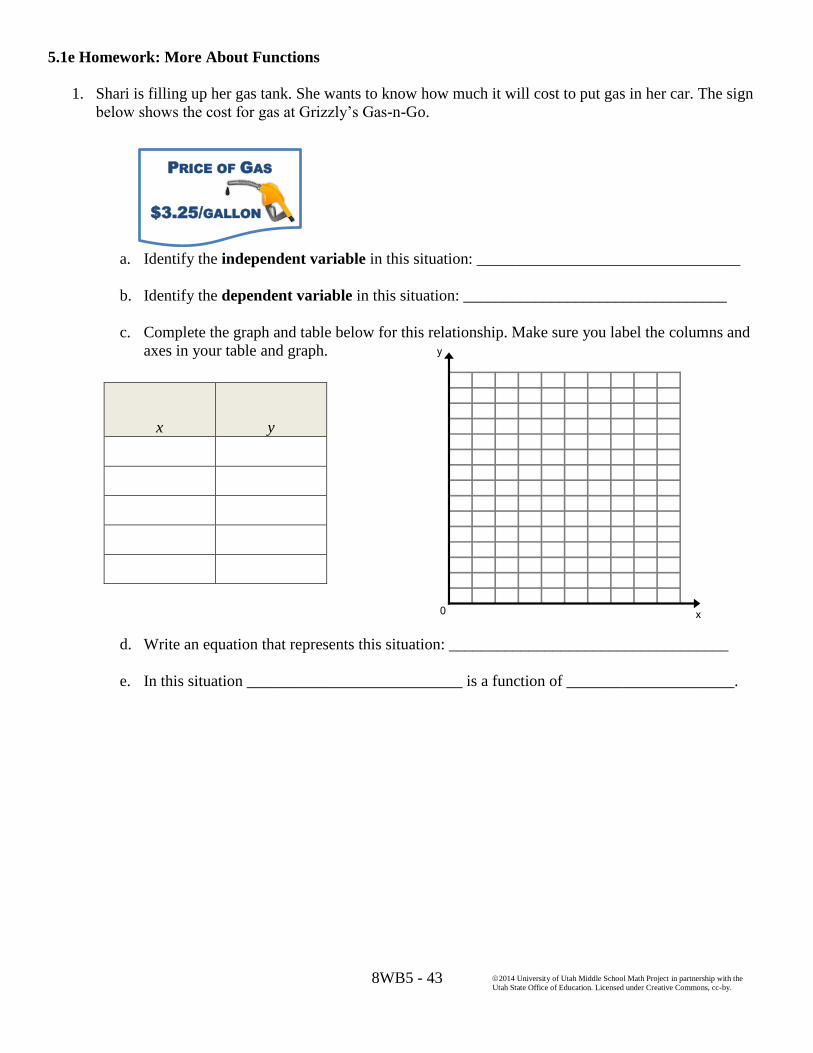
1. Shari is filling up her gas tank. She wants to know how much it will cost to put gas in her car. The sign
below shows the cost for gas at Grizzly’s Gas-n-Go.
a. Identify the independent variable in this situation: _________________________________
b. Identify the dependent variable in this situation: _________________________________
c. Complete the graph and table below for this relationship. Make sure you label the columns and
axes in your table and graph.
d. Write an equation that represents this situation: ___________________________________
e. In this situation ___________________________ is a function of _____________________.
x
y
PRICE OF GAS
$3.25/GALLON
8WB5 - 44
2014 University of Utah Middle School Math Project in partnership with the
Utah State Office of Education. Licensed under Creative Commons, cc-by.
2. Peter is the event planner for a team race taking place in Park City, UT. He needs to determine how
many bottles of water to have ready at the finish line of the race so that each participant in the race
receives a bottle of water. There are 4 people on a team.
a. Identify the independent variable in this situation: _______________________________
b. Identify the dependent variable in this situation: _________________________________
c. Create a table, graph, and equation of this situation.
Equation: _______________________
d. Complete the following sentence:
__________________________ is a function of ___________________________________.
Directions: Each of the following situations represents a functional relationship between two quantities.
Underline the two quantities. Put an I above the independent variable and a D above the dependent variable.
3. As the size of your family increases so does the cost of groceries.
4. The value of your car decreases with age.
5. The greater the distance a sprinter has to run the more time it takes to finish the race.
6. A car has more gas in its tank can drive a farther distance.
7. A child’s wading pool is being inflated. The pool’s size increases at a rate of 2 cubic feet per minute.
8. The total number of laps run depends on the length of each workout.
x
y
8WB5 - 45
2014 University of Utah Middle School Math Project in partnership with the
Utah State Office of Education. Licensed under Creative Commons, cc-by.
9. A tree grows 15 feet in 10 years.
10. There are 5 inches of water in a bucket after a 2 ½ hour rain storm.
11. Jenny has 30 coins she has collected over 6 years.
12. Sally’s track coach wants to know how far she can run based on the amount of time she runs for.
13. Whitney is training for a half marathon. She wants to know how long it will take her to run based on
how far she has to run for.
14. Write your own relationship that contains an independent and dependent variable.
8WB5 - 46
2014 University of Utah Middle School Math Project in partnership with the
Utah State Office of Education. Licensed under Creative Commons, cc-by.
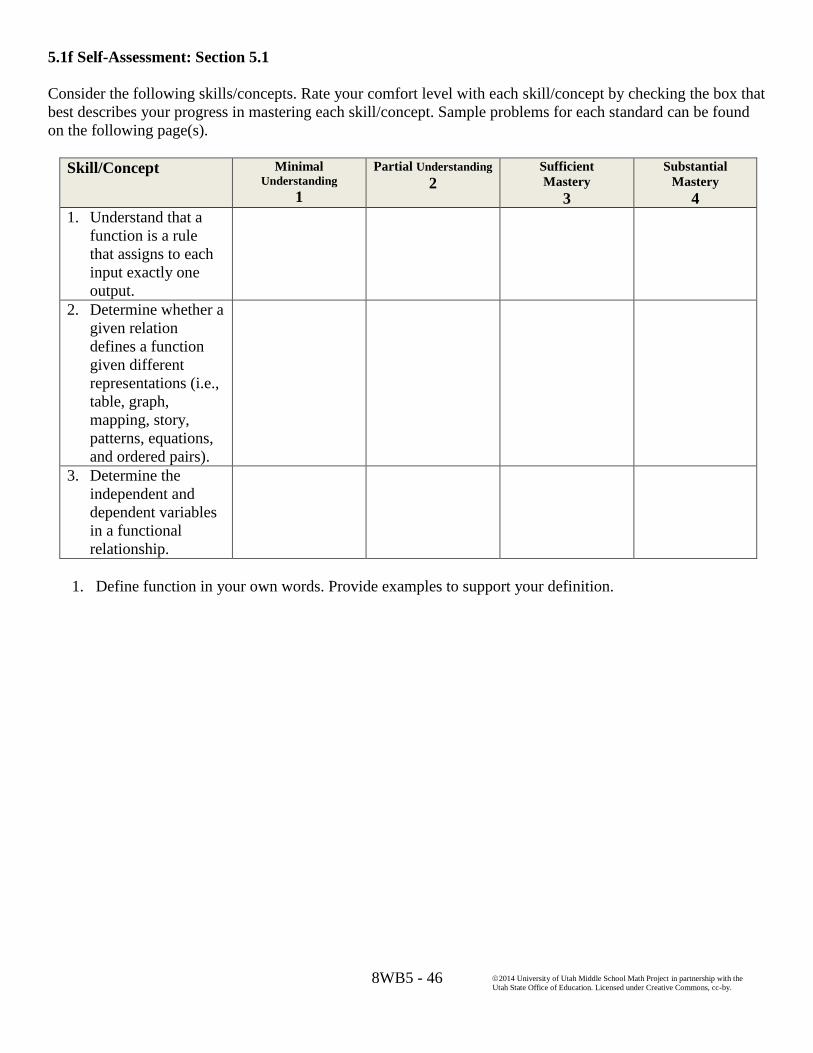
5.1f Self-Assessment: Section 5.1
Consider the following skills/concepts. Rate your comfort level with each skill/concept by checking the box that
best describes your progress in mastering each skill/concept. Sample problems for each standard can be found
on the following page(s).
Skill/Concept
Minimal Understanding
1
Partial Understanding
2 Sufficient
Mastery
3
Substantial
Mastery
4
1. Understand that a
function is a rule
that assigns to each
input exactly one
output.
2. Determine whether a
given relation
defines a function
given different
representations (i.e.,
table, graph,
mapping, story,
patterns, equations,
and ordered pairs).
3. Determine the
independent and
dependent variables
in a functional
relationship.
1. Define function in your own words. Provide examples to support your definition.

8WB5 - 47
2014 University of Utah Middle School Math Project in partnership with the
Utah State Office of Education. Licensed under Creative Commons, cc-by.
2. Do the representations below define a function? Why or why not?
a.
Is the number of hearts in a stage a function of the
stage number?
Is the stage number a function of the number of
hearts in a stage?
Stage 1
Stage 2
Stage 3
Stage 4
Stage 5
b. Maria is draining her hot tub at a rate of 5.5
gallons per minute. Is the amount of water left
in the pool a function of the amount of time she
has been draining it?
c. x y
10 1
10 2
10 3
10 4
d.
e. Is state capitol a function of state name?
Consider states in the United States.
f. Is a person’s weight a function of the person’s
age?
g. Is the amount of time it takes a person to run a
marathon a function of the person’s age?
h. {(1, 1), (2, 1), (3, 1), (4, 1), (5, 1)}
Input Output
0
1
2
3
0
1

8WB5 - 48
2014 University of Utah Middle School Math Project in partnership with the
Utah State Office of Education. Licensed under Creative Commons, cc-by.
i.
j. 𝑦 =1
4𝑥 − 2
k.
Shape
Before
Shape
After
l.
3. In each of the following situations an independent variable is given. Determine a possible dependent
variable that would create a functional relationship.
a. The amount of gas remaining in a tank
b. Time
c. Number of people
d. Number of t-shirts
e. Circumference of head
Katniss
Peta
Finnick
Archery
Fishing
Swimming
Running
Student Sport
(2, 4)
(4, 6)
(–2, –8)
(–4, –6)
(1, 2)
(2, 3)
(–1, –4)
(–2, –3)
Ordered
Pair Before
Ordered
Pair After
8WB5 - 49
2014 University of Utah Middle School Math Project in partnership with the
Utah State Office of Education. Licensed under Creative Commons, cc-by.
Section 5.2: Explore Linear and Nonlinear Functions
Section Overview:
This section focuses on the characteristics that separate linear from nonlinear functions. Students will analyze
the different representations of a function (graph, table, equation, and context) to determine whether or not the
representations suggest a linear relationship between the two variables. In the process of studying non-linear
functions, students will solidify their understanding of how a linear function grows (changes).
Concepts and Skills to Master:
By the end of this section, students should be able to:
Distinguish between linear and nonlinear functions given a context, table, graph, or equation.

8WB5 - 50
2014 University of Utah Middle School Math Project in partnership with the
Utah State Office of Education. Licensed under Creative Commons, cc-by.
5.2a Class Activity: Display Designs
Complete Foods, a local grocery store, has hired three different companies to come up with a display for food
items that are on sale each week. They currently have a display that is 6 boxes wide as shown below.
They would like the center part of the display to be taller than the outside pieces of the display to showcase their
“mega deal of the week”. The following are the designs that two different companies submitted to Complete
Foods, using the current display as their starting point.
Design Team 1:
1. Draw Stage 4 of this design. Describe how you went about drawing stage 4.
2. Can the relationship between stage number and number of blocks in a stage in this pattern be modeled
by a linear function? Provide at least 2 pieces of evidence to support your answer.
Current Display (Stage 1) Stage 2 Stage 3
Stage 4
8WB5 - 51
2014 University of Utah Middle School Math Project in partnership with the
Utah State Office of Education. Licensed under Creative Commons, cc-by.
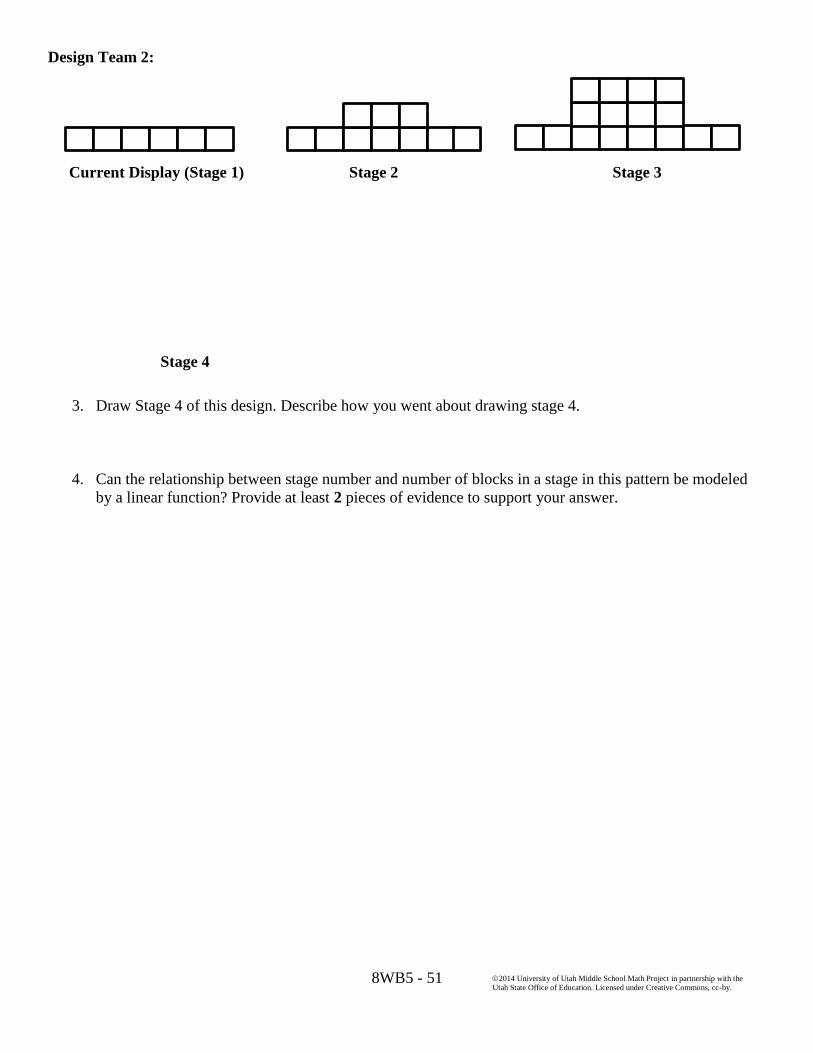
Design Team 2:
3. Draw Stage 4 of this design. Describe how you went about drawing stage 4.
4. Can the relationship between stage number and number of blocks in a stage in this pattern be modeled
by a linear function? Provide at least 2 pieces of evidence to support your answer.
Current Display (Stage 1) Stage 2 Stage 3
Stage 4

8WB5 - 52
2014 University of Utah Middle School Math Project in partnership with the
Utah State Office of Education. Licensed under Creative Commons, cc-by.
8WB5 - 53
2014 University of Utah Middle School Math Project in partnership with the
Utah State Office of Education. Licensed under Creative Commons, cc-by.
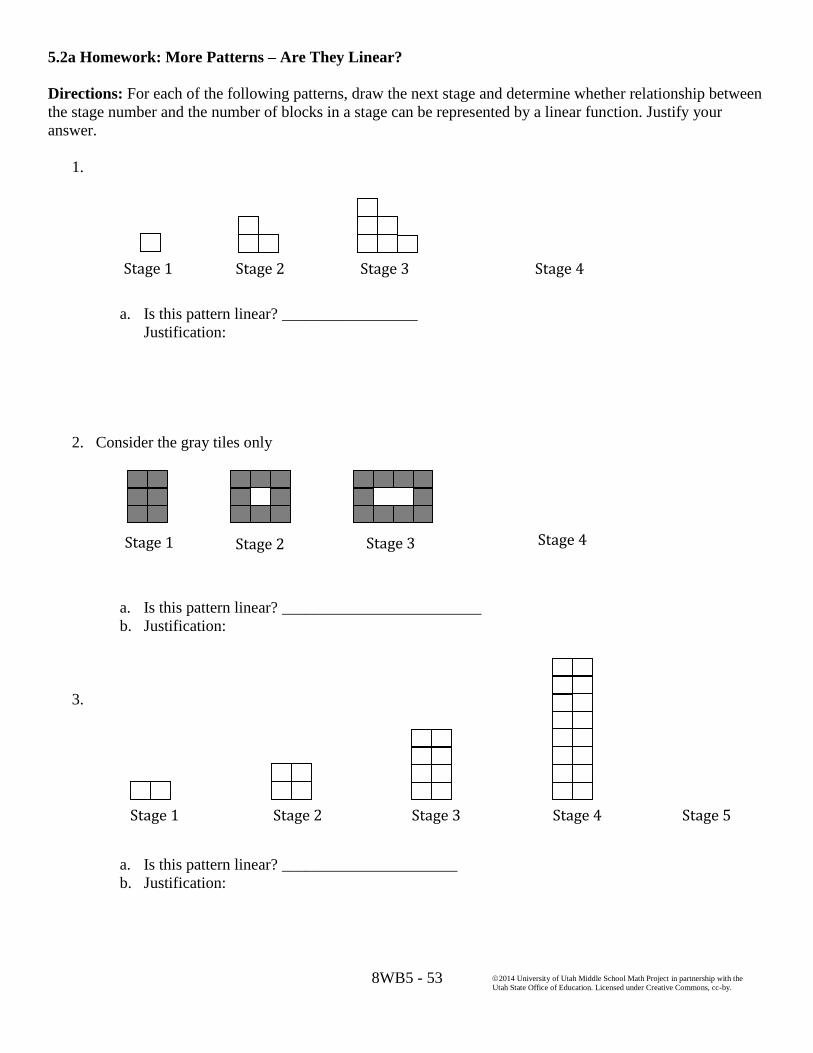
5.2a Homework: More Patterns – Are They Linear?
Directions: For each of the following patterns, draw the next stage and determine whether relationship between
the stage number and the number of blocks in a stage can be represented by a linear function. Justify your
answer.
1.
a. Is this pattern linear? _________________
Justification:
2. Consider the gray tiles only
a. Is this pattern linear? _________________________
b. Justification:
3.
a. Is this pattern linear? ______________________
b. Justification:
Stage 1 Stage 2 Stage 3 Stage 4
Stage 1 Stage 2 Stage 3 Stage 4
Stage 1 Stage 2 Stage 3 Stage 4 Stage 5
8WB5 - 54
2014 University of Utah Middle School Math Project in partnership with the
Utah State Office of Education. Licensed under Creative Commons, cc-by.
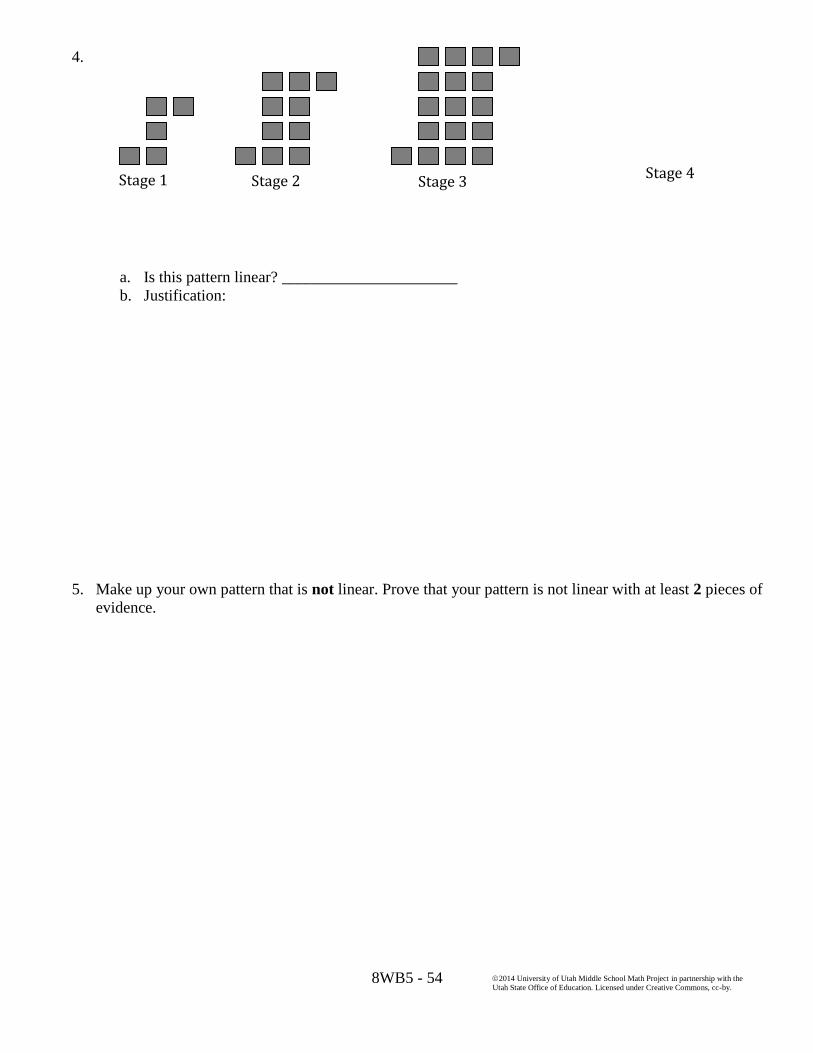
4.
a. Is this pattern linear? ______________________
b. Justification:
5. Make up your own pattern that is not linear. Prove that your pattern is not linear with at least 2 pieces of
evidence.
Stage 1 Stage 2 Stage 3 Stage 4
8WB5 - 55
2014 University of Utah Middle School Math Project in partnership with the
Utah State Office of Education. Licensed under Creative Commons, cc-by.
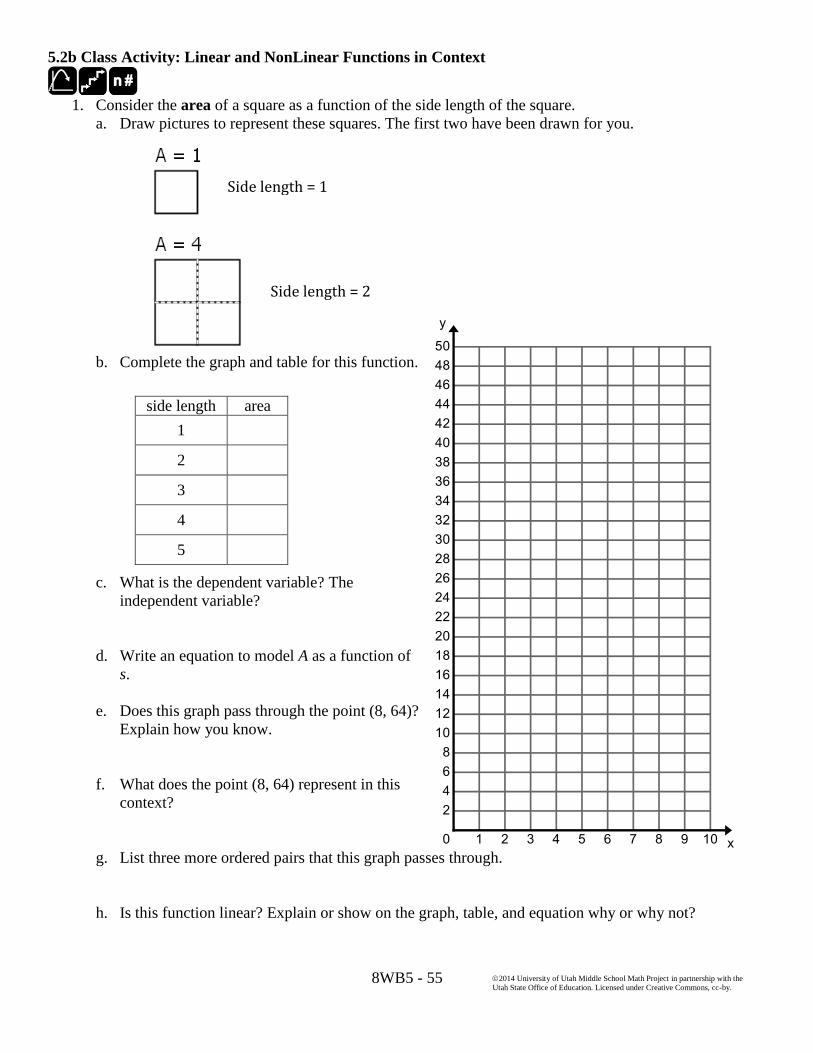
5.2b Class Activity: Linear and NonLinear Functions in Context
1. Consider the area of a square as a function of the side length of the square.
a. Draw pictures to represent these squares. The first two have been drawn for you.
b. Complete the graph and table for this function.
c. What is the dependent variable? The
independent variable?
d. Write an equation to model A as a function of
s.
e. Does this graph pass through the point (8, 64)?
Explain how you know.
f. What does the point (8, 64) represent in this
context?
g. List three more ordered pairs that this graph passes through.
h. Is this function linear? Explain or show on the graph, table, and equation why or why not?
side length area
1
2
3
4
5
Side length = 1
Side length = 2
8WB5 - 56
2014 University of Utah Middle School Math Project in partnership with the
Utah State Office of Education. Licensed under Creative Commons, cc-by.
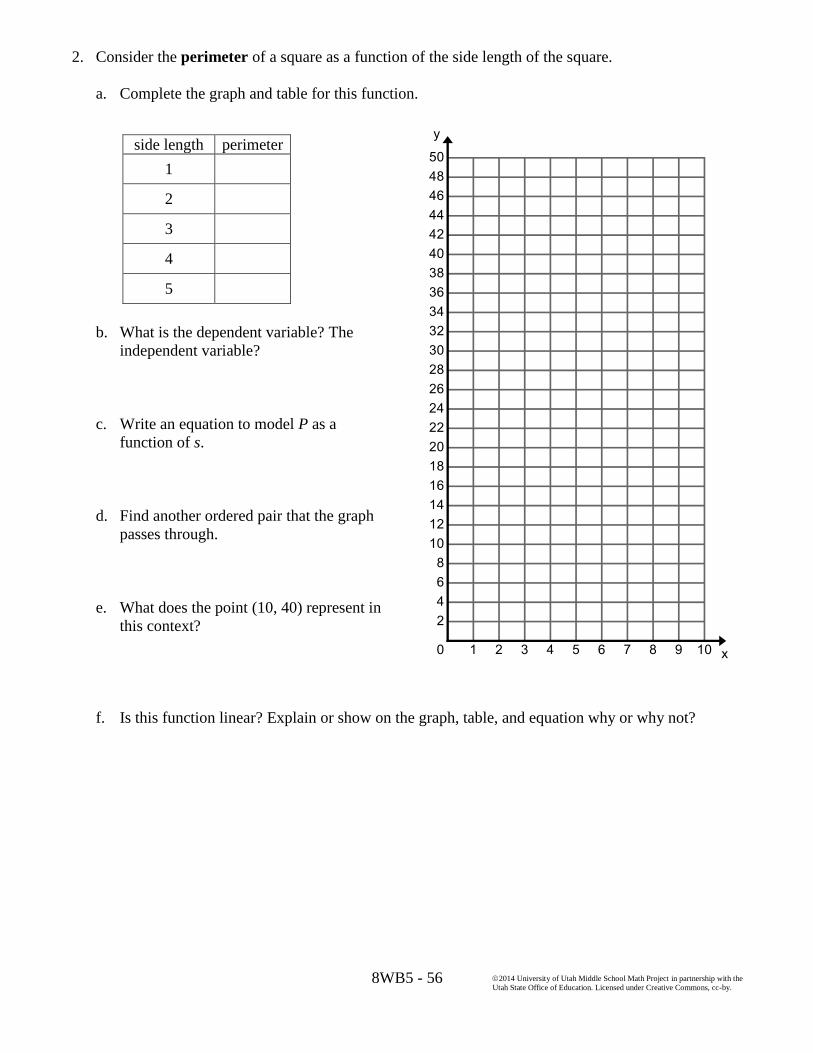
2. Consider the perimeter of a square as a function of the side length of the square.
a. Complete the graph and table for this function.
b. What is the dependent variable? The
independent variable?
c. Write an equation to model P as a
function of s.
d. Find another ordered pair that the graph
passes through.
e. What does the point (10, 40) represent in
this context?
f. Is this function linear? Explain or show on the graph, table, and equation why or why not?
side length perimeter
1
2
3
4
5

8WB5 - 57
2014 University of Utah Middle School Math Project in partnership with the
Utah State Office of Education. Licensed under Creative Commons, cc-by.
5.2b Homework: Linear and NonLinear Functions in Context
1. The following tables show the distance traveled by three different cars over five seconds.
a. Consider the relationship between time and distance traveled for each car. Which of the tables of
data can be modeled by a linear function? Which ones cannot be modeled by a linear function?
Justify your answer.
b. For any of the data sets that can be modeled by a linear function, write a function that models
the distance traveled D as a function of time t.
c. What is the dependent variable in this situation? The independent variable?
d. Which car is traveling fastest? Justify your answer.
2. Hermione argues that the table below represents a linear function. Is she correct? How do you know?
x 2 4 8 16
y 1 3 5 7
3. Emily’s little brother painted on her math homework. She knows the data in each of the tables below
represents a linear function. Help Emily determine what number is hidden behind the blob of paint.
a.
x 10 20 30 40
y 8 13 23
b.
x –2 0 2 3
y –5 7 10
c.
x 0 1 6
y 0 3 9 18
Car 1
Time
(s)
Distance
(ft.)
1 4
2 7
3 10
4 13
5 16
Car 2
Time
(s)
Distance
(ft.)
1 2
2 5
3 10
4 17
5 26
Car 3
Time
(s)
Distance
(ft.)
1 3
2 5
3 9
4 17
5 33
8WB5 - 58
2014 University of Utah Middle School Math Project in partnership with the
Utah State Office of Education. Licensed under Creative Commons, cc-by.
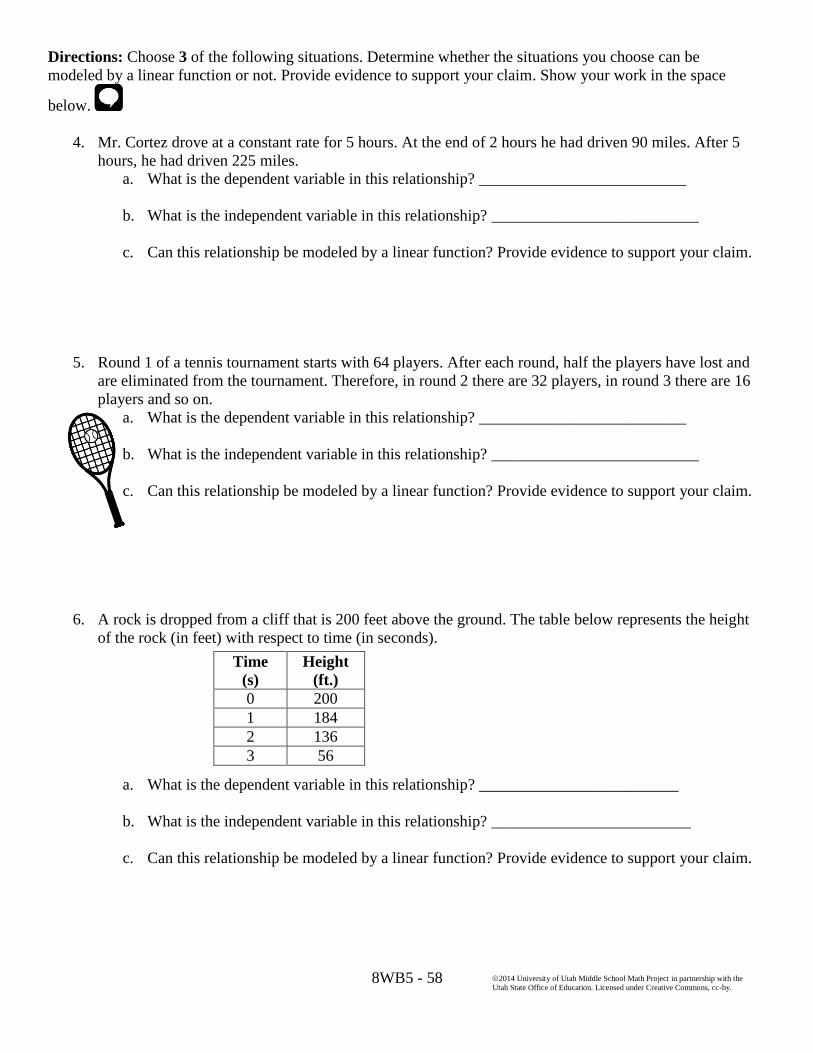
Directions: Choose 3 of the following situations. Determine whether the situations you choose can be
modeled by a linear function or not. Provide evidence to support your claim. Show your work in the space
below.
4. Mr. Cortez drove at a constant rate for 5 hours. At the end of 2 hours he had driven 90 miles. After 5
hours, he had driven 225 miles.
a. What is the dependent variable in this relationship? __________________________
b. What is the independent variable in this relationship? __________________________
c. Can this relationship be modeled by a linear function? Provide evidence to support your claim.
5. Round 1 of a tennis tournament starts with 64 players. After each round, half the players have lost and
are eliminated from the tournament. Therefore, in round 2 there are 32 players, in round 3 there are 16
players and so on.
a. What is the dependent variable in this relationship? __________________________
b. What is the independent variable in this relationship? __________________________
c. Can this relationship be modeled by a linear function? Provide evidence to support your claim.
6. A rock is dropped from a cliff that is 200 feet above the ground. The table below represents the height
of the rock (in feet) with respect to time (in seconds).
a. What is the dependent variable in this relationship? _________________________
b. What is the independent variable in this relationship? _________________________
c. Can this relationship be modeled by a linear function? Provide evidence to support your claim.
Time
(s)
Height
(ft.)
0 200
1 184
2 136
3 56

8WB5 - 59
2014 University of Utah Middle School Math Project in partnership with the
Utah State Office of Education. Licensed under Creative Commons, cc-by.
7. A student comes to school with the flu and infects three other students within an hour before going
home. Each newly infected student passes the virus to three new students in the next hour. This
pattern continues until all students in the school are infected with the virus.
a. What is the dependent variable in this relationship? ___________________________
b. What is the independent variable in this relationship? __________________________
c. Can this relationship be modeled by a linear function? Provide evidence to support your claim.
8. A piece of paper is cut into two equal sections. Each new piece is cut into two additional pieces of
equal size. This pattern continues until it is no longer possible to cut the paper any more.
a. What is the dependent variable in this relationship? ______________________________
b. What is the independent variable in this relationship? _____________________________
c. Can this relationship be modeled by a linear function? Provide evidence to support your claim.

8WB5 - 60
2014 University of Utah Middle School Math Project in partnership with the
Utah State Office of Education. Licensed under Creative Commons, cc-by.
5.2d Class Activity: Different Types of Functions
1. Sketch the general appearance of the graph of the equation 𝑦 = 𝑚𝑥 + 𝑏.
a. What do m and b represent?
b. What makes the graph linear?
2. Complete the table of values for the functions shown in the table below. Using the table of values,
predict what the graphs of the equations will look like. Compare the tables to the table for 𝑦 = 𝑥.
𝒚 = 𝒙𝟐
x y
−2
−1
0
1
2
𝒚 = |𝒙|
x y
−2
−1
0
1
2
𝒚 = 𝒙
x y
−2
−1
0
1
2
𝒚 =𝟏
𝒙
x y
−2
−1
0
1
2
𝒚 = √𝒙
x y
0
1
2
3
4
𝒚 = 𝟐𝒙
x y
0
1
2
3
4
𝒙 + 𝒚 = 𝟔
x y
−2
−1
0
1
2
𝒚 = 𝟔
x y
−2
−1
0
1
2
8WB5 - 61
2014 University of Utah Middle School Math Project in partnership with the
Utah State Office of Education. Licensed under Creative Commons, cc-by.
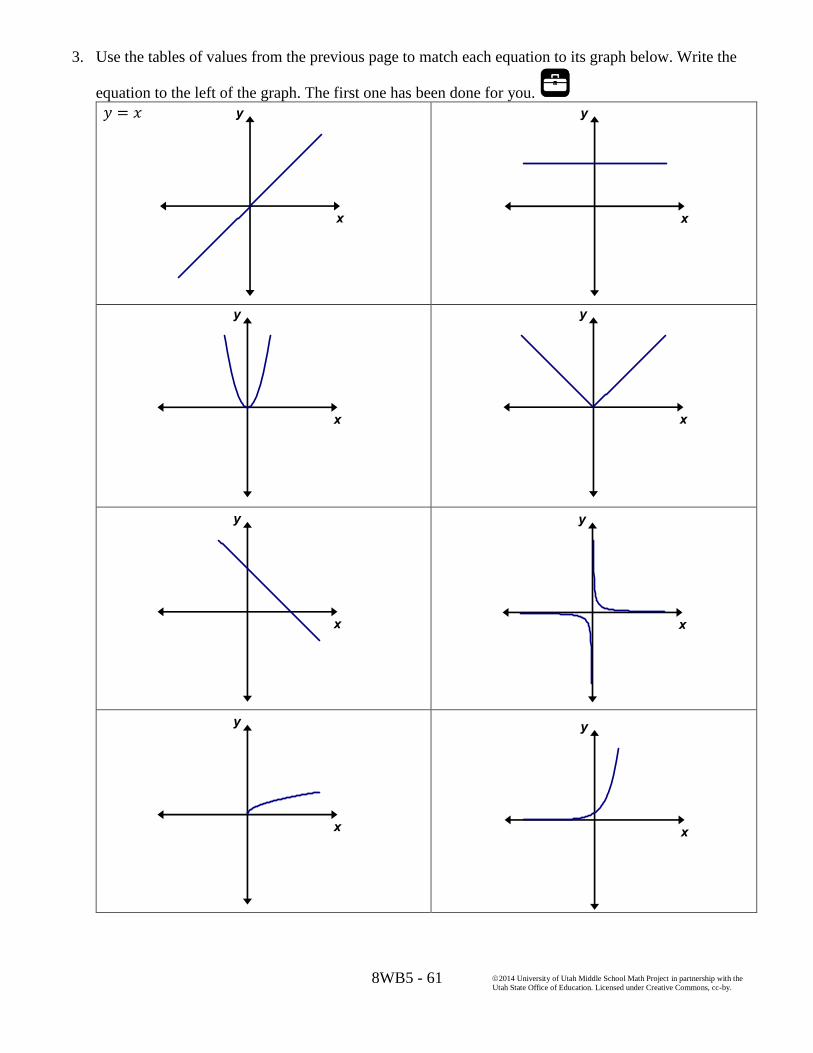
3. Use the tables of values from the previous page to match each equation to its graph below. Write the
equation to the left of the graph. The first one has been done for you.
𝑦 = 𝑥
8WB5 - 62
2014 University of Utah Middle School Math Project in partnership with the
Utah State Office of Education. Licensed under Creative Commons, cc-by.
4. Compare each of the graphs on the previous page to the graph of 𝑦 = 𝑥. What is the same? What is
different? Discuss with a class mate.
5. The graphs of 𝑥2and 3𝑥2 are shown below. Compare these graphs. What is the same? What is
different?
6. The graphs of 𝑦 = 𝑥2 + 5 and 𝑦 = (𝑥 + 5)2 are shown below. Compare these graphs to the graph of
𝑦 = 𝑥2. What is the same? What is different?
𝑥2
3𝑥2
𝑥2 + 5 (𝑥 + 5)2

8WB5 - 63
2014 University of Utah Middle School Math Project in partnership with the
Utah State Office of Education. Licensed under Creative Commons, cc-by.
7. The graphs of 𝑦 = |𝑥| and 𝑦 =1
2|𝑥 − 3| − 2 are shown below. Compare these graphs. What is the
same? What is different?
8. Describe the basic structure of an equation that defines a linear function. Think about the different
forms a linear equation might take. Provide examples of the different forms.
9. Describe attributes you see in the equations that define nonlinear functions. Provide examples.
|𝑥|
1
2|𝑥 − 3| − 2

8WB5 - 64
2014 University of Utah Middle School Math Project in partnership with the
Utah State Office of Education. Licensed under Creative Commons, cc-by.
5.2d Homework: Different Types of Functions
1. Circle the letter next to the graph if it represents a linear function.
A
B
C
D
E
F
G
H
I
Bonus: Do any of the graphs of nonlinear functions have a shape similar to the ones studied in class? Make a
prediction about the basic structure of the equations of these functions.

8WB5 - 65
2014 University of Utah Middle School Math Project in partnership with the
Utah State Office of Education. Licensed under Creative Commons, cc-by.
2. Circle the letter next to the table if the data represents a linear function.
A x y
0 –5
1 0
2 5
3 10
B x y
0 15
1 12.5
2 10
3 7.5
C x y
0 4
1 8
2 16
3 32
D x y
0 98
1 98
2 98
3 98
E x y
–3 3
–2 2
2 2
3 3
F x y
1 2
3 4
6 6
10 8
G x y
2.1 4
2.2 5
2.3 6
2.4 7
H x y
0 2
4 6
8 18
12 54
I x y
3 20
6 24
12 32
24 48
J x y
10 –20
30 –40
50 –60
70 80
K x y
5 0
10 –1
15 –2
20 –3
L x y
15.1 4.2
16.7 12.2
18.3 20.2
19.9 28.2
3. Circle the letter next to each equation if it represents a linear function.
A 2𝑥 + 4𝑦 = 16
B 𝑦 = |2𝑥| + 5
C 𝑦 = 𝑥2 + 5
D 𝑦 = 5 ∙ 3𝑥
E 𝑦 =
4
𝑥+ 3
F 𝑦 =
𝑥
4+ 3
G 𝑦 = √4𝑥
H 𝑥2 + 𝑦2 = 25
I 𝑥𝑦 = 24
J 2𝑥 + 𝑦 = 6
K 𝑦 = −
2
3𝑥
L 𝑦 = 8
M 𝑦 =
2
3𝑥
N 𝑦 = 𝑥3
O 3𝑥 − 𝑦 = 2
P 𝑦 = 𝑥(𝑥 + 2)
Bonus: Can you predict the basic shape of any of the graphs of the nonlinear equations in #3?
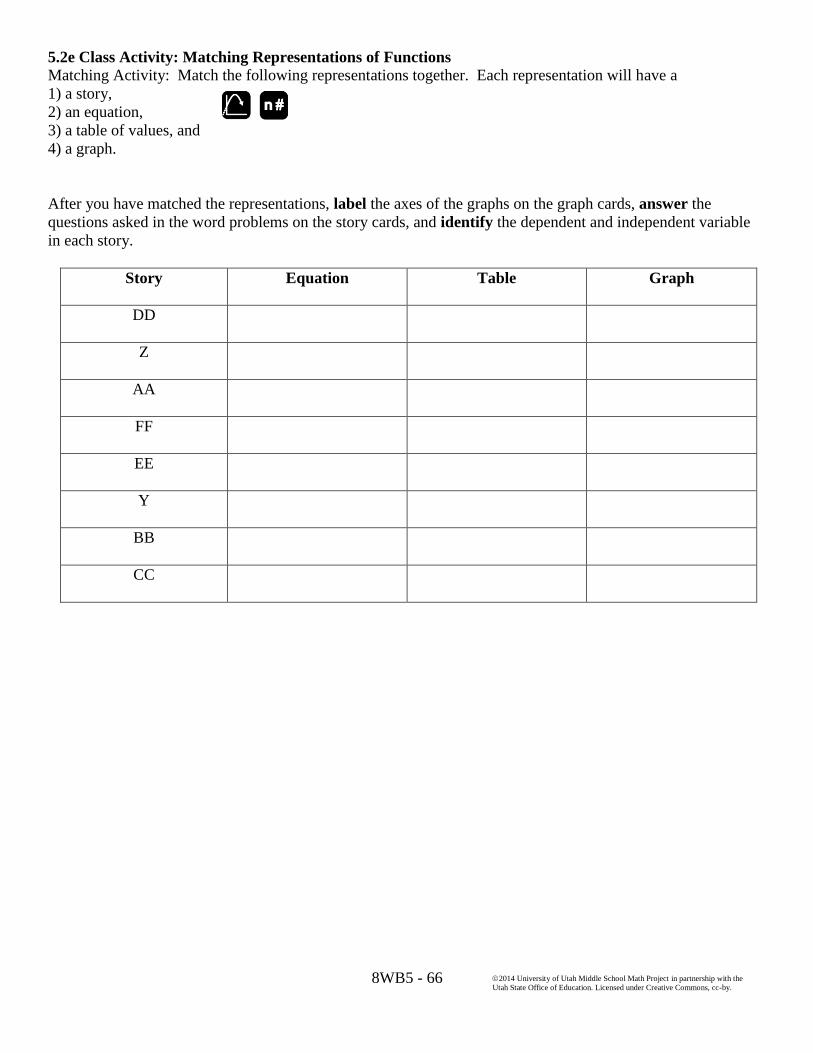
8WB5 - 66
2014 University of Utah Middle School Math Project in partnership with the
Utah State Office of Education. Licensed under Creative Commons, cc-by.
5.2e Class Activity: Matching Representations of Functions
Matching Activity: Match the following representations together. Each representation will have a
1) a story,
2) an equation,
3) a table of values, and
4) a graph.
After you have matched the representations, label the axes of the graphs on the graph cards, answer the
questions asked in the word problems on the story cards, and identify the dependent and independent variable
in each story.
Story Equation Table Graph
DD
Z
AA
FF
EE
Y
BB
CC

8WB5 - 67
2014 University of Utah Middle School Math Project in partnership with the
Utah State Office of Education. Licensed under Creative Commons, cc-by.
A
x 0 3 6 9 12 15
y 6 7 8 9 10 11
B
x 0 1 2 3 4 5
y 6 100 162 192 190 156
C
x 0 4 8 12 16 20
y 0 200 200 200 224 248
D
x 0 1 2 3 4 5
y 6 12 24 48 96 192
E
x 0 5 10 15 20 25
y 6 7 8 9 10 11
F
x 0 1 2 3 4 5
y 200 196 192 188 184 180
G
x 0 1 2 3 4 5
y 6 206 406 606 806 1006
H
x 0 1 2 3 4 5
y 6 9 12 15 18 21
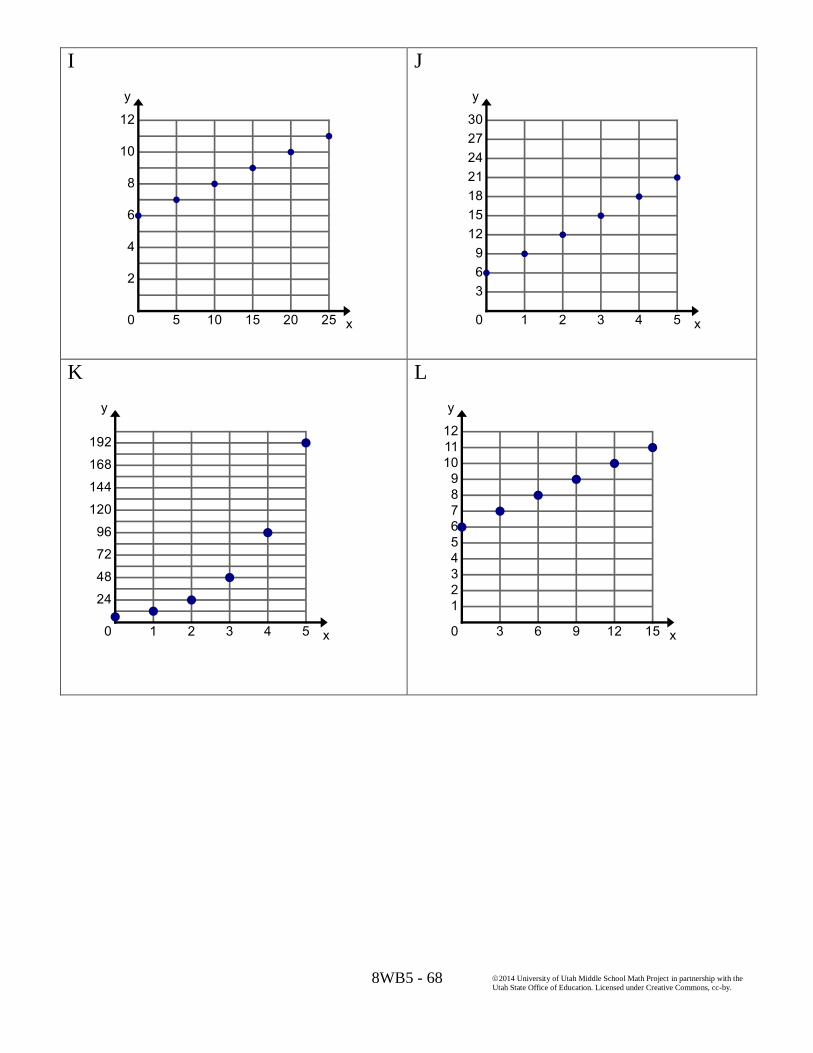
8WB5 - 68
2014 University of Utah Middle School Math Project in partnership with the
Utah State Office of Education. Licensed under Creative Commons, cc-by.
I
J
K
L
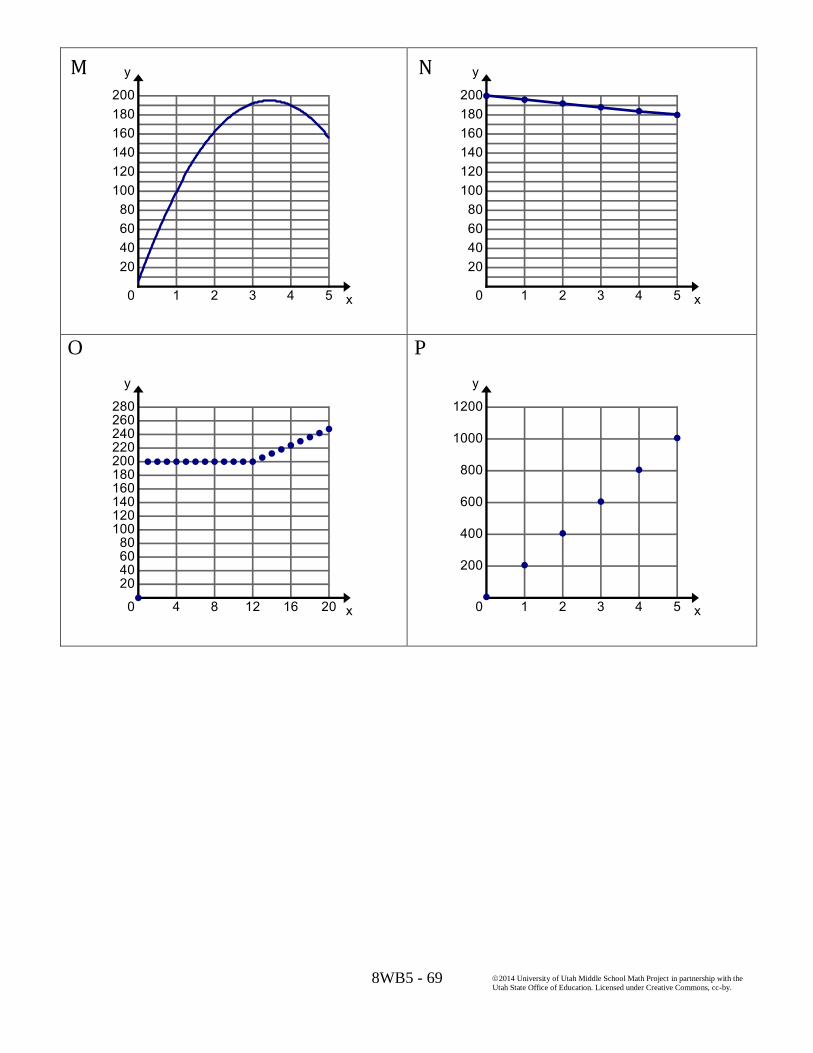
8WB5 - 69
2014 University of Utah Middle School Math Project in partnership with the
Utah State Office of Education. Licensed under Creative Commons, cc-by.
O
P
N M
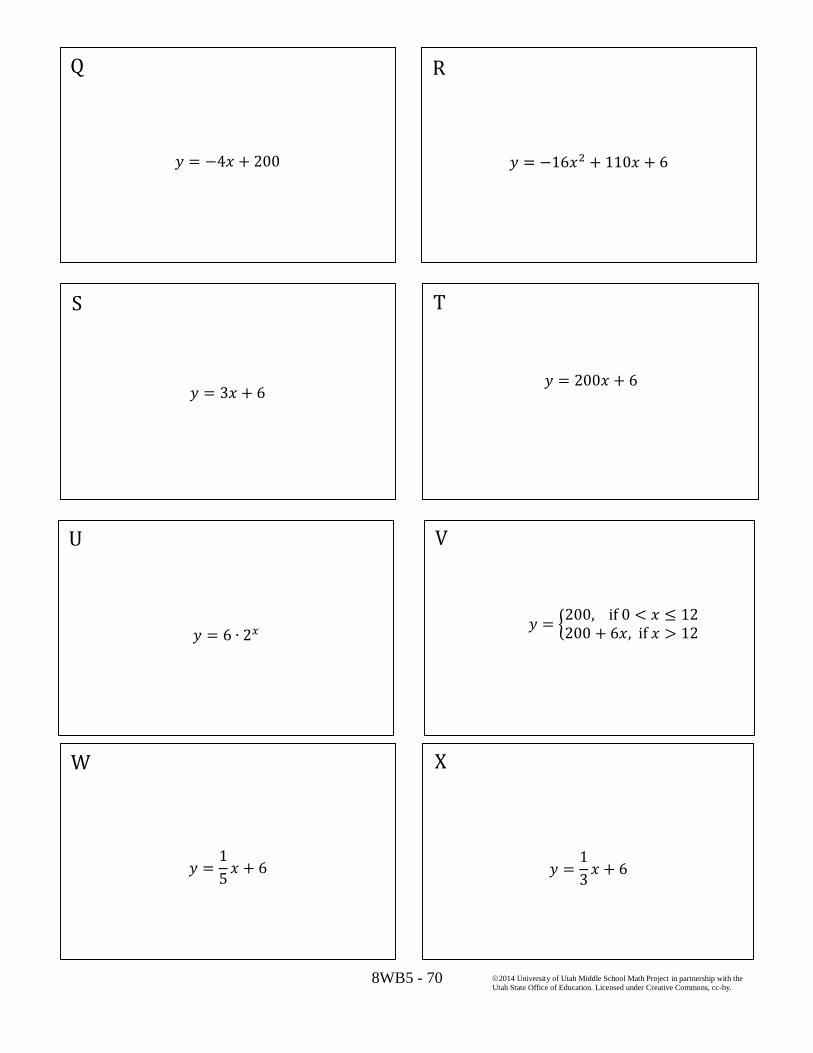
8WB5 - 70
2014 University of Utah Middle School Math Project in partnership with the
Utah State Office of Education. Licensed under Creative Commons, cc-by.
Q
𝑦 = −4𝑥 + 200
𝑦 = −16𝑥2 + 110𝑥 + 6
𝑦 = 3𝑥 + 6
T
𝑦 = 200𝑥 + 6
U
𝑦 = 6 ∙ 2𝑥
𝑦 = {200, if 0 < 𝑥 ≤ 12200 + 6𝑥, if 𝑥 > 12
W
𝑦 =
1
5𝑥 + 6
𝑦 =1
3𝑥 + 6
S
R
V
X

8WB5 - 71
2014 University of Utah Middle School Math Project in partnership with the
Utah State Office of Education. Licensed under Creative Commons, cc-by.
Y A certain bacteria reproduces by binary fission
every hour. This means that one bacterium
grows to twice its size, replicates its DNA, and
splits in 2. If 6 of these bacterium are placed in a
petri dish, how many will there by after 5 hours?
Dependent Variable:
Independent Variable:
Z The state is building a road 4.5 km long from
point A to point B. Six meters of the road have
already been completed when a new crew starts
the job. It takes the crew 3 weeks to complete
600 meters of the road. How much of the road
will be completed after 5 weeks if the crew
works at a constant rate?
Dependent Variable:
Independent Variable:
AA Talen loves to help his mom clean to earn
money for his cash box. He currently has $6 in
his cash box. He earns $1 for every 3 jobs he
does. How much money will Talen have if he
does 15 jobs?
Dependent Variable:
Independent Variable:
BB Josh is draining a swimming pool at a constant
rate of 4 gallons per minute. If the swimming
pool starts will 200 gallons of water, how many
gallons will remain after 5 minutes?
Dependent Variable:
Independent Variable:
CC Kendall’s mom and dad have agreed to sponsor
her in a school walk-a-thon to raise money for
soccer uniforms. Her mom is donating $6 to her.
Her dad is donating $3 for each mile she walks.
How much money will she collect if she walks 5
miles?
Dependent Variable:
Independent Variable:
DD The Planetarium charges $200 for a birthday
party for up to 12 guests. Each additional guest
is $6. How much will it cost for a birthday party
with 20 guests?
Dependent Variable:
Independent Variable:
EE Suppose a rocket is fired from a platform 6 ft.
off the ground into the air vertically with an
initial speed of 110 feet/second. Where will the
rocket be after 5 seconds? Note: The
gravitational force of the earth on the rocket is -
16 ft./sec2.
Dependent Variable:
Independent Variable:
FF Suzy is helping her mom fill Easter eggs with
jelly beans for a community egg hunt. Before
they get started, Suzy eats 6 jelly beans. Her
mom tells her that after that she can eat 1 jelly
bean for every 5 eggs she fills. How many jelly
beans total did Suzy eat if she filled 25 eggs?
Dependent Variable:
Independent Variable:

8WB5 - 72
2014 University of Utah Middle School Math Project in partnership with the
Utah State Office of Education. Licensed under Creative Commons, cc-by.
5.2e Homework: Matching Representations of Functions
Directions: Create each of the following representations.
1. a table of data that represents a linear
function
2. a table of data that represents a nonlinear
function
3. a graph that represents a linear function 4. a graph that represents a nonlinear function
5. an equation that defines a linear function 6. an equation that defines a nonlinear function
7. a context (story) that can be modeled by a
linear function
8. a context (story) that can be modeled by a
nonlinear function
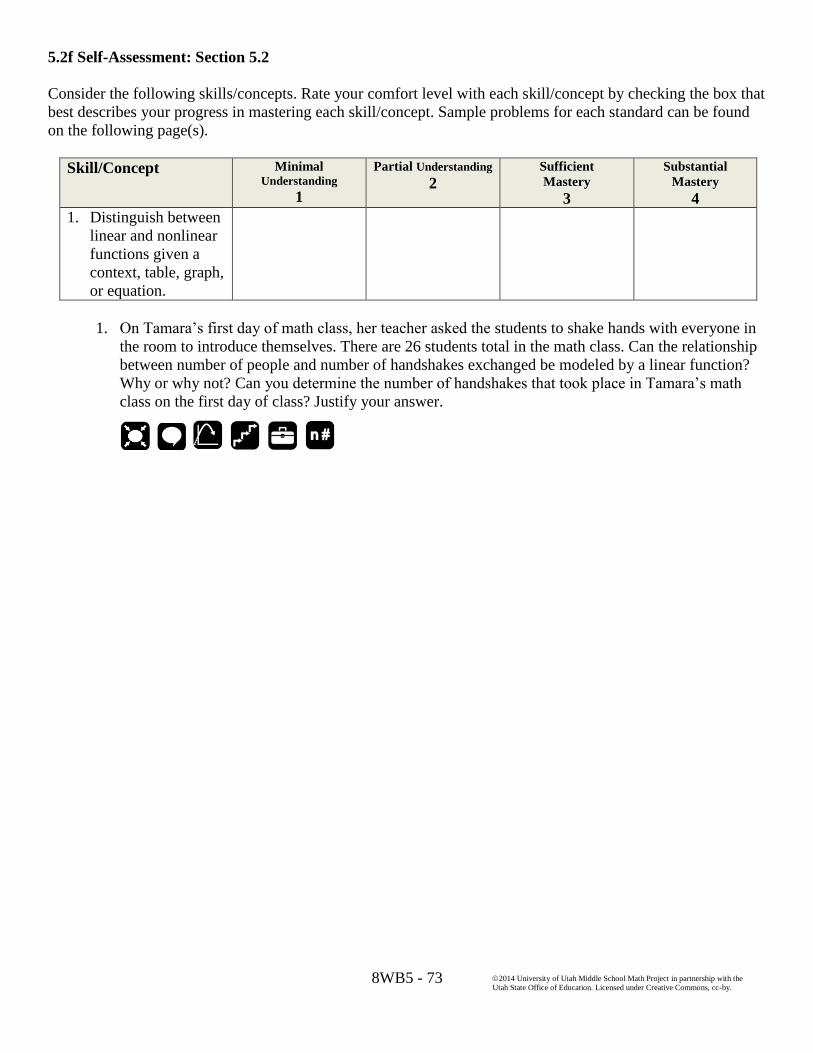
8WB5 - 73
2014 University of Utah Middle School Math Project in partnership with the
Utah State Office of Education. Licensed under Creative Commons, cc-by.
5.2f Self-Assessment: Section 5.2
Consider the following skills/concepts. Rate your comfort level with each skill/concept by checking the box that
best describes your progress in mastering each skill/concept. Sample problems for each standard can be found
on the following page(s).
Skill/Concept
Minimal Understanding
1
Partial Understanding
2 Sufficient
Mastery
3
Substantial
Mastery
4
1. Distinguish between
linear and nonlinear
functions given a
context, table, graph,
or equation.
1. On Tamara’s first day of math class, her teacher asked the students to shake hands with everyone in
the room to introduce themselves. There are 26 students total in the math class. Can the relationship
between number of people and number of handshakes exchanged be modeled by a linear function?
Why or why not? Can you determine the number of handshakes that took place in Tamara’s math
class on the first day of class? Justify your answer.

8WB5 - 74
2014 University of Utah Middle School Math Project in partnership with the
Utah State Office of Education. Licensed under Creative Commons, cc-by.

8WB5 - 75
2014 University of Utah Middle School Math Project in partnership with the
Utah State Office of Education. Licensed under Creative Commons, cc-by.
Section 5.3: Model and Analyze a Functional Relationship
Section Overview:
In this section, students will analyze functional relationships between two quantities given different
representations. For relationships that are linear, students will construct a function to model the relationship
between the quantities. Students will also compare properties of linear functions represented in different ways,
examining rates of change and intercepts, and using this information to solve problems. Next, students will
learn about some of the key features of graphs of functions and apply this knowledge in order to describe
qualitatively the functional relationship between two quantities. Lastly, students will sketch graphs that display
key features of a function given a verbal description of the relationship between two quantities.
Concepts and Skills to Master:
By the end of this section, students should be able to:
Determine whether the relationship between two quantities can be modeled by a linear function and
construct a function to model a linear relationship between two quantities.
Compare properties of linear functions (rates of change and intercepts) and use this information to solve
problems.
Identify and interpret key features of a graph that models a relationship between two quantities.
Sketch a graph that displays key features of a function that has been described verbally.

8WB5 - 76
2014 University of Utah Middle School Math Project in partnership with the
Utah State Office of Education. Licensed under Creative Commons, cc-by.
5.3a Class Activity: Constructing Linear Functions
Directions: Identify the dependent and independent variable in the following situations. Determine whether the
situations are linear or nonlinear. For the situations that are linear, construct a function that models the
relationship between the two quantities. Be sure to define your variables.
1. An object is dropped from a bridge into the water below. The graph below shows the height of the
object (in feet) with respect to time (in seconds). Consider the relationship between the height of the
object and time.
2. Owen is earning pennies each day that he makes his bed in the morning. On the first day, Owen’s
mom gives him 2 pennies. On the second day, Owen’s mom gives him 4 pennies, on the third day 6
pennies, on the fourth day 8 pennies, and so on. Owen makes his bed every day and this pattern
continues. The model below shows how many pennies Owen earns each day (each box represents 1
penny). Consider the relationship between the number of pennies received on a given day and the
day number.
Day 1 Day 2 Day 3 Day 4
Independent Variable:
Dependent Variable:
Is the data linear? Why or why not?
If yes, construct a function to model the relationship
between the two quantities. Be sure to define your
variables.
Independent Variable:
Dependent Variable:
Is the data linear? Why or why not?
If yes, construct a function to model the relationship
between the two variables. Be sure to define your
variables.

8WB5 - 77
2014 University of Utah Middle School Math Project in partnership with the
Utah State Office of Education. Licensed under Creative Commons, cc-by.
3. Refer back to #2 and Owen earning pennies. Consider the relationship between the total number of
pennies Owen has earned and the day number.
4. Carbon-14 has a half-life of 5,730 years. The table below shows the amount of carbon-14 that will
remain after a given number of years. Consider the relationship between number of years and
amount of carbon-14 remaining.
Day # of Pennies
Added That
Day
Sum of
Pennies
# of
Years
Milligrams
of Carbon-
14
0 8
5,730 4
11,460 2
17,190 1
22,920 1
2
Independent Variable:
Dependent Variable:
Is the data linear? Why or why not?
If yes, construct a function to model the relationship
between the two variables. Be sure to define your
variables.
Independent Variable:
Dependent Variable:
Is the data linear? Why or why not?
If yes, construct a function to model the relationship
between the two variables. Be sure to define your variables.

8WB5 - 78
2014 University of Utah Middle School Math Project in partnership with the
Utah State Office of Education. Licensed under Creative Commons, cc-by.
5. The table below shows the amount of time a recipe recommends you should roast a turkey at 325˚ F
dependent on the weight of the turkey in pounds. Consider the relationship between cooking time
and weight of the turkey.
Weight
of
Turkey
(lbs.)
12 13 14 15
Cooking
Time
(hours)
4 41
3 4
2
3 5
6. Steve is a lifeguard at a local community pool. Each day at noon, he records the temperature and the
number of people in the pool. Do you think the relationship between temperature and number of
people in the pool is linear? Why or why not?
Independent Variable:
Dependent Variable:
Is the data linear? Why or why not?
If yes, construct a function to model the relationship
between the two variables. Be sure to define your
variables.

8WB5 - 79
2014 University of Utah Middle School Math Project in partnership with the
Utah State Office of Education. Licensed under Creative Commons, cc-by.
5.3a Homework: Constructing Linear Functions
Directions: Determine whether the situations represented below are linear or nonlinear. For the situations that
are linear, construct a function that models the relationship between the two quantities. Be sure to define your
variables.
1. The graph below shows the amount of revenue a company will make selling t-shirts dependent on the price
of each t-shirt. Consider the relationship between price of each shirt and revenue made.
2. When Camilo opened his email this morning he had 140 unread emails. The table below shows the number
of remaining unread emails Camilo has in his inbox. Assume that Camilo does not receive any new emails
while he is reading his email. Consider the relationship between time and the number of unread emails.
Time (hours) # of Unread
Emails
0 180
0.5 160
1 140
2 100
2.5 80
4 20
4.5 0
Is the data linear? Why or why not?
If yes, construct a function to model the relationship
between the two variables. Be sure to define your
variables.
Is the data linear? Why or why not?
If yes, construct a function to model the relationship
between the two quantities. Be sure to define your
variables.
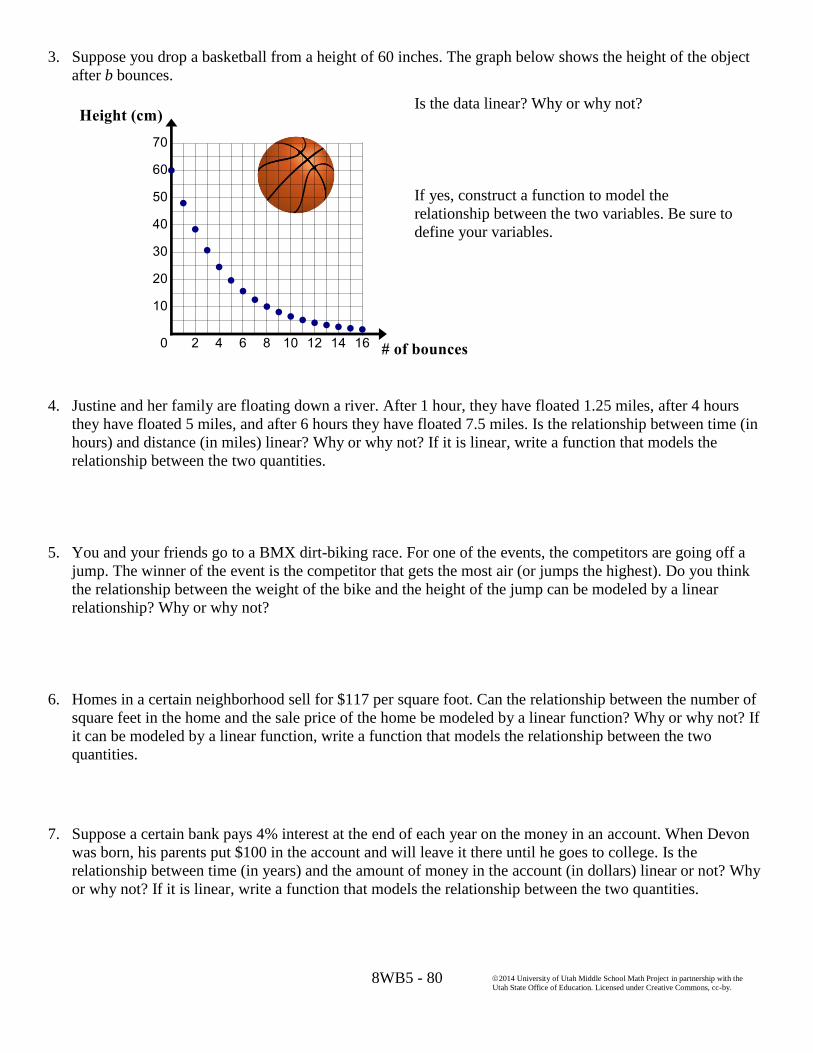
8WB5 - 80
2014 University of Utah Middle School Math Project in partnership with the
Utah State Office of Education. Licensed under Creative Commons, cc-by.
3. Suppose you drop a basketball from a height of 60 inches. The graph below shows the height of the object
after b bounces.
4. Justine and her family are floating down a river. After 1 hour, they have floated 1.25 miles, after 4 hours
they have floated 5 miles, and after 6 hours they have floated 7.5 miles. Is the relationship between time (in
hours) and distance (in miles) linear? Why or why not? If it is linear, write a function that models the
relationship between the two quantities.
5. You and your friends go to a BMX dirt-biking race. For one of the events, the competitors are going off a
jump. The winner of the event is the competitor that gets the most air (or jumps the highest). Do you think
the relationship between the weight of the bike and the height of the jump can be modeled by a linear
relationship? Why or why not?
6. Homes in a certain neighborhood sell for $117 per square foot. Can the relationship between the number of
square feet in the home and the sale price of the home be modeled by a linear function? Why or why not? If
it can be modeled by a linear function, write a function that models the relationship between the two
quantities.
7. Suppose a certain bank pays 4% interest at the end of each year on the money in an account. When Devon
was born, his parents put $100 in the account and will leave it there until he goes to college. Is the
relationship between time (in years) and the amount of money in the account (in dollars) linear or not? Why
or why not? If it is linear, write a function that models the relationship between the two quantities.
Is the data linear? Why or why not?
If yes, construct a function to model the
relationship between the two variables. Be sure to
define your variables.

8WB5 - 81
2014 University of Utah Middle School Math Project in partnership with the
Utah State Office of Education. Licensed under Creative Commons, cc-by.
5.3b Class Activity: Comparing Linear Functions
1. Who will have $100 first, George or Mark?
George has $20 and is saving $15 every
week.
Mark starts with $20. His savings are shown on the
graph below.
2. Put the cyclists in order from slowest to fastest. (Note variables: x = time in seconds, y = meters traveled)
Cyclist A:
Time (x) Distance (y)
2 1
4 2
6 3
Cyclist D:
Cyclist B:
Bob has cycled 12 meters in the past 6
seconds.
Cyclist C:
𝑦 =1
3𝑥
Time (seconds)
Dis
tan
ce
(m
ete
rs)
Time (weeks)
Mo
ne
y (
do
llars
)

8WB5 - 82
2014 University of Utah Middle School Math Project in partnership with the
Utah State Office of Education. Licensed under Creative Commons, cc-by.
3. Assume the rates below will remain constant. Who will win the hot dog eating contest? Why?
Helga, who has eaten 18 hot dogs in 5
minutes.
Pablo whose eating record is shown below.
4. Based on the information below, which bathtub will be empty first? Why?
Bathtub A:
Starts with 25 gallons and is draining 1.5
gallons a minute.
Bathtub C:
Bathtub B:
Minutes Gallons
0 25
3 20
6 15
Time (minutes)
Wa
ter
(ga
llon
s)
Time (minutes) H
ot
Do
gs c
on
su
me
d

8WB5 - 83
2014 University of Utah Middle School Math Project in partnership with the
Utah State Office of Education. Licensed under Creative Commons, cc-by.
5. Put the cars in order from fastest to slowest. (Note variables: x = time in hours, y = miles traveled). Assume
all cars travel at a constant rate.
Car A:
Car D:
Car B:
The Bakers completed the 64-mile trip to Salt
Lake City in 50 minutes.
Car C:
Hours Miles
2 150
4 300
6. Put the exercises below in order from burns the most calories to burns the least calories. (Note variables: x =
time in minutes, y = calories burned). Assume the rate at which you burn calories in each of the exercises is
constant.
Cycling:
𝑦 = 10.8𝑥
Swimming:
Yoga:
Meredith burned 429 calories in a 1-hour
long yoga class.
Running:
Minutes Calories
Burned
10 137
15 205.5
25 342.5
y = 65x
Time (hours) D
ista
nce
(m
iles)
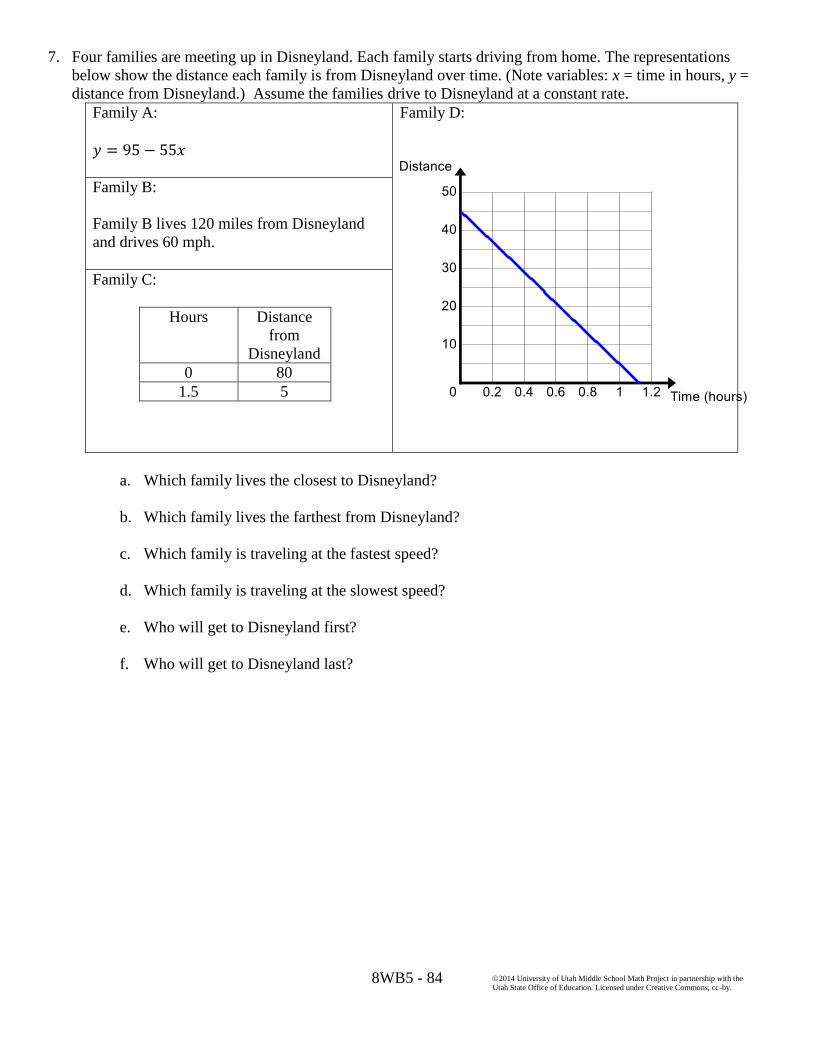
8WB5 - 84
2014 University of Utah Middle School Math Project in partnership with the
Utah State Office of Education. Licensed under Creative Commons, cc-by.
7. Four families are meeting up in Disneyland. Each family starts driving from home. The representations
below show the distance each family is from Disneyland over time. (Note variables: x = time in hours, y =
distance from Disneyland.) Assume the families drive to Disneyland at a constant rate.
Family A:
𝑦 = 95 − 55𝑥
Family D:
Family B:
Family B lives 120 miles from Disneyland
and drives 60 mph.
Family C:
Hours Distance
from
Disneyland
0 80
1.5 5
a. Which family lives the closest to Disneyland?
b. Which family lives the farthest from Disneyland?
c. Which family is traveling at the fastest speed?
d. Which family is traveling at the slowest speed?
e. Who will get to Disneyland first?
f. Who will get to Disneyland last?
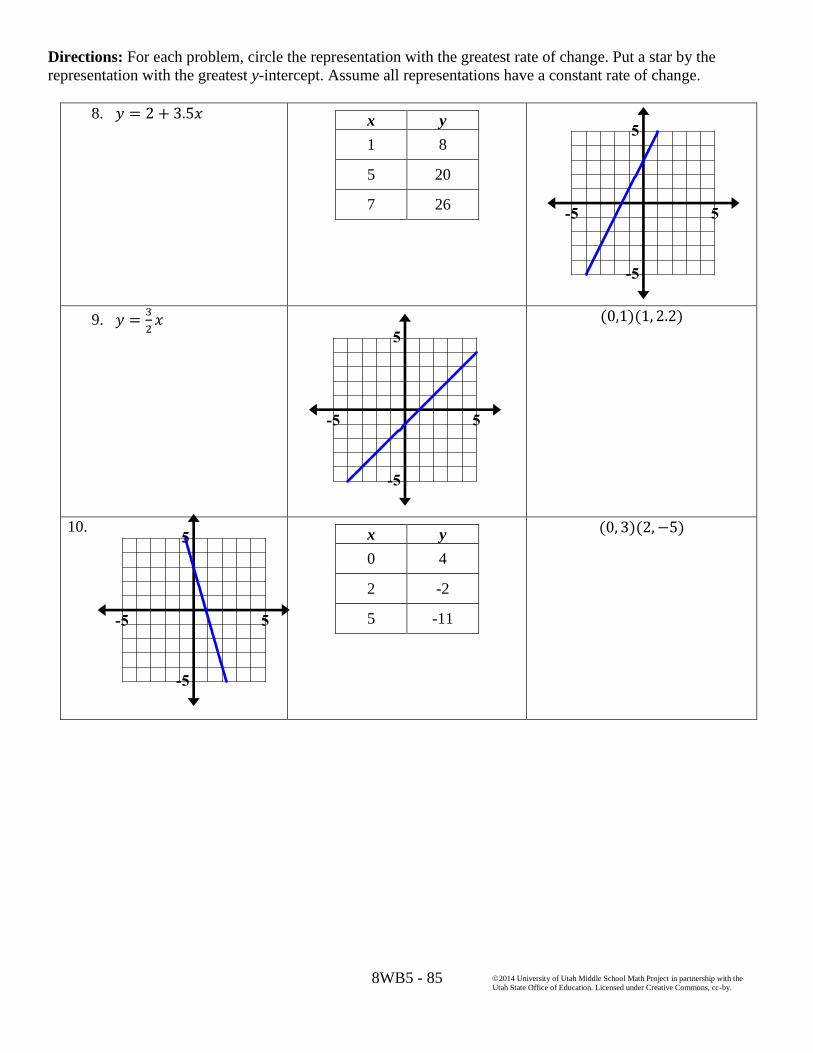
8WB5 - 85
2014 University of Utah Middle School Math Project in partnership with the
Utah State Office of Education. Licensed under Creative Commons, cc-by.
Directions: For each problem, circle the representation with the greatest rate of change. Put a star by the
representation with the greatest y-intercept. Assume all representations have a constant rate of change.
8. 𝑦 = 2 + 3.5𝑥
x y
1 8
5 20
7 26
9. 𝑦 =3
2𝑥
(0,1)(1, 2.2)
10.
x y
0 4
2 -2
5 -11
(0, 3)(2, −5)

8WB5 - 86
2014 University of Utah Middle School Math Project in partnership with the
Utah State Office of Education. Licensed under Creative Commons, cc-by.
5.3b Homework: Comparing Linear Functions
1. Who will have $1,000 first, Becky or Olga?
Becky has $100 and is saving $10 every wee k.
Olga’s information is shown on the graph below.
2. Assume the rates below will remain constant. Who will win the pie eating contest? Why?
Joe, whose information is shown below.
Donna, who has eaten 11 pies in 2.5 minutes.
Time (weeks)
Mo
ne
y (
do
llars
)
Pie
s c
on
su
me
d
Time (minutes)
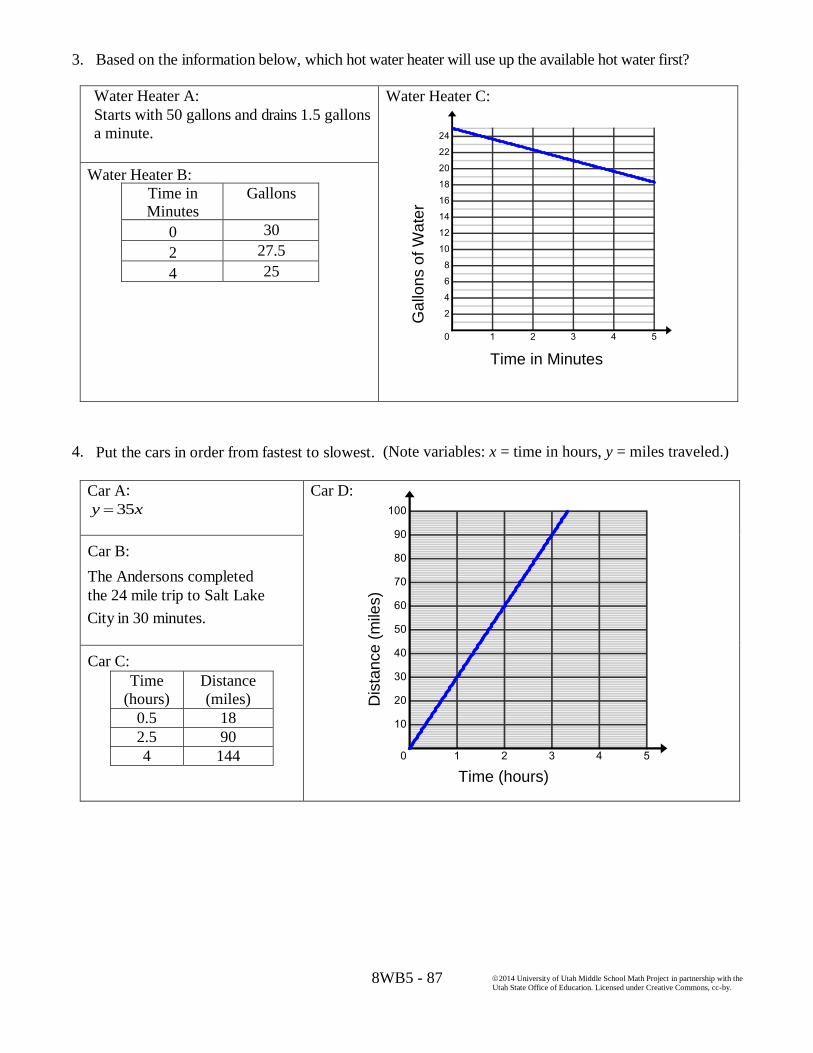
8WB5 - 87
2014 University of Utah Middle School Math Project in partnership with the
Utah State Office of Education. Licensed under Creative Commons, cc-by.
3. Based on the information below, which hot water heater will use up the available hot water first?
Water Heater A:
Starts with 50 gallons and drains 1.5 gallons
a minute.
Water Heater C:
Water Heater B:
Time in Minutes
Gallons
0 30
2 27.5
4 25
4. Put the cars in order from fastest to slowest. (Note variables: x = time in hours, y = miles traveled.)
Car A:
35y x
Car D:
Car B:
The Andersons completed
the 24 mile trip to Salt Lake
City in 30 minutes.
Car C:
Time
(hours)
Distance
(miles)
0.5 18
2.5 90
4 144
Ga
llon
s o
f W
ate
r
Time in Minutes D
ista
nce
(m
iles)
Time (hours)
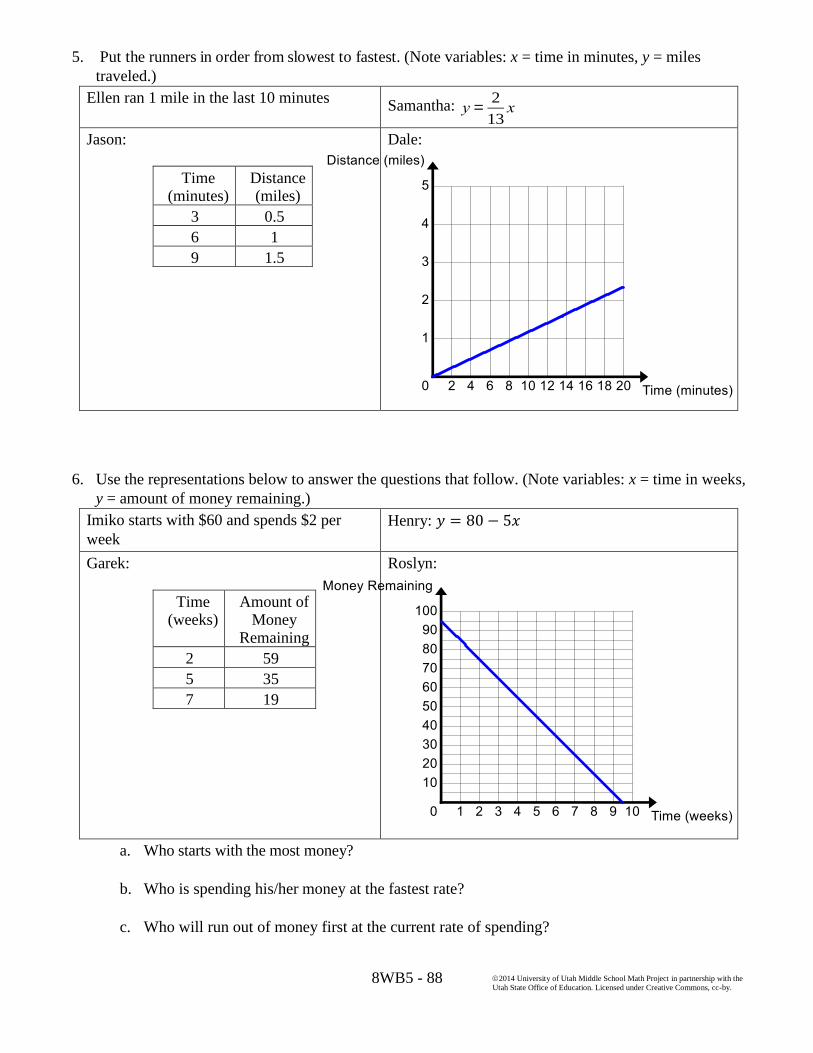
8WB5 - 88
2014 University of Utah Middle School Math Project in partnership with the
Utah State Office of Education. Licensed under Creative Commons, cc-by.
5. Put the runners in order from slowest to fastest. (Note variables: x = time in minutes, y = miles
traveled.)
Ellen ran 1 mile in the last 10 minutes Samantha: y =
2
13x
Jason:
Time (minutes)
Distance (miles)
3 0.5
6 1
9 1.5
Dale:
6. Use the representations below to answer the questions that follow. (Note variables: x = time in weeks,
y = amount of money remaining.)
Imiko starts with $60 and spends $2 per
week
Henry: 𝑦 = 80 − 5𝑥
Garek:
Time (weeks)
Amount of Money
Remaining
2 59
5 35
7 19
Roslyn:
a. Who starts with the most money?
b. Who is spending his/her money at the fastest rate?
c. Who will run out of money first at the current rate of spending?
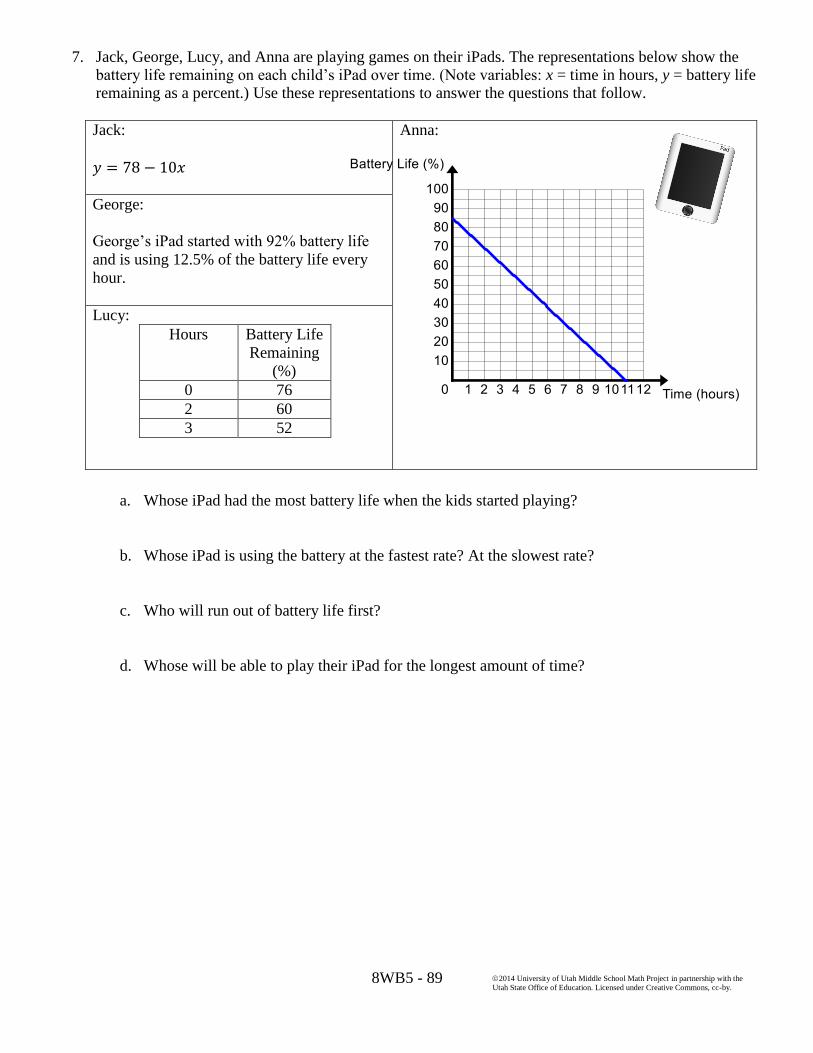
8WB5 - 89
2014 University of Utah Middle School Math Project in partnership with the
Utah State Office of Education. Licensed under Creative Commons, cc-by.
7. Jack, George, Lucy, and Anna are playing games on their iPads. The representations below show the battery life remaining on each child’s iPad over time. (Note variables: x = time in hours, y = battery life remaining as a percent.) Use these representations to answer the questions that follow.
Jack:
𝑦 = 78 − 10𝑥
Anna:
George:
George’s iPad started with 92% battery life
and is using 12.5% of the battery life every
hour.
Lucy:
Hours Battery Life
Remaining
(%)
0 76
2 60
3 52
a. Whose iPad had the most battery life when the kids started playing?
b. Whose iPad is using the battery at the fastest rate? At the slowest rate?
c. Who will run out of battery life first?
d. Whose will be able to play their iPad for the longest amount of time?
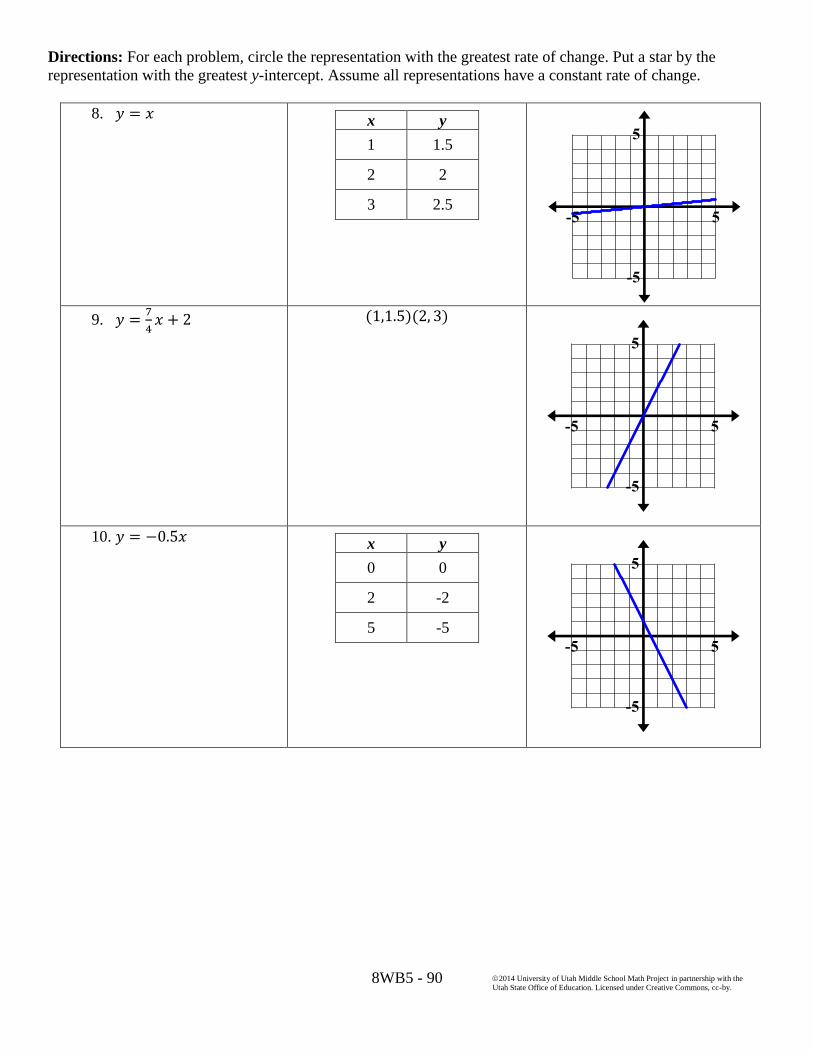
8WB5 - 90
2014 University of Utah Middle School Math Project in partnership with the
Utah State Office of Education. Licensed under Creative Commons, cc-by.
Directions: For each problem, circle the representation with the greatest rate of change. Put a star by the
representation with the greatest y-intercept. Assume all representations have a constant rate of change.
8. 𝑦 = 𝑥
x y
1 1.5
2 2
3 2.5
9. 𝑦 =7
4𝑥 + 2
(1,1.5)(2, 3)
10. 𝑦 = −0.5𝑥
x y
0 0
2 -2
5 -5

8WB5 - 91
2014 University of Utah Middle School Math Project in partnership with the
Utah State Office of Education. Licensed under Creative Commons, cc-by.
5.3c Class Activity: Features of Graphs
1. Cut out each graph. Sort the graphs into groups and be able to explain why you grouped the graphs the
way you did. In the table that follows, name your groups, describe your groups, and list the graphs that
are in your group.
A B
C D
E F

8WB5 - 92
2014 University of Utah Middle School Math Project in partnership with the
Utah State Office of Education. Licensed under Creative Commons, cc-by.
G H
I J
K L

8WB5 - 93
2014 University of Utah Middle School Math Project in partnership with the
Utah State Office of Education. Licensed under Creative Commons, cc-by.
M
M N
O P

8WB5 - 94
2014 University of Utah Middle School Math Project in partnership with the
Utah State Office of Education. Licensed under Creative Commons, cc-by.
Your Groups
Name of the group Description of the group Graphs in the group
A.
B.
C.
D.
E.
F.
2. For each group that you created, draw another graph that would fit in that group.
3. Lucy grouped hers as follows:
Increasing on the entire graph: A, C, E, K, M, P
Decreasing on the entire graph: I
Constant on the entire graph: F
Increasing on some parts of the graph, decreasing on some parts of the graph: D, G, H, J, L, O
Increasing on some parts of the graph, decreasing on some parts of the graph, constant on some parts of
the graph: N
Increasing on some parts of the graph, constant on some parts of the graph: B
A B C
D E F
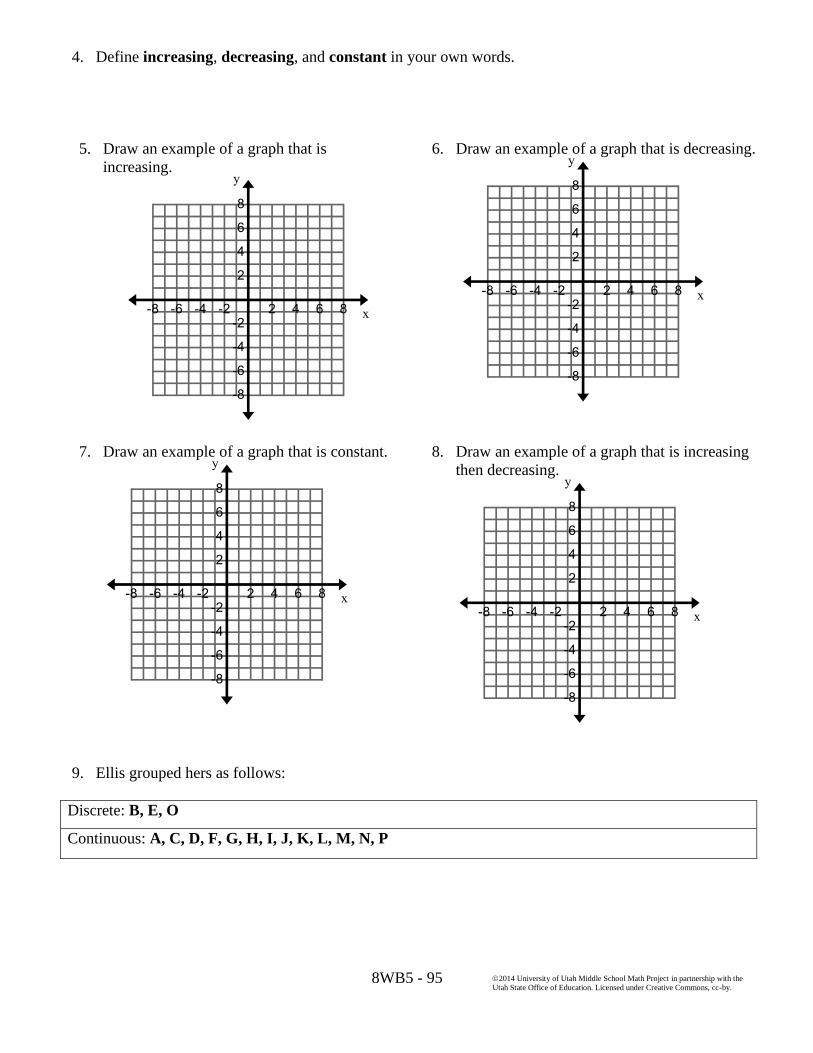
8WB5 - 95
2014 University of Utah Middle School Math Project in partnership with the
Utah State Office of Education. Licensed under Creative Commons, cc-by.
4. Define increasing, decreasing, and constant in your own words.
5. Draw an example of a graph that is
increasing.
6. Draw an example of a graph that is decreasing.
7. Draw an example of a graph that is constant.
8. Draw an example of a graph that is increasing
then decreasing.
9. Ellis grouped hers as follows:
Discrete: B, E, O
Continuous: A, C, D, F, G, H, I, J, K, L, M, N, P

8WB5 - 96
2014 University of Utah Middle School Math Project in partnership with the
Utah State Office of Education. Licensed under Creative Commons, cc-by.
10. Define discrete and continuous in your own words. Can you think of a real world situation that has a
discrete graph? Why doesn’t it make sense to connect the points in this situation?
11. Draw an example of a graph that is discrete.
12. Draw an example of a graph that is continuous.
13. Grace grouped hers as follows:
Linear: A, E, F
Nonlinear: C, G, H, I, J, K, L, M
Made up of pieces of different linear functions: B, D, N, O, P
14. Define linear in your own words.
15. Define nonlinear in your own words.

8WB5 - 97
2014 University of Utah Middle School Math Project in partnership with the
Utah State Office of Education. Licensed under Creative Commons, cc-by.
5.3c Homework: Features of Graphs
Directions: Draw a graph with the following features.
1. increasing, linear, continuous
2. Decreasing, linear, and discrete
3. Increasing then decreasing, continuous
4. Constant, discrete
5. Decreasing, then constant, then increasing,
continuous
6. Increasing and nonlinear
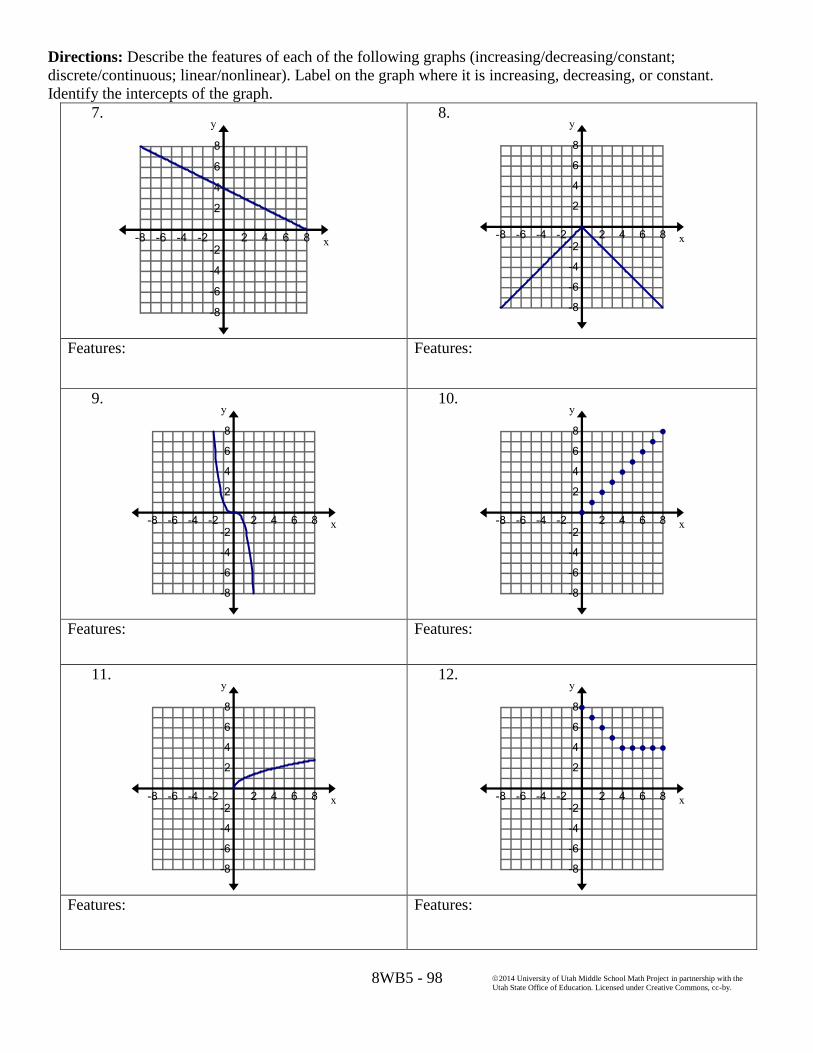
8WB5 - 98
2014 University of Utah Middle School Math Project in partnership with the
Utah State Office of Education. Licensed under Creative Commons, cc-by.
Directions: Describe the features of each of the following graphs (increasing/decreasing/constant;
discrete/continuous; linear/nonlinear). Label on the graph where it is increasing, decreasing, or constant.
Identify the intercepts of the graph.
7.
8.
Features: Features:
9.
10.
Features: Features:
11.
12.
Features: Features:

8WB5 - 99
2014 University of Utah Middle School Math Project in partnership with the
Utah State Office of Education. Licensed under Creative Commons, cc-by.
5.3d Class Activity: CBR Activity
You will be using the DIST MATCH application in the CBRTM Ranger program on the TI 73 (or other) graphing
calculators. Instructions for CBR/calculator use:
Firmly attach the TI 73 to the CBR Ranger.
Choose the APPS button on the TI 73.
Choose 2: CBL/CBR.
Choose 3: RANGER.
Choose 3: APPLICATIONS.
Choose 2: FEET.
Choose 1: DIST MATCH. Get your first graph onto the calculator screen.
1. Try to match the graph given to you in the program. You will reproduce the graph by walking. Then trace
the graph onto the grids below.
Be sure to model a few examples with your class before you begin in teams!
a. Get a graph to match ready in the calculator.
b. Decide how far away from the sensor you should stand to begin.
c. Talk through the walk that will make a graph match. (how far away to begin, walk forward or
backward, how fast to move forward or backward, how long to walk forward or backward, when to
change directions or speed, etc.)
d. You may wish to write the story of the graph first (before you walk it)—see below.
e. Have a member of your group hold the CBR so that the CBR sensor is up and directed toward the
person that is walking
f. Have a group member press start on the calculator. Then walk toward or away from the sensor trying
to make your walk match the graph on the calculator screen.
g. Each member of your group should walk to match at least one graph on the calculator.
h. Sketch each graph below. Write the story for the graph.
Graph 1:
Graph 2:
Graph 3:
Story:
Story: Story:

8WB5 - 100
2014 University of Utah Middle School Math Project in partnership with the
Utah State Office of Education. Licensed under Creative Commons, cc-by.
Graph 4:
Graph 5:
Graph 6:
Story:
Story: Story:
Extra for Experts
If you finish early try to create the following graphs, write a description/story that matches the graph.
1. A line that rises at a steady
rate.
Story:
2. A line that falls at a steady rate.
Story:
3. A horizontal line
Story:
4. A “V”
Story:
5. A “U
Story:
6. An “M”
Story:
7. Try creating an O. Are you
successful? Why or why not?
8. Name a letter you could graph
using the CBR. Name a letter
you cannot graph using the
CBR. Explain your choices.
9. Try creating this graph.
(Hint: It will take more
than one person)

8WB5 - 101
2014 University of Utah Middle School Math Project in partnership with the
Utah State Office of Education. Licensed under Creative Commons, cc-by.
5.3d Homework: Stories and Graphs
Directions: Sketch graphs to match the stories.
1. Before School
Create a graph to match the story below (distance in feet, time in minutes). (Note: This graph will show
distance traveled related to time passing—consider the student to be continually moving forward.)
Story:
A student walks through the halls before school.
He/she begins at the front door, stops to talk to at
least three different friends, stops at his/her
locker, stops in the office.
Graph
2. Birthday Cake
a. Write a story about your family eating a birthday cake. You want to talk about amount of cake eaten
related to passing time.
b. Create the graph to tell the same story. You decide on the labels.
Story:
Graph
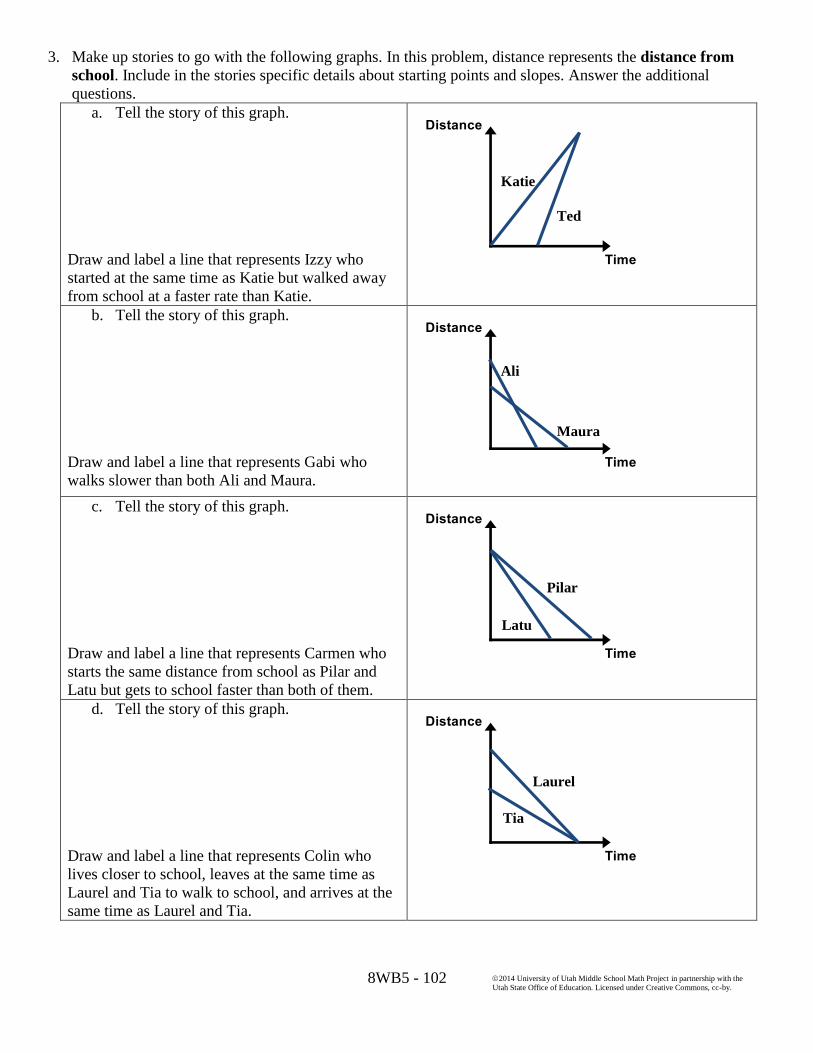
8WB5 - 102
2014 University of Utah Middle School Math Project in partnership with the
Utah State Office of Education. Licensed under Creative Commons, cc-by.
3. Make up stories to go with the following graphs. In this problem, distance represents the distance from
school. Include in the stories specific details about starting points and slopes. Answer the additional
questions.
a. Tell the story of this graph.
Draw and label a line that represents Izzy who
started at the same time as Katie but walked away
from school at a faster rate than Katie.
b. Tell the story of this graph.
Draw and label a line that represents Gabi who
walks slower than both Ali and Maura.
c. Tell the story of this graph.
Draw and label a line that represents Carmen who
starts the same distance from school as Pilar and
Latu but gets to school faster than both of them.
d. Tell the story of this graph.
Draw and label a line that represents Colin who
lives closer to school, leaves at the same time as
Laurel and Tia to walk to school, and arrives at the
same time as Laurel and Tia.
Katie
Ted
Maura
Ali
Pilar
Latu
Tia
Laurel
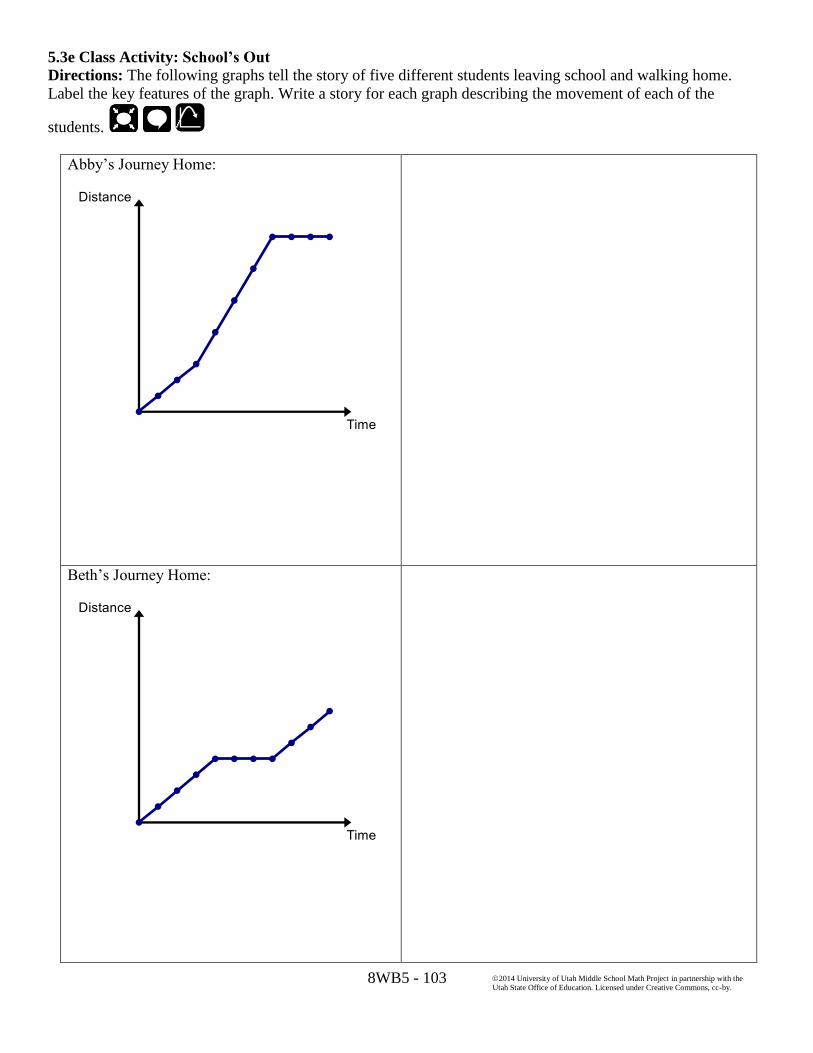
8WB5 - 103
2014 University of Utah Middle School Math Project in partnership with the
Utah State Office of Education. Licensed under Creative Commons, cc-by.
5.3e Class Activity: School’s Out
Directions: The following graphs tell the story of five different students leaving school and walking home.
Label the key features of the graph. Write a story for each graph describing the movement of each of the
students.
Abby’s Journey Home:
Beth’s Journey Home:

8WB5 - 104
2014 University of Utah Middle School Math Project in partnership with the
Utah State Office of Education. Licensed under Creative Commons, cc-by.
Chad’s Journey Home:
Drew’s Journey Home:
Eduardo’s Journey Home:
I
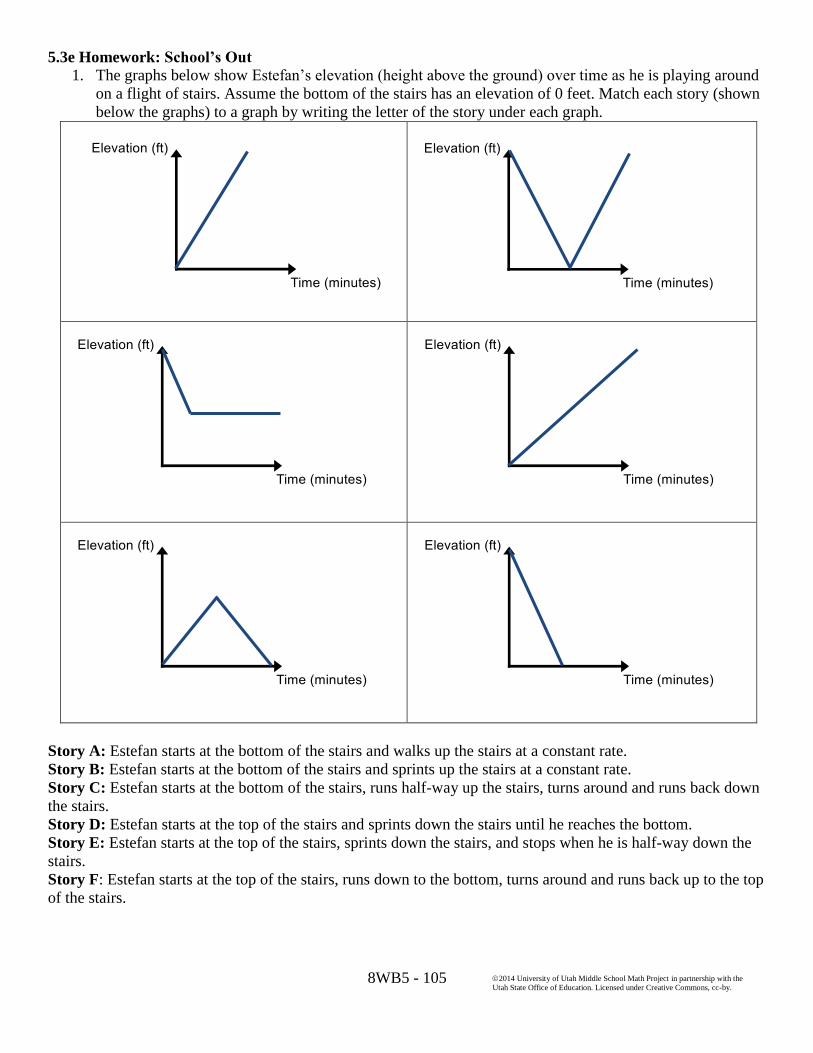
8WB5 - 105
2014 University of Utah Middle School Math Project in partnership with the
Utah State Office of Education. Licensed under Creative Commons, cc-by.
5.3e Homework: School’s Out
1. The graphs below show Estefan’s elevation (height above the ground) over time as he is playing around
on a flight of stairs. Assume the bottom of the stairs has an elevation of 0 feet. Match each story (shown
below the graphs) to a graph by writing the letter of the story under each graph.
Story A: Estefan starts at the bottom of the stairs and walks up the stairs at a constant rate.
Story B: Estefan starts at the bottom of the stairs and sprints up the stairs at a constant rate.
Story C: Estefan starts at the bottom of the stairs, runs half-way up the stairs, turns around and runs back down
the stairs.
Story D: Estefan starts at the top of the stairs and sprints down the stairs until he reaches the bottom.
Story E: Estefan starts at the top of the stairs, sprints down the stairs, and stops when he is half-way down the
stairs.
Story F: Estefan starts at the top of the stairs, runs down to the bottom, turns around and runs back up to the top
of the stairs.
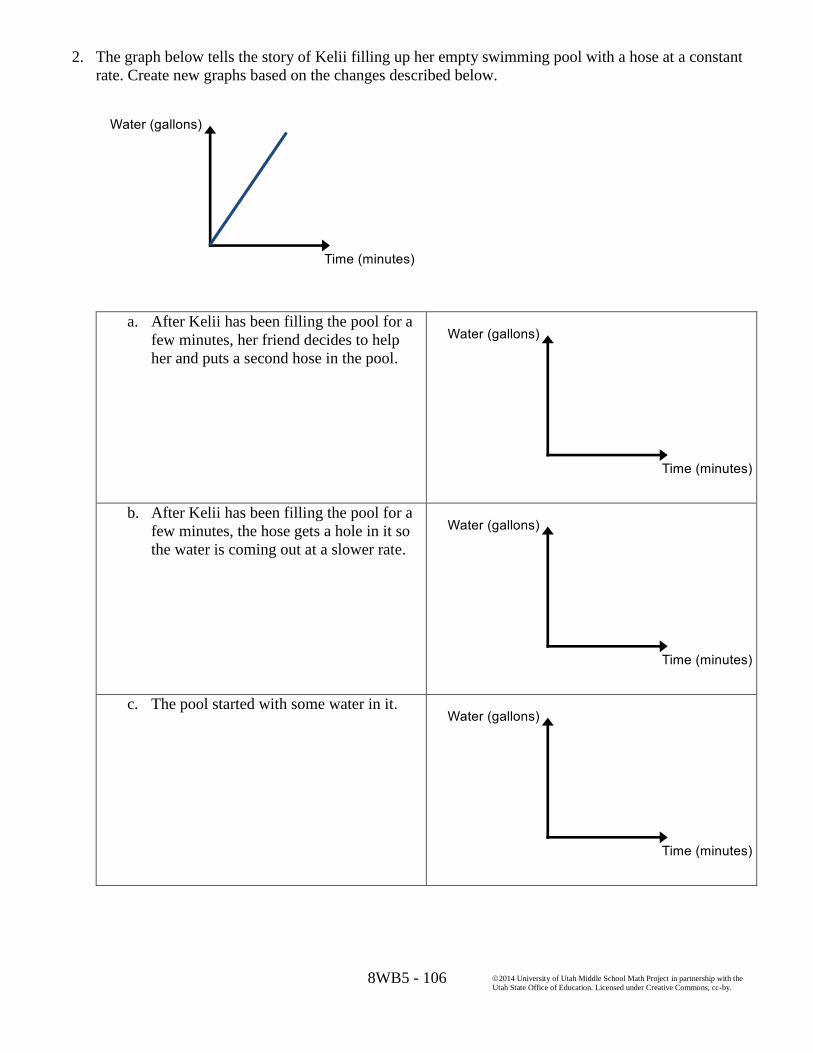
8WB5 - 106
2014 University of Utah Middle School Math Project in partnership with the
Utah State Office of Education. Licensed under Creative Commons, cc-by.
2. The graph below tells the story of Kelii filling up her empty swimming pool with a hose at a constant
rate. Create new graphs based on the changes described below.
a. After Kelii has been filling the pool for a
few minutes, her friend decides to help
her and puts a second hose in the pool.
b. After Kelii has been filling the pool for a
few minutes, the hose gets a hole in it so
the water is coming out at a slower rate.
c. The pool started with some water in it.

8WB5 - 107
2014 University of Utah Middle School Math Project in partnership with the
Utah State Office of Education. Licensed under Creative Commons, cc-by.
d. Kelii fills the pool up and realizes that
she filled it up too much so she drains
some of the water out at a constant rate.
e. Kelii fills up the pool, her brother drops
his ice cream into the pool, so she drains
the water back out at a constant rate until
the pool is empty.
f. Kelii starts filling the pool, stops to go
eat lunch, and then comes back out and
starts filling up the pool again.
g. Kelii fills the pool half-way and decides
that is enough.
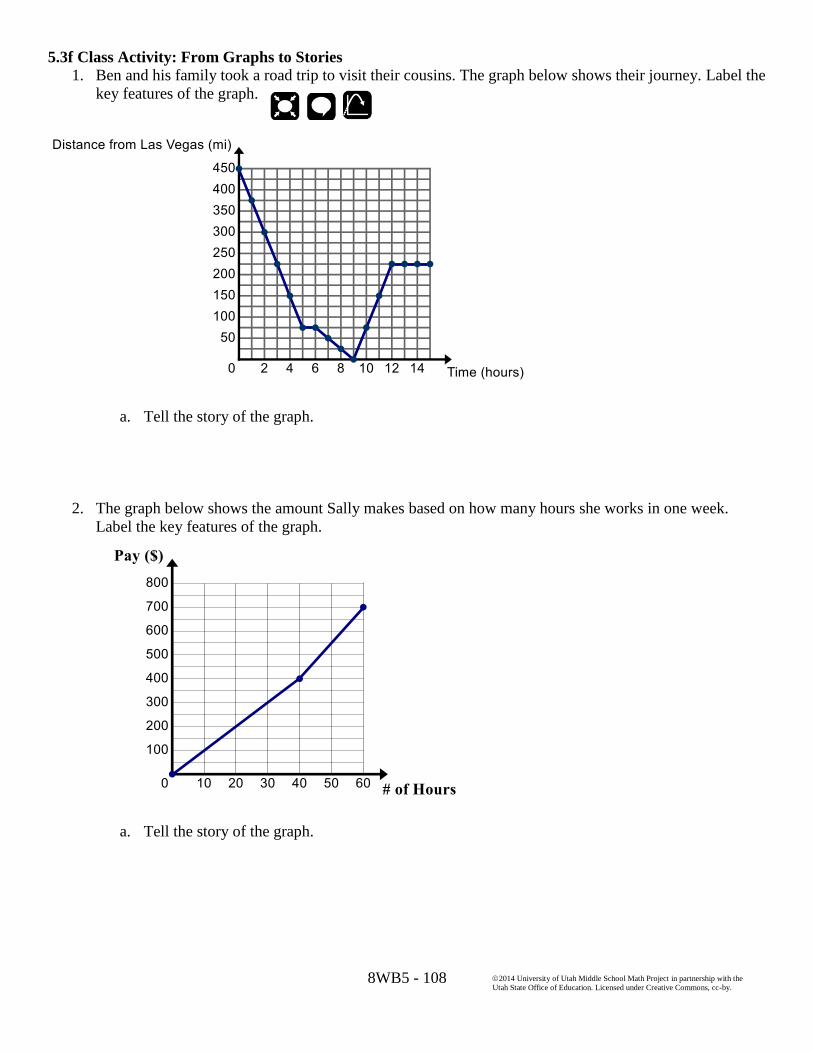
8WB5 - 108
2014 University of Utah Middle School Math Project in partnership with the
Utah State Office of Education. Licensed under Creative Commons, cc-by.
5.3f Class Activity: From Graphs to Stories
1. Ben and his family took a road trip to visit their cousins. The graph below shows their journey. Label the
key features of the graph.
a. Tell the story of the graph.
2. The graph below shows the amount Sally makes based on how many hours she works in one week.
Label the key features of the graph.
a. Tell the story of the graph.
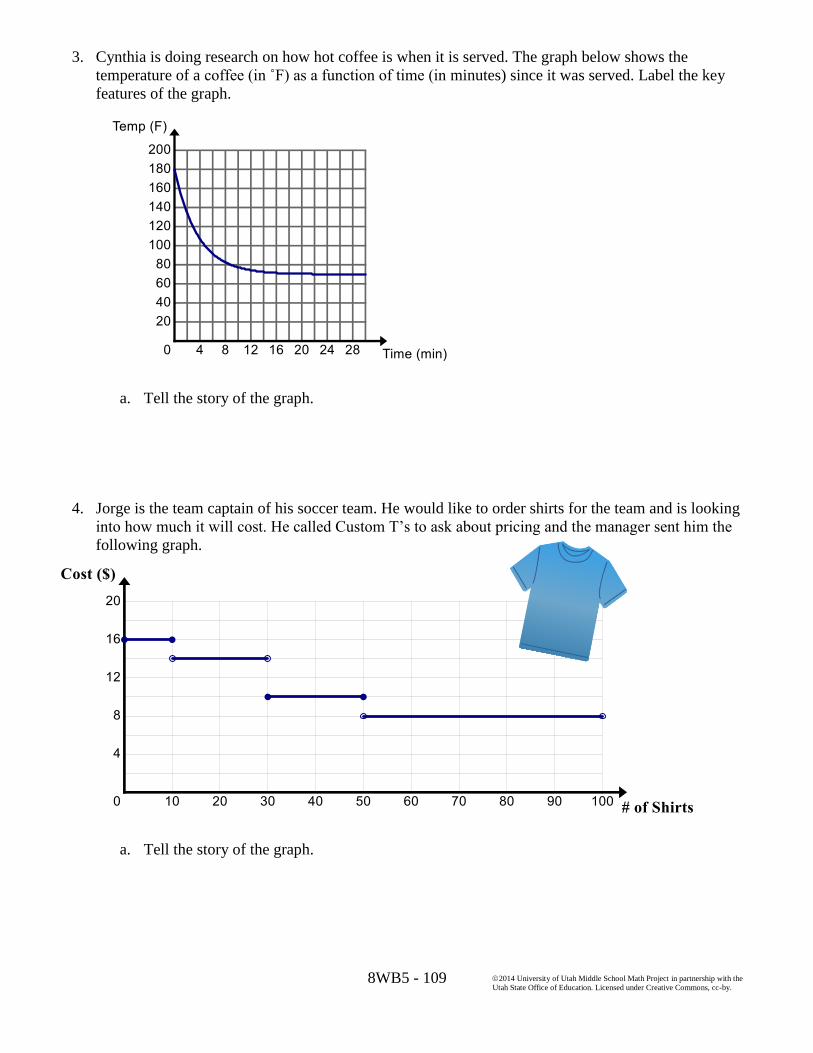
8WB5 - 109
2014 University of Utah Middle School Math Project in partnership with the
Utah State Office of Education. Licensed under Creative Commons, cc-by.
3. Cynthia is doing research on how hot coffee is when it is served. The graph below shows the
temperature of a coffee (in ˚F) as a function of time (in minutes) since it was served. Label the key
features of the graph.
a. Tell the story of the graph.
4. Jorge is the team captain of his soccer team. He would like to order shirts for the team and is looking
into how much it will cost. He called Custom T’s to ask about pricing and the manager sent him the
following graph.
a. Tell the story of the graph.

8WB5 - 110
2014 University of Utah Middle School Math Project in partnership with the
Utah State Office of Education. Licensed under Creative Commons, cc-by.
5. A boat is anchored near a dock. The graph below shows the distance from the bottom of the boat to the
sea floor over a period of time.
a. Tell the story of the graph.
6. An object is dropped from a bridge into the water below. The graph below shows the height of the object
(in feet) with respect to time (in seconds). Consider the relationship between the height of the object and
time.
a. Tell the story of the graph.

8WB5 - 111
2014 University of Utah Middle School Math Project in partnership with the
Utah State Office of Education. Licensed under Creative Commons, cc-by.
7. The graph below shows the amount of revenue a company will make selling t-shirts dependent on the
price of each t-shirt.
a. Tell the story of the graph.
8. The graph below shows the amount of gas remaining in a vehicle over time.
a. Tell the story of the graph.

8WB5 - 112
2014 University of Utah Middle School Math Project in partnership with the
Utah State Office of Education. Licensed under Creative Commons, cc-by.
5.3f Homework: From Graphs to Stories
1. Tessa is cooking potatoes for dinner. She puts some potatoes in an oven pre-heated to 200˚ F. The graph
below shows the temperature of the potatoes over time. Label the key features of the graph. The y-intercept
of the graph is (0, 20).
a. Tell the story of the graph.
2. Steve is driving to work. The graph below shows Steve’s speed over time. Label the key features of the
graph to tell the story of the speed of Steve’s car over time. Use words like accelerating, decelerating,
driving at a constant speed, stopped. You can abbreviate these words using the first letter of each word (i.e.
A for accelerating, D for decelerating, C for driving at a constant speed, S for stopped). Explain what might
be happening at the end of the graph.

8WB5 - 113
2014 University of Utah Middle School Math Project in partnership with the
Utah State Office of Education. Licensed under Creative Commons, cc-by.
3. Microsoft is releasing the most anticipated new Xbox game of the summer. The graph below shows the total
number of games sold as a function of the number of days since the game was released.
a. Tell the story of the graph.
4. A toy rocket is launched straight up in the air from the ground. It leaves the launcher with an initial velocity
of 96 ft. /sec. The graph below shows the height of the rocket in feet with respect to time in seconds. Label
the key features of the graph.
a. Tell the story of the graph.
(3, 144)
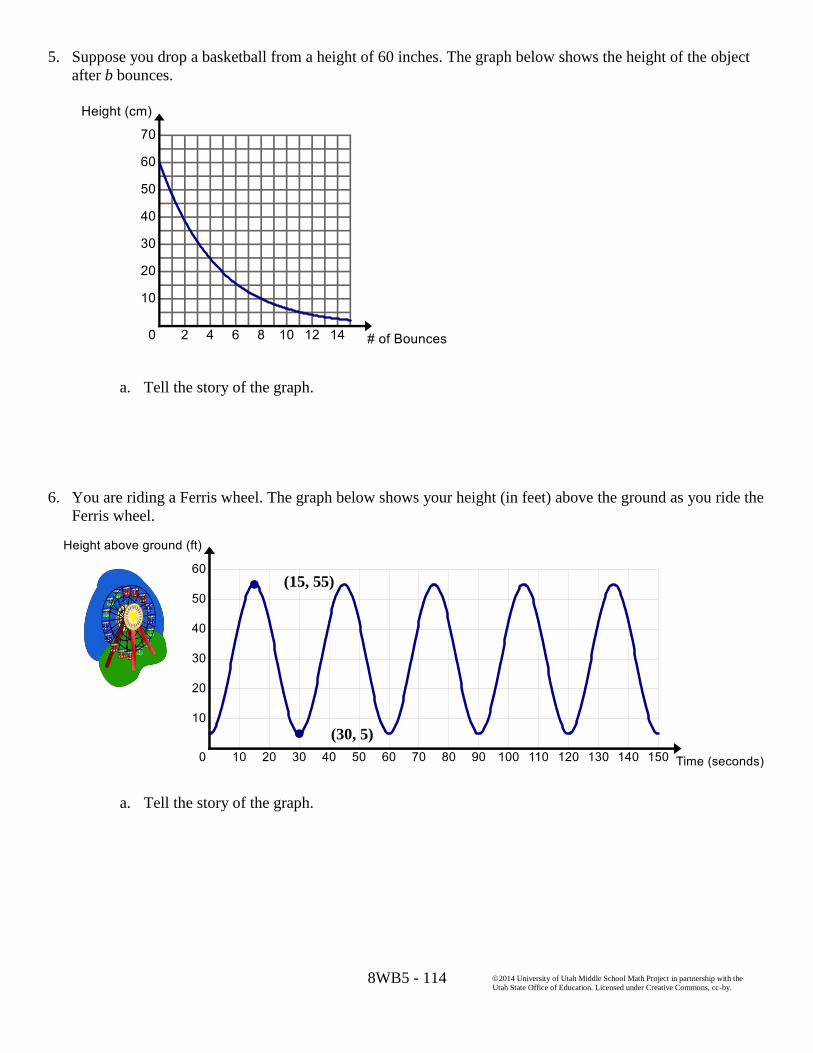
8WB5 - 114
2014 University of Utah Middle School Math Project in partnership with the
Utah State Office of Education. Licensed under Creative Commons, cc-by.
5. Suppose you drop a basketball from a height of 60 inches. The graph below shows the height of the object
after b bounces.
a. Tell the story of the graph.
6. You are riding a Ferris wheel. The graph below shows your height (in feet) above the ground as you ride the
Ferris wheel.
a. Tell the story of the graph.
(15, 55)
(30, 5)

8WB5 - 115
2014 University of Utah Middle School Math Project in partnership with the
Utah State Office of Education. Licensed under Creative Commons, cc-by.
5.3g Class Activity: From Stories to Graphs
Directions: Sketch a graph to match each of the following stories. Label key features of your graph.
Story Graph
1. Zach walks home from school each day.
Sketch a graph of Zach’s distance from
school as a function of time since the bell
rang if the following happens: When the
bell rings, Zach runs to his locker to grab
his books and starts walking home. When
he is about halfway home, he realizes that
he forgot his math book so he turns
around and runs back to school. After
retrieving his math book, he realizes that
he is going to be late so he sprints home.
2. Solitude is offering a ski clinic for teens.
The cost of the class is $30 per student. A
minimum of 5 students must sign up in
order for Solitude to hold the class. The
maximum number of students that can
participate in the class is 12. Sketch a
graph that shows the revenue Solitude will
bring in dependent on the number of
students that take the class.
3. A biker is riding up a hill at a constant
speed. Then he hits a downhill and coasts
down the hill, picking up speed as he
descends. At the bottom of the hill, he
gets a flat tire. Sketch a graph that shows
the distance traveled by the biker as a
function of time.

8WB5 - 116
2014 University of Utah Middle School Math Project in partnership with the
Utah State Office of Education. Licensed under Creative Commons, cc-by.
4. A concert for a popular rock group is sold out. The arena holds 8,000 people. The rock group is scheduled to
take the stage at 8 pm. A band that is not very well known is opening for the rock band at 6:30 pm. The rock
band is scheduled to play for 2 hours and the staff working the concert have been told that the arena must be
cleared of people by 11:30 pm. Sketch a graph of the number of people in the arena from 5 pm to midnight.
Time 0 on the grid below is 5 pm.
5. A parking garage charges $5 per hour and has a maximum cost of $40 for 12 hours. Sketch a graph of the
total cost depending on how many hours a car is in the garage.

8WB5 - 117
2014 University of Utah Middle School Math Project in partnership with the
Utah State Office of Education. Licensed under Creative Commons, cc-by.
6. Your science teacher has the beakers shown below. He is going to fill them with water from a faucet that
runs at a constant rate. Your job is to sketch a graph of the height of the water in each of the beakers over
time.
Beaker Graph of the height of the water over time
Beaker 1
Beaker 2
Beaker 3

8WB5 - 118
2014 University of Utah Middle School Math Project in partnership with the
Utah State Office of Education. Licensed under Creative Commons, cc-by.
7. Now consider the volume of the water in each of the beakers over time. Sketch a graph of the volume of the
water in each of the beakers over time.
Beaker 4
Beaker 5
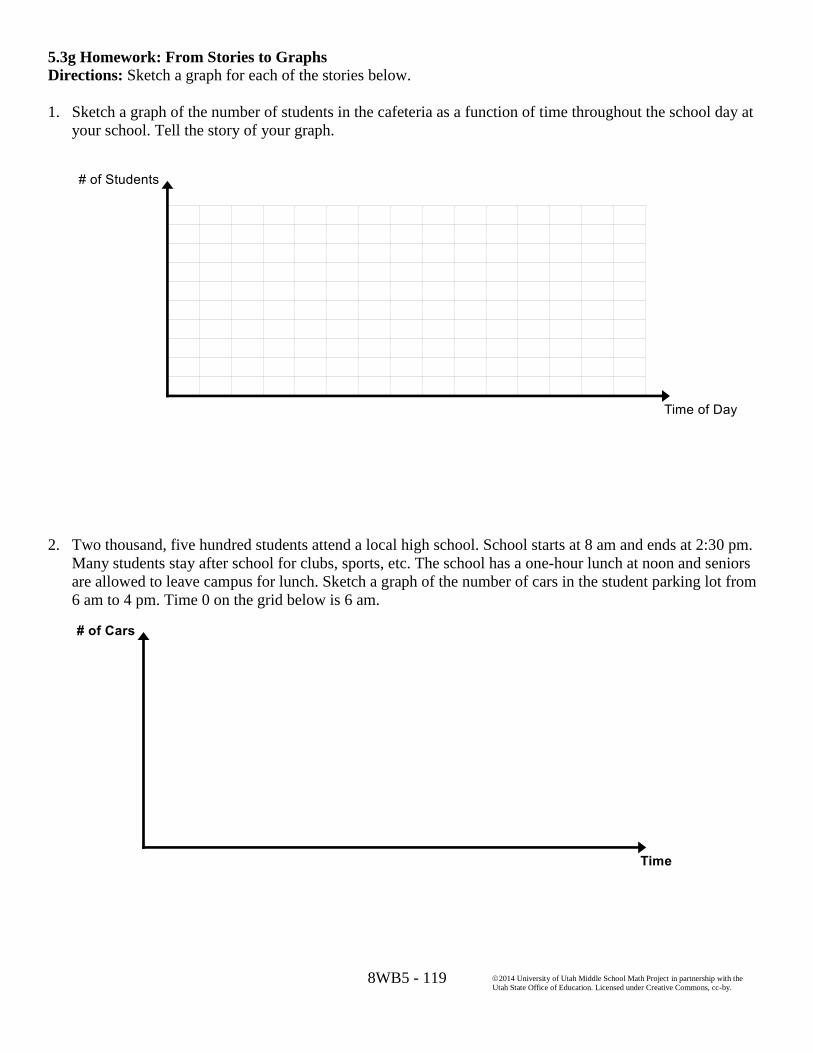
8WB5 - 119
2014 University of Utah Middle School Math Project in partnership with the
Utah State Office of Education. Licensed under Creative Commons, cc-by.
5.3g Homework: From Stories to Graphs
Directions: Sketch a graph for each of the stories below.
1. Sketch a graph of the number of students in the cafeteria as a function of time throughout the school day at
your school. Tell the story of your graph.
2. Two thousand, five hundred students attend a local high school. School starts at 8 am and ends at 2:30 pm.
Many students stay after school for clubs, sports, etc. The school has a one-hour lunch at noon and seniors
are allowed to leave campus for lunch. Sketch a graph of the number of cars in the student parking lot from
6 am to 4 pm. Time 0 on the grid below is 6 am.

8WB5 - 120
2014 University of Utah Middle School Math Project in partnership with the
Utah State Office of Education. Licensed under Creative Commons, cc-by.
3. A train that takes passengers from downtown back home to the suburbs makes 5 stops. The maximum speed
at which the train can travel is 40 mph. Sketch a graph of the speed of the train a function of time since
leaving the downtown train station.
4. Sketch the graph of the total number of people that have seen the hit movie of the summer as a function of
the time since opening day of the movie.
5. A little girl is going around on a merry-go-round. Her mom is standing at the entrance to the ride. Sketch a
graph of the distance the little girl is from her mom as she goes around if the minimum distance she is from
her mom during the ride is 5 feet and the maximum distance she is from her mom is 45 feet. Assume it takes
16 seconds to make one full revolution on the merry-go-round.
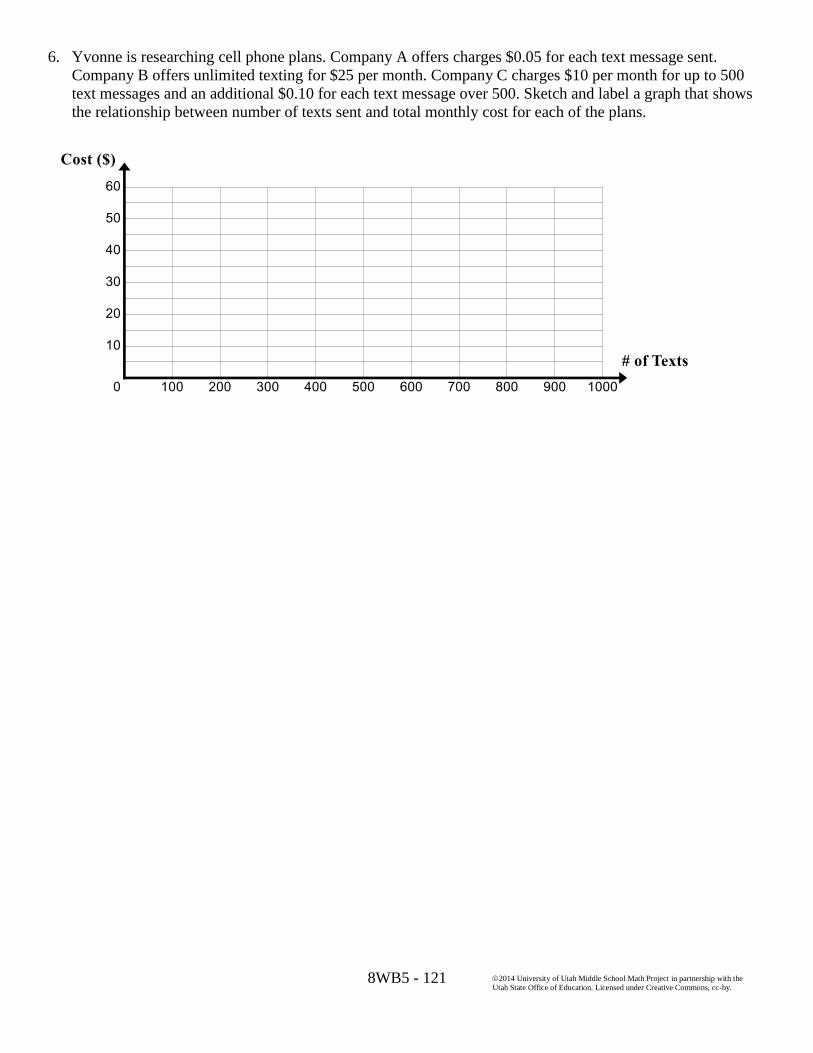
8WB5 - 121
2014 University of Utah Middle School Math Project in partnership with the
Utah State Office of Education. Licensed under Creative Commons, cc-by.
6. Yvonne is researching cell phone plans. Company A offers charges $0.05 for each text message sent.
Company B offers unlimited texting for $25 per month. Company C charges $10 per month for up to 500
text messages and an additional $0.10 for each text message over 500. Sketch and label a graph that shows
the relationship between number of texts sent and total monthly cost for each of the plans.
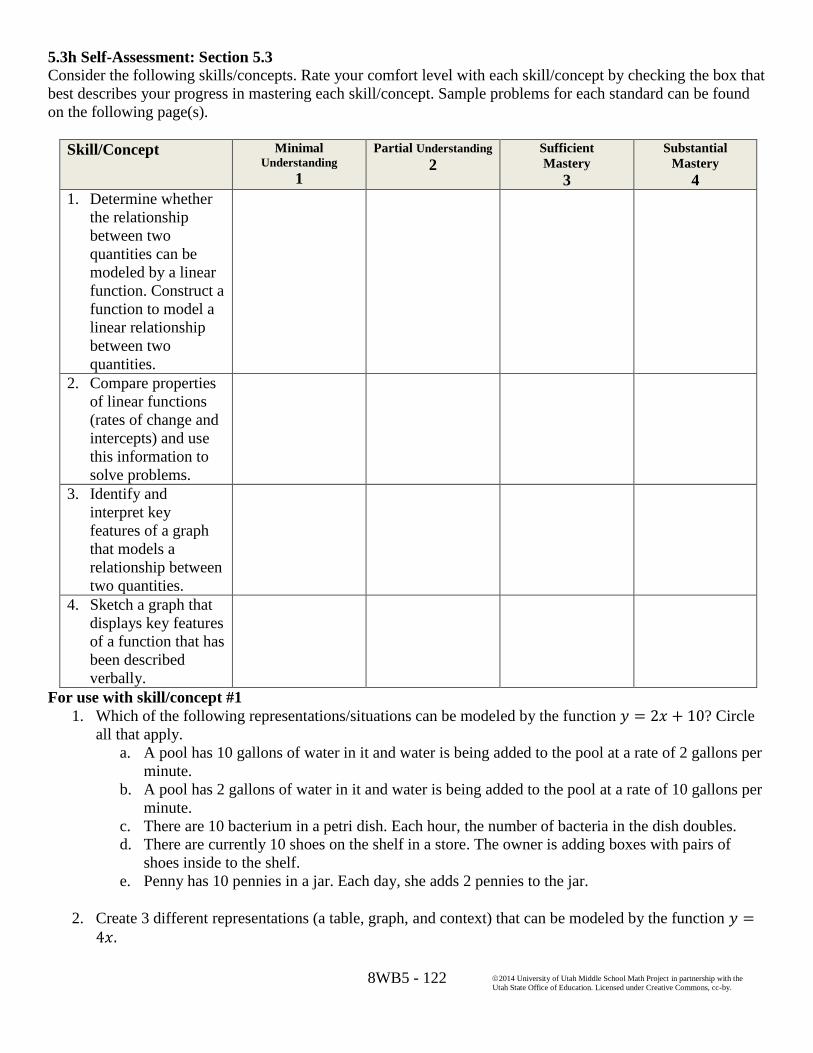
8WB5 - 122
2014 University of Utah Middle School Math Project in partnership with the
Utah State Office of Education. Licensed under Creative Commons, cc-by.
5.3h Self-Assessment: Section 5.3
Consider the following skills/concepts. Rate your comfort level with each skill/concept by checking the box that
best describes your progress in mastering each skill/concept. Sample problems for each standard can be found
on the following page(s).
Skill/Concept
Minimal Understanding
1
Partial Understanding
2 Sufficient
Mastery
3
Substantial
Mastery
4
1. Determine whether
the relationship
between two
quantities can be
modeled by a linear
function. Construct a
function to model a
linear relationship
between two
quantities.
2. Compare properties
of linear functions
(rates of change and
intercepts) and use
this information to
solve problems.
3. Identify and
interpret key
features of a graph
that models a
relationship between
two quantities.
4. Sketch a graph that
displays key features
of a function that has
been described
verbally.
For use with skill/concept #1
1. Which of the following representations/situations can be modeled by the function 𝑦 = 2𝑥 + 10? Circle
all that apply.
a. A pool has 10 gallons of water in it and water is being added to the pool at a rate of 2 gallons per
minute.
b. A pool has 2 gallons of water in it and water is being added to the pool at a rate of 10 gallons per
minute.
c. There are 10 bacterium in a petri dish. Each hour, the number of bacteria in the dish doubles.
d. There are currently 10 shoes on the shelf in a store. The owner is adding boxes with pairs of
shoes inside to the shelf.
e. Penny has 10 pennies in a jar. Each day, she adds 2 pennies to the jar.
2. Create 3 different representations (a table, graph, and context) that can be modeled by the function 𝑦 =4𝑥.

8WB5 - 123
2014 University of Utah Middle School Math Project in partnership with the
Utah State Office of Education. Licensed under Creative Commons, cc-by.
3. Circle the letter of the representations that can be modeled by a linear function. Construct a linear
function for those that are linear.
a.
b. The cost of a frozen yogurt at Callie’s Custard Shop is $4.50. Each additional topping is $0.25.
c. The graph below shows the total cost dependent on the number of rides taken.
d. Nick receives a 3% raise every year.
e. A plane starts is descent from an elevation of 35,000 feet. The table below shows the elevation of
the plane as it is descending.
Radius
(in)
Area
(in2)
1 3.14
2 12.56
3 28.26
4 50.24
5 78.50
Time
(min.)
Elevation
(ft.)
0 35,000
3 27,500
5 22,500
6 20,000
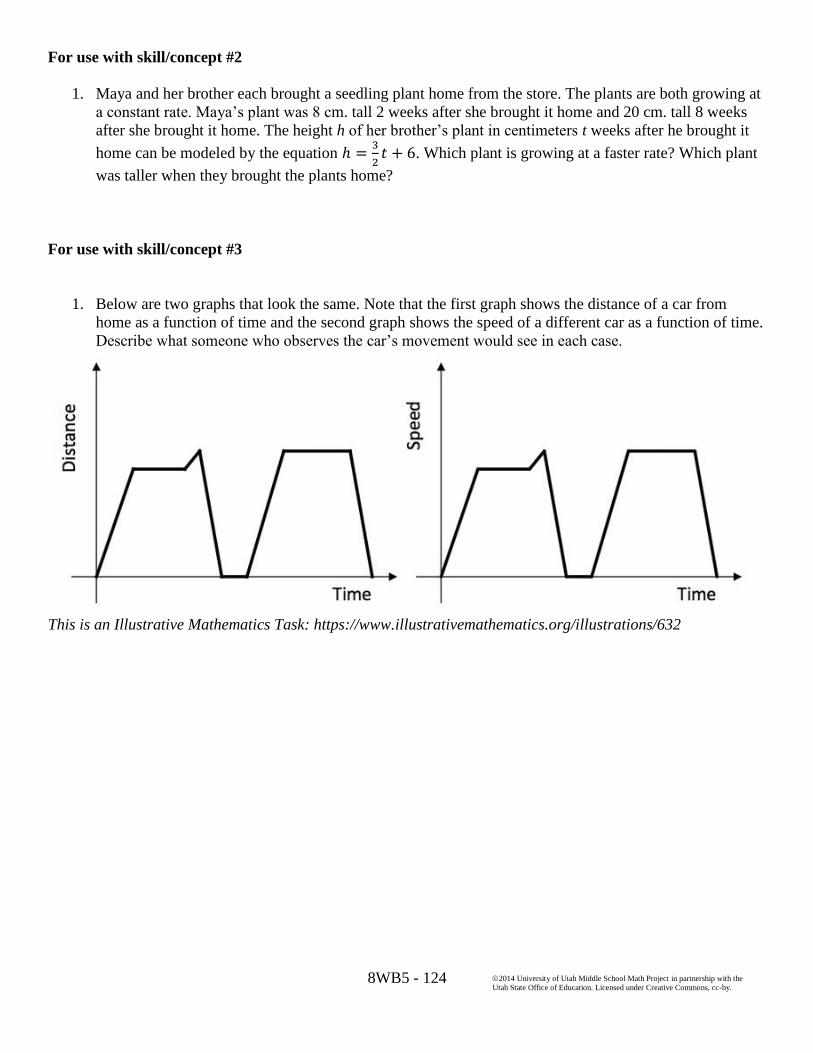
8WB5 - 124
2014 University of Utah Middle School Math Project in partnership with the
Utah State Office of Education. Licensed under Creative Commons, cc-by.
For use with skill/concept #2
1. Maya and her brother each brought a seedling plant home from the store. The plants are both growing at
a constant rate. Maya’s plant was 8 cm. tall 2 weeks after she brought it home and 20 cm. tall 8 weeks
after she brought it home. The height h of her brother’s plant in centimeters t weeks after he brought it
home can be modeled by the equation ℎ =3
2𝑡 + 6. Which plant is growing at a faster rate? Which plant
was taller when they brought the plants home?
For use with skill/concept #3
1. Below are two graphs that look the same. Note that the first graph shows the distance of a car from
home as a function of time and the second graph shows the speed of a different car as a function of time.
Describe what someone who observes the car’s movement would see in each case.
This is an Illustrative Mathematics Task: https://www.illustrativemathematics.org/illustrations/632

8WB5 - 125
2014 University of Utah Middle School Math Project in partnership with the
Utah State Office of Education. Licensed under Creative Commons, cc-by.
2. Antonio and Juan are in a 4-mile bike race. The graph below shows the distance of each racer (in
miles) as a function of time (in minutes).
a. Who wins the race? How do you know?
b. Imagine you were watching the race and had to announce it over the radio. Write a little story
describing the race.
This is an Illustrative Mathematics Task: https://www.illustrativemathematics.org/illustrations/633
For use with skill/concept #4
1. It will take Rick 24 hours to paint a fence in his backyard. Rick is trying to get some friends to help
him paint the fence. Sketch a graph of the amount of time it will take to paint the fence dependent on
how many friends Rick gets to help.
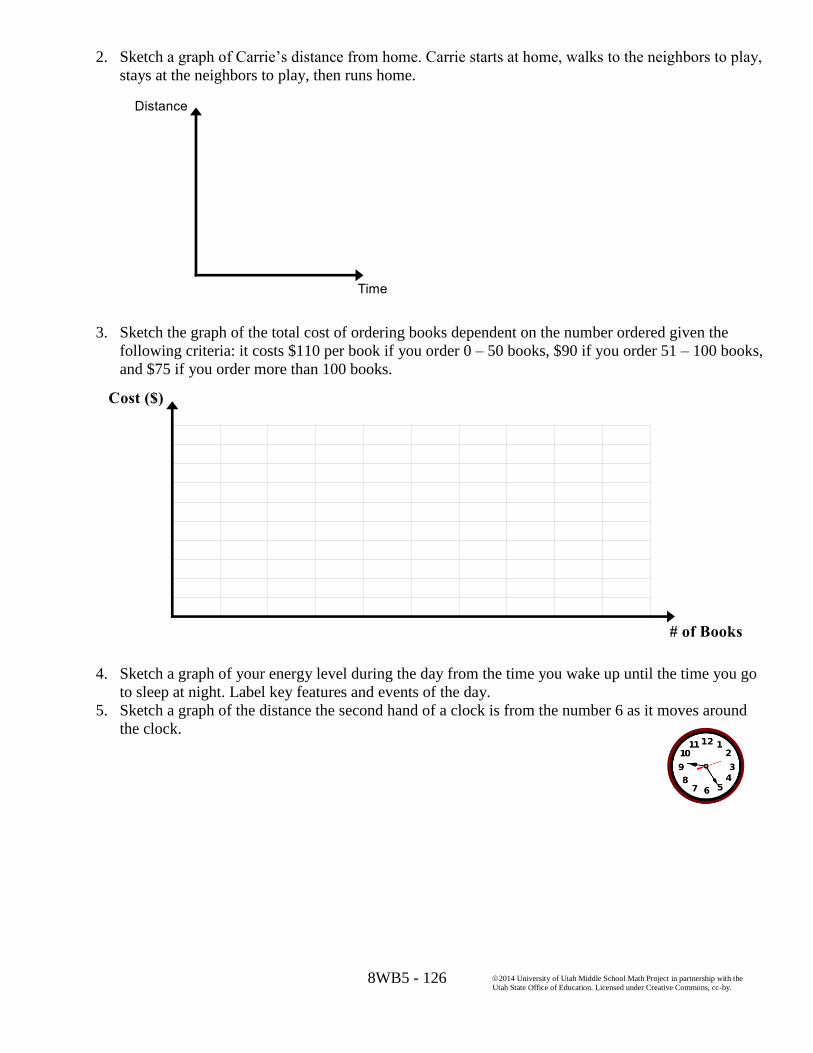
8WB5 - 126
2014 University of Utah Middle School Math Project in partnership with the
Utah State Office of Education. Licensed under Creative Commons, cc-by.
2. Sketch a graph of Carrie’s distance from home. Carrie starts at home, walks to the neighbors to play,
stays at the neighbors to play, then runs home.
3. Sketch the graph of the total cost of ordering books dependent on the number ordered given the
following criteria: it costs $110 per book if you order 0 – 50 books, $90 if you order 51 – 100 books,
and $75 if you order more than 100 books.
4. Sketch a graph of your energy level during the day from the time you wake up until the time you go
to sleep at night. Label key features and events of the day.
5. Sketch a graph of the distance the second hand of a clock is from the number 6 as it moves around
the clock.