grade guidelines 17
TRANSCRIPT

The University of Manchester Research
GRADE guidelines 17
DOI:10.1016/j.jclinepi.2017.05.005
Document VersionAccepted author manuscript
Link to publication record in Manchester Research Explorer
Citation for published version (APA):Guyatt, G. H., Ebrahim, S., Alonso-Coello, P., Johnston, B. C., Mathioudakis, A. G., Briel, M., Mustafa, R. A., Sun,X., Walter, S. D., Heels-Ansdell, D., Neumann, I., Kahale, L. A., Iorio, A., Meerpohl, J., Schünemann, H. J., & Akl,E. A. (2017). GRADE guidelines 17: Assessing the risk of bias associated with missing participant outcome data ina body of evidence. Journal of Clinical Epidemiology. https://doi.org/10.1016/j.jclinepi.2017.05.005Published in:Journal of Clinical Epidemiology
Citing this paperPlease note that where the full-text provided on Manchester Research Explorer is the Author Accepted Manuscriptor Proof version this may differ from the final Published version. If citing, it is advised that you check and use thepublisher's definitive version.
General rightsCopyright and moral rights for the publications made accessible in the Research Explorer are retained by theauthors and/or other copyright owners and it is a condition of accessing publications that users recognise andabide by the legal requirements associated with these rights.
Takedown policyIf you believe that this document breaches copyright please refer to the University of Manchester’s TakedownProcedures [http://man.ac.uk/04Y6Bo] or contact [email protected] providingrelevant details, so we can investigate your claim.
Download date:23. Mar. 2022

Accepted Manuscript
GRADE guidelines 17: Assessing the Risk of Bias Associated with Missing ParticipantOutcome Data in a body of evidence
Gordon H. Guyatt, Shanil Ebrahim, Pablo Alonso-Coello, Bradley C. Johnston,Alexander G. Mathioudakis, Matthias Briel, Reem A. Mustafa, Xin Sun, Stephen D.Walter, Diane Heels-Ansdell, Ignacio Neumann, Lara A. Kahale, Alfonso Iorio, JoergMeerpohl, Holger J. Schünemann, Elie A. Akl
PII: S0895-4356(16)30811-3
DOI: 10.1016/j.jclinepi.2017.05.005
Reference: JCE 9399
To appear in: Journal of Clinical Epidemiology
Received Date: 12 December 2016
Revised Date: 17 April 2017
Accepted Date: 2 May 2017
Please cite this article as: Guyatt GH, Ebrahim S, Alonso-Coello P, Johnston BC, Mathioudakis AG,Briel M, Mustafa RA, Sun X, Walter SD, Heels-Ansdell D, Neumann I, Kahale LA, Iorio A, Meerpohl J,Schünemann HJ, Akl EA, GRADE guidelines 17: Assessing the Risk of Bias Associated with MissingParticipant Outcome Data in a body of evidence, Journal of Clinical Epidemiology (2017), doi: 10.1016/j.jclinepi.2017.05.005.
This is a PDF file of an unedited manuscript that has been accepted for publication. As a service toour customers we are providing this early version of the manuscript. The manuscript will undergocopyediting, typesetting, and review of the resulting proof before it is published in its final form. Pleasenote that during the production process errors may be discovered which could affect the content, and alllegal disclaimers that apply to the journal pertain.

MANUSCRIP
T
ACCEPTED
ACCEPTED MANUSCRIPT
1
GRADE guidelines 17: Assessing the Risk of Bias Associated with Missing
Participant Outcome Data in a body of evidence
Gordon H Guyatt 1,2
Shanil Ebrahim 1,3
Pablo Alonso-Coello 1,4
Bradley C Johnston 1,3,5,6
Alexander G Mathioudakis 4
Matthias Briel 1,7
Reem A Mustafa 1,8
Xin Sun 9
Stephen D Walter 1
Diane Heels-Ansdell 1
Ignacio Neumann 10
Lara A Kahale 11
Alfonso Iorio 1,2
Joerg Meerpohl 12,13
Holger J Schünemann 1,2,
Elie A Akl1,11*

MANUSCRIP
T
ACCEPTED
ACCEPTED MANUSCRIPT
2
1 Department of Health Research Methods, Evidence and Impact, McMaster University,
1200 Main St. West, Hamilton, Canada, L8S 4K1;
2 Department of Medicine, McMaster University, 1200 Main St. West, Hamilton,
Canada, L8S 4K1;
3 Systematic Overviews through advancing Research Technology (SORT), Child Health
Evaluative Sciences, The Hospital for Sick Children Research Institute, Toronto, Ontario,
Canada;
4 Iberoamerican Cochrane Centre, CIBERESP-IIB Sant Pau, Barcelona, Spain
5 Department of Anesthesia and Pain Medicine, The Hospital for Sick Children,
University of Toronto, Toronto, Ontario, Canada;
6 Institute for Health Policy, Management and Evaluation, Dalla Lana School of Public
Health, University of Toronto, Toronto, Ontario, Canada
7 Basel Institute for Clinical Epidemiology and Biostatistics, Department of Clinical
Research, University Hospital Basel, Basel, Switzerland;
8 Department of Internal Medicine, Kansas University Medical Center, 3901 Rainbow
Blvd, MS3002, Kansas City, KS, USA;
9 Chinese Evidence-based Medicine Center, West China Hospital, Sichuan University,
Chengdu, 610041, China;
10 Department of Internal Medicine, Pontificia Universidad Catolica de Chile, Santiago,
Chile;
11 Department of Internal Medicine, American University of Beirut, Riad-El-Solh Beirut
1107 2020, Beirut, Lebanon;
12 Cochrane Germany, Medical Center - University of Freiburg, Breisacher Strasse 153, 79110 Freiburg, Germany

MANUSCRIP
T
ACCEPTED
ACCEPTED MANUSCRIPT
3
13 Centre de Recherche Épidémiologie et Statistique Sorbonne Paris Cité – U1153, Inserm
/ Université Paris Descartes, Cochrane France, Hôpital Hôtel-Dieu, 1 place du Parvis
Notre Dame, 75181 Paris Cedex 04, France
* Corresponding author. Department of Internal Medicine, Clinical Epidemiology Unit,
American University of Beirut Medical Center, P.O. Box: 11-0236, Riad-El-Solh Beirut
1107, 2020 Beirut, Lebanon. Email: [email protected]
“The Corresponding Author has the right to grant on behalf of all authors and does grant
on behalf of all authors, a worldwide licence to the Publishers and its licensees in
perpetuity, in all forms, formats and media (whether known now or created in the future),
to i) publish, reproduce, distribute, display and store the Contribution, ii) translate the
Contribution into other languages, create adaptations, reprints, include within collections
and create summaries, extracts and/or, abstracts of the Contribution, iii) create any other
derivative work(s) based on the Contribution, iv) to exploit all subsidiary rights in the
Contribution, v) the inclusion of electronic links from the Contribution to third party
material where-ever it may be located; and, vi) licence any third party to do any or all of
the above.”

MANUSCRIP
T
ACCEPTED
ACCEPTED MANUSCRIPT
4
Gordon H Guyatt: [email protected]
Shanil Ebrahim: [email protected]
Pablo Alonso-Coello: [email protected]
Bradley C Johnston: [email protected]
Alexander G Mathioudakis: [email protected]
Matthias Briel: [email protected]
Reem A Mustafa: [email protected]
Xin Sun: [email protected]
Stephen D Walter: [email protected]
Diane Heels-Ansdell: [email protected]
Ignacio Neumann: [email protected]
Lara A Kahale: [email protected]
Alfonso Iorio: [email protected]
Joerg Meerpohl: [email protected]
Holger J Schünemann: [email protected]
Elie A Akl: [email protected]
Conflict of interest
All authors have completed the ICMJE uniform disclosure form and declare: no support
from any organisation for the submitted work; no financial relationships with any
organisations that might have an interest in the submitted work in the previous three

MANUSCRIP
T
ACCEPTED
ACCEPTED MANUSCRIPT
5
years. They declare being involved in previous publications making recommendations on
the topic missing participant outcome data.
Funding
This paper is part of a project on addressing missing trial participant data in systematic
reviews funded by the Cochrane Collaboration. PA-C was funded by a Miguel Servet
research contract from the Instituto de Salud Carlos III (CP16/00137). AGM was funded
by a Fellowship in Guidelines Methodology by European Respiratory Society (MTF
2015 - 01). The funders were not involved in study design and the collection, analysis,
and interpretation of data and the writing of the article and the decision to submit it for
publication. The researchers are independent from funders and had full access to all the
data.
Contribution of authors
GG, SE, PAC, BCJ, RAM, SDW, and EA contributed to the conception and design of the
paper.
GG, SE PAC, BCJ, AGM, MB, RAM, XS, SDW, DHA, IN, LAK, AI, JJM, HJS and
EAA contributed to the analysis and interpretation of the data.
SDW and DHA contributed to the statistical expertise.
GG contributed to drafting of the article.
GG, SE PAC, BCJ, AGM, MB, RAM, XS, SDW, DHA, IN, LAK, AI, JJM, HJS and
EAA contributed to the critical revision of the article for important intellectual content.

MANUSCRIP
T
ACCEPTED
ACCEPTED MANUSCRIPT
6
GG, SE PAC, BCJ, AGM, MB, RAM, XS, SDW, DHA, IN, LAK, AI, JJM, HJS and
EAA contributed to the final approval of the article.

MANUSCRIP
T
ACCEPTED
ACCEPTED MANUSCRIPT
7
Abstract
Objective: To provide GRADE guidance for assessing risk of bias across an entire body
of evidence consequent on missing data for systematic reviews of both binary and
continuous outcomes.
Study design: Systematic survey of published methodological research, iterative
discussions, testing in systematic reviews, and feedback from the GRADE Working
Group.
Results: Approaches begin with a primary meta-analysis using a complete case analysis
followed by sensitivity meta-analyses imputing, in each study, data for those with
missing data, and then pooling across studies. For binary outcomes we suggest use of
“plausible worst case” in which review authors assume that those with missing data in
treatment arms have proportionally higher event rates than those followed successfully.
For continuous outcomes, imputed mean values come from other studies within the
systematic review, and the standard deviation from the median standard deviations of the
control arms of all studies.
Conclusions: If the results of the primary meta-analysis are robust to the most extreme
assumptions viewed as plausible, one does not rate down certainty in the evidence for
risk of bias due to missing participant outcome data. If the results prove not robust to
plausible assumptions, one would rate down certainty in the evidence for risk of bias.
Keywords:
GRADE, missing participant data, risk of bias, systematic reviews, trials

MANUSCRIP
T
ACCEPTED
ACCEPTED MANUSCRIPT
8
Running title:
GRADE approach to assess risk of bias associated with missing participant data in
systematic reviews
Word count:
4,419
What’s new?
Key points:
• When assessing risk of bias associated with participant outcome data across an
entire body of evidence, we propose using a complete case analysis for the
primary meta-analysis.
• When the results of the primary meta-analysis suggest a statistically significant
treatment effect, conduct sensitivity meta-analyses using plausible assumptions to
impute events in participants with missing outcome data in each study, and then
pool across studies.
• If the results of the primary meta-analysis are robust to the most extreme plausible
assumptions, one does not rate down certainty in the evidence for risk of bias due
to missing participant outcome data.
• If the results are not robust to plausible assumptions, one would rate down
certainty in the evidence for risk of bias.

MANUSCRIP
T
ACCEPTED
ACCEPTED MANUSCRIPT
10
Introduction
The extent to which risk of bias associated with missing participant outcome data
(hereafter, missing data) reduces confidence in results represents a key issue for all
systematic reviews 1 2. Currently, the Cochrane Collaboration Handbook3 focuses on
determining whether individual studies are at low or high risk of bias with respect to
missing data. When considering whether to rate down for risk of bias across an entire
body of evidence, this approach suffers limitations. Assume, for instance, that one sets a
threshold of 10% missing data for high risk of bias, and of 6 studies in a meta-analysis 3
have no missing data and 3 have 12% missing data. How is one to decide whether,
across the entire body of evidence, one should – or should not – rate down for risk of bias
due to missing participant data?
Sensitivity meta-analyses based on different assumptions can address these issues,
particularly if such analyses consider issues beyond simply the frequency of missing data,
such as the event rate in the intervention and control groups, the distribution of missing
data in intervention and control groups, and the reasons for missingness. The Cochrane
Handbook encourages such analyses, but with respect to missing data does not provide
specific guidance regarding how to proceed.
Three prior publications have filled this gap by presenting approaches for systematic
reviews of randomized trials to address missing data for binary4 and continuous
outcomes5 6. With some modifications, the GRADE Working Group has endorsed these
approaches as GRADE guidance to assess the risk of bias associated with missing data in

MANUSCRIP
T
ACCEPTED
ACCEPTED MANUSCRIPT
11
systematic reviews. In this article, we summarize our modified approaches, providing
sufficient detail for their application, and provide several illustrative examples.
We present approaches for three situations: binary outcomes; continuous outcomes in
which all studies have used the same instruments; and continuous outcomes in which
studies have used different instruments to measure the same construct. In each case, the
goal is to make inferences for the entire body of evidence for a particular outcome with
respect to risk of bias. Within the GRADE framework, the issue is whether reviewers
should rate down certainty in the evidence (quality of evidence, or confidence in
evidence) for risk of bias due to missing data.
Development of methods
In developing our approaches, we formed a group consisting of clinical epidemiologists,
methodologists, and biostatisticians, all with extensive experience in systematic reviews.
We conducted a systematic survey of the literature addressing possible approaches to
handling missing data when conducting a meta-analysis7-9. Iterative discussions among
the investigators and testing our approaches in a number of systematic reviews completed
the process.
The GRADE Working Group reviewed the approaches at a meeting in Vienna in October
2015, providing feedback that led to modifications from what had been previously
published. The Working Group reviewed the resulting modifications, and a draft of this

MANUSCRIP
T
ACCEPTED
ACCEPTED MANUSCRIPT
12
paper, at a subsequent meeting in May 2016 and there approved the approaches as
GRADE guidance.
Scope and definitions
This guide is for meta-analyses of trial-level data and does not address methods for meta-
analyses of individual participant data that may be available to investigators. We deal
only with missing data, and not other elements of risk of bias in a body of evidence (e.g.,
allocation concealment, blinding) that systematic review authors must address.
We define participant outcome data as ‘missing’ if it is unavailable to the reviewers; i.e.,
unavailable to investigators of the primary studies, or available to the primary study
investigators but not included in published reports and not provided after inquiry. A
common problem when dealing with missing data is identifying whether a group of
participants (e.g., those who withdrew consent or violated the protocol) have missing data
or not.10-12 Another problem is that the trial authors are sometimes not clear about how
they dealt with participants missing data in their analysis (e.g., excluded them, or made
assumptions).10 13 Prior to applying our approach, we recommend making all possible
efforts to obtain unreported but potentially available outcome data from primary study
authors, or at least understand how they dealt with missing data.
For conceptual clarity, we distinguish the issue of handling of missing participant
outcome data from that of intention to treat (ITT) analysis 14 The basic principle of ITT
involves analyzing participants with available data in the arm to which they were

MANUSCRIP
T
ACCEPTED
ACCEPTED MANUSCRIPT
13
randomized. A methodological survey found a large variation in the definition of ITT:
some suggest ITT is only possible with complete follow-up; some demand imputation of
missing data for an ITT analysis; and some take our position that ITT should be restricted
to how one handles participants with available data, and that dealing with missing data
should be treated as a separate issue. 7 Thus, what follows begins with a complete case
analysis, and deals with missing data as a separate issue best addressed in sensitivity
analyses.
Common Elements of the Approaches
We recommend, as do other authors who have written about the issue of missing data in
the context of meta-analyses, that systematic review authors’ primary analysis include
only those for whom data are available (complete case analysis)7. An alternative is to use
imputation approaches for the primary analysis, an option that is particularly attractive if
investigators have strong hypotheses regarding the direction and magnitude of bias
associated with missing data. Generating these alternative estimates requires considering
the uncertainty associated with imputation and this consideration demands sophisticated
statistical approaches. Such approaches are now available for both binary15 and
continuous variables16.
For outcomes of putative benefit of an experimental intervention, we recommend the
approaches primarily, if not exclusively, for meta-analyses in which the results suggest a
statistically significant treatment effect. The purpose of the analyses is to challenge the
robustness of the inference that a benefit with respect to a particular outcome does indeed

MANUSCRIP
T
ACCEPTED
ACCEPTED MANUSCRIPT
14
exist. The approaches involve a series of progressively more stringent imputations of
data in primary studies, postulating that results from participants with missing data are
less favorable to the intervention than results from participants for whom the data are
available. One then pools across studies to determine the impact on the point estimate
and confidence interval.
For outcomes of harm (i.e. that suggest treated patients are worse of), one may challenge
in a similar way the inference that apparent harm with respect to a particular outcome
does indeed represent a real effect. To do so, one imputes data attributing a lower rate of
adverse events in the treatment group. Alternatively, or in addition, one may attribute a
higher rate of adverse events in the control group to participants with missing data than in
those in whom the data are available.
In addition, one may be interested in the robustness of inferences that an intervention is
not harmful. To address this issue, one would impute data suggesting a higher rate of
adverse events in the treatment group. Alternatively, or in addition, one may attribute a
lower rate in the control group among participants with missing data than in those in
whom the data are available.
Finally, one may challenge failure to establish benefit. This would involve imputing a
higher success rate in treatment group patients with missing data than in those followed
and/or a lower success rate in control patients with missing data than in those followed.
MANUSCRIP
T
ACCEPTED
ACCEPTED MANUSCRIPT
15
Binary outcomes
Traditional imputations: There are many possible ways to impute missing data in
individual primary studies. One might assume that all participants with missing data in
either group had events, that no participants with missing data had events, or a worst-case
scenario in which all participants with missing data in the intervention group suffered
adverse events but none of the participants in the control group suffered such events. That
worst-case scenario calculation assumes that the results of the primary analysis are
suggesting the intervention reduces the incidence of the outcome of interest.
Imputations using ratios: Our suggested imputation strategy is based on making
assumptions regarding the events in those with missing data as a ratio relative to those
with available data in the same arm. Three such ratios have been proposed: the incidence
of outcome events in participants with missing data relative to those with complete
follow-up (RIMPD/FU)17, the informative missingness odds ratio (IMOR)15 18 19, and the
Bayesian version of the IMOR20. In this paper, we use RIMPD/FU when providing
illustrative examples. In positive trials one might challenge the robustness of the results
by imputing RIMPD/FU > 1 in the intervention group and RIMPD/FU < 1 in the control group.
For instance, an event rate of 10% in participants with available data and a RIMPD/FU of
1.5 would result in an imputed event rate in those with missing data of 15%. An event
rate of 20% in control participants with available data with a RIMPD/FU of 0.5 would result
in an imputed event rate in those with missing data of 10%. Similarly to the RIMPD/FU, the
IMOR describes the relationship between the unknown odds among participants with

MANUSCRIP
T
ACCEPTED
ACCEPTED MANUSCRIPT
16
missing data and the known odds among participants with available data.15 It differs in
the use of odds instead of risks.
In trials suggesting an apparent benefit, for the sake of simplicity we suggest a constant
RIMPD/FU of 1.0 for control group missing participants (i.e. assume the same event rate in
those with missing as those with available data). For treatment group participants with
missing data one might start with the least stringent assumptions (for instance a RIMPD/FU
of 1.5) and repeat the meta-analysis with the associated individual primary study results.
If imputed data does not materially affect the results (in particular, confidence intervals
continue to exclude a null effect) one might then examine the impact of progressively
more stringent but less plausible assumptions (RIMPD/FU of up to 3.0, or possibly 5.0).
We have used 5.0 as the most stringent but still plausible RIMPD/FU because we identified
one study in which participants lost to follow-up were subsequently found to have had 5
times the rate of events than followed-up participants, but none that reported a higher
ratio21. We refer to the meta-analysis using the plausible most stringent RIMPD/FU as the
“plausible worst case”. The reviewers should ideally select the value of the plausible
most stringent RIMPD/FU a priori. The choice will be based on factors such as the clinical
scenario (e.g., higher value of RIMPD/FU in a trial of cardiac transplant in which
participants are more likely to have suffered a bad outcome if lost to follow-up), and the
baseline prognostic profile of participants with missing participant outcome data, when
reported.

MANUSCRIP
T
ACCEPTED
ACCEPTED MANUSCRIPT
17
To the extent that pooled estimates remain similar when making progressively more
stringent assumptions (and in particular, results remain statistically significant), one
would conclude that the results are robust to the missing data and, in the GRADE
framework, not rate down certainty in the evidence for risk of bias. If results change
materially, and particularly if statistical significance is lost, one would rate down
certainty in the evidence for risk of bias due to missing data. In general, one would be
more willing to rate down if significance is lost with the less stringent assumptions.
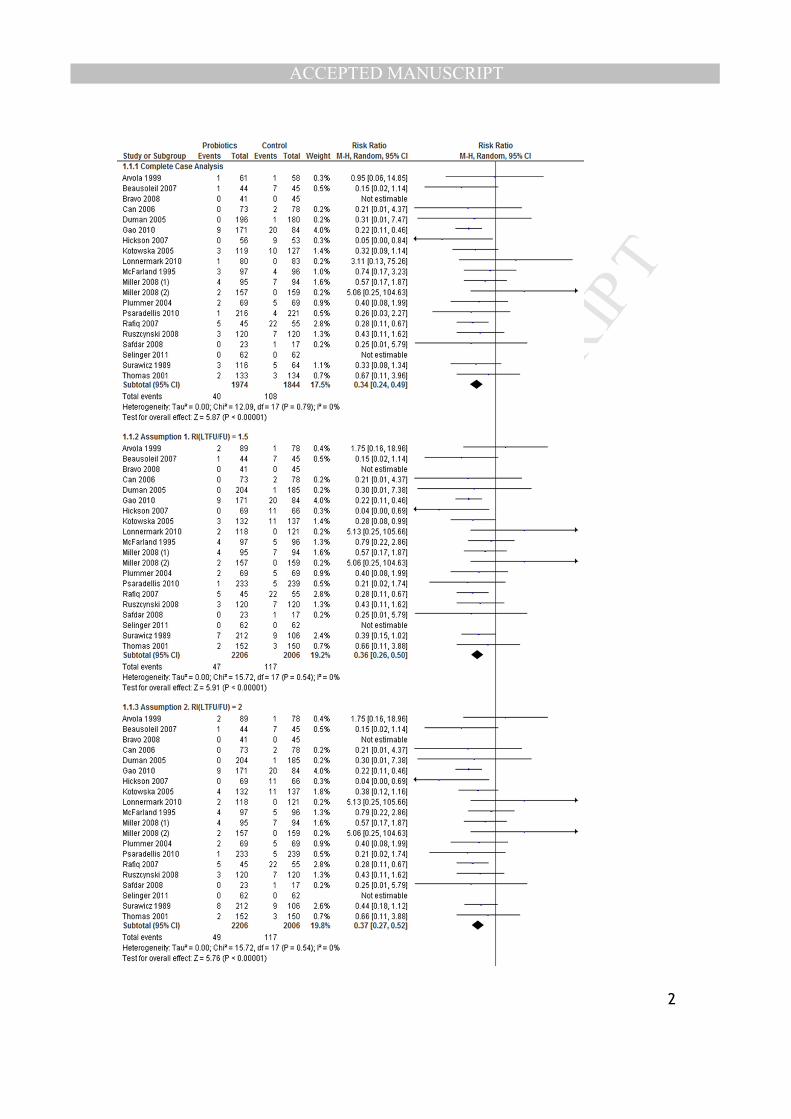
Illustrative examples: We have used this approach in several recently published Cochrane
and non-Cochrane reviews22-32. One of these studies assessed probiotics for the
prevention of Clostridium difficile infection (CDI)28. In 13 of 20 included randomized
trials, data on CDI were missing for 5% to 45% of participants. We assumed that the
event rate was the same among control group participants with missing data and
participants that were successfully followed. For the probiotic group, we re-calculated
pooled treatment effects by using our assumed RI in participants with missing data
compared with those who were successfully followed using the following assumptions:
RIMPD/FU 1.5, 2.0, 3.0 and 5.0. Our results proved robust to each of the RI assumptions,
and even with the 5.0 ratio, the probiotic effect remained large and the 95% CI narrow
(relative risk, 0.50 [0.34 to 0.76]) (Appendix Figure 1).
The Appendix provides another example of applying the method to a benefit outcome
with binary data and shows how the decision to rate down certainty in the evidence for

MANUSCRIP
T
ACCEPTED
ACCEPTED MANUSCRIPT
18
risk of bias due to missing data can vary across outcomes within the same study
(Example 2, Figures 2 and 3).
Application to harms: One could apply a similar approach to outcomes for which the
results suggest harm with the experimental treatment, but in this case impute a RIMPD/FU
of less than 1.0 to treatment and > 1.0 to control. Our suggestion, in parallel to that for
benefit outcomes, is to assume RIMPD/FU of 1.0 for control, and a value as low as 0.20 in
the intervention group. Alternatively, one could impute a RIMPD/FU for the intervention
group and RIMPD/FU of > 1.0 for the control group. Example 3 in the Appendix provides
an illustration of use of both options.
Application to non-statistically significant results: One could also apply the approach to
determine if findings of no increase in harm are robust. This would involve the same
approach as in the benefit setting: assume a RIMPD/FU of 1.0 in control participants with
missing data and > 1.0 in treatment group participants with missing data, possibly as high
as 5.0. Again, one would examine whether results change appreciably and in particular
whether previous results that were not significant become significant. Appendix
Example 4 provides an illustration.
We have a created a freely downloadable Excel document that allows a systematic review
author to determine the numerators and denominators to be used for each trial included in
the meta-analysis according to the selected assumptions:

MANUSCRIP
T
ACCEPTED
ACCEPTED MANUSCRIPT
19
https://www.dropbox.com/s/opstwgm45qiq57k/Assumptions%20about%20MPD%20v5.
xls?dl=0
Binary outcomes – choosing the stringency of the imputations
Investigators using our approaches will need to decide on which extreme a RIMPD/FU they
are willing to consider plausible. The choice will be based on factors such as the clinical
scenario (e.g., higher value of RIMPD/FU in a trial of cardiac transplant in which
participants are more likely to have suffered a bad outcome if lost to follow-up). Another
consideration will be the frequency of the event of interest. If it is infrequent (say, 5%) it
may be reasonable to assume a maximum RIMPD/FU of 5, and thus an event rate in those
with missing data of 25%. If it is frequent (say 40%) a RIMPD/FU of even 3 results in a
100% event rate in those lost. One may conclude that a rate of 100% is not plausible, in
which case a maximum RIMPD/FU of only 2 may be appropriate.
Continuous outcomes – all studies using the same measure
Addressing risk of bias consequent on missing data in systematic reviews addressing
continuous outcomes provides additional challenges, including the necessity of imputing
both means and standard deviations. Once again, we suggest the primary meta-analysis
use only participants with available outcome data (complete case). When pooled
estimates are statistically significant, we suggest sensitivity meta-analyses imputing
outcome data that are missing, to challenge the robustness of these pooled estimates.

MANUSCRIP
T
ACCEPTED
ACCEPTED MANUSCRIPT
20
To impute means, we consider five possible sources of data. In characterizing these
sources, we use “best” to describe the most desirable health state (which could be a high
or low score) and “worst” to describe the least desirable health state.
A. The best mean score among the intervention arms of the eligible trials.
B. The best mean score among the control arms of the eligible trials.
C. The mean score from the control arm of the trial under consideration.
D. The worst mean score among the intervention arms of the eligible trials.
E. The worst mean score among the control arms of the eligible trials.
To test the robustness of a pooled estimate showing an apparent benefit, using the five
suggested sources of data above, we recommend four imputation strategies that will
almost always be progressively more stringent. Table 1 provides a matrix describing the
four strategies:
• Strategy 1 uses source C for missing data in both the intervention and control
arms.
• Strategy 2 uses source D for missing data in the intervention arm, and source B
for missing data in the control arm.
• Strategy 3 uses source E for missing data in the intervention arm, and source B for
missing data in the control arm.
• Strategy 4 uses source E for those with missing data in the intervention arm, and
source A for missing data in the control arm.

MANUSCRIP
T
ACCEPTED
ACCEPTED MANUSCRIPT
21
We tested a number of sources of measures of variability (standard deviations) for the
imputed data and found they yielded very similar results. We therefore suggest the
simplest and most plausible source of data, the median SD in the control group of all
included trials.
To generate a pooled estimate across trials using the imputed data, we suggest, for each
arm in each trial, pooling the observed means and SDs of the participants with available
data with the imputed means and SDs for participants with missing data using the
following formulas:

MANUSCRIP
T
ACCEPTED
ACCEPTED MANUSCRIPT
22
where ‘‘M’’ represents the mean, ‘‘SD’’ the standard deviation, ‘‘n’’ the group size,
‘‘X’’ the combined estimates, ‘‘F’’ the followed-up group, ‘‘L’’ the lost to follow-up
group, ‘‘T’’ the treatment group, ‘‘C’’ the control group, and ‘‘i’’ the trial.
For each study, one can then calculate the treatment effect – a mean difference - by
combining means and SDs from the treatment and control arms using a fixed effects
model. One can then pool treatment effects across studies using, according to one’s
preference, either a standard fixed effect or random effects meta-analysis, to generate the
mean difference across all included studies.
As was the case for the approach to binary data, if results were robust (statistical
significance maintained even with the most stringent assumptions one considers
plausible) one would not, within the GRADE framework, rate down certainty in the

MANUSCRIP
T
ACCEPTED
ACCEPTED MANUSCRIPT
23
evidence for risk of bias. If statistical significance were lost for any of the more stringent
plausible approach, one would rate down. Our prior papers 4-6 provide examples of use
of the approach to challenging the robustness of findings of apparent benefit, as do
Examples 5 and 6 in the Appendix.
One could apply a similar approach to harm outcomes in which the results suggest harm
with the experimental treatment. In this case, the approach would involve imputing more
favourable results (less harm) to those in the intervention group with missing data, and
less favourable results to control group participants with missing data. The most extreme
challenge would be to attribute the best mean available from either group to intervention
participants with missing data, and the worst intervention group mean to control
participants with missing data.
One could also apply the approach to determine if findings of no [statistically significant]
increase in harm are robust. In this case, the approach would involve imputing
unfavourable results (greater harm) to those in the intervention group with missing data,
and favourable results to control group participants with missing data. The most extreme
challenge would be to attribute the worst mean (whether it comes from intervention or
control) to intervention participants with missing data, and the best mean (whether from
intervention or control) to control participants with missing data. Example 7 in the
Appendix provides an illustration.

MANUSCRIP
T
ACCEPTED
ACCEPTED MANUSCRIPT
24
We have a created a freely downloadable Excel document that allows a systematic review
author to determine the means and SDs to be used for each trial included in the meta-
analysis according to the selected assumptions per strategy:
https://www.dropbox.com/s/3ie12qfwjnfwx0z/MPD%20for%20continuous%20outcomes
_Template.xlsx?dl=0
Continuous outcomes – studies using different measures
For certain continuous outcomes and in particular participant-important outcomes
focusing on issues such as health-related quality of life (HRQL), clinical trial
investigators often choose alternative measures of the same underlying construct. For
example, there are at least five instruments available to measure HRQL in participants
with chronic obstructive pulmonary disease (COPD) (Chronic Respiratory Questionnaire,
Clinical COPD Questionnaire, Pulmonary Functional Status and Dyspnea Questionnaire,
Seattle Obstructive Lung Disease Questionnaire, and the St. Georges Respiratory
Questionnaire)33. The use of different instruments requires a modification of the methods
described in the previous section.
We suggest, for this modified approach, choosing a single reference measurement
instrument, converting scores from different instruments to the units of the reference
instrument, and then proceeding with imputation of missing values, combining the
available data with estimates from the missing data for each study, and then pooling
across studies.

MANUSCRIP
T
ACCEPTED
ACCEPTED MANUSCRIPT
25
Alternatively, one might proceed exactly as in the example when all studies use the same
instrument, but instead of natural units use the standardized mean difference (SMD).
Because of limitations of the SMD both with respect to vulnerability to varying between-
study heterogeneity, and its interpretability34, we prefer to base calculations on choosing
a single reference instrument as described in the following.
We suggest two key criteria when choosing the reference instrument. The first is its
frequency of use, and thus its familiarity to the target audience. The second criterion is
the measurement properties of the instrument. In the context of clinical trials, the key
measurement properties are instrument longitudinal validity (correlations of change with
other related measures), responsiveness (ability to detect important change over time,
even if that change is small), and interpretability (typically, an established anchor-based
minimally important difference)35. Details of the application of the approach follow.
Once one has chosen the reference instrument, one must convert all results into the units
of that instrument. Let us say that A represents the reference instrument and B represents
an alternative instrument. To convert B units to A units, one first converts the means and
standard deviations (SDs) of the scores from instrument B to the units of instrument A 36
using the following formula:

MANUSCRIP
T
ACCEPTED
ACCEPTED MANUSCRIPT
26
where M represents the mean, LA and LB represent the worst possible outcome score of
instrument A and B, respectively, RA and RB the ranges (the highest possible outcome
score minus the lowest possible outcome score) for instruments A and B, respectively,
and i the trial. One applies these formulas separately to the intervention group and the
control group of each trial6. One then proceeds exactly as in the previous section using
the converted score.
Alternative Threshold for Rating down for Risk of Bias: The Context of Healthcare
Guidelines
In the discussion thus far, we have suggested an approach to rating down using only one
threshold: the 95% confidence interval includes a relative effect of 1.0, or an absolute
difference of 0. This threshold corresponds to the p-value including the traditional
boundary of 0.05.
This is not the only threshold one might use. Instead, one might choose the smallest
effect that patients are likely to consider important, and apply the approach to that
threshold.
For instance, consider the outcome of prevention of a myocardial infarction. Even for an
intervention associated with small burden and toxicity, patients are unlikely to choose the
treatment if effects were very small (e.g. a reduction in infarction of only 1, or perhaps
MANUSCRIP
T
ACCEPTED
ACCEPTED MANUSCRIPT
27
even 5 in 1,000). If, however, the intervention is associated with large burden and
toxicity, the threshold would be much higher (10, or perhaps even 20 or more in 1,000).
Applying this logic to the latter situation, and choosing a threshold of 20 in 1,000, were
the boundary of the confidence interval closest to no effect to remain greater than 20 in
1,000 for even the most stringent imputation, one would not rate down certainty in the
evidence for risk of bias. If, however, the confidence interval in an imputation
considered plausible included the threshold of benefit of 20 in 1,000 (that is, included
reductions in infarction of less than 20 in 1,000, even if it remained above an effect of 0)
one would rate down certainty in the evidence for risk of bias.
Because choosing a threshold other than no effect involves a value judgment – the choice
depends on the importance placed on the target outcome (in the example myocardial
infarction) and the importance placed on the burden and toxicity – this approach may be
best applied in the context of a meta-analysis associated with a healthcare guideline. It
will also be restricted to consideration of absolute rather than relative effects. We have
applied this approach presented in one of our prior articles6.
Dealing with Limitations in Reporting
Systematic review authors will find challenges when authors of primary studies fail to
adequately report missing data. 37 For example, trial authors may not clearly report
whether they imputed outcomes for participants with missing data. Consequently, a

MANUSCRIP
T
ACCEPTED
ACCEPTED MANUSCRIPT
28
sensitivity analysis making imputations for participants with missing data risks double
counting . Elsewhere, we have described in detail the solutions for a number of these
challenges37. For trials in which authors do not report the frequency of missing data, we
suggest using the median missing data rate from all trials included in the review. If one
perceives this assumption is too stringent, alternatives include a sensitivity analysis using
a missing participant data rate of zero in both arms.
For trials in which authors fail to report missing data for each study arm and report total
missing data only, we suggest assuming the same rate of missing data in both
intervention and control groups. For trials in which the authors report a single imputed
analysis only, we suggest using the imputed results for both primary and sensitivity
analyses. Reviewers should acknowledge such limitations when discussing the results of
sensitivity analyses related to missing data.
Discussion
We have developed structured and transparent approaches to determine the extent to
which missing data across an entire of evidence introduces risk of bias and thus threatens
the certainty in the evidence in systematic reviews. Our approaches to binary outcomes,
and to continuous data when all studies use the same outcome measure, do not require a
high level of statistical sophistication, and can be carried out relatively easily in many
statistical programs including RevMan. Our approach to continuous data when studies
use different outcome measures begins with converting all instruments to the units of a
common instrument, requires greater statistical sophistication, but is nevertheless

MANUSCRIP
T
ACCEPTED
ACCEPTED MANUSCRIPT
29
straightforward. The approaches have received GRADE working group endorsement,
and their use in any systematic review using GRADE approaches would be desirable.
The analyses that we describe are sensitivity analyses designed to facilitate inferences
regarding risk of bias, rather than to generate alternative best estimates of intervention
effects. Thus, the approaches do not need to deal with the uncertainty associated with the
imputed values.
The approaches assume that investigators have little idea about the direction that bias as a
result of missing data may take, hence the use of complete case approach in the primary
meta-analysis. If investigators opt to make imputations in the primary analyses (as
discussed earlier) they should consider the uncertainty associated with imputation using
the appropriate statistical approaches for both binary15 and continuous variables16.
Our approaches all require judgment regarding what is and is not plausible; judgments
some may find arbitrary. Our approaches do, however, permit multiple progressively
more stringent sensitivity analyses. This allows investigators – and users of meta-
analyses – to choose the most extreme threshold that they consider plausible, and then
determine whether results are robust to that threshold.
We make specific suggestions for thresholds of plausibility – thresholds other than those
we suggest may be more appropriate in individual meta-analyses. For instance, for
continuous variables, one might not choose the most extreme results from other studies,

MANUSCRIP
T
ACCEPTED
ACCEPTED MANUSCRIPT
30
but results adjacent to or near the extremes. Investigators concerned about confidence
intervals being excessively narrow as a result of not taking into account uncertainty in
imputations may choose more stringent thresholds. In general, for any particular meta-
analysis, those who consider extremes more plausible will be more likely to rate down
the certainty of the evidence for risk of bias due to missing data than those who do not.
Deciding on specific imputation strategies also entailed some degree of arbitrariness: we
opted, where possible, for simplicity. For example, to address apparently beneficial
treatment effects in binary outcomes we suggest, for the control group, assuming that
event rates in missing participants do not differ from those in participants with complete
data. Thus, the only variation is the increase in event rates imputed to missing data,
relative to those with complete data, in the intervention group. It is possible, of course,
for investigators to reasonably deviate from our guidance and to also vary control group
event rates imputed to control groups. Systematic review authors might consider similar
reasonable alternatives regarding our suggestions for how to deal with harm outcomes,
and with continuous variables.
In our presentation, we have focused on rating down certainty in the evidence for risk of
bias only when meta-analyses that include plausible imputations for missing data result in
loss of statistical significance. We have also pointed out, however, that one could be
even more stringent: one could rate down if the boundary of the confidence interval
closest to no effect includes a threshold of patient-importance.

MANUSCRIP
T
ACCEPTED
ACCEPTED MANUSCRIPT
31
In summary, this GRADE guidance includes structured, transparent, and relatively easily
implementable strategies to determine whether the extent of missing data warrants rating
down the certainty in a body of evidence for a particular outcome for risk of bias.
Ongoing work involves examining the impact of the approaches on a large sample of
meta-analyses, and may inform future updates of this guidance 38.
List of Abbreviations:
IMOR: Iinformative missingness odds ratio
RI: Relative incidence
MPD: Missing participant data
FU: Followed-up
CDI: Clostridium difficile infection
SD: Standard deviation
HRQL: Health-related quality of life
COPD: Chronic obstructive pulmonary disease
SMD: standardized mean difference

MANUSCRIP
T
ACCEPTED
ACCEPTED MANUSCRIPT
32
References
1. Guyatt GH, Oxman AD, Vist G, et al. GRADE guidelines: 4. Rating the quality of evidence--study limitations (risk of bias). J Clin Epidemiol 2011;64(4):407-15. doi: 10.1016/j.jclinepi.2010.07.017
2. Balshem H, Helfand M, Schunemann HJ, et al. GRADE guidelines: 3. Rating the quality of evidence. J Clin Epidemiol 2011;64(4):401-6. doi: 10.1016/j.jclinepi.2010.07.015
3. Higgins J, Green SuMTCC, 2011. Available from Cochrane Handbook for Systematic Reviews of Interventions Version 5.1.0 2011.
4. Akl EA, Johnston BC, Alonso-Coello P, et al. Addressing dichotomous data for participants excluded from trial analysis: a guide for systematic reviewers. PLoS One 2013;8(2):e57132. doi: 10.1371/journal.pone.0057132
5. Ebrahim S, Akl EA, Mustafa RA, et al. Addressing continuous data for participants excluded from trial analysis: a guide for systematic reviewers. J Clin Epidemiol 2013;66(9):1014-21 e1. doi: 10.1016/j.jclinepi.2013.03.014
6. Ebrahim S, Johnston BC, Akl EA, et al. Addressing continuous data measured with different instruments for participants excluded from trial analysis: a guide for systematic reviewers. J Clin Epidemiol 2014;67(5):560-70. doi: 10.1016/j.jclinepi.2013.11.014
7. Akl EA, Kahale LA, Agoritsas T, et al. Handling trial participants with missing outcome data when conducting a meta-analysis: a systematic survey of proposed approaches. Syst Rev 2015;4:98. doi: 10.1186/s13643-015-0083-6
8. Akl EA, Carrasco-Labra A, Brignardello-Petersen R, et al. Reporting, handling and assessing the risk of bias associated with missing participant data in systematic reviews: a methodological survey. BMJ Open 2015;5(9):e009368. doi: 10.1136/bmjopen-2015-009368
9. Akl EA, Shawwa K, Kahale LA, et al. Reporting missing participant data in randomised trials: systematic survey of the methodological literature and a proposed guide. BMJ Open 2015;5(12):e008431. doi: 10.1136/bmjopen-2015-008431
10. Akl EA, Kahale LA, Ebrahim S, et al. Three challenges described for identifying participants with missing data in trials reports, and potential solutions suggested to systematic reviewers. J Clin Epidemiol 2016;76:147-54. doi: 10.1016/j.jclinepi.2016.02.022
11. Abraha I, Montedori A. Modified intention to treat reporting in randomised controlled trials: systematic review. BMJ 2010;340:c2697. doi: 10.1136/bmj.c2697
12. Abraha I, Cherubini A, Cozzolino F, et al. Deviation from intention to treat analysis in randomised trials and treatment effect estimates: meta-epidemiological study. BMJ 2015;350:h2445. doi: 10.1136/bmj.h2445
13. Schulz KF. Assessing allocation concealment and blinding in randomised controlled trials: why bother? Evid Based Nurs 2001;4(1):4-6.
14. Alshurafa M, Briel M, Akl EAA, et al. Inconsistent Definitions for Intention-To-Treat in Relation to Missing Outcome Data: Systematic Review of the Methods Literature. PLoS ONE. 2012; 7(11): e49163

MANUSCRIP
T
ACCEPTED
ACCEPTED MANUSCRIPT
33
15. Higgins JP, White IR, Wood AM. Imputation methods for missing outcome data in meta-analysis of clinical trials. Clin Trials 2008;5(3):225-39. doi: 10.1177/1740774508091600
16. Mavridis D, White IR, Higgins JP, et al. Allowing for uncertainty due to missing continuous outcome data in pairwise and network meta-analysis. Stat Med 2015;34(5):721-41. doi: 10.1002/sim.6365
17. Akl EA, Briel M, You JJ, et al. Potential impact on estimated treatment effects of information lost to follow-up in randomised controlled trials (LOST-IT): systematic review. BMJ 2012;344:e2809. doi: 10.1136/bmj.e2809
18. White IR, Higgins JP, Wood AM. Allowing for uncertainty due to missing data in meta-analysis--part 1: two-stage methods. Stat Med 2008;27(5):711-27. doi: 10.1002/sim.3008
19. White IR, Welton NJ, Wood AM, et al. Allowing for uncertainty due to missing data in meta-analysis--part 2: hierarchical models. Statistics in medicine 2008;27(5):728-45. doi: 10.1002/sim.3007
20. Turner NL, Dias S, Ades AE, et al. A Bayesian framework to account for uncertainty due to missing binary outcome data in pairwise meta-analysis. Stat Med 2015;34(12):2062-80. doi: 10.1002/sim.6475
21. Geng EH, Emenyonu N, Bwana MB, et al. Sampling-based approach to determining outcomes of patients lost to follow-up in antiretroviral therapy scale-up programs in Africa. JAMA 2008;300(5):506-7. doi: 10.1001/jama.300.5.506
22. Akl EA, Kahale L, Barba M, et al. Anticoagulation for the long-term treatment of venous thromboembolism in patients with cancer. Cochrane Database Syst Rev 2014;7:CD006650. doi: 10.1002/14651858.CD006650.pub4
23. Akl EA, Kahale L, Sperati F, et al. Low molecular weight heparin versus unfractionated heparin for perioperative thromboprophylaxis in patients with cancer. Cochrane Database Syst Rev 2014;6:CD009447. doi: 10.1002/14651858.CD009447.pub2
24. Akl EA, Kahale L, Terrenato I, et al. Oral anticoagulation in patients with cancer who have no therapeutic or prophylactic indication for anticoagulation. Cochrane Database Syst Rev 2014;7:CD006466. doi: 10.1002/14651858.CD006466.pub5
25. Akl EA, Kahale LA, Ballout RA, et al. Parenteral anticoagulation in ambulatory patients with cancer. Cochrane Database Syst Rev 2014;12:CD006652. doi: 10.1002/14651858.CD006652.pub4
26. Akl EA, Ramly EP, Kahale LA, et al. Anticoagulation for people with cancer and central venous catheters. Cochrane Database Syst Rev 2014;10:CD006468. doi: 10.1002/14651858.CD006468.pub5
27. Lytvyn L, Quach K, Banfield L, et al. Probiotics and synbiotics for the prevention of postoperative infections following abdominal surgery: a systematic review and meta-analysis of randomized controlled trials. J Hosp Infect 2016;92(2):130-9. doi: 10.1016/j.jhin.2015.08.028
28. Johnston BC, Ma SS, Goldenberg JZ, et al. Probiotics for the prevention of Clostridium difficile-associated diarrhea: a systematic review and meta-analysis. Ann Intern Med 2012;157(12):878-88. doi: 10.7326/0003-4819-157-12-201212180-00563

MANUSCRIP
T
ACCEPTED
ACCEPTED MANUSCRIPT
34
29. Spencer FA, Sekercioglu N, Prasad M, et al. Culprit vessel versus immediate complete revascularization in patients with ST-segment myocardial infarction-a systematic review. Am Heart J 2015;170(6):1133-9. doi: 10.1016/j.ahj.2015.09.002
30. Spencer FA, Lopes LC, Kennedy SA, et al. Systematic review of percutaneous closure versus medical therapy in patients with cryptogenic stroke and patent foramen ovale. BMJ Open 2014;4(3):e004282. doi: 10.1136/bmjopen-2013-004282
31. Spencer FA, Prasad M, Vandvik PO, et al. Longer- Versus Shorter-Duration Dual-Antiplatelet Therapy After Drug-Eluting Stent Placement: A Systematic Review and Meta-analysis. Ann Intern Med 2015;163(2):118-26. doi: 10.7326/M15-0083
32. How to read clinical journals: V: To distinguish useful from useless or even harmful therapy. Can Med Assoc J 1981;124(9):1156-62.
33. Johnston BC, Thorlund K, Schunemann HJ, et al. Improving the interpretation of quality of life evidence in meta-analyses: the application of minimal important difference units. Health Qual Life Outcomes 2010;8:116. doi: 10.1186/1477-7525-8-116
34. Guyatt GH, Thorlund K, Oxman AD, et al. GRADE guidelines: 13. Preparing summary of findings tables and evidence profiles-continuous outcomes. J Clin Epidemiol 2013;66(2):173-83. doi: 10.1016/j.jclinepi.2012.08.001
35. Guyatt GH, Feeny DH, Patrick DL. Measuring health-related quality of life. Ann Intern Med 1993;118(8):622-9.
36. Thorlund K, Walter SD, Johnston BC, et al. Pooling health-related quality of life outcomes in meta-analysis-a tutorial and review of methods for enhancing interpretability. Res Synth Methods 2011;2(3):188-203. doi: 10.1002/jrsm.46
37. Akl EA, Kahale LA, Ebrahim S, et al. Three challenges described for identifying participants with missing data in trials reports, and potential solutions suggested to systematic reviewers. J Clin Epidemiol 2016 doi: 10.1016/j.jclinepi.2016.02.022
38. Akl EA, Kahale LA, Agarwal A, et al. Impact of missing participant data for dichotomous outcomes on pooled effect estimates in systematic reviews: a protocol for a methodological study. Syst Rev 2014;3:137. doi: 10.1186/2046-4053-3-137

MANUSCRIP
T
ACCEPTED
ACCEPTED MANUSCRIPT
1
Appendix Example 1: Binary outcome, testing robustness of finding of benefit: probiotics for preventing Clostridium difficile infection As described in the text of the article, a systematic review and meta-analysis assessed
probiotics for the prevention of Clostridium difficile infection (CDI)1. In 13 of 20
included randomized trials, data on CDI were missing for 5% to 45% of participants. We
assumed that the event rate was the same among control group participants with missing
participant outcome data (hereafter missing data) and participants that were successfully
followed. For the probiotic group, we re-calculated pooled treatment effects by using our
assumed RI in participants with missing data compared with those who were successfully
followed using the following assumptions: RIMPD/FU 1.5, 2.0, 3.0 and 5.0. Our results
proved robust to each of the RI assumptions, and even with the 5.0 ratio, the probiotic
effect remained large and the 95% CI narrow (relative risk, 0.50 [0.34 to 0.76]) (Figure
1). We did not rate down for risk of bias as a result of missing participant data.
MANUSCRIP
T
ACCEPTED
ACCEPTED MANUSCRIPT
2

MANUSCRIP
T
ACCEPTED
ACCEPTED MANUSCRIPT
3
Figure 1. Probiotics for preventing Clostridium-difficile associated disease: complete case analysis and sensitivity analyses using plausible assumptions.

MANUSCRIP
T
ACCEPTED
ACCEPTED MANUSCRIPT
4
Example 2: Binary outcome, testing robustness of finding of benefit: tiotropium versus long-acting beta-agonist in COPD We assessed the risk of bias in three of the outcomes of a Cochrane review comparing the efficacy and safety of tiotropium versus long-acting beta-2 agonists (LABA) in stable COPD2. The reviewers used GRADE to assess the quality of evidence and did not rate down for any of the outcomes as a result risk of bias due to missing data. When authors of the primary studies did not report a complete case analysis or the methods used to handle missing data, we assumed that they had imputed no events for patients with missing data and conducted a complete case analysis accordingly. For the outcome “Mortality” we did not rate down for risk of bias due to missing data because the investigators, in all eligible studies, determined survival status at the end of follow up in all randomized patients (no missing data in any study). In this meta-analysis, authors included all randomized patients from every primary in the overall estimates assuming that those with missing data did not have missed events (i.e. including missing patients in the denominator, but not in the numerator). For all meta-analyses reported here, if unclear in either the primary studies or the published meta-analyses, we assumed authors imputed no outcomes of interest for patients with missing data (including them in the numerator, but not the denominator). For “Exacerbations leading to hospitalization”, authors reported an odds ratio, 0.87 [0.77 to 0.99]. Data were missing for 5% to 11% of the participants. Both primary authors and the systematic review authors reported an outcome of “adverse events”. For such patients, it was not clear if some of those events were exacerbations leading to hospitalization, nor if individual experiencing adverse events continued to the end of the study or ceased participation at the time of the adverse events. We assumed that the adverse events were not exacerbations leading to hospitalization, and that patients experiencing adverse events were followed to study termination (and thus not missing). We made similar assumptions for other outcomes. With these assumptions, our complete case analysis generated a pooled OR of 0.83 [0.73, 0.94]. With an overall event rate of 16% in the intervention arm of the meta-analysis, we considered it plausible that the RIMPD/FU ratio could be 1.5, 2.0 or 3.0. A RIMPD/FU of 5.0 was not considered plausible (80% of the participants would have had a hospitalization for an exacerbation). Statistical significance was borderline assuming a RIMPD/FU of 2.0 (odds ratio, 0.89 [0.79 to 1.00]), and it was lost with a RIMPD/FU of 3.0. We would therefore rate down quality for risk of bias due to missing data (Figure 2).

MANUSCRIP
T
ACCEPTED
ACCEPTED MANUSCRIPT
5
Figure 2. Tiotropium versus long acting beta-2 agonists (LABA) in stable COPD: Hospitalization, complete case analysis and sensitivity analyses using plausible assumptions. For the outcome “At least one exacerbation during the study period” (odds ratio, 0.86 [0.77 to 0.93]) data were missing for 4% to 20% of the included patients. The overall event rate in the intervention arm of the meta-analysis was 41%. Because higher ratios would result in an imputation in which all patients with missing data in the intervention arm would have had at least one exacerbation (an implausible assumption), we conducted sensitivity analyses assuming that the RIMPD/FU ratio may be 1.5 or 2.0. The results proved robust to each of our RIMPD/FU assumptions; hence, we would not rate down quality for risk of bias due to missing data (Figure 3).

MANUSCRIP
T
ACCEPTED
ACCEPTED MANUSCRIPT
6
Figure 3. Tiotropium versus long acting beta-2 agonists (LABA) in stable COPD: At least one exacerbation, complete case analysis and sensitivity analyses using plausible assumptions.

MANUSCRIP
T
ACCEPTED
ACCEPTED MANUSCRIPT
7
Example 3: Binary outcome, testing robustness of finding of harm: tiotropium versus any control in chronic obstructive pulmonary disease Another meta-analysis assessed the safety of tiotropium versus any control in COPD3. The authors did not use GRADE to assess quality of evidence, but did explicitly conclude that there was a low risk of bias associated with missing data. We assessed the risk of bias associated with missing data for the composite outcome of long-term cardiovascular major outcomes (relative risk, 2.12 [1.22 to 3.67] as reported in the meta-analysis: for patients with missing data, authors assumed they did not have missed events), which included myocardial infarction, stroke and deaths due to cardiac causes. The frequency of missing data in the primary studies was between 11% and 29% but differed between study groups (5%-25% of the patients in the tiotropium and 10%-31% in the control group). The overall event rate in both arms of the study was very low (2.3% in the intervention, 1.2% in the control arm); we considered plausible RIMPD/FU ratios of 0.7, 0.5, 0.3 and 0.2 in the intervention arm. Results using these assumptions were proved robust. However, given both the low event rate and the higher rate of missing data in the control arm, we performed additional sensitivity analyses, using 1.5, 2.0, 3.0 and 5.0 as RIMPD/FU assumptions in the control arm, and 1 in the intervention arm. The rationale for this analysis was that the larger number of patients with missing data in the control arm could lead to higher risk of bias and a corresponding higher imputed number of events. In this sensitivity analysis, results became non-significant assuming ratios of 2.0 (relative risk, 1.49 [0.96 to 2.30]) or higher (Figure 4). Consequently, we would rate down for risk of bias due to missing data.

MANUSCRIP
T
ACCEPTED
ACCEPTED MANUSCRIPT
8
Figure 4. Tiotropium versus placebo in COPD: Myocardial infarction, stroke and cardiovascular mortality, complete case analysis and sensitivity analyses using plausible assumptions.

MANUSCRIP
T
ACCEPTED
ACCEPTED MANUSCRIPT
9
Example 4: Binary outcome, testing robustness of finding of no harm: tiotropium versus any control in chronic obstructive pulmonary disease In another meta-analysis, Yohannes and colleagues assessed the efficacy and safety of tiotropium versus any control in chronic obstructive pulmonary disease4. One of their findings was that tiotropium was not associated with increased risk of severe adverse events compared to placebo (odds ratio, 1.06 [0.97 to 1.17] as reported in the meta-analysis: patients with missing data included; authors assumed they did not have missed events). The authors did not use GRADE methodology to assess the quality of evidence. The missing data rate was between 5.5% and 18%. The overall events rate was 39% and 42% in the tiotropium and control arms of the meta-analysis respectively. We assumed that the event rate was the same among patients with missing data and those who were successfully followed in the control arm, and we used plausible assumptions for the RIMPD/FU in the tiotropium arm. Given the high event rates noted, we considered as plausible the RI ratios 1.5 or 2.0, since higher ratios would have led to imputations of all patients with missing data would experiencing a severe adverse event. With our first assumption, the meta-analysis showed a significantly higher risk of severe adverse events associated with tiotropium (odds ratio, 1.12 [1.02 to 1.23]). For this reason we would rate down quality for risk of bias due to missing data (Figure 3).

MANUSCRIP
T
ACCEPTED
ACCEPTED MANUSCRIPT
10
Figure 5. Tiotropium versus placebo in COPD: Severe adverse events, complete case analysis and sensitivity analyses using plausible assumptions.

MANUSCRIP
T
ACCEPTED
ACCEPTED MANUSCRIPT
11
Example 5: Continuous outcome, testing robustness of finding of benefit: Non-invasive ventilation (NIV) during exercise training in COPD. A Cochrane review evaluated the impact of NIV during exercise training on the exercise capacity of patients with COPD5. One of the outcomes was percentage change in constant work rate endurance time (mean difference 58.68 [3.76 to 113.59], complete case analysis). This meta-analysis included two studies; data were missing for 21.6 and 34.5% of the participants. The reviewers, using GRADE, rated the risk of bias due to missing data as low. We re-assessed this risk using plausible assumptions about the means of participants with missing data in each study arm, following GRADE’s guidance. The robustness of the results was lost from our first strategy, where we assumed that the mean scores among missing data in both arms of each included trial was equal to the one from the control arm of the trial under consideration (mean difference 42.94 [-4.79 to 90.68]) and thus we would rate down quality for risk of bias due to missing data (figure 4).
Figure 6. NIV during exercise training in COPD: Constant work rate endurance time, complete case analysis and sensitivity analyses using plausible assumptions.

MANUSCRIP
T
ACCEPTED
ACCEPTED MANUSCRIPT
12
Example 6: Continuous outcome, testing robustness of finding of benefit: Levothyroxine versus minimally invasive therapies or no treatment for benign thyroid nodules. A Cochrane review compared Levothyroxine versus minimally invasive therapies or placebo for benign thyroid nodules6. The authors compared total thyroxine (T4) at the end of study period with levothyroxine treatment versus no treatment or placebo and demonstrated that levothyroxine treatment is associated with higher total T4 (mean difference 48.28 [35.12, 61.43], with most primary studies using a last available observation carried forward approach to the analysis. This outcome was based on five trials. GRADE was not used; the risk of bias of the included studies was rated as low or unclear. The missing data rate was between 0% and 11.8%. Following GRADE’s guidance we re-assessed the risk of bias due to missing data using plausible assumptions about the means of participants with missing data. The result was proved robust to each of the imputation strategies, so we would not rate down quality for risk of bias due to missing data (Figure 8).

MANUSCRIP
T
ACCEPTED
ACCEPTED MANUSCRIPT
13
Figure 7. Levothyroxine versus placebo or no treatment for benign thyroid nodules: Total thyroxine at end of study period, complete case analysis and sensitivity analyses using plausible assumptions.

MANUSCRIP
T
ACCEPTED
ACCEPTED MANUSCRIPT
14
Example 7: Continuous outcome, testing robustness of finding of no harm: Different durations of corticosteroid therapy for exacerbations of COPD Another Cochrane review compared shorter versus longer duration of corticosteroid therapy for exacerbations of COPD7. One of the outcomes was degree dyspnea at the end of intervention, measured with the Medical Research Council (MRC) scale; no significant between group difference was demonstrated (mean difference -0.08 [-0.34, 0.17], complete case analysis, positive values favoring the longer course of steroids). This outcome was based on two trials. The reviewers did not use GRADE for this outcome, but they rated the risk of bias due to missing data low for both trials. Data were missing for 5.6% and 5.8% of the participants. Following GRADE’s guidance. We re-assessed the risk of bias due to missing data using plausible assumptions about the means of participants with missing data. The second suggested strategy, using the worst mean score among the intervention arms of eligible trials for the participants with missing data in the intervention group and the best mean score among the control arms of eligible trials in the control group, resulted in a significant decrease in the degree of dyspnea with shorter courses of steroids (mean difference -0.61 [-0.86 to -0.37]). Consequently, we would rate down quality for risk of bias due to missing data.

MANUSCRIP
T
ACCEPTED
ACCEPTED MANUSCRIPT
15
Figure 8. Different durations of corticosteroid therapy for exacerbations of COPD: Dyspnea, complete case analysis and sensitivity analyses using plausible assumptions.

MANUSCRIP
T
ACCEPTED
ACCEPTED MANUSCRIPT
16
References 1. Johnston BC, Ma SS, Goldenberg JZ, et al. Probiotics for the prevention of
Clostridium difficile-associated diarrhea: a systematic review and meta-analysis. Ann Intern Med 2012;157(12):878-88.
2. Chong J, Karner C, Poole P. Tiotropium versus long-acting beta-agonists for stable chronic obstructive pulmonary disease. Cochrane Database Syst Rev 2012;9:CD009157.
3. Singh S, Loke YK, Furberg CD. Inhaled anticholinergics and risk of major adverse cardiovascular events in patients with chronic obstructive pulmonary disease: a systematic review and meta-analysis. JAMA 2008;300(12):1439-50.
4. Yohannes AM, Willgoss TG, Vestbo J. Tiotropium for treatment of stable COPD: a meta-analysis of clinically relevant outcomes. Respir Care 2011;56(4):477-87.
5. Menadue C, Piper AJ, van 't Hul AJ, et al. Non-invasive ventilation during exercise training for people with chronic obstructive pulmonary disease. Cochrane Database Syst Rev 2014;5:CD007714.
6. Bandeira-Echtler E, Bergerhoff K, Richter B. Levothyroxine or minimally invasive therapies for benign thyroid nodules. The Cochrane database of systematic reviews 2014;6:CD004098.
7. Walters JA, Tan DJ, White CJ, et al. Different durations of corticosteroid therapy for exacerbations of chronic obstructive pulmonary disease. Cochrane Database Syst Rev 2014;12:CD006897.

MANUSCRIP
T
ACCEPTED
ACCEPTED MANUSCRIPT
• When assessing risk of bias associated with participant outcome data across an entire
body of evidence, we propose using a complete case analysis for the primary meta-
analysis.
• When the results of the primary meta-analysis suggest a statistically significant treatment
effect, conduct sensitivity meta-analyses using plausible assumptions to impute events in
participants with missing outcome data in each study, and then pool across studies.
• If the results of the primary meta-analysis are robust to the most extreme plausible
assumptions, one does not rate down certainty in the evidence for risk of bias due to
missing participant outcome data.
• If the results are not robust to plausible assumptions, one would rate down certainty in the
evidence for risk of bias.