ehhhhh0h gpse is currently designed to simulate five gps satellite rf signs and five jammer rf...
TRANSCRIPT

AD-A089 842 ITT DEFENSE COMMUNICATIONS DIV NUTLEY N .J F/S 1717SPS USER EQUIPMENT PERFORMANCE EVALUATION. (U)NOV 79 F33615-76-C-1164
UNCLASSIFIED AFALTR79113 NL
Ehhhhh0h

I I ~32~ I~11111 ____111112.0~
1.L81.25 11111 BW1. 6
W O t' I SOI MOiUN It I HR

.4 -
Tto r
K A'*'. -
R IHT L M,
Al a

C
1~ r -~ ~At
~- ~ ~t4 tV Th~%~
-~ <ZtP4'~4 V'~ ~
C & -~ ~&a
~'fit '~b
~- ~ <-,-
- - ?j;-'
~ $.'4-t44
r
~ -rS ~
~ #4
J~ta '4a. MM dhUsS, LV We With - wanE Saw- Cf e* eta. iv 4A~er whqStv uflr ornuiatDa s~~~taa~ - *5t4 64 S flt*te$a 4 flfl a*S4
1'
Cwi W 314* m#. SMM* - be wa.~ ~ ~'**n amautp S., ~fleu* MM#tiqaw. yr ens.. a a agenAMR ~ ~
- .- ~ * **
- - -- -' wrfl~ ~ ,~ ~ * ~rj~g~4 '

;~~NA I _____________
DOD-EOR-CUMENTATION PAGE flFFflCn ogg1'"n Yomh
FINAL for Period 25 Jun 76
ZFORMANCE,.,VALUATION. *. I'R~.IOo.ame ~1. VIOR~) . CONITRACT OR "MYk NUM5E8.
9. Pgaroftulle ORGANIZ*AIN NME AND WONtssS 99. PROGRAM ECM91NT. PROJIECt. TASKAREA a WORK UNIT NUMBERS
4921tVR R0AD, NUJTLEY, NJ 0711066A 61
MI CONTROLLING QtUOCC NAME AND AL415%IRESSOIVO
AIR FORCE AVIONICS LAB. (AFAL/RWA) (11WRIGHT-PATTERSON AF~i, 01110 45433 82_________
14 ONITORING AGENiCY iiAsel 0 iAessn. die~.. frm C..ea.IIM Ofie) IS. SKCuQ7TYV cLASS. W te* voreetJ
~ / 1G. 01CLASSIFICATICNgOOWNGRADIWOSCHCOULE
re. DISVISSUIN STAtEMENT (eichi# x~ff
Approved for public release; distribution unlimited.
17. *#NUIOWS~EE~ U the es Nee in Block"M. IliEl760*0E from stove")
1S. SUPPLCENENTARY 0OTES
It. KEY VOROF fceA~fift. on evoe*e $@do it neeeoary ows ldontfy by block ~w. or)
Global Positioning System Navigation Satellite Inertial MeasurementGlobal Positioning Satellite, Navigation Lever Arm EffectPositioning, Global Worldwide Radio Navigation
ft. A* TRACt (Contlehu. ea [email protected] Old* f(ece@mOm, end adewalulyf by block "tmb..)
'Fe significance of this research and development project to the Air Force isthat It provides for a hot-bench simulation facility to validate OPS (GlobalPositioning System) User Equipment performance under various flight dynamicsand environments and provides a data base for comparison with flight testresults. This would also enable systematic evaluation of the performance ofthe OPS User Equipment In a simulated hostile electromagnetic environment.--?
DD 1473 tom. a@, I ov sin oUsoLriE
SECURITY CLASSIFIC ATION Of THIS PAGE (WhOR Veto I-00)

Weve.'? CLe&IgCAlhos or #HIS PA0UNIb.. Date Rsg0"Op
Abstract (Continued)
This simulation includes the generation of: GPS RF signals, jammer RFsignals, white Gaussian noise, GPS navigation data, on-board sensor signals(i. e. IMU and altimeter), path loss and antenna pattern. As part of thesimulation, error models for various functions and phenomena includingIMU, altimeter, ionospheric and tropospheric delay, gravity anomaly,ephemeris, and clock error are included. The simulator precisely couplesthe changes in RF signals to the physical dynamics of the system (i.e.,user, satellite, and jammer motions), including lever arm effects.
The GPSE is currently designed to simulate five GPS satellite RF signs andfive jammer RF signals. The entire simulation is under computer controlin real time, utilizing as the input pre-computed data defining the user flightprofile, jammer, and satellite motion.
This report discusses in detail studies made, the techniques employed, andpertinent observations made in the performance of the contract. The reportends with a discussion of the results and a few suggestions for the futureprojects.
iECUt ITV CLASS9ICATWON OF HIl PAGIWb Data &-#we
I

TABLE OF CONTENTS
SECTION PAGE
I INTRODUCTION 3
11 SYSTEM 7
II SYSTEM DESCRIPTION 21
IV HARDWARE CONFIGURATION 30
V SOFTWARE CONFIGURATION 32
VI SYSTEM TEST PLAN 43
VII OPERATIONS AND MAINTENANCE 47
Vill GPSE-GDM Tests 150
IX CONCLUSIONS AND RECOMMENDATIONS 52
APPENDIX A: TRADE-OFF ANAJ.XSIS - LEVER ARM EFFECTS A-i
APPENDIX B: POST RUN PROCESSING CONCEPT STUDY B-1
F mc
TA3
*~~~~~m r -0. % -1t________.

LIST OF ILLUSTRATIONS
FIGURE TITLE PAGE
1 GPSE Evaluator 4
2 Pre-Computed Fixed and Initialization Data 9
3 Pre-Computed Dynamic Data 12
4 Real Time Operations 14
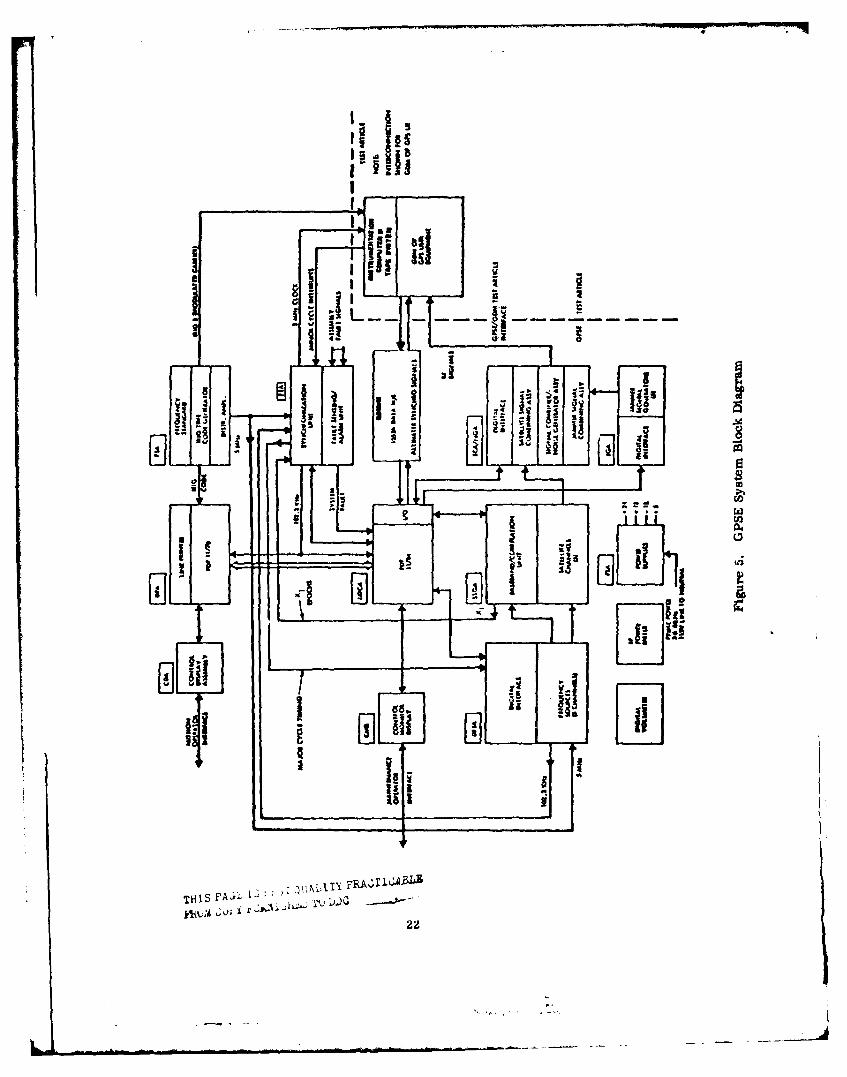
5 GPSE System Block Diagram 22
6 GPSE User Equipment Performance Evaluator, Typical Locations 23
7 Data Processing Assembly (DPA) and Peripheral Eq-tipment 24
8 GPSE Hardware Configuration (Diagram) 31
9 DPA Program: Functional Block Diagram 35
10 Pre-Computed Segment Data Flow 37
11 Real Time Segment Data Flow 39
12 Post Hun Analysis Segment Data Flow 42
13 Evolution of the GPSE System 44
LIST OF TABLES
TABLE TITLE PAGE
I User Vehicle Dynamics 28
2 Jammer Vehicle Dynamics 28
3 GPSE Major Characteristics 29
r
2

SECTION I
INTRODUCTION
The Global Positioning System (UPS) Is a satellite navigation system currently
under development by Headquarters, Space and Missile Systems Organization
(SAMISO), Air Force Systems Command, for the Department of Defense.
rho GIPS will ultimately provide a highly accurate worldwide radio navigation
capability to suitably equipped military, as well as civilian user systems. The
User System Segment consists of User Equipment (UE) which processes the navlga-
tion signals from each of four GPS satellites to determine user navigation para-
meters such as latitude, longitude, altitude, velocity, and system time. User
kkhuipment Is composed of a small antenna, an L-band receiver which measures
pseudo-ranges and pseudo-range rates to the satellites, a data processor which con-
verts the receiver outputs into the desired navigation parameters, a control/display,
and power supplies. Depending upon the application and performance requirements.
the GPS ranging data may be supplemented with other navigation information from
auxiliary sensors, such as an altimeter und an inertial reasurement unit (IMU).
The UPS Evaluator (Figure 1) is designed to provide a simulated test bed to test the
General Development Model (GDM of the User System Segment developed by the
Air Force Avionics Laboratory (AFAL). The GPSE is also capable of testing other'4
User Systems with minor changes. The UPSE provides simAlated GPS navigation
signals, Jamming and noise signals and auxiliary sensor data to the GDM. The GPSE
will serve to validate the GDM, provide a data base for comparison with flight test
results and systematically evaluate the performance of the GDM. In addition, the
system will collect the user instrumentation data in a manner suitable for analysis
and perform statistical analysis on the user data.
Initially as proposed, the GPSE was to simulate four UPS satellites, five jamincra
(four CW and one PN modulated) with individual J/S capability of up to 67 dB and one
L Band Gaussian white noise generator. 'rhe design was later upgraded to generate
a fifth satellite to facilitate satellite switchuver and enable truthful simulation of
extended flight duration (up to 10 hours). The project was initiated in mid '76 and
the final system was delivered to the Air Force Avionics Laboratories, Wright
Patterson AFB In April 1979,
3
L

• n ~ i ° .. ..........O- ,
I
• '
Vigure 1. GPSE Eluator
" ' - 'i - n -- . .-
4
LA

The primary features of the GPSE are given below:
6 Faithful, precise, repeatable simulation of total environment including.
Satellite signal characteristics, including GPS up-link navigation data
Flightdynamics including lever arm effects
Jamnmer signals - - CW, PN, special purpose
Antenna patterns
System temperature
Error models
* Adaptable to various user equipments including missiles
* lexible error models
* Flexible mission scenarios
* BF signals precisely coupled to user dynamics
" Optimized for use in conjunction wilh flight tests
* Efficient use of processor resources--Disc operated system
" Separate maintenance and test interface
* Maximum use of low-risk off-the-shelf hardware
* Expandable up to nine satellite channels
" J/S capability expandable up to 67 dB
The software system is characterized by the following features:
0 Coded in RATFOR (structured in I'OfrRAN).
0 Segmented program structure
9 Modular database
0 Simulation efficiency and flexibility
- pre-computed ideal (truth) data
- real time error data
- post run analysis data
The GPSE is currently configured to interface with the GDM of the GPS User
Equipment. As such, it will operate in the following modes:
5

Spcciflcation Validation Mode (GDM)
40 Signal reacquisition
* Synchronization recovery
0 Jamming immunity
40 NAV data recovery
Navigation Mode (GDM)
* 10 Pour flights
0 40 segments per flight
0 Simulate specified range of user and jammer dynamics
Built-in Test (BIT) Mode
0 Use built-in test facilities
41 On -line automatic fault detection to assemibly/unit level
* Off-line manual fault isolation to reuplaceable module using test programs,
built -in and laboratory test equipmont
Calibration Mode
0 Use built-in test facilities
* RF power levels
o "Zero" range set
*User timing synch ronization
6

SECTION II
SYSTEM
CONCEPT
The complete GPSE requirements were studied as an entity and the system
was designed from top down. Various studies for the newly encountered
simulation and processing problems were made mnd published. Two of the
studies, Trade-Off Analysis - Lever Arm Effects (Appendix A) and Post Run
Processing Concept Study (Appendix B) are enclosed as examples.
A math model for the system was developed and was based upon the division
of the computing task into three basic categories.
A. Pre-computed portion
B. Real time portion
C. Post run portion
This division Is baied upon the following premises:
* All "truth' data will be pre-computed, up to a maximum data rate of
10 per second.
The "truth" includes:
Selected user flight profile
Selected jammer flight profiles
Selected ephemerides for 5 satellites
Selected ionosphere model
Selected troposphere model
Selected jammer scenario
(Power level and jammer type)
0 The data required at 50 per second will either be computed in real time,
or interpolated in real time from the pre-computed 10 per second data
O All error models will be implemented in real time, in order to provide
for the maximum amount of simulation flexibility. Error models include:
7

Satellite clock true error
Measurement error in satellite clock error
Satellite ephemeris measurement error
Ionosphere model measurement error
IMU error model
Barometric altimeter error model
Gravity anomalies
a Gr)M (or other test recei:' -r !nstunentation data (position and
velocity) will be computed in real thne, and stored for post-analysis.
Other GDM parameters of interest, such as status signals, acquisition
times, etc., will also be stored for post-analysis.
PRF- COMPUTED PORTION
This category may be divided into two basic functions, The first function is
to provide data which is required at the beginning of a run. Generally, this
data remains without change for the duration of the run. However, with
certain restrictions, some of this data can be changed during the run. The
second function is to provide dynamic data (up to a 10 per second rate) which'
is continually changing during the run.
A functional diagram of the first function is provided in Figure 2. The time
ephemeris parameters are used both to generate the dynamic satellite trajec-
tories, and to serve as "truth" data. In the real time portion, the selected
ephemeris error model is added to the "truth" data. In the real time portion,
the selected ionosphere measurement error model is added to the "truth" data
to generate another part of the SSGA data stream.
The true ephemeris parameters can be changed during the run, provided that
there is no discontinuity in either satellite position or satellite velocity at the
transition point, The true ionosphere coefficients can also be changed during
Y8

TRUE
SPIIHEMESM - ----- TRIUE l 'HEM IRM
PARAMETERS j I PARAMETERS
1O SA'N E L LITE
TIAJ. GENE"ATOR
TRUE
IONOSPIIERE TR I'_UE I bO (APLaE11
COE. corr.
TO IONOSPIIEREDELAY
rROM SIART-UP INITIAL RANGE
Fn-HSATTOL.- BIT C.D IIIASE
rAH RTG RESET MLSSAGE
JAMMER IVWER
LEVEL
SET j JAMMER COARSE
JAMIER ATrTN. BETTING
LEVELJAMMAER AILINUUM
RANGE
JAMMER
SELECTION --- JAMMR SELECTION
Figure 2. Pre-Computed Fixed and Initialization Data
9
' !

the run, provided that there is no discontinuity in ionosphere delay at the
transition point.
Because of acceleration limitations in the DFSA, the range rate input to the
DFSA must start at zero, and must be changed (at less than 250 meters/sec 2 )
until it matches the actual range rate. This operation requires a range offset
from the true initial range. Also, it may be desired to have a Z-count at the
start of the run which is not close to zero (start of the week). The values of
starting Z-count, initial range, and range offset are processed to determine a
required code phase jump which will be implemented by means of the SSGA base-
band units. This jump must be an integral number of P3 chips, where one P chip
represents a distance ofz
2.997925 x .meters = 29.2 meters
1. 023 x 107
Once the nunber of P chips in the required Junp has been determined (any
integer up to 6.2 x 10 12), this number must be processed to result in an 88 bit
code phase reset message which is transmitted to the SSGA baseband units. This
procedure must be followed for each of the 5 satellites, and is performed only
at the begiming of the run.
One or more jamming scenarios during the run will require pre-selecion of
jammer type (CW, SPJ, CW/PNBPSK) for channel #1, and janimer power level
for each of the 5 jammer channels. In association with the Jammer power level,
and the actual jammer minimum range, a reference range is selected which is
equal to or less than the actual minimumn rnmge, and which will yield an integral
multiple of 5 dB for the coarse attenuator setting in the SCA, The dynamic path
loss output for each Jammer channel is then computed from the ratio of actual
range to reference range (ratio squared converted to dB). The coarse attenuator
setting and reference range may be changed as desired during the runp provided
that the associated jammer channel is turned off while the change is being made.
10

A functional diagram of the second function (dynamic data) is provided in
Figure 3. The user flight profile generator provides outputs of position,
velocity and velocity rates of the aircraft c/g, along wih sines and cosines
of the 3 Euler angles (roll, pitch, azimulth) representing aircraft attitude with
respect to the ideal IMU platform rcference Lxes, The velocity rates and
velocities are combined with Earth rate, in the section labeled "Ideal IMU",
to give accelerations (excluding gravity) and inertial rates as would be sensed by
an ideal 1MU. Ideal gravity is also computed as a function of latitude and height
in this section. For u$e in the user clock error model, the acceleration along
the crystal sensitive axis is computed based upon the velocity rates and the air-
craft attitude.
The satellite trajectory generator generates position and velocity of each of the
5 satellites referred to ECEF axes. The position data is based upon the equations
listed on 'rable IX, page .18, of ICD Ml -00002-400, and the selected set of
ephemeris parameters as indicated in Figure 2. Velocity data is needed only
for a range correction to account for satellite motion during the finite trans-
mission time, and is derived by simple differencing of successive satellite
positions (at 0. 1 second intervals). Each satellite position is then combined
with the user position, in the section labeled "Satellite - User Geometry", to
give direction of the line-of-sight (with respect to the Ideal IAMU reference axes)
and precision range for each of the 5 satellites.
The jammer flight profile generator generates jammer position for each of up to
5 jammers, based upon preselected flight paths. In the section labeled "Jamncr-
User-Geometry", the relative velocity components between the jammer and the
user are integrated to give direction with respect to the ideal LMU reference axes
and range. The direction information is used In the real time portion to generate
antenna pattern attenuation values for the jammer signals. The range informalion
is used with the reference range Information (referred to In Figure 2) to generate
11

&tTELLITE USER. FUGIIT JAMMER VLIWIl
TRAJ. I'HOVlk PNOFUSL
GENERATOR L GflrFRAi'on GENERATOR
HE~)II
DELAY OE UXAL TA
DMCIN RANHUEIC1 RNI
IOSH R A THE VX. Sy.
Ll IT T U II IV HZ.EL
M i. Li. i
RANG.E-AN
CURRVECT AE V. V NO 0E*
ORANG . WV . z
FIT *.X 0.0 sz
FIT u 3. PW-Cmp. Dyai Dat
12

path loss attenuation commands to the SCA for each of the 5 jammer channels.
Successive differences of each jammer range are used to generate user to jammer
doppler values.
Detailed descriptions of the various computation blocks and the actual implementation
information can be found In the computer program product specification for the Data
Processing Assembly (ITT Specification No, 1263058).
REAL TIME PORTION
A functional diagram of the real time operations Is provided in Figure 4.
Entries on the left side of the figure are inputs from the pre-computed portion
Figure 3). Data rates are indicated in parentheses below the entries. Where
no data rate is shown, the Inputs are changed only infrequently if at all.
Attitude Data
Attitude data (sine and cosine of roll, pitch, and azimuth) is interpolated at .02
second Intervals from the 10 per second, input data, using a third order curve
fit fur roll, and a linear Interpolation for pitch and azimuth. Errors from the
IMU attitude error model are then added to the "'truth" data to give simulated IMU
attitude outputs to the GDM at 50 per second. The "truth*' attitude data Is also used
for baseline ani uina pattern calculations.
For the baseline antenna, the cosine of the offset angle between the saiclllte or jammer
line of sight being considered and the antenna centerline (coincident with the aircraft
vertical) is computed. The cosine of the offset angle is then converted to a pattern attenu-
ation (in dB) by means of a table look-up for the applicable antenna element. In the
satellite baseline mode, the look-up Is implemented for both he upper (U) and middle
(M) elements. In the inverted range mode, only the lower (L) beam is implemented,
and outputs with a U subscript then represent the lower beam attenuation.
13

ATITUDjE DATA m'u. IYATA 454/&C. I 5U 'SMIOC(Loluc.) I'OLATE MAEIN:SO/MCAJ
ANTENNAPATTERINS 91 x l, a (TO WAI
JAMMER L/5IASLN
DLECTIO)U momK
'/ac.,
SMULATED IOUMv L ATTITUDE OUTPUTS1
ATTITUDE EM(TO 0DM) (NIMC)ERROR MODE
'I .AA x
SAT9ELLIT3 L/S ANTENNA JiA. its.
DIECTIONS -IIEN J3C. IJ41D4115MC) (TO WCA) 41/S9C.)
ARMLVL4 ANi(I4v I) (TO IJI-.A) (10/SE;C.)
il ANGE (10/SEC PIT
CLO~b~U -~.I)0(0 DFSAI (10/SC.)
AXTAL I..:S l ISECtiO/SKC.) bIODLI.
USERt Hco
110/Sc.) BUI(TO DVMAj (LS/UC.)
Clk~ k1 ,~ A TO UIET a
Figure 4. Real Time OperatiosB (Sheet 1 Of 3)
14

TRUE ONOSPMME IOD L COE V.
COE V.
I RIJN kPMEL A FROM SIWLLT I
COL. F ATA Z COUNT (FRIOM SGAI
[iA V'IMIlTEI I LUI'S
I_____to WAV DATA (TO SWAI
-BARO. ALT.ItIG/EC.ERRtOR N-~ (RA RO.L TO GDM
%V MODE I.
1A0/SEC.)
BADO At T.
COEV. IN N w Lw
I IlIm GUM) iw4/SL. i
A A E.A 0/L.IS
At V it [toll_ -. 0-6 SMODEL Vat. Vk. "v
J-10 GUM) t/L.
GRAVITY r.-, -vv0Hl DIIUSC
ANOMALY -
MODEL
JAJUERRANAl..) 4101SEC.)
MODEL 7 L±~ j4 - - -- H WHOM04 0DM) (16/1tC.p
L(TO On NLS
Figure 4. Real Time Operations (Sheet 2 of 3)
15
LI. -

c, v.czCUKMM'TE - W C vy c v (FROM G091P
(10/age.) iii OSITION 1/E.
--- 0. IunZ k.'RIR At ONG/CROIAI
TRtACK (TO I'OST-A14AL.)tO/SE(.,
e~x. CEY. CEZ. (FRMRORI
(1/SEC.c I
(I/O/SFC.
'rA T 'S E- .- b S T A T U S~ V k. k I~i t C .
IFoRfIATTE (FROM GOI~
STATUS. ETC.rio &'OSI ANAL)
Figure 4. Real Time Operations (Shoet 3 of 3)
16

For the lever arm calculations, the lever arm offsets (fixed during a run)
are transformed to components with respect to the ideal IMU reference axes
by rotation through the attitude angles. These components are then resolved
along the line-of-sight to each of the 5 satellites, using the satellite line-of-
sight directions which are pr computed. The resultant components along
the line-of-sight then represent range deviation for each of the 5 satellites.
IfPAA Antenna Patterns
For the IIPAA antenna attenuations, In the present configuration, the antenna
center line is assumed to be stabilizcd along the line-of-sight of the satellite to
which the beam is assigned. Therefore, attitude angles cf the aircraft have no
effect upon the pattern attenuations. l'altern attenuations for all satellite signals
are therefore set to 0 dB. Pattern attenuations for each of the 5 jammer
signals used (one for ea'h beam) are then determined by computing the cosine
of the angle between each janinier and its associated satellite, based upon L/S
direction data which is pre -colputed. The cosine of the angle is then used as
an entry to a look-up table which delineates the 11PAA beam pattern. Output
of the look up is the jammer signal attenuation In dB.
Range Correc:tions
Returning now to the lever arm range deviations which have been computed, a
third order curve fit p)rocess is used with the 0.1 second range values to obtain0 00
values of D, D, and D for each rangt deviation, which are each updated at00 •0
a 10 per second rate. The D values are added to the D comiuted for the basic0
range, resulting In the correct D Input to the I)FSA at a 10 per second Tate.
The D value transmitted to the I)FSA mus! also contain deviations resulting from
satellite and user clock errors. The value of D for these clock errors does not
have to be implemented, because the clock errors change slowly. The satellite
clock error Is represented by a second order polynomial. The user clock error
is also represented by a second order polynomial, along with an error rate term
17

which is proportional to aircraft acceleration along the crystal sensitive axis
(AXTAL). The zero order coefficients of the clock error models (initial time
errors) will be implemented by injecting the required range rate (D) during the
start-up procedure.
NAV Data Generation
The true satellite clock error coefficients, as implemented by operator selection,
along with the true ionosphere coefficients and the true ephemeris parameters, as
generated in the pre-computed portion, are summed with selected error coefficients
before being formatted for transmission to the SSGA basebands by the NAV data stream.
This group of error coefficients simulates the effect of ground station measurement
errors in the actual system. The value of each of these error quantities is completely
under the control of the simulation operator, and can be changed based upon a Z-count
schedule, similar to the way the NAV data is changed in the actual system.
Barometric Altimeter
The simulated baromettic altimeter output is based upon true height (I) and
vertical rate (Vv) inputs from the pre-computed portion, and the operator selected
coefficients of the barometric altimeter error model. The required output rate is
10 times per second. The error model includes the effects of:
Lag due to pilot static sensor
Lag due to the air data compater
Random low frequency noise
Variation in true height of isobar, resulting from water vapor content and
non-standard temperature gradients in the troposphere
IM U Simulation
True accelerations, inertial rates, and gravity variation from the pre-computed
portion, along with commanded inertial rates from the GDM, and gravity deviations
from the gravity anomaly model, are processed in relation to IMU error model18

coefficients which are selected by the operator, to generate simulated accelerometer
outputs (integrated acceleration) for transmission to the GDM at a 50 per second
rate. The actual computation is performed at a 10 per second rate. In order to match
the computing rate to the GDM data rate of 50 per second, inertial rate commands
are accumulated in groups of 5 to give an average rate command for the 0.1 second
intervali and the integrated acceleration outputs have 5 successive equal increments
to represent the actual integrated acceleration over the 0. 1 second interval. Deviations
resulting from lack of . 02 second granularity are completely negligible in the simulation.
The gravity anomaly model generates horizontal and vertical gravity anomalies which
are low frequency random noise with the effective correlation time inversely pro-
portional to aircraft horizontal speed. The generated gravity anomalies are added to
the true acceleration and gravity inputs.
The IMU error model also includes the effects of the following:
Gyro random drift rate
Gyro acceleration sensitive drift rate
Gyro bias drift rate
Gyro torquer scale error
Accelerometer bias error
Accelerometer scale error
GDM Instrumentation Errors
True height and vertical velocity from the pre-computed portion are compared to GDM
generated values to determine errors at a 10 per second rate to be stored and used for
the post-analysis.
To determine horizontal position errors, direction cosines of the vertical to
ECEF axes, as generated in the "truth" data, are compared to equivalent direction
cosines as generated in the GDM. From this data, the angular separation between
the true vertical and the indicated vertical is computed. The horizontal position error
19
LlJ

is then this angular separation (in radians) multiplied by the effective Earth radius.
This horizontal position error is then resolved into "along track" and "cross track"
components, at a 10 per second rate, for storage and use in the post-analysis.
To determine horizontal velocity errors, indicated velocities, with respect to wander
North and East, from the GDM, must first be rotated around the vertical by the wander
angle error, before being compared to the true wander North and Ea t components which
are pre-computed. The effective wander angle error is determined Ay comparing wander
North direction cosines as generated in tie GDM with those in the "truth" data, and then
multiplying the differences by true wander East direction cosines. The rotated values
of GDM velocity components are then compared to the true velocily components to
determine velocity errors along each horizontal axis. The errofs, generated ata
10 per second rate, resolved Into "along track" and "cross tracl" errors, are stored
for use in the post-analysis. 7/
Detailed Descriptions
Detailed descriptions of the various blocks of Figure 4 and tbhe actual implementation
information can be found in the computer program product 1 peclfication for the Data
Processor assembly (IrT Specification No. 1263058).
20

SECTION IMI
SYSTEM DESCRIPTION
The GPSE system block diagram is shown in Figure 5. It consists of the
following major elements:
* Control Display Assembly (CDA)
* Data Processor Assembly (DPA)
* Unit Device Controller Assembly (UDCA)
* Satellite Signal Generator Assembly (SSGA)
• Dynanic Frequency Synthesizer Assembly (DFSA)
* Jamming Generator Assembly (JGA)
• Signal Combiner/Noise Generator Assembly (SCA/NGA)
• Functional 'rest Assembly (FTA)
Frequency Standard Assembly (FSA)
GI)M Interface Module (GIMIM)
Refer to Figure 6 for typical installation of GPSE User Equipment
Performance Evaluator.
The CDA provides the primary operator Interface with the GPSE. From this
location, the operator can control all phases of the simulation. Speclfically,
the CDA operator will be able to:
* Perform the startup sequence
* Generate trajectory tapes
• Select error model parameters
* Run the real time mission
• Call up quick look displays during real time operation
* Collect data for post run analysis
* Perform post run analyses
The DPA consists of the following major elements (Figure 7 ):
PDP 11/70 with:
Cache memory
128K Word Core MemOry (interleaved)
Real Time Clock
Floating Point Unit
21
LiI
THI PA U-" Fl.-
22
,L0
-I i .. ...E F T:l

C,
00
z0
p-
ed t0wI,. z
z LUJ
-j >.
ac.
z2

100,
__! 0)
Is
242
a I..,
I i °
244
Vr

*44 M Wd Disk Pack Drive and Controller
* Magnetic Tape Unit and Controller plus 3 Expansion Drives
* RSXll-M Operating System
* Fortran 1V Plus
The I)iA with its associated software provides the mxins for driving the various
hardware elements comprising the GISE. The DPA can operate in the following modes:
Pre-computed Data (PCI)), Real Time Segment (RTS) and Post Run Data (PR)) under
operator control.
The UDCA performs the following primary functions:
* Receive digital data from I)I'A, buffer and transfer to other GPSE assemblies
• Receive digital data from other GI'SE assemblies, buffer and transfer to DI'A
* 1rovide an allernate GI'SE iian/inachine interface
" Irovide capability to 'e'xurcise,, GPSE assemblies without DPA
Data front the GI'SE hardware assenblie5 as well as the user equipment is collected by
the 1IJKA, reformatted, and sent to the I)IA, and vice versa, via a data bus interface.
The UDCA consists of the following elcliiti S:
* Processor Unit PDi1'1 11/04 CI'1I with 32K inviory
'rogrammiable Real Time Clock
General Device Interfaces
Serial line Interface
* CMID Terminal (1112i45A)
0 1/0 Controller Unit
The SSGA generates RF signals Identical to those of the actual GIIS Satellite, inasmuch
as the SSGA is composed of units elcttvit-ally identical to the actual GIS flight hardware.
The basic SSGA configuratloui containN five satellite simulators, each generating both
11 and L band signals as In the actual flight hardware. The principal difference is
that each band of each channel will have separate carrier and modulation sources so thatZ5

the various frequency dependent propagation effects can be simulated* Navigation data
such as satellite ephemerides, clock drift, etc., is input to the SSGA modulation
source via the UDCA data bus.
The DFSA provides independent carrier and code clock signals to each RF channel of the
SSGA, These signals are precisely phase controlled and monitored by the real time
software system so as to ensure an accurate and repeatable simulation of range
dynamics of the satellite/user paths.
The JGA provides four CW signals aid a I'N modulated RF signal so as to simulate up
to 5 jummers, with Individual J/S capability up to 67 dB. The JGA is capable of carrier
frequency coetrol by the real time program. This control can be used to simulate
a prescribed janine r frequency strategy.
The outputs of the SSGA and JGA arc fed to the SCA/NGA where they are combined with
an L-Band Gaussian white noise generator to create the total HF enviromnent. The noise
generator, in conjunction with level control of the satellite signal, provides a means
for controllably simulating the presence of a preamplifier that might be used in conjuncici
with the user vehicle antenna.
The FTA has the following capabilities:
* Monitor unit fault indicators and RF level outputs to actuate alarm
and send fault signal to DPA In event of system failure
* Isolate fault to a given drawer, and display location of faulty drawer
* Provide means for more detailed fault location
" Provide diagnostic capability means of digital voltmeter, power meter,
and spectrum analyzer
" Provide means for system timing synchronization
" Provide means for satellite signal code correlation with self-contained
reference code
26

- ------ '--I --- -- - - I I..
Fault detection is provided by the monitoring of a variety of DC voltages depicting
such observables as RF power level, power supply voltage, and phase lock loop status.
With these observations, detected faults can be automatically localized to the drawer
level where prescribed trouble shooting procedures, both manual and processor con-
trolled, can be invoked to Isolate and repair the failure. The required synchronization
of the GPSE clock with appropriate internal user events is achieved by shifting the
phase of the user clock input until proper synchronism is bbserved. Circuitry for
establishing and observing GPSE/User Synchronism is provided in the FTA.
The GDM[M provides the hardware means for interfacing with the GDM of the GPS User
Equipment. Its design is unique to the specific interface, and provides the GPSE with
a modular change capability to accommodate other users. This interface carries both
sensor data (i.e., IMU, altimeter, antenna control, and status) as well as instrumenta-
tion data between the GPSE and the GDM.
The SCA/NGA combines the satellite, jammer, and noise signals under processor
control so as to simulate the various propagation and antenna pattern.effects present.
The output of the SCA/NGA feeds the RF inputs of the GDM as well as the FTA. The
latter provides a means for calibrating and monitoring the RF signals.
The FSA provides the basic reference clock (5 MHz) used by both the GPSE and the
User Equipment. The use of a common clock reference provides a means for controllably
and repeatably introducing prescribed clock errors into the system, if desired.
27

SYSTEM PERFORMANCE CHARACTERISTICS
The GPSE performance can be characterized in terms of the following two
simulation elements: physical dynamics and signal characteristics.
Tables 1 and 2 show the vehicle and jammer dynamic simulation capabil-
ities, respectively. In order to ensure precise evaluation, the accumulated
range delay error over a 10-hour period will be less than 0.1 meters. Lever
arm effects due to displacement of the antenna from the center of motion of
up to 5 meters can be simulated, for roll rates up to 400 degrees per second
at acceleration up to 1,200 degrees per second. Table 3 shows the major
signal characteristics of the GPSE.
TABLE 1. USER VEHtICLE DYNAMICS
Velocity (Meters/Sec) 0-6500
Acceleration (Meters/Sec) 0-100
Jerk (Meters/See3 ) 0-100
Angular Ratt! (Degrees/Sec)
Roll 0-400
Pitch 0-100
Yaw 0-150
TABLE 2. JAMMER VEICLE DYNAMICS
Velocity (Meters/See) 0-600
Acceleration (Meters/See 2) 0-20
Jerk (Meters/Sec 3 ) 0-100
28
L A .. .... . . .. .... .. . ..

.. _ -...... ... . - ~ .. . ........-- - - .... ..... . ....... . ... .... . •. ..._
I
!!i =1i'
I!,

SECTION IV
HARDWARE CONFIGURATION
The GPSE, exclusive of the DPA and its peripherals, will be housed in three
cabinet units as shown In Figures 1 and 8. The partitioning of functions is
chosen so as to optihize electromagnetic compatibility between reference
signals (unit 1), jamming and digital control signals (unit 2), and satellite
signals (unit 3).
30

&PLI262901GI IPL1262902G I 6PL1262903G I
UNIT NO.I UNIT NO.2 UNIT NO.3
POWER SUPPLY POWER SUPPL'((DFSA) POWER SUPPLY
POWER SUPPLYDYN FREQ SYNDRAWER NO. I ILANK PANEL
(DFSA)
STATUS AND
SYNCHRONIZATIONPD 1 1/04 (FTA)
(UOCA)
DYN FREQ SYNDRAWER NO.2
(Di SA)ALT SYNC VO 1ASEBAND
(SSGA)
DYN FREQ SYN INPUT/OUTPUTDRAWER NO.3 CONIkOLLER PATCH PANEL
(UDCA)
BLANK PANEL SIGNAL COMBINLR
BLANK PANEL NOISE GENERATORJAMMING (SCA)
FREQ STANDARD GENERATOR ASSY
(FSA) (JGA)
DISTR AMP SATELI TEI(FSA) S iNAL COM6 INRE
IRIG TIME CODE GEN ( A)
(FSA) FREQ. SOURCFS/SSr'JAMMER CHANNEL I AtND 2
SIGNAL COMBINER (SSGA)(SCA) SATELLITE SIG GENBLANK PANEL CHANNEL 3 AND 4
(SSGA)
SATELLITE SIG GENCHANNEL 5 (EXP)
POWER SUPPLY (SSGA)
BLOWERIILCWERt
BLANK PANEL
Figure 8. GPSE Hardware Configuration, (Diagram)
31
L"- .. ..l . , ,

SECTION V
SOFTWARE CONFIGURATION
The GPSE software system consists of two major sets of programs, namely: UDCA
programs and DPA programs. The DPA programs are responsible for the simu-
lation computations, real time control and subsequent analysis. The UDCA programs
are responsible for the transfer of data between DPA and the rest of GPSE hardware
assemblies and for control and execution of hardware test and maintenance programs.
UDCA PROGRAMS
The UDCA Computer Program runs as a task on PDP 11/04 processor. The program
was developed on PDP 11/70 computer system with RSX-11/M operating system.
The operator interaction, when required, is done via the Control Monitor and
Display (CMD) terminal (HP2645A) interfaced to the UDCA. The program is designed
to accomplish all real time and off-line software functions necessary to perform the
following tasks.
" Transfer in real time all data received from the Data Processing Assembly
" (DPA) to the hardware assemblies of the GPSE and to the GPS User Equipment.
0 Transfer in real time all data received from the GPSE hardware assemblies
and from the GPS User Equipment to the DPA.
0 Control the synchronization and calibration of all GPSE assemblies with
the GPS User Equipment.
* Exercise each hardware assembly of the GPSE, one at a time, by introducing
known inputs and capturing the resultant outputs in real time. This is known
as Test Integration and Maintenance (TIM) mode.
In the test and maintenance mode, the UDCA software provides a means for exer-
cising the various hardware assemblies comprising the GPSE. These exercises
are stored on cassette tapes and are designed to enable verification of the correct
operation of the various assemblies.
32

This operating mode enables efficient separation of system software problems from
hardware problems, thereby expediting the maintenance activity. The run up and
calibration mode supports the synchronization of the GPSE/User combination. In this
procedure the UDCA supplies the timing control to the DPA that is required to simulate
the sensor outputs to the user equipment under test in precise synchronism with the
RF signal timing. In addition, the UDCA calibration mode is used to provide the out-
put control processes by which the various calibration procedures are performed.
This includes RF level, frequency, and timing.
The real time data transfer mode is the primary operational mode of the UDCA. In
this mode, the UDCA gathers, formats, and distributes data between the DPA, the
GPSE hardware assemblies, and the User Equipment. The specific GPSE assemblies
involved are: DFSA, SSGA, SCA, FTA, and GDMIM.
Further details of the functions performed and the actual implementation can be found
in the computer program product specification and the user's manual (ITT Specification
1263057).
DPA PROGRAMS
The primary functions of the DPA software are to perform the digital calculations
required in the simulation (implementation of GPSE math model) of the GPS environ-
ment and the User Equipment sensors. The DPA interfaces with the Control Display
Assembly (CDA) for the purpose of communication with the system operator.
The DPA shall additionally Interface with the UDCA for the purpose of communication
with the rest of the GPSE assemblies.
The design of the computer programs was based on the following objectives:
* Segmented Program Structure
• Modular Functional Design
0 Modular Data Bass
33
L ., . , ,•. .. .

* Simulation efficiency and flexibility
* Efficient man/machine interface
The DPA programs are written in Rational FORTRAN and, at present, are designed
to operate with PDP 11/70 Computer System and RSX-11M Operating System. However,they could be adapted to other computer systems with minor modifications.
The DPA Program is configured as 4 distinct software segments entitled:
* System start-up (SSU)
* Pre-computed simulation (PCS)
* Real time simulation (R'1S)
" Post run analysis (PRA)
Each segment consists of a series of interrelated RSX-11M tasks. Each task consists
of a number of CPC's, comprising a main program and a hierarchy of subroutines and
functions.
Intertask and interseguent communication takes place through use of a shared global
common data region. Task management is performed through the issuance of directives
to the RSX-1lM Operating System. The inter relationship between various DPA soft-
ware segments is Illustrated in Figure 9. The functional assignments of each of
the segments are described in the subsequent paragraphs. Fnrther details of
assignments and the actual implementation can be found in the DPA computer
program product specification (ITT Specification 1262991).
START-UP SEGMENT
The DPACI' start-up segment is responsible for interacting with the system operator
during initial system start-up. Th is interaction is carried on through the CDA
(1P2ti45A) and shall occur regardless of whether the DPA Is to be used to support
a pre-computed run, a real time slmulationor a post run analysis. The start-up
segment performs the following specific functions:
34

via
ha-
to U
24 .4 I.
I III,4
1:A'< Iw
t:I
~j I 1 -35

a. The start-up segment communicates with the system operator via the CDA
in order to establish the type of run to be made and the data files required
for that run.
b. The start-up segment verifies that the system equipment configuration is
appropriate for the task to be performed. Ira the case of a real time run,
this includes verification of the presence and readiness of GPSE hardware.
c, If data files are required for the rtn, the start-up segment requests the
operator to identify those files and shall verify that the requested files
exist. It shall also load those files into memory.
d. The start-up segment is responsible for establishing DPA synchronization
with the UDCA.
e. The start-up segment communicates with the operator via the CDA in order
to request tapes be mounted on the appropriate tape drives.
f. The start-up segment passes control to either the pre-computed segment,
real time segment, or post run segment when it has completed its other
functions.
PRE-COMPUTED SEGMENT
The DPACP pre-computed segment is responsible for performing the precision
calculations required to define user vehicle, satellite vehicle, and jammer vehicle
trajectories. Pre-computation of this data eases the throughput requirements
placed upon the DPA during the real time simulation. The data flow between pre-
computed segment and other segments and devices is illustrated in Figure 10.
The pre-computed segment performs the following functions:
a. The pre-computed segment interfaces with the control display assembly
for the purpose of accepting system operator inputs and for the purpose of
providing information to the system operator concerning the status of the
pre-computed run at any given time while it is executing.
b. The pre-computed segment interfaces with the pre-computed data (PCD)
tape for the purpose of recording the pre-computed data for later use by
the real time and post run segments.
36

crii
IE1
37.

c. The pre-computed segment accesses data prestored in core by the start-up
segment for the purpose of reading initial condition Information.
d. The pre-computed segment calculates the user vehicle trajectory based
upon prestored inputs. It provides user vehicle position, velocity, accel-
eration, and attitude data. This data is computed at a rate of 10 times per
simulated second.
e. The pre-computed segment simulates an ideal IMU in the user vehicle. It
provides specific force data, platform rotation data, and body attitude data.
This data is computed at rates of 10 and 50 times per simulated second as
appropriate.
f. The pre-computed segment simulates user antenna lever arm motion and
calculates antenna position. This data is computed at a rate of 10 times
per simulated second.
g. The pre-computed segment calculates the satellite vehicle trajectories based
upon prestored ephemeris inputs. It provides the user antenna to satellite
true ranges and line-of-sight directions. This data is computed at 10 times
per simulated second.
h. The pre-computed segment calculates satellite clock drifts, atmospheric
propagation delays, and signal atteauation. It also calculates signal equiv-
alent ranges and range derivatives. This data is computed at 10 times and
I time per simulated second as appropriate.
REAL TIME SEGMENT
The DPACP real time segment is responsible for performing those calcu-
lations required by the real time simulation and not already performed by
the pre-computed segment. This consists primarily of the implementation
of the various error models and the real time manipulation of data in order
to respond to the requirements of the GDM and other system elements. The
data flow between real time segment and other segments and devices is
illustrated in Figure 1L The real time segment shall perform the following
specific functions:
38

$]Ida
E00
00
00000C0
A(IOP -
I00
39

a. The real time segment interfaces with the control display assembly for the
purpose of accepting system operator inputs (commands) and for the purpose
of displaying data to the system operator during the real time simulation.
b. The real time segment interfaces with the PCD tape for the purpose of
reading the pre-computed data. The PCD tape is read at a rate that will
satisfy the real time requirements of the simulation. The real time segment
shall additionally verify that all reels of a multi-reel PCD tape are in fact
continuations of that same tape and are therefore applicable to the run in
progress.
c. The real time segment interfaces with the post run data (PRD) tape for the
purpose of recording the data generated during the real time simulation run.
The data written to the PRD tape shall be identifiable as having resulted
from data contained on the specific PCD tape used for the subject run.
d. The real time segment accesses data prestored in core by the start-up seg-
ment for initial condition information and parameter definition. Such files,
in conjunction with the PCD tape, provide the bulk of the input data required
by the real time segment.
e. The real time segment includes a gravity perturbation model, an IMU model
which includes accelerometer, gyro, and resolver error sources, and a
barometric altimeter error model. The real time segment also includes a
user clock drift model.
f. The real time segment includes an antenna pattern model (HPAA, isotrophic,
and hemispheric).
g. The real time segment shall include a satellite data formatter which shall
structt'-o the five subframes of data transmitted by each satellite.
h. The rea: time segment interfaces with the unit device controller assembly
(UDCA) for the purpose of transmitting data to the GDM and other elements
of the GPSE. Additionally, the real time segment receives data from the
GDM and the other elements of the GPSE via this interface.
1. The real time segment Interfaces with the TRIG timc code generator for the
purpose of recording TRIG B time code data on the post run data (PRD) tape.
40
't. -

POST RUN SEGMENT
The DPACP post run segment is responsible for performing statistical analyses
in a non-real time environment on the data generated during a real time simula-
tion. This involves the comparison of GDM generated data with simulated "truth"
data (pre-computed and real time). Additionally, the post run segment shall oro-
vide the system operator with a means of viewing the contents of both the PCD and
PRD tapes. The data flow between post run segment and other segments and de-
vices is illustrated in Figure 12. The post run segment performs the following
specific functions.
a. The post run segment interfaces with the control display assembly for thepurpose of accepting system operator inputs (commands) and for the purpose
of displaying data to the system uperator during a post run analysis.
b. The post run segment interfaces with the PCD tape for the purpose of reading
the pre-computed data. The post run segment verifies that all reels of a
multi-reel PCD tape are in fact continuations of that same tape and are
therefore applicable to the post run analysis in progress.
c. The post run segment interfaces with the PRD tape for the purpose of reading
the real time data. The post run segment verifies that all reels of a multi-
reel PRI) tape are in fact continuations of that same tape and are therefore
applicable to the post run analysis in progress. The post run segment also
verifies that the particular combination of PCD and PRD tapes being analyzed
is compatible.
d. The post run segment performs data time correlation between the data read
from the PCD tape and the data read from the PRD tape. This insures that
all statistical and error computations are performed on data referenced to
the same point in time.
e. The post run segment performs error and statistical computations for the
purpose of evaluating the performance of the GDM during the real time
simulation.
f. The post run segment provides the system operator with the capability to
direct the results of the post run analysis to the CDA and/or to a line printer.g. The post run segment provides the system operator with the capability to
search out specific records on either the PCD or PRD tape and to display
record data on the CDA or a line printer.
41
L .^f A

GDo
402
42

SECTION VI
SYSTEM TEST PLAN
The test method chosen to test the GPS Evaluator is commonly called the "Building
Block Technique". Using this technique, a system evolves from a small nucleus
subsystem by the addition of functional assemblies, similar to that depicted in
Figure 13. At the hub of the nucleus is the UDCA. Special test software and data
were introduced by the UDCA to exercise each functional assembly or configuration
item (CI) under test to prove that the CI meets related B1 specification requirements.
The same software and the tests later formed the basis for the subsequent evaluation
of this assembly as it was integrated into the growing system. The only exceptions
to this were two Cl's, namely: UDCA and DPA. These CI tests were performed by
Digital Equipment Corporation using DEC diagnostic programs.
The test programs for the subsequent Cl's did, when required, rely upon or
utilize the previously assembled Cl's. The CI tests were followed by a subsystem
test. The subsystem test, utilizing the subsets of DPA programs, exercised
one or more CI's to prove that they meet the requ1iements of GPSE system.
Upon completion of the system evolution, prior to shipment to AFAL, preliminary
Acceptance Tests were performed on the totally Integrated GPS Evaluator system.
Upon preliminary inspection and installation at AFAL, the GPSE and the GDM
of GPS User Equipment were integrated and the final testing of the GPSE was
performed. The CI acceptance tests, subsystem tests, and the integration tests
were conducted according to Government approved test plans and test procedures.
SOFTWARE TEST PLAN
As previously described, the DPA and the UDCA programs are subdivided into various
Computer Program Components (CPC) determined by each of the functions to be
performed. Hierarchies of these CPC's are combined into functional units. These
functional units are similarly combined to form tasks and the tasks in turn form
into segments. The structure of a typical segment is illustrated in Figure 13.
43

ILx
00
qg..
fr44

The test plan recognized the functional unit as the basic item under test. Each
of the functional units was tested stand-along and then integrated in a top down
hierarchical manner. Accordingly, three levels of testing were defined. Each
of the tests for all of the functional units, segments, and the programs was carried
out according to a previously approved test plan.
a. Unit Testing. The purpose of unit testing is to establish the integrity
of the functio.ial unit under test as an entity. Unit testing involved testing
of all the CPC's comprising the unit. Unit testing ensured the following objec-
tives were met:
* That the functional unit fulfills the requirements stated in its applicable
specification, and has been coded in accordance with that specification
* That the source code conforms to a uniform stylistic convention, and
attains an adequate standard of readability
* That all paths of execution within the functional unit have been exercised,
and found to operate normally
* That data inputs/outputs required for interface to other functional units
are present
* That the sizes and/or execution times of certain critical functional units
do not exceed permissible limits
* That error conditions are properly handled
b. integration Testing. The purpose of the integration testing is to verify that
the functional unit programs properly interface, that the program does operate
in its intended software environment, and that "all functions are performed as
required. Testing will be consistent with the top down method of computer program
development in which the top level is developed first and the immediate lower levels
are represented by "stubs". When testing of the top level module has been success-
fully completed, its stub are replaced with next level modules. The integration
and test of the program modules proceeds in like manner to the lowest level module.
45

Test tools, Including environmental simulation programs and program stubs,
were previously specified and approved. The tests were designed to meet
the following objectives:
* Data passage section, functional units is correct
* The control logic for the sequential operation of the functional units
Is correct
* I/O timing requirements of each task (if any) are met
c. System Integration Testing. The system integration tests are designed
to verify that the computer program successfully meets the requirements of
the software specifications when operated with hardware system under opera-
tional environment. The operational environment for testing, the tests to be
performed, and required results were specified in the system test plan.
46
i *. .*

SECTION VIE
OPERATIONS AND MAINTENANCE
The GPS Evaluator system has been developed utilizing latest design techniques so
that the system is easy to operate and maintain and also adaptable to various user
equipment. However, lke many other systems of such magnitude and complexity,
routine maintenance and occasional repairs must be anticipated. Also, personnel
must be trained to operate such a system properly and efficiently. These require-
ments were always kept in sight during the complete development and design phase
of the GPSE project. Such planning resulted in the production of the following
specific learning/training tools (documentation) apart from the required hard-
ware and software functional/product specifications.
GPSE Operation and Maintenance Manual
DPA User's Manual
UDCA User's Manual
Operations and Maintenance Training
GPSE OPERATIONS AND MAINTENANCE MANUAL
The GPSE consists of two types of assemblies/subsystems.
a. Off-the-Shelf Purchased Assemblies: These primarily consisted of
the computer (hardware and software) systems; namely PDP 11/70 and
PDP 11/04, the Frequency Source, the IRIG Time Code Generator, etc. The
documentation generated and supplied by the vendors was supplied to the govern-
ment for any future maintenance.
b. Special Design Assemblies: These assemblies were specially designed
for the GPSE system by ITT or subcontract engineers. Operation and maintenance
information was generated for each of the assemblies and modules contained therein.
The assignments for this effort were made during the design stage to each of the task
leaders. The document generated contained at least the following information re-
garding each of the assemblies.
47

* Applicable documents/drawings
0 Equipment (Functional and Physical) description
0 Theory of operation
* Interface definition
* Test/Trouble shooting procedure
The GPSE Operations and Maintenance (0 & M) Manual consists of system operation
instructions, preventive maintenance, and calibration instructions and the assembly/
module operation and maintenance information (as described above). The 0 & M
Manual Is complemented by a handy, easy to use handbook containing all applicable
drawings referenced. The drawings are reduced to "B" size for ease of handling.
SOFTWARE (DPA AND UDCA) USER'S MANUAL
The software tasks were treated in a similar manner as the hardware tasks. All
the off-the-shelf software purchased (namely, RSX-11M Operating System) was
accompanied by the documentation supplied by vendor (Digital Equipment Corp.).
Software User's Manuals for both DPA and UDCA computer programs were generated.
The following major topics were covered:
• Software capabilities and structure
* Primary output media and formats
• Primary input media and format
* Operating Instructions
* Maintenance Procedures
OPERATIONS AND MAINTENANCE TRAINING
A four-week long operations and maintenance training program was conducted
during the final system integration and testing phase. The training planning
information containing the course objective, schedule, and the student qualifications
was generated and approved by AFAL prior to the actual training.
4h

The presentations regarding each of the major assemblies and computer programs
were made by the same engineers who designed the hardware and software. Each
of the class-room sessions was followed by actual demonstration in the GPSE
test laboratory.
4U

SECTION VII
GPSE-GDM TESTS
Upon completion of system integration, the GPSE system was interfaced to the
General Development Model (GDM) of GPS User Equipment as part of acceptance
test. The GDM was procured by the Air Force Avionics Laboratory, Dayton,
Ohio.
Initil interface tests to~ok place at ITT Defense Coniunic ations Division's facility
at Nutley, New Jersey. GPSE-GDM interface, as defined by the Interface control
document ITT specification no. 1263099, was at first clucked out for mechanical
and electrical compatibility. Both the GIPSE and GDM systems were then shipped
to Air Force Avionics Laboratory located at Wright Patterson Air Force Base In
)ayton, Ohio.
Both systems were then installed Mnd inLd')Cndlltlty checked out. All of the system
integration tests for the G.1SE assemblies were repeated as part of installation tests.
The GPSE then was interfaced to the GDM and, after initial cheek-out, final
acceptance tests were conducted according to the G PSE Acceptauce Test Plano
(ITT Specification no. 1263650).
ACCFiP'ANCE TEST
The acceptance tests were dsignied to demonstrate that:
* GIPSE hardware and soft\\are meets or exceeds the perforanuce
specification required by PSE sYstem specification (ITT Speciflcation
1263016)
0 GP SE can simulate user motion up to 10 hours duration without any
hardwt\arc malfunction
* 6PSE hardware and software arc reliable and repeatable
0 G1SE meets the hardware and software requirements of GI)M
50

ACCEPTANCE TEST REPORT
The acceptance tests were conducted in the presence of AFAL personnel and
the results were documented in the Acceptance Test Report (ITT Specification
No. 1263660).
In the course of the tests it was discovered that the PRN (Baseband) code correlator,
as it was designed, would not work reliably and was not repeatable. The design
principle was fine. However, the practical limitation of implementation inhibited
it from being consistent from baseI)and to baseband. An alternate procedure,
however, was developed which proved to be accurate (as the Baseband Correlator
would have been) and reliable. The procedure was documented in Baseband
Correlation Procedure (ITT Specification No. 1263653).
The rest of the test results show that the GPSE does meet the requirements
descrited in the previous paragraph. However, the tests as to the navigation
accuracy were non-conclusive due to the wireliability and unavailability of the
GDM system. It is expected that the attempts to check the navigation accuracy
of the GPSE shall continue and also that GPSE shall be proved to be truthful,
reliable, and repeatable.
51

SECTION IX
CONCLUSIONS AND RECOMMENDATIONS
The GPSE project successfully proved that it is possible to simulate complete
GPS environment including dynamic jamming and User Equipment instrumentation*
This was never done before. The GPSE would prove to be a valuable tool to
validate and, particularly, evaluate future GPS User Equipment systems. The
GPSE experience would be valuable in that it would lead to better and more cost
effective UE test systems in the future,. The GPSE at present would provide
a cheaper (although not so good) alternative to flight test the GPS User Equipment.
Despite the success, however, as in any other research and development projects,
many lessons were learned and recommendations were made which should be use-
ful in improving the GPSE or in specifying future test equipments. A few of the
recommendations are listed below:
* Automatic Satellite Selection:
The satellite code select plugs have to be physically changed every
time a new satellite has to be simulated. A simple modification can
bring this selection under computer (UDCA) control, thus making the
job of GPSE operator much easier and less time consuming.
* Automatic GPSE-UE Synchronization:
The present design requires operator intervention. This can also
be brought under UDCA control with minimal change.
0 Automatic Baseband Correlation:
The present design requires the operator to align all five basebands
with a reference baseband in order to minimize initial range error
(an offset). Although somewhat complex, it is possible to utilize the U|)CA
computer to perform this function, too. This would not only be less Lime
consuming, but also make GPSE simulation more consistent and repeatable.
52

Improved Jammers:
The present GPSE Jammers and noise generator could be made more com-
plex, thereby providing for a more sophisticated hostile environment.
o Increase Satellite Generatorsi
The GPSE effectively simulates four satellites (fifth one is used
for changeover), which Is the minimum GPS requirement for position
resolution in real time. Under the UPS orbit configuration, it is
poesible to have as many as 11 satellites in view. This would require
UE to select four out of up to eleven satellites. The prcsent GPSE
configuration does not check this (UE) algorithm.
ncrease Choice of Antenna Types:
The GPSE, at present, gives a choice of three antenna typess isotropi.,
hemispheri and IIPAA. 'Thds, in the future, could be increased or
improved very easily.
53
..........

774
APPENDIX A
TRADE-OFF ANALYSIS
LEVER ARM EFFECTS
A-1

GENERAL BACKGROUND
Lever arm effects arise during attitude changes of an aircraft because of the
displacement of the antenna from the aircraft center of gravity. Incremental
velocity components are induced at the antenna which are the product of the
lever arm displacement by the body rotation rate about axes orthogonal to the
lever arm vector. These induced velocities introduce doppler changes in a
signal being received from a relatively stationary source such as a satellite.
Because of the large body rotation rates and accelerations, these doppler
changes, if uncompensated, can cause the carrier tracking loops in the user
receiver to lose lock. The simulation must therefore generate a model of these
doppler changes, which accurately represents the real world situation, in order
to test the effect of these changes upon the user receiver under the most severe
body rotation environment to be encountered in the real world.
BASIS FOR TRADE OFF
* Real time processing load
* Capabilities of DFSA
* Fidelity of simulation of dynamics in computed output
* Maximum Texibility and legacy
CONCLUSIONS
The selected approach for simulation of lever arm effects, based upon the results0 as*.
of this analysis, is to compute range derivatives (D, D, D) at an update rate of
10 per second, using a third order curve fit to range deviation values computed
at the same rate of 10 per second. This is based on the following considerations:
a. The real time processing load is minimized by the use of a computing
time interval (Tc) equal to 0. 1 seconds for lever arm effects. This is
the same value used for center of gravity motion in the pre-computed
portion.
b. The range acceleration and Jerk capabilities of the DFSA are adequate
to provide for a lever arm displacement of 5 meters under the most
severe dynamic environment.
A-2

c. The use of jerk inputs, at the update rate of 10 per second, produces
a range rate (D) profile which closely matches the real world profile,
with no discontinuities In D.
d. The approach derived from this analysis for simulation of lever arm
effects can be easily extended to missile applications (more severe
dynamics but smaller lever arms), and is applicable to any type of
user equipment.
ANALYSIS
a. Body Rotation Environment
The GPSE specification lists the maximum body rotation rate (about
the roll axis) as 400 degrees per second. Information from AFAL
sets a limit on roll acceleration at 1200 degrees per second squared.
These limits have been used to generate a worst case roll angle profile
which is plotted in Figure A-1.
The maximum roll rate of 400 deg/sec corresponds to 7 radians per
second. If AL is the lever arm displacement in meters, then the
centripetal acceleration at the antenna, at the maximum roll rate, is
given by:
A = (7)2 x LL meters/sec2
From physical strength considerations of the actual antenna structure,
a reasonable value of this maximum acceleration is 250 meters/sec 2
(approx. 25 g). Under this restriction, the maximum value of A Lto be used for the maximum roll rate conditions would be:
(/_ 250 ~L) 2 50 % 5 meters(A)max 49
Accordingly, a lever arm displacement of 5 meters, either along the
aircraft vertical axis or along the wing axis, has been used in this
trade off analysis, along with the roll angle profile of Figure A-1.
The line-of-sight has been assumed to be in the vertical direction.
A-3

iT~~~r T 41~
4~-
-4*~ ~ ~
t
f4
.4-
gai; i.
T1
Figure A-. es4 to osase Roll Maneuver

b. Trade Off Parameters
From other simulation considerations, including processing time for
the real time portion and tape storage capability for the pre-computed
portion, the computing time interval, Tc, has been selected to be 0. 1
seconds. This time is also the time between updates to the DFSA. This
correspondence between the pre-computed interval and the real time
Interval greatly simplifies the software design. For purposes of this
trade off analysis, we have used this same value of Tc , although the
fidelity of the generated velocity profile can obviously be improved by
shortening the interval.
We have considered two alternatives, A and B. For alternative, A,0 08
values of D and D are computed for the lever arm effects by the para-
bolic curve fit formulas listed in the GPSE Math model on page A-13 of@ *0 GOD
Appendix I. For alternative B, values of D, D and D are computed by
the 3rd order curve fit formulas listed on page 1-4 of Appendix 11. In
both cases, the value of 0. 1 seconds is used for Tc .
Alternative A obviously requires less software and computing time than
does alternative B. On the other hand, the fidelity of the D profile is
considerably better for alternative B than it is for alternative A.
For each alternative, the resulting D profile is calculated for each of
the two lever arm displacement alternatives (along aircraft vertical or
along the wing axis).
A. TRADE OFF ANALYSIS RESULTS
For each of the 4 possible conditions, the values of:
t time from start of maneuver (sec)
R roll angle (degrees)
LOS lever arm displacement along line of sight (meters)
D, V, D =inputs to DFSA (meters/sec, etc.)
are tabulated in the following:
A-5

Alternative A - No jerk term - Displacement along wing axis
t R LOS D D
-0.2 -88 -4.997 0 0
-0. 1 -88 -4.997 -. 023 0.46
0 -88 -4.997 -. 250 6.82
0.1 -86 -4.988 -. 630 39.86
0.2 -76 -4.851 2.567 109.93
0.3 -54 -4.045 16.815 130.69
0.4 -20 -1.710 34.202 0
0.5 20 1.710 29.884 -130.69
0.6 54 4.045 13.561 -109.93
0.7 76 4.851 3.357 -39.86
0.8 86 4.988 .432 -6.82
0.9 88 4.997 .023 -0.46
1.0 88 4.997 0 0
1.1 88 4.997 0 0
Alternative A - No jerk term - Displacement along aircraft vertical
t R LOS D D
-0.2 -88 -. 174 0 0
-0.1 -88 -. 174 .436 -8.71
0 -88 -. 174 .409 -43.04
0.1 -86 -. 349 -4.721 -77.75
0.2 -76 -1.210 -15.046 -44.94
0.3 -54 -2.939 -21.919 86.47
0.4 -20 -4.698 -8.798 175.95
0.5 20 -4.698 13.272 86.47
0.6 54 -2.939 19.540 -44.94
0.7 76 -1.210 12.496 -77.75
0.8 86 -. 349 3.895 -43.04
0.9 88 -. 174 .436 -8.71
1.0 88 -. 174 0 0
1.1 88 -. 174 0 0
A-6

Alternative B - With jerk - Displacement along wing axis
t R IL LOS D D D
-0.3 -88 -4.997 0 0 0
-0.2 -88 -4.997 0 0.15 -5
-0. 1 -88 -4.997 -. 008 1.51 -41
0 -88 -4.997 -. 060 4.36 -40
0.1 -86 -4.988 .177 3.82 597
0.2 -76 -4. 851 3.546 34.78 1667
0.3 -54 -4.045 15.361 167.47 -231
0.4 -20 -1.710 30.954 194.87 -3897
0.5 20 1.710 30.954 -144.39 -231
0.6 54 4.045 15.361 -201.52 1667
0.7 76 4.851 3.546 -63.56 597
0.8 86 4.988 .177 -0.38 -40
0.9 88 4.997 -. 060 2.57 -41
1.0 88 4.997 -. IS 0.30 -5
1.1 88 4.997 0 0 0
1.2 88 4.997 0 0 0
A-7

Alternative B - With jerk - Displacement along aircraft verticalA e DI *ID
t R ALOS D D D
-0.3 -88 -. 174 0 0 0
-0.2 -88 -. 174 0 -2.90 87
-0.1 -88 -. 174 .14,5 0.18 -92
0 -88 -. 174 -.299 -0.66 -846
0.1 -86 -. 349 -4.597 -62.66 -527
0.2 -76 -1.210 -13.498 -105.00 873
0.3 -54 -2.939 -19.634 -64.57 3160
0.4 -20 -4.698 -10.289 205.78 0
0.5 20 -4.698 10.289 251.47 -3160
0.6 54 -2.939 19.634 -17.73 -873
0.7 76 -1.210 13.498 -115.35 527
0. 8 86 -. 349 4.597 -85.30 846
0.9 88 -. 174 .299 -9.07 92
1.0 88 -. 174 -. 145 5.81 -87
1. 1 88 -. 174 0 0 0
1.2 88 -. 174 0 0 0
The D profiles, derived from the preceding tables, are plotted for the 4 test
conditions in Figures A-2, 3, 4 and 5. Note that, for alternative A (Figures
A-2, A-3), there are 1) discontinuities at the 0. 1 second transition points,
amounting to as nuch as -1 or 5 meters per second. For alternative B (Figures
A-4, A-5), there are no 1) discontinuities, but there are discontinuities In D.
In order to better illustrate these ) discontinuities, the D profiles are plotted
for the I test conditions in Figuirt s A-6 and A-7 (solid line for alternative B
and dotted lines for alternative A). Note that the D discontinuities are as high
22as 130 meters/see for alternative A, and as high as 50 meters/sec2 for
alternative B.
A-8

Comparing Figures A-2 and A-3 with their counterparts in Figures A-4 and A-5,
It is seen that alternative B gives a much smoother ) profile than does alter-
native A. It should be pointed out, however, that integration of the ID profile,
for any of the alternatives, always gives the precisely correct value of A LOS
at the 0. 1 second time marks.
We have consulted with CSDL on the performance characteristics of the DFSA,
in regard to the effect upon performnce of the derivative discontinuities anda& #e
the increased D and D limits. They feel strongly that there will be no problem
in breaking lock in their phase locked loops under these conditions for either of
the alternatives.
A-9

*4 t ;
~~~~~~~~. . . .....-- - . u . ~ . . . I
I~ . .....
Figurti A-2. AlttornaUv3 A (Shooit I of 2)A- 10

....~ : ; : -.H : ... ,t / • _
-o - .. .
i . A n A
-I: . . . .] -. : .. .-"
.. . . . . . .,. . . ... .. i*
... .. . .. . .. ... .. . .oT ..~q
I ,I
A-11
* .i l DI . . . .

_ r
~ T
~~i11f~t. f 1 -1~-'- 1 , 9 1I -f 1 1 -
4 4-
7t~r
i-.ti
tf~~~fJ t,~ 1
- tl fP
KK4
Figure A-4. Alternative B (Sheet I of 2) IA-12

... .iq 'l .. i- A ! Il . : ,,e
* l I . I
-T L
4 fl: 1
j44
" ' 'i_ I , . i
1 4 -I , .
_ __7. ,- ., ' .q.
'K ..- I.. .. ... . . ..4.. .. .+....:;-, , 4.
A-I3It
I .+. .j- "'i~ 4

171
1~~ 7t*
I t.
0 i-e
I f~
f v 4.t
444
A1,4

7- 4 T p
4j1
7 ~~ 1 id74fr1;
t - T ~ t .
504i1 4 .4 47
M I~
LI j' t :4+ t't
+j
..... ....4 ....
Figure A-7. D Profiles (Sheet 2 of 2)A-15

APPENDIX B
POST RUN PROCESSING CONCEPT STUDY
B-I

INTRODUCTION
This appendix presents the functional concepts that are planned for use In gener-
ating the post run processing DPA software for the GPS Evaluator System as
applied to the GDM User Equipment. The type of data to be collected, as well
as the type of analyses that are planned, are presented.
The post run analysis (PRA) will be divided into two major tasks:
0 PRA for Navigation Mode
0 PRA for Specification Validation Mode
Concepts for the two modes will be discussed separately.
B-2
-. - - -. - ___,

PRA FOR NAVIGATION MODE
Truth data for user aircraft position and velocity will be stored on the pre-
computed tape. Similar data, as generated by the GDM, will be time tagged
and stored, during the run, on the PRA tape. For the post run analysis, data
from the two tapes will be read off and processed.
Attitude data (sine and cosine of azimuth, pitch, and roll) will also be present
on the pre-computed data. However, the GDM being tested does not generate
its own attitude data. The unit under test simply reads attitude outputs from
the IMU simulator, which is part of the GPS Evaluator. Therefore, a post
run analysis of attitude data would simply indicate what the GPSE is doing, and
would not be dependent upon any performance capability of the GDM unit being
tested. Because of this, post run analysis of attitude data can be omitted.
The GPSE and the GDM being tested will be time synchronized, before the start
of the run, such that the truth data from the GPSE and the instrumentation data
from the GDM will both always be referred to integral 100 millisecond time
tags. The post run analysis will simply match up these time tags before com.
parison to determine error quantities. Since the time tags will be precisely
synchronized, no interpolation process will be required.
The truth data on the pre-computed tape, relating to user aircraft position and
velocity, will consist of the following:
Every 100 Milliseconds
'lime tag t
Aircraft height H
Direction cosines, Cvx C vz
local vertical to ECEF axes
B-3

Aircraft velocity components. VN, VEl V V
referred to platform axes 5Every 1 second
Direction cosines, (C, C
(wander N,E) to ECEF axes C~Ex ' CEy, EzC3
The instrumentation data from the GDM will include the same data, based upon
its own determination of the platform axis orientations, with the exception of
the direction cosines C Ex' C Ey' C . In the following description, GDM
instrumentation data will be indicated by a prime superscript on the symbol.
The post run analysis will sample the truth data and GDM instrumentation
data at some time interval which Is an integral multiple of 100 milliseconds
for comparison and dletermination of error quantities. The value of this integral
multiple will be under control of the operator.
The basic error quantities to be determined are:
* Height error e (PV)
* Horizontal position error e (P )H
(magnitude only)
* Vertical velocity error e (Vv)
* Horizontal velocity error e (VH)
(magnitude only)
Relationships for determination of these 4 basic errors are:
e (P) H'- H
(C y( '- c C y )2 1/2
e (H A I = R L, • vy vy vz 2
vx vz vz vx
In the above, R Is the nominal Earth radius. Since this Is only a scaling factar
for error quantities, compensation for height and latitude variation is not
necessary.
B-4

*(VV) VV '- VV
To determine e (VH)it in necessary to compute, as an intermediate quantity,
the platform rotation error about the vertical axis. This rotation error
(in wander angle) Is designated as e (@4'), in radians.
e cK =CEx (ONx -CNi
C CY (C~,y' - C NY)
*C (C '- C~Ez Nz N
From this, the horizontal velocity error magnitude is determined as;
e (VH ( (V1 - VN) 2+ (V I- VE)2
HN E E
------------------------------------------------------
If desired, the horizontal position error, e (P H), and the horizontal velocity
error, e (V H) may be resolved into orthogonal components. Choice of reference
axes are:
" True North, East
* Wander North, East
* Along and across ground track
Resolution into true North and East components will have a singularity at the
North or South poles. The other two sets of reference axes will not have any
singularity.
For the wander North, East resolution:
e(Pd=R~f C x(Cv, C~
+ (C' - C ]
4(E)REC (C' 'Ex vA Vx
e (E) ElCE. (Cv; -Cv*C E (C' C)7Y
B-5

e(VN)V V N +VE e
e (VE ) E - E VN e
For the along (AT) and across (CT) track resolution:t v.IVH~"~ 2 ,.2)7
e (PAT) = VN e (PN) 4 VE e (PE)
ViH
e (PCT) VN e (PE) - VE e (PN)
e (VAT)= VN e (VN) 4 VE e (VE)
VH
e (VCT)= V e (V) - VE e (VN)
VH
For the true North (TN) and true East (TE) resolution:
Cos C 1 vz
where is the latitude of the user.
S(P TN= C Nz e (P) + CEz e (P )
Cos
e (PTE) CNz e (PE) - Ez e (PN)
cos 4
e (VTN CNz e (VN) + CEz e (VE)
e (VTE) C e (V) C e (VNNi L -_E e(V)Cos ( i
For each time sequence of error quantities, the post run analysis will generate
statistical quantities such as bias value and standard deviation for print out
and evaluation. In additon, quick look results will be processed for display to
the operator.B-6

PRA FOR SPECIFICATIONS VALI)ATION MODE
There are 4 specification validation modes for the GPSE, as referenced In
spec. RWM-SS-302, paragraph 3.1.1.2.3. The reference is to spec.
RWM-SS-202, as follows:
3.2.1.1.1 Signal re-acquisition
3.2.1.1.2 Synchronization recovery
3.2.1.1.3 Jamming immunity
3.2.1.1.4 Data recovery
a. Signal Re-Acquisition
Input parameters, as listed in para. 3. 2. 1. 1. 1 of RWM-SS-202, are:
* Loss period (seconds)
* J/S ratio (dB)
* Position uncertainty (meters)
* Velocity uncertainty (m/sec)
* Acceleration uncertainty (m/sec2
* Jerk uncertainty (m/sec3
Output parameters are:
* Re-acquisition time (seconds)
* Probability of re-acquisition
The acceleration and Jerk uncertainties are listed as "Inertial Compatible".
Since the CPSE simulates an actual IMU as realistically as possible, the
acceleration and Jerk uncertainties will always be "Inertial Compatible," and
there is not need to record or process outputs related to these quantities.
The length of the loss period will be determined by means of the time tags
associated with the GDM event markers denoting "loss of signal" and
"reappearance of signal".
The J/S ratio as a continuous time function will be available from the pre-
protessed tape in terms of signal attenuation outputs for each satellite and each
jammer:
B-7

YS for the satellites
yJ for the jammers
Since position and velocity errors (GDM outputs referred to pre-computed
truth data) are available as part of the Navigation Mode PRA (see Section
2 of this document), the values of the position and velocity uncertainty at
the time of "reappearance of signal" are known. These uncertainties can be
controlled by suitable choice of error quantities into the IMU model.
The user flight profile and jammer scenario will be planned to exercise the
signal re-acquisition performance of the G.M over the complete range of input
parameters as specified in RWM-202. Means will be provided to cause a
sufficient number of signal loss situations to yield a reasonable confidence
factor in the determination of the probability of re-acquisition (appro-xinately
200 situations based upon the specified probability of 0.95).
b. Synchrouization Hvto tv'\
Input parameters, as listed in para. 3. 2. 1. 1. 2 of RWM-SS-202, are:
* J./S ratio idB)
* Vehicle velocity (m/sec)
* Vehicle acceleration (hi/sec)3
Vehicle jerk (nL/sec
Output parameter is probability of synchronization.
The J/S ratio will be determined in the same manner as discussed in paragraph a,
above, on Signal Re-Acquisition.
Vehicle velocity and acceleration are available from truth data on the pre-computed
tape. Vehicle jerk is not available explicitly, but can be determined by
differencing of successive acceleration outputs.
The user flight profile and jzlniner scenario will be planned to exercise the
synchronization recovery performance of the GlDM over the complete range of
input parameters as specified in RWM-202. There will be a sufficient number
of synchronization recovery situations generated by the GDM in the sequential
B3-8

mode, to yield a reasonable confidence factor in the determination of the
probability of synchronization (approximately 1000 situations based upon
the specified probability of 0.99).
c. Jamming Immunity
input parameters, as listed in para. 3.2.1. 1.3 of RWM-SS-202, are:
0 J/S ratio (dB)
* Operating mode
Output parameters are:
S Maxnmimui J/S ftor tnltial signal acquisition
* Matxlnum J/S for maintaining system lock
* Maximum JiS for madntaining system track
* Mximum J /S for synchroniLzaon recovery (associated with
paragraph b, above, on Synchronization Becovery)
0 Maximum J/S for m.aintainhig carrier track
Determination of these output parameters requiies the following GDM event
markers, along with time tags:
* Signal acquisition
* Loss of system lock
• Loss of system track
0 Synchronization recover ,
* loss of carrier track
For each GDM operating mode, the jamming scenario will be planned to start
from some low J/S ratio (less than 34 dB) and to gradually increase the J/S
ratio until all the GDM event markers Indicate a failure to derive informatiom
from the signal. Each of these situations will be repeated a sufficient number
of times (approvximately 10) to demonstrate the repeatability of the results.
The actual J/S ratio at the event markers is determined in the same manner
as discussed in paragraph a, above, on Signal Re-Acquisition.
d. Data Recovery
Input parameters, as listed in para. 3.2. 1.1.4 of RWM-SS-202, are:
B-9

* J/S ratio (dB)
* Jammer type
Output parameter is bit error rate (BER).
For the various jammer types, the required J/S ratio will be set, and a
real time bit-by-bit conparison will be made between the truth navigation
data and the data as recovered by the GIDAI receiver. Bit errors will be
counted over a 6 hour period. Since the bit rate is 50 per second, the 6 hour
comparison period represents a total of 1, 080,000 bits, which will yield
a reasonable confidence factor on the BER requirement of less than 10- 5 .
This will require that the demodulated data output from the GDM receiver
be available as an external interface.
B- 10'-.SGoornr net Printing Office: 1980 "657-084 640
k'7

' I DATE
'ILME