gppss financial transparency series_2010-11 tax levy
TRANSCRIPT
8/8/2019 GPPSS Financial Transparency Series_2010-11 Tax Levy
http://slidepdf.com/reader/full/gppss-financial-transparency-series2010-11-tax-levy 1/14
OVERVIEW OF 2010-11 TAX LEVYAPPROVAL
SEPTEMBER 27, 2010
B R E N D A N W A L S H , B O A R D O F E D U C A T I O N T R E A S U R E R
Grosse Pointe Public School SystemFinancial Transparency Series

8/8/2019 GPPSS Financial Transparency Series_2010-11 Tax Levy
http://slidepdf.com/reader/full/gppss-financial-transparency-series2010-11-tax-levy 2/14
Before
Proposal A
Why School
Finance and Tax Reform Were Hot Issues in
Michigan in 1993
PropertyTaxes Serveas PrimarySource ofRevenue
PropertyTaxes were34% above
national avg.(7th in nation)
WealthiestDistrictsOutspent
Lowest 3:1 ona Per Pupil
Basis
NoRestrictions
on MillageIncreases
Financial Transparency Series - 2010-11 Tax Levy
8/8/2019 GPPSS Financial Transparency Series_2010-11 Tax Levy
http://slidepdf.com/reader/full/gppss-financial-transparency-series2010-11-tax-levy 3/14
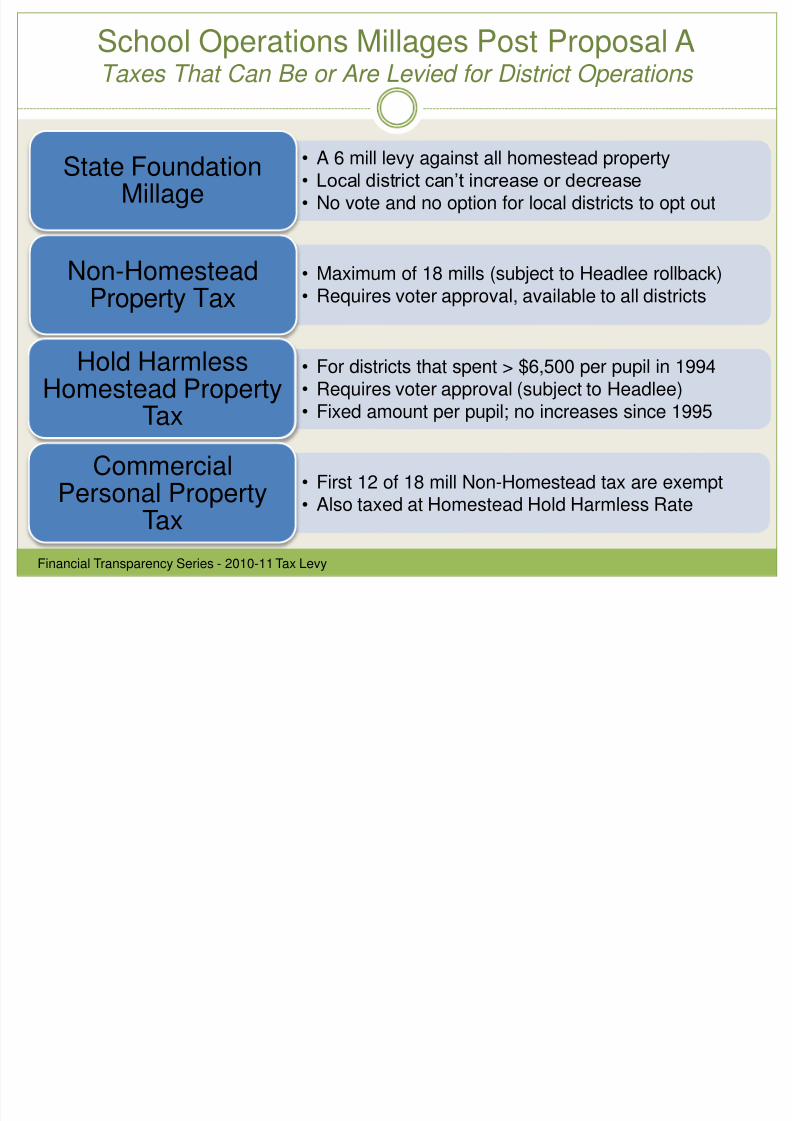
School Operations Millages Post Proposal ATaxes That Can Be or Are Levied for District Operations
Financial Transparency Series - 2010-11 Tax Levy
• A 6 mill levy against all homestead property• Local district can’t increase or decrease
• No vote and no option for local districts to opt out
State FoundationMillage
• Maximum of 18 mills (subject to Headlee rollback)• Requires voter approval, available to all districtsNon-HomesteadProperty Tax
• For districts that spent > $6,500 per pupil in 1994• Requires voter approval (subject to Headlee)
• Fixed amount per pupil; no increases since 1995
Hold HarmlessHomestead Property
Tax
• First 12 of 18 mill Non-Homestead tax are exempt• Also taxed at Homestead Hold Harmless Rate
CommercialPersonal Property
Tax
8/8/2019 GPPSS Financial Transparency Series_2010-11 Tax Levy
http://slidepdf.com/reader/full/gppss-financial-transparency-series2010-11-tax-levy 4/14
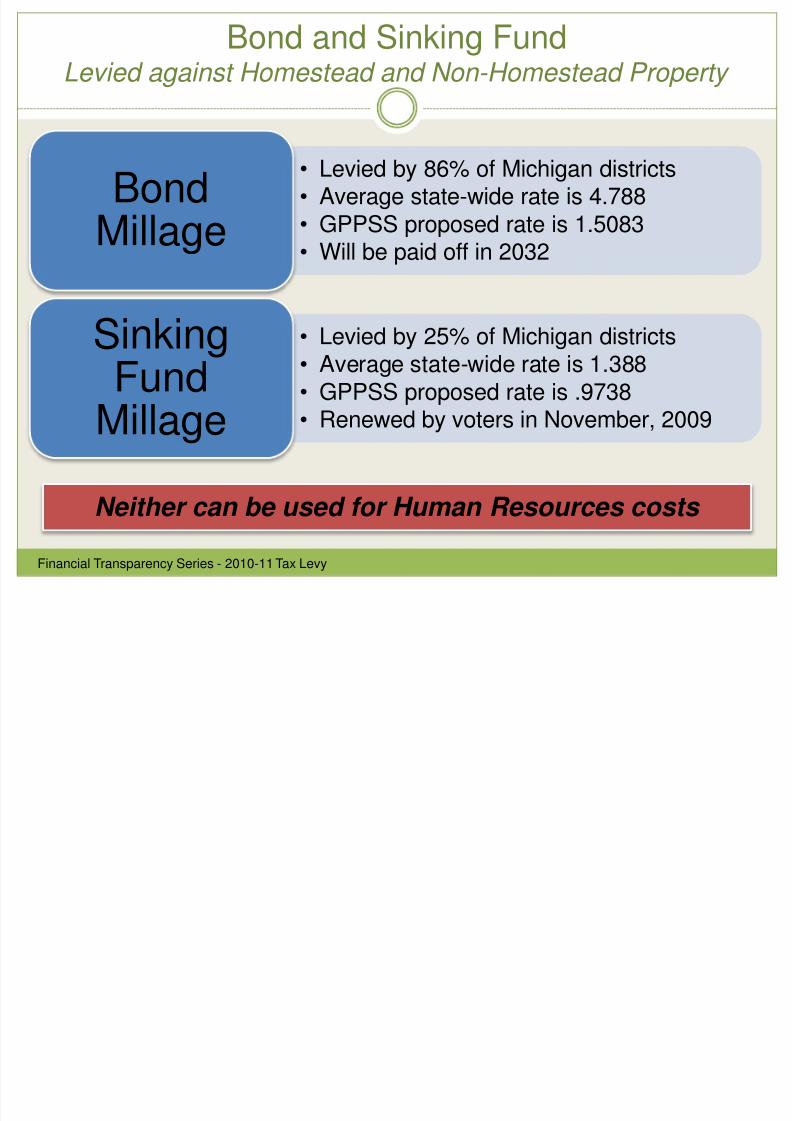
Bond and Sinking FundLevied against Homestead and Non-Homestead Property
Financial Transparency Series - 2010-11 Tax Levy
• Levied by 86% of Michigan districts• Average state-wide rate is 4.788• GPPSS proposed rate is 1.5083• Will be paid off in 2032
BondMillage
• Levied by 25% of Michigan districts• Average state-wide rate is 1.388• GPPSS proposed rate is .9738
• Renewed by voters in November, 2009
SinkingFund
Millage
Neither can be used for Human Resources costs

8/8/2019 GPPSS Financial Transparency Series_2010-11 Tax Levy
http://slidepdf.com/reader/full/gppss-financial-transparency-series2010-11-tax-levy 5/14
8/8/2019 GPPSS Financial Transparency Series_2010-11 Tax Levy
http://slidepdf.com/reader/full/gppss-financial-transparency-series2010-11-tax-levy 6/14
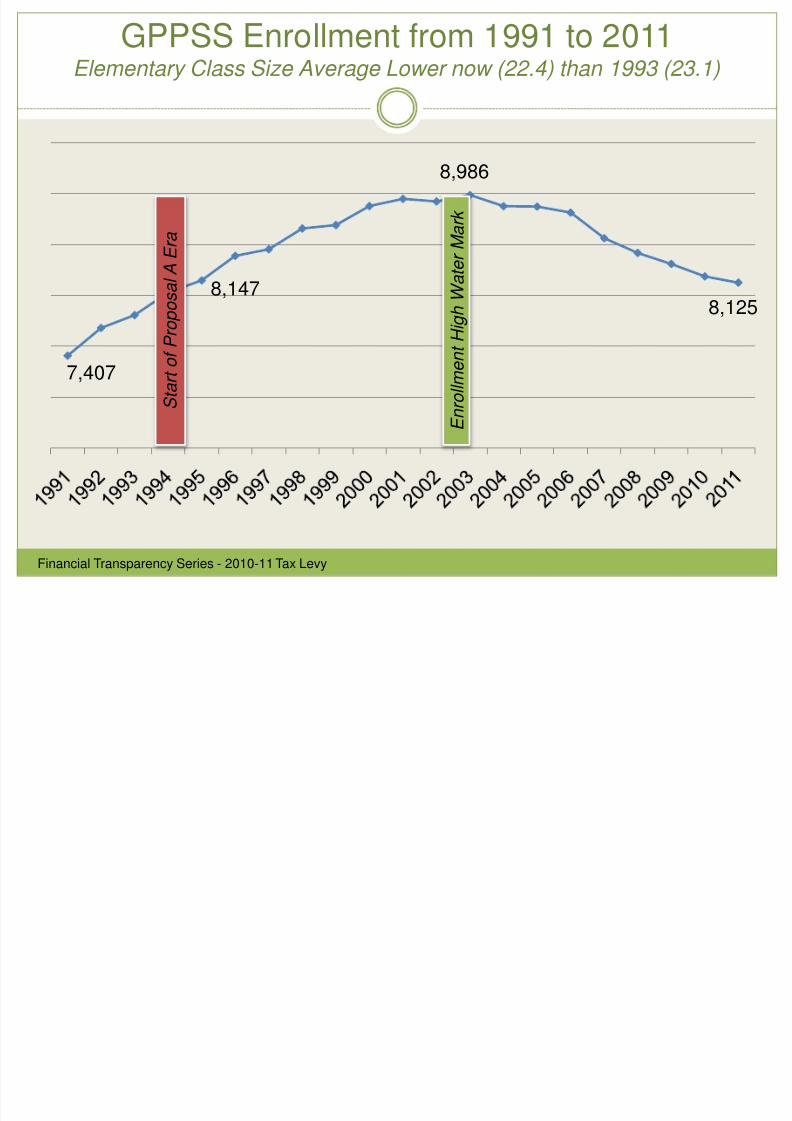
GPPSS Enrollment from 1991 to 2011Elementary Class Size Average Lower now (22.4) than 1993 (23.1)
Financial Transparency Series - 2010-11 Tax Levy
7,407
8,147
8,986
8,125
E n
r o l l m e n t H i g h W a t e r M a r k
S t a r t o f P r o p o s a l A E r a

8/8/2019 GPPSS Financial Transparency Series_2010-11 Tax Levy
http://slidepdf.com/reader/full/gppss-financial-transparency-series2010-11-tax-levy 7/14
State of Michigan and GPPSS Student EnrollmentYear over year percentage change shows GPPSS’ correlates with state’s pattern
-4.0%
-3.0%
-2.0%
-1.0%
0.0%
1.0%
2.0%
3.0%
GPPSS State of MI
Financial Transparency Series - 2010-11 Tax Levy

8/8/2019 GPPSS Financial Transparency Series_2010-11 Tax Levy
http://slidepdf.com/reader/full/gppss-financial-transparency-series2010-11-tax-levy 8/14
Formula Driven Hold Harmless Millage RateIn GPPSS the variables will adjust to yield $1,893/pupil
Financial Transparency Series - 2010-11 Tax Levy
IncreasingEnrollment
DecreasingEnrollment
IncreasingTaxable Value
DecreasingTaxable Value
D ownw
ar d Mi l l a g e e
P
r e s s ur e
U
p w a r d M i l l a
g e e
P r e s s u r e
Proposal A self corrects tax rates to ensure fixed per pupil funding
Counter Balance

8/8/2019 GPPSS Financial Transparency Series_2010-11 Tax Levy
http://slidepdf.com/reader/full/gppss-financial-transparency-series2010-11-tax-levy 9/14
Proposal A’s Impact on Homestead MillagesIn GPPSS School Property Tax Rates Went down 50%
Financial Transparency Series - 2010-11 Tax Levy
1993-4
Local Operating Mills
29.0250
State Mills 0.0000
Debt Mills 0.2324
Sinking Fund 0.0000
Total Mills 29.2574
1994-5
Local Operating Mills
8.3680
State Mills 6.0000
Debt Mills 0.2000
Sinking Fund 0.0000
Total Mills 14.5680
2010-11
Hold Harmless
6.4713
State Mills 6.0000
Debt Mills 1.5083
Sinking Fund 0.9738
Total Mills 14.9534

8/8/2019 GPPSS Financial Transparency Series_2010-11 Tax Levy
http://slidepdf.com/reader/full/gppss-financial-transparency-series2010-11-tax-levy 10/14
Local Foundation Allowance Revenue (Per Pupil x Enrollment)Combined Real Local Homestead & Non-Homestead Tax Revenue lower than 1999
$23,100
$25,700
$22,698
$17,962
$23,974
$15,000
$17,000
$19,000
$21,000
$23,000
$25,000
$27,000
T h o u s a
n d s
Real Dollars Nominal Dollars
Financial Transparency Series - 2010-11 Tax Levy
8/8/2019 GPPSS Financial Transparency Series_2010-11 Tax Levy
http://slidepdf.com/reader/full/gppss-financial-transparency-series2010-11-tax-levy 11/14
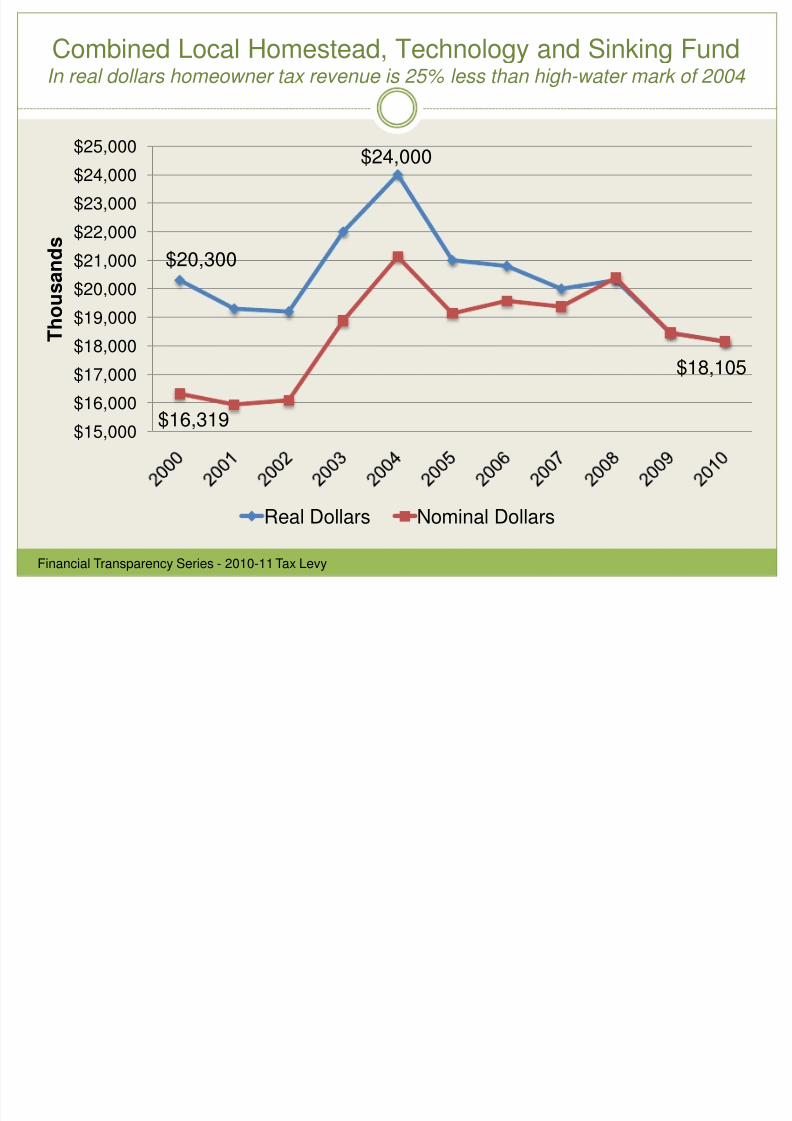
Combined Local Homestead, Technology and Sinking FundIn real dollars homeowner tax revenue is 25% less than high-water mark of 2004
$20,300
$24,000
$16,319
$18,105
$15,000
$16,000
$17,000
$18,000
$19,000
$20,000
$21,000
$22,000
$23,000
$24,000
$25,000
T h o u s a
n d s
Real Dollars Nominal Dollars
Financial Transparency Series - 2010-11 Tax Levy

8/8/2019 GPPSS Financial Transparency Series_2010-11 Tax Levy
http://slidepdf.com/reader/full/gppss-financial-transparency-series2010-11-tax-levy 12/14
Comparison of Enrollment and Staffingfrom 1993 to 2010
Financial Transparency Series - 2010-11 Tax Levy
Student and Staff Data
September,
1993
September,
2010
% Change
'93-'10
General Education Student Enrollment 7,850 8,125 3.5%
Total Number of Teachers 527 569 8.0%
Pupil : Teacher Ratio (lower is better) 14.90 14.28 -4.1%
Average Elementary Class Size 23.1 22.3 -3.5%Public Librarians 14 0 -100.0%
Clerical Staff 93 47 -49.5%
Plant and Cafeteria Staff 108 68 -37.0%
Classroom Assistants/Paraprofessionals 108 130 20.4%
Administrators 30 30 0.0%
Other Regular Staff 35 22 -37.1%
Total Employees 915 866 -5.4%
Total Teachers and Classroom Assistants 635 699 10.1%
All Other Employees 280 167 -40.4%

8/8/2019 GPPSS Financial Transparency Series_2010-11 Tax Levy
http://slidepdf.com/reader/full/gppss-financial-transparency-series2010-11-tax-levy 13/14
Benchmarking GPPSS to Statewide RankingsNote variance of expenditure/pupil by category vs. revenue/pupil
Financial Transparency Series - 2010-11 Tax Levy
Per Pupil Revenue or Expenditure1994 Rank(out of 524)
2008 Rank(out of 775)
Total Revenue per Pupil 14 44
Basic Instructional Expenditure 14 32
Total Instructional Expenditure 15 29
Instructional Support Expenditure 26 44
Administrative Expenditure 56 381
Support Services Expenditure 24 206Operations and Mntc. Expenditure 15 201
Enrollment Ranking Statewide 36 31

8/8/2019 GPPSS Financial Transparency Series_2010-11 Tax Levy
http://slidepdf.com/reader/full/gppss-financial-transparency-series2010-11-tax-levy 14/14
SummaryProposal A has dramatically reduced tax revenues
Financial Transparency Series - 2010-11 Tax Levy
• Down $1,041,787 from 2009-10• Down $1,940,214 from 2006-7
Local Taxesand Fees
• Down $6,369,103 from 2007-8GPPSS StateTax Revenues
• Down $6.8MM from 2009-10• Down $9.2MM from 2007-8
General FundExpenditures