gpm pv portal - greenpowermonitor user... · the web platform is optimized for use with the most...
TRANSCRIPT

GPM | PV Portal V 2.0
User Guide

CONTENTS
1. Introduction .................................................................................. 3
The platform ......................................................................................... 4
Philosophy ........................................................................................... 4 Accessing the PV Portal platform ............................................................ 5
2. Main menu .................................................................................... 6
Main modules ........................................................................................ 7
3. Facilities Module ........................................................................... 8
Plant dashboard .................................................................................... 9
Plant menu .......................................................................................... 9 Alarms management .............................................................................. 10
Configured alarms .............................................................................. 11 Add alarm .......................................................................................... 12 Add recipients .................................................................................... 17 View history ....................................................................................... 18 SMS credit ......................................................................................... 18
Data ..................................................................................................... 18
New query ......................................................................................... 19 Quick query ....................................................................................... 23 Favorite queries ................................................................................. 25
Graphics ............................................................................................... 26
New query ......................................................................................... 27 Favorite queries ................................................................................. 30
Performance ratios ................................................................................ 31
Add a PR ........................................................................................... 32 Images ................................................................................................. 35
Report manager .................................................................................... 35
Add a report ...................................................................................... 36 Viewing ............................................................................................. 40
4. Users management Module ........................................................... 41
Add user ............................................................................................ 42 User Access Control ............................................................................ 45 Manage facilities ................................................................................. 46 Manage systems ................................................................................. 47
5. Instant Messaging Module ............................................................ 48
New message .................................................................................... 49
5. Contact your administrator ........................................................... 50
6. Help ............................................................................................... 51
7. Go to platform 1.0 ......................................................................... 52
8. Personal settings ........................................................................... 53
Glossary ............................................................................................ 54

1. INTRODUCTION
This user guide describes the main features of the GreenPowerMonitor PV Portal
monitoring solution.
The web platform enables you to visualize, query, and manage data monitored at
photovoltaic plants, solar thermal installations, and wind farms. It provides the tools
you need to achieve maximum efficiency.
You will be able to do the following:
Monitor the operation of your plants in real time
Query current and historical device data
Manage your plants’ corrective maintenance alerts
Generate custom production-management and yield reports
Monitor investment optimization and ROI
Establish different access rights for different users
HOW DOES IT WORK?
GreenPowerMonitor´s monitoring solution includes in-plant physical devices
(Dataloggers) that regularly send parameterized data to our servers. The information
gathered can be viewed using our web monitoring platform or from the dedicated
desktop management program PV+.
Regardless of your plant characteristics, our technicians can configure each plant
according to your specifications: using your installations’ and devices’ nomenclature,
establishing the alarms and filters needed, and leaving the software ready for you to
use.
HOW TO USE THIS GUIDE
This guide is intended to provide an overall view of the platform. It covers the most
common functions and provides useful information for getting the most out of the tools
available. Further documentation is available for you to learn the details about
advanced configuration processes and other technical characteristics of the program.
In the last chapter of this document, you’ll find practical cases with details on each
step to follow.

THE PLATFORM
PV Portal consists of a main display and a menu containing the different operating
modules. Each module has its own specific function such as querying data, viewing
graphics, facilities management, alarm control, etc.
The web platform is optimized for use with the most common web browsers: Mozilla
Firefox, Chrome, Internet Explorer 9, and Safari; and it will work with any computer,
Tablet, or Smartphone with an Internet connection.
PHILOSOPHY
PV Portal is a monitoring platform focused on facilities or plants. Different access
profiles may be established for a group of monitored facilities, depending on
requirements.
PV Portal is a multiuser system with comprehensive authorization control. For each
role, (monitoring, configuration, plant management, maintenance, financial reporting,
etc.) you can specify the plants, elements, modules, and the data that can be viewed,
modified, or deleted.
The purpose of the platform is to provide fast remote access to the status of monitored
facilities. It provides a set of tools to administer, manage, and monitor these facilities.

ACCESSING THE PV PORTAL PLATFORM
To access the web platform, use your browser to go to www.greenpowermonitor.com
You will find the web platform access control on the upper right hand side of our page.
Enter your user name and password and click on the green LOGIN button. These
credentials will be used to initiate a session.
Add this page to your list of favorites or bookmarks for rapid access. Some browsers
can save your user name and password; we recommend deactivating this option if you
are working on a shared computer.
The session will close automatically after 15 minutes of inactivity.
Accessing the PV Portal platform

2. MAIN MENU
The main menu is found on the upper part of the screen. It provides access to the
portal’s different modules. Access to those modules is dependent upon each user’s
authority.
User Configuration
Module content
Modules Active
module
Active module: Click on a module and its contents will be displayed at the center of the page or in a
pop-up window. The button for the active module shows as highlighted.
Modules: Quick access to different platform modules. Each module focuses on one task or function. There is a description of each in Main Modules.
Module content: This where the content of each module can be viewed. To exit a module, just select another module from the main menu. Use the navigation tools within the modules to access their subsections.
User: Displays the name of the user accessing the platform. In order to change user, exit the session and connect with different credentials, or use the user drop-down list.
User drop-down list: Lets you view another user’s session. This option is only available to administrators.
Plant drop-down list: Quick access to a specific plant by entering part of its name. The drop-down list will display plants with names that match what has been entered.
Personal settings: Provides access to the module for personalized user settings. See Personalized settings.
Logout: terminates the user session and exits the PV Portal platform.
Plant drop down list: The ability to apply a filter to this list makes access to a specific plant very quick.
Just write a few letters or words and the system will display all of the plants that match.
Logout
User drop-down list
Plant drop-down list

MAIN MODULES
All the PV Portal modules work independently and accessing them depends on the
user’s authority. The platform’s main modules and a brief description are listed below.
They will be described in detail in subsequent sections.
Facilities: Access to the various monitored facilities.
Go to Platform 1.0: Access to the platform’s prior version.
Contact Your Administrator: Send a message to the administrator.
Help: Access PV Portal documentation and video tutorials.
Personal Settings: Language, time, and password management.
User Management: Adding and modifying users and their authorities.
Instant Messaging: Reading and sending messages.

3. FACILITIES MODULE
This module provides an overall view of all plants: their geographic location, their alert
status, and general information about each of them. You can access the window for a
specific plant by clicking on its name. It is the home module.
Plant: Click on the name of a plant to retrieve the Plant Dashboard.
Overview: Displays current plant information.
Expand: Displays the most recent values of configured parameters.
Alerts: The alert light indicates if there are active alerts for the plant.
Green means there are no active alerts.
Red means there are alerts active. Move the cursor over the light to see information.
Communications: The globe icon shows the status of plant communications.
The globe indicates that communications are working correctly.
A globe with a yellow X indicates minor problems with communication.
A globe with a red X means there is no communication with the plant.
Views: Gives you the option to change how you view the facilities: list format or grid format.
All/Pages: Gives you the option to change the plants’ pagination mode, continuous list or paginated.
Plant Overview
Alerts Communications
Views
Expand
All/Pages

PLANT DASHBOARD
The plant dashboard displays information and monitored values for a specific facility.
Each plant has its own dashboard, accessible from the facilities list or the plant drop
down list on the main menu. The plant information page is shown by default.
PLANT MENU
Plant menu
Custom graphics
Plant: Name of the facility.
Plant menu: Provides access to plant-linked tools. See Plant Menu.
Overview: Displays current plant information.
Custom Graphics: Shows graphics that have been saved as favorites. Use the graphics drop-down list to move between custom queries and quick date selection to see values for today, the last 5 days, or the current week. For more details, see Graphics: Viewing.
Most current values: Displays the most recent values of defined parameters.
Plant
Most current values
Overview

The plant menu provides access to specific tools for a specific facility. It lets you query
monitored values, generate graphics and reports, manage alarms, and configure other
features. Each user’s authority determines the tools available to them.
ALARMS MANAGEMENT
Information Alarms Data Graphics PR Images Reports Back
Alerts Communication
Information: Return to the main page of the Plant Dashboard.
Alarms: Access alarm configuration and display. See Alarm Management.
Data: Access data configuration and display. See Data.
Graphics: Access graphics configuration and display. See Graphics.
PR: Access to Performance Ratio configuration. See Performance Ratios.
Images: Displays installation images that have been loaded to the platform. See Images.
Reports: Access report configuration and display. See Report Management.
Back: Return to the facilities list.
Alerts: Displays the facility alerts status. See details in the Facilities Module.
Communication: Displays the facility communications status. See details in the Facilities Module.

This tool enables creation of new alarms, notification management, and display of
launched alerts.
The alarms allow you to automate alerts based on circumstances that affect plant
operation and notification. If alarm-activation conditions have been defined, the
specified notification recipients will be contacted if the alarm activates.
There are 3 types of alarms: General, Data, and PR.
General: Alarms related to communications and the status of the dataloggers at the
facility. They are used to detect communication faults and loss of connection.
Data: Alarms linked to specific device parameters for the plant. They are used to
detect device-error statuses and anomalous values.
PR: Alarms linked to custom Performance Ratio parameters. They are used to detect
reductions in productive yield of the devices.
In all cases, the recipients of notifications and manner of communication (email and/or
SMS) can be defined.
CONFIGURED ALARMS
Configured Alarms: Displays and allows modification of the alarms configured for the plant. See the Configured Alarms section.
Add Alarm: Function for adding a new alarm to the plant. See the Add Alarm section.
Add Recipients: Function for adding recipients en masse for configured alarms. See the Contact Information section for details.
View History: Displays the history of activated alarms. See the Alarms History section.
SMS Credit: Provides the ability to get more SMS credits to send mobile-phone notifications. See the SMS Credit section.

Configured alarms are grouped by owner (the user who created them).
All alarms defined for the plant and their current status are displayed.
ADD ALARM
Transfer Status
Actions
Help
Activate/Deactivate Edit Modify recipients
Delete
Transfer: Administrators can assign alarm management to specific users using the Transfer button.
Status: Indicates alarm status; there are 4 possible:
-Activated. The alarm is configured and being evaluated.
-Deactivated. The alarm is configured but not being evaluated.
-Not configured. The alarm is not completely configured and not being evaluated.
-Launched. An active configured alarm was launched because its conditions were met.
ACTIONS
Help: Displays alarm status information.
Activate/Deactivate: Changes the status of an alarm from activated to deactivated or vice versa.
Edit: Allows you modify an alarm configuration. See Add Alarm.
Modify Recipients: Lets you modify alarm recipients. View Add Recipient.
Delete: Delete a plant alarm.

Follow the steps defined for adding alarms for your plant. All alarms are configured
using 3 steps: describe the alarm, set activation conditions, and assign notification
recipients. The first and third steps are common for all alarms, the second varies by
type.
Describing the Alarm (Step 1 of 3)
Once all the mandatory fields are entered, the activation condition can be defined.
Next we detail how to define the three types of alarms.
Mandatory. The type selected determines the kind of
conditions (in step 2) that will activate the alarm.
Optional. Include details of conditions to identify alarms
quickly.
Mandatory. Try to give descriptive names to the alarms
in order to recognize them later.
Mandatory. Define the time period for the conditions to
occur to trigger notification. The minimum time is 20
minutes and the maximum 120.
Mandatory. Specify how long the alert should remain
active before the recipients are re-notified. The minimum
time is 1 hour and the maximum 48.
Return to configured alarms Continue to the next step

GENERAL ALARM CONDITIONS
Use a general type alarm to monitor the status of the facility’s dataloggers.
Activation Conditions (Step 2 of 3)
DATA ALARM CONDITIONS
Mandatory. Define a datalogger to
evaluate. For common conditions,
you can select all of the dataloggers
in a plant.
Return to step 1
Mandatory. Choose an alarm condition.
Continue to the next step
Define how long the datalogger should be without
communications before launching the alarm. The
minimum time is 1 hour and the maximum 24.

Use this type of alarm to monitor the in-plant devices through simple expressions or
combinations of different parameters.
Activation Conditions (Step 2 of 3)
PR ALARM CONDITIONS
Operation
Return to step 2 Continue to the next step
Elements
Types: Protocols for plant devices. Select a protocol to see the available parameters that can be
monitored.
Parameters: Parameters that can be monitored from the protocol selected. Select a parameter to see the elements that return it.
Elements: In-plant elements that return the selected parameter. Select one or more elements you
would like to evaluate using this parameter.
Operation: Select the operation the parameter should comply with.
Value: Indicate the value that the parameter should comply with.
Signs: Add boolean operators and/or parentheses to the expression.
Add / Modify: Click to add a new condition. If you select a condition to edit, click Modify to apply the
changes.
Delete: Select a condition, then click on Delete to eliminate it.
Expression: The actual expression that controls whether or not to launch the alarm. Select a parameter
if you wish to change or delete it.
Value Signs
Types Parameters
Expression
Add / Modify
Delete

Use a PR type alarm to monitor dips in the performance of in-plant devices.
Activation Conditions (Step 2 of 3)
CONTACT INFORMATION
Operation
Return to step 2 Continue to the next step
Type: Select the Performance Ratio type.
Parameters: Displays a list of PR parameters that have been defined for the plant. See Performance Ratios.
Operation: Select the operation the parameter should comply with.
Value: Indicate the value that the parameter should comply with.
Signs: Add boolean operators and/or parentheses to the expression.
Add / Modify: Click to add a new condition. If you select a condition to edit, click Modify to apply the
changes.
Delete: Select a condition, then click on Delete to eliminate it.
Expression: The actual expression that controls whether or not to launch the alarm. Select a parameter
to change or delete it.
Value Signs
Type Available PR parameters
Expression
Add / Modify
Delete

The third step of alarm configuration is to define who is notified. This can be modified
later using the Recipients button on the Configured Alarms tab.
Contact Information (Step 3 of 3)
ADD RECIPIENTS
Add Recipient Modify Recipient
Delete Recipient
Type of Action
Address / Telephone
Subject
Message
Add Recipient: Opens a blank Contact pop-up window.
Modify Recipient: Opens the Contact pop-up window loaded with the values already defined.
Delete Recipient: Deletes the defined contact and notification action.
Types of Action: Allows you to select the type of notification; email or SMS.
Address / Telephone: Field for entering the email address or telephone number.
Subject: Input field for specifying the subject of the notification.
Message: Input field for specifying the body of the notification. See help to get options for automatic generation of text depending on the element affected.
Apply: Apply changes.
Help
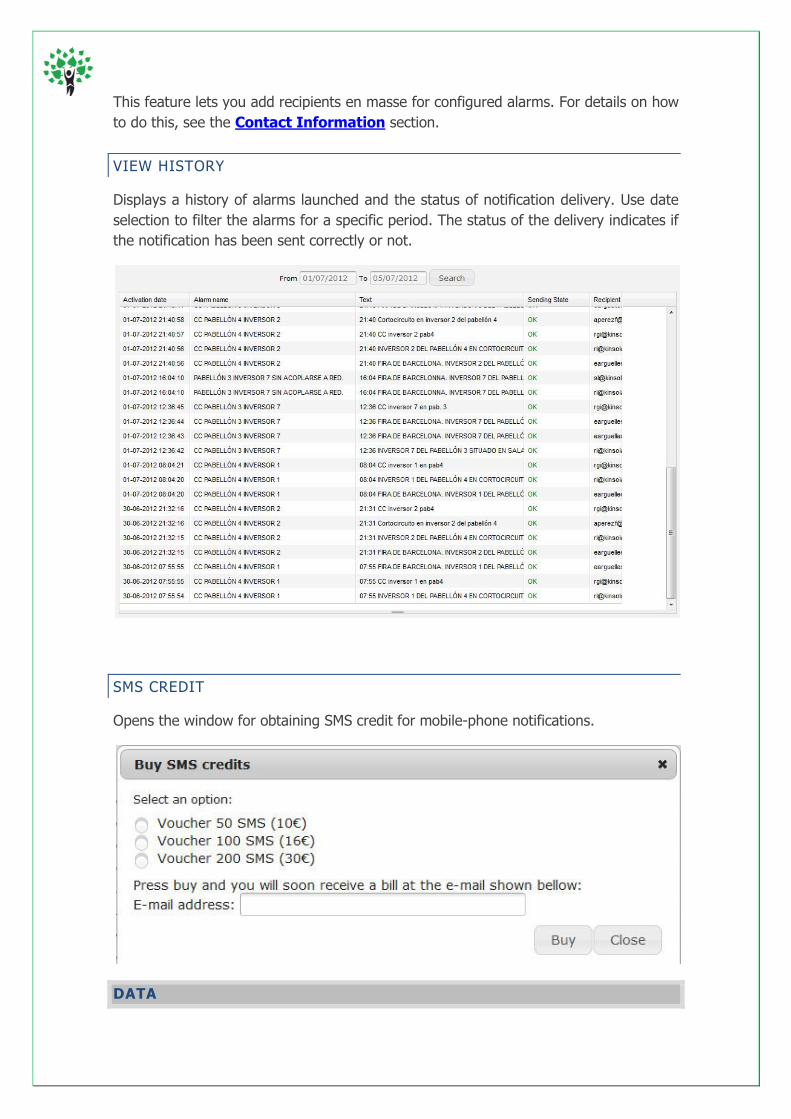
This feature lets you add recipients en masse for configured alarms. For details on how
to do this, see the Contact Information section.
VIEW HISTORY
Displays a history of alarms launched and the status of notification delivery. Use date
selection to filter the alarms for a specific period. The status of the delivery indicates if
the notification has been sent correctly or not.
SMS CREDIT
Opens the window for obtaining SMS credit for mobile-phone notifications.
DATA

This tool makes it possible for you to query the data monitored for the plant. There are
three options for choosing the data to view: generate a new query defining the
parameters to display, use a quick query, or load a previous query you saved as a
favorite.
If you have no favorite queries saved, this section will be empty.
NEW QUERY
Favorite Queries
Quick Queries
New Query: Opens the series-definition window to configure the data query. See New Query.
Quick Queries: Lets you quickly define limited queries of elements and parameters. See Quick
Queries.
Favorite Queries: Displays saved queries and lets you view, edit, and delete them. See Favorite
Queries.
New Query

This tool lets you define the parameters for monitored elements so they can be viewed
in a data or graphical query.
SERIES DEFINITION
Type Parameters Elements
Series Summary Operation Type Expression Unit Edit Delete
Continue Add
Select period
Types: Protocols for plant devices. Select a protocol to see the available parameters that can be
monitored.
Parameters: Parameters that can be monitored from the protocol selected. Select a parameter and click Continue to see the elements that return said parameter.
Elements: In-plant elements that return the selected parameter. Select one or more elements and click Add in order to include the series in the query.
Total: Instead of generating a series for each device, generate a single series totaling the values of all
selected devices.
Series Summary: Shows the series selected for the query. Once the series and details are correct, click
Continue to go to the next step. The series can be edited or deleted by clicking the buttons found at
the end of the rows.
Operation Type: Indicates the type of grouping option chosen (Average, Sum, Max, Abs Max,
Difference).
Expression: Lets you define a formula using operators ( + - * / ) in order to modify the monitored
value. It can be used to convert units of measure ( x*1000; x*0.001 ) or calculate profits ( x*0.43 ).
Unit: Lets you specify the parameter unit of measure, for example, if conversion or profit calculations
have been applied.
Total

SELECT PERIOD
Once the query series are selected, you can specify the data grouping and the time
period to evaluate.
Add to favorites
Grouping
Start date
End date
Continue
Add to favorites: If the box is checked, the query will be added to the favorite data-queries list. See
Favorite Queries.
Grouping: Defines the number of values to display (the granularity) for the period defined. The options include: none (show all values); every 10, 15, or 30 minutes; every hour, day, month, or year.
Start date: Defines the start date for the query period.
End date: Defines the end date for the query period.
Continue: Finish the configuration process and execute the query.

VIEWING
The defined series values are displayed for the period selected. The query may be
exported or saved in favorites for reuse on another occasion.
Tabulated data
Add to favorites
Export to CSV
Export to Excel
Tabulated data: The values are displayed chronologically.
Export to Excel: Exports the current values in Excel format.
Export to CSV: Exports the current values in CSV format (comma-separated values).
Add to favorites: The query will be added to the list of favorite data queries. This icon will not be
available for queries that are already favorites. See Favorite Queries.

QUICK QUERY
The quick query is intended for rapid viewing of the daily information of one or two
elements. Select the elements, the parameters, and a date to use for the query. Quick
queries are different from custom queries in that you cannot view different device
parameters in the same query, or configure groupings or a time period.
CONFIGURATION
Types Elements Parameters Yesterday Date Continue
Types: Protocols for plant devices.
Elements: Select an option to include in the query.
Parameters: Parameters that can be monitored from the protocol selected. Select one or more parameters to include in the query.
Yesterday: Set the date to the previous day and execute the query.
Date: Shows the query date. Click to edit and to select a new date.
Continue: Execute the query with the elements, parameters, and date configured.

VIEWING
Use the upper controls to select the time period for the data. You can export the
results using the toolbar icons.
Export View time View day
Table
View time: Select the time in order to view the values for this interval.
Scroll time: Move forward and backward through the times of day.
View day: Displays data for the entire day.
Day: Displays the dates of the data displayed.
Scroll days: Move forward and backward through the days.
Export: Lets you export the table in CSV (comma-separated value) or Excel format.
Table: Displays the series defined for the time period selected.
Scroll time Scroll day
Day

FAVORITE QUERIES
You can save the queries you most commonly use with favorite queries, making them
readily available for viewing. Just select the period and the grouping and you can see
the series values.
Owner
Configure
Delete
Queries
Owner: Displays the query owner (who created it):
Queries: List of available queries, click to execute. The period-selection window will open.
Configure: Used to modify the query series (parameters and elements).
Delete: Deletes the favorite query.

GRAPHICS
This tool makes it possible for you to query the plant’s monitored data graphically.
There are two options for viewing a graphic: generate a new query defining the
parameters to display, or load a previous query you saved as a favorite.
If you have no favorite queries saved, this section will be empty.
New Query
Favorite Queries
New Query: Opens the series definition window to configure the data query. See New Query.
Favorite Queries: Displays saved queries and lets you view, edit, and delete them. See Favorite
Queries.

NEW QUERY
This tool enables you to define the parameters for monitored elements so they can be
viewed in a graphical query.
SERIES DEFINITION
Types Parameters Elements
Series summary Unit Edit Delete
Continue Add
Select period
Types: Protocols for plant devices. Select a protocol to see the parameters available for monitoring.
Parameters: Parameters that can be monitored from the protocol selected. Select a parameter and click Continue to see the elements that return said parameter.
Elements: In-plant elements that return the selected parameter. Select one or more elements and click Add in order to include the series in the query.
Total: Instead of generating a series for each device, generate a single series totaling the values of all selected devices.
Series summary: Shows the series selected for the query. Once the series and details are correct, click
Continue to go to the next step. The series can be edited or deleted by clicking on the buttons found
at the end of the rows.
Unit: The parameter’s unit of measure may be entered here.
Total

SELECT PERIOD
Once the query series are selected, you can specify the data grouping and the time
period to evaluate.
Add to favorites
Start date
End date
Continue
Add to favorites: If the box is checked, the query will be added to the favorite data queries list. See
Favorite Queries.
Start date: Define the start date for the query period.
End date: Define the end date for the query period.
Continue: Finish the configuration process and execute the query.

VIEWING
Use the upper controls to select the time period for the data. You can export the
results using the toolbar icons.
Period drop-down list Favorite graphics drop-down list
Legend
Period: Displays the period for the graphic values.
Favorite graphics drop-down list: Lets you quickly select one of the configured graphics favorites.
Period drop-down list: Enables you to quickly select predefined periods: Today, the last 5 days, or the current week (Monday through Sunday).
Period control: Lets you quickly move backwards and forwards through periods.
Activate legend: Hide or display the Legend pop-up window.
Graphic: Place the cursor at any point in the graphic to view the values. To see an enlarged view of the area, select the point with the cursor and press the left button.
See points: Only shows the points on the chart.
Restore: Return the graphic to its original size and conditions.
Print: Opens the report manager. Configure the browser to print the screen background and cell content in order to print the legend.
Legend: Link colors to the graphic’s series. Click on a series to hide/display it. Use the “Hide/Display all series” option to affect all series.
Scroll period
Period
Graphic
Activate legend
Scroll period
Display points Print
Restore

FAVORITE QUERIES
You can save the queries you most commonly use with favorite queries, making them
readily available for viewing. Just select the period and you can see the series values.
Preferred
Status
Change status
Edit
Delete
Preferred: Indicate the graphic that you want to be displayed on the plant dashboard.
Owner: Displays the query owner (who created it).
Queries: List of available queries, click to execute. The period selection window will open.
Change status: Switch the status of the graphic back and forth between private and public. Public graphics may be queried by all facility users, the private ones may only be used by their owner.
Configure: Used to modify the query series (parameters and elements).
Delete: Deletes the favorite query.
Queries
Owner

PERFORMANCE RATIOS
This tool can be used to add, modify, and manage a facility’s Performance Ratio
parameters. The Performance Ratio is a parameter calculated using the Irradiance
expected for an installation and the energy it produces. This indicates its efficiency and
performance.
Add List Edit Delete Configured PRs
Configured PRs: Details of the facility’s configured PRs.
Add: Open the form for entering a new PR. Display Add PR.
List: Display the configured PRs.
Edit: Lets you modify PR configuration. You may see inconsistency with previously generated values if you modify a PR. The modify form works the same as the add form.
Delete: Delete the PR parameter.
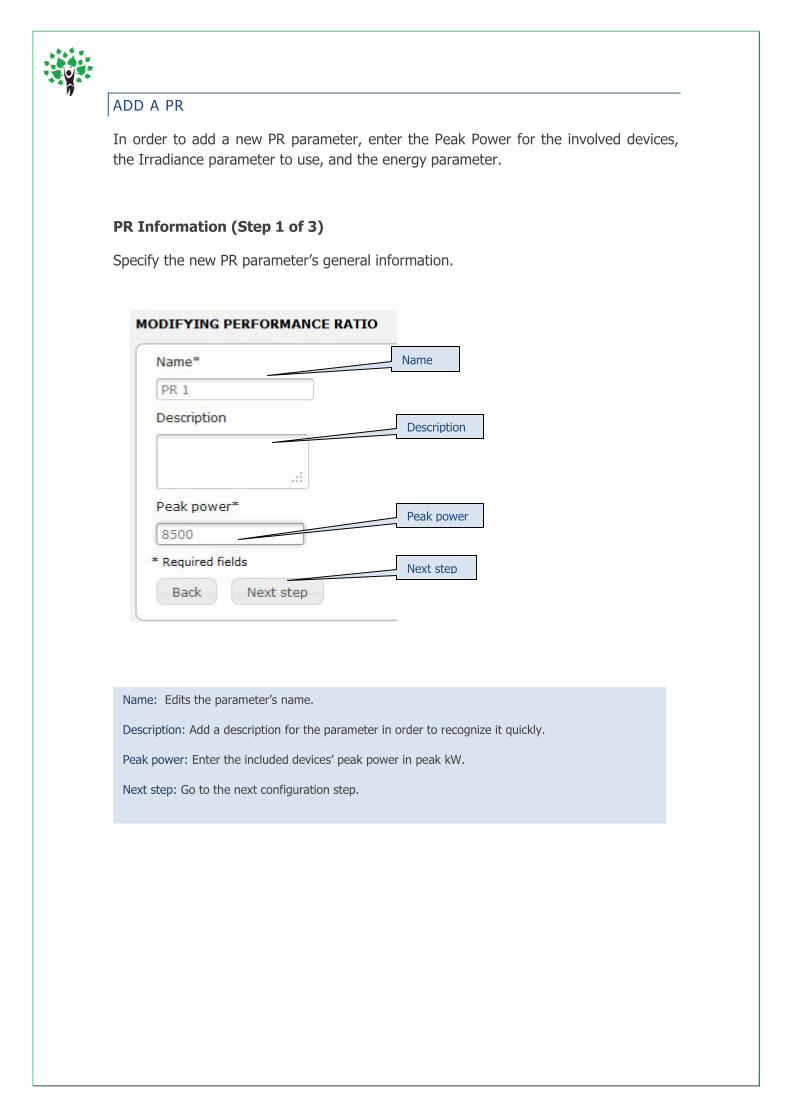
ADD A PR
In order to add a new PR parameter, enter the Peak Power for the involved devices,
the Irradiance parameter to use, and the energy parameter.
PR Information (Step 1 of 3)
Specify the new PR parameter’s general information.
Name
Description
Peak power
Next step
Name: Edits the parameter’s name.
Description: Add a description for the parameter in order to recognize it quickly.
Peak power: Enter the included devices’ peak power in peak kW.
Next step: Go to the next configuration step.

Define the Source for Irradiance (Step 2 of 3)
Enter the Irradiance parameter to use for calculating this PR.
Type
s
Parameters Elements
Selected
Types: Protocols for plant devices. Select a protocol to see the parameters available for monitoring.
Parameters: Parameters that can be monitored from the protocol selected. Select an Irradiance parameter to see the elements that return it.
Elements: In-plant elements that return the selected parameter. Choose one or more elements and click select.
Selected: Shows the parameter and element that originated the selection.
Next step: Go to the next configuration step.
Next step

Define the Generated-Energy Source (Step 3 of 3)
Enter the generated energy parameter(s) to use for calculating this PR.
As soon as the new PR is configured, you can use it for data and graphics queries.
These parameters can be selected by choosing PR as type.
Type
s
Parameters Elements
Selected
Types: Protocols for plant devices. Select a protocol to see the parameters available for monitoring.
Parameters: Parameters that can be monitored from the protocol selected. Select a generated-energy parameter (Day’s Energy, for example) to see the elements that return it.
Elements: In-plant elements that return the selected parameter. Choose one or more elements and click select.
Selected: Shows the parameter and element(s) that originated the selection.
Finalize: Closes the add form and creates the PR.
Finalize

IMAGES
You can see plant photos and images that have been uploaded to the platform in this
gallery. Click on a photo to enlarge it.
Facility administrators may add, select, or delete images using the Facilities
Management module.
REPORT MANAGER

This tool provides the ability to manage, query, and generate facility reports.
Configure the data that you would like to include in the report, its frequency, and
recipients. The platform will generate the reports automatically as soon as they are
available.
ADD A REPORT
Modify recipients
Edit
Delete Preview
Periodicity Configured reports
Add
List
Configured reports: Details of the facility’s configured PRs: name and frequency.
Add: Opens the form for adding a report. See Add Report.
List: Displays configured reports.
Modify recipients: You can modify the report recipients with this option. See Define Recipients.
Edit: Enables modification of report configurations. The modify form works the same as the add form.
Delete: Delete a configured report.
Preview: You can see the configured report in your browser. See Viewing.
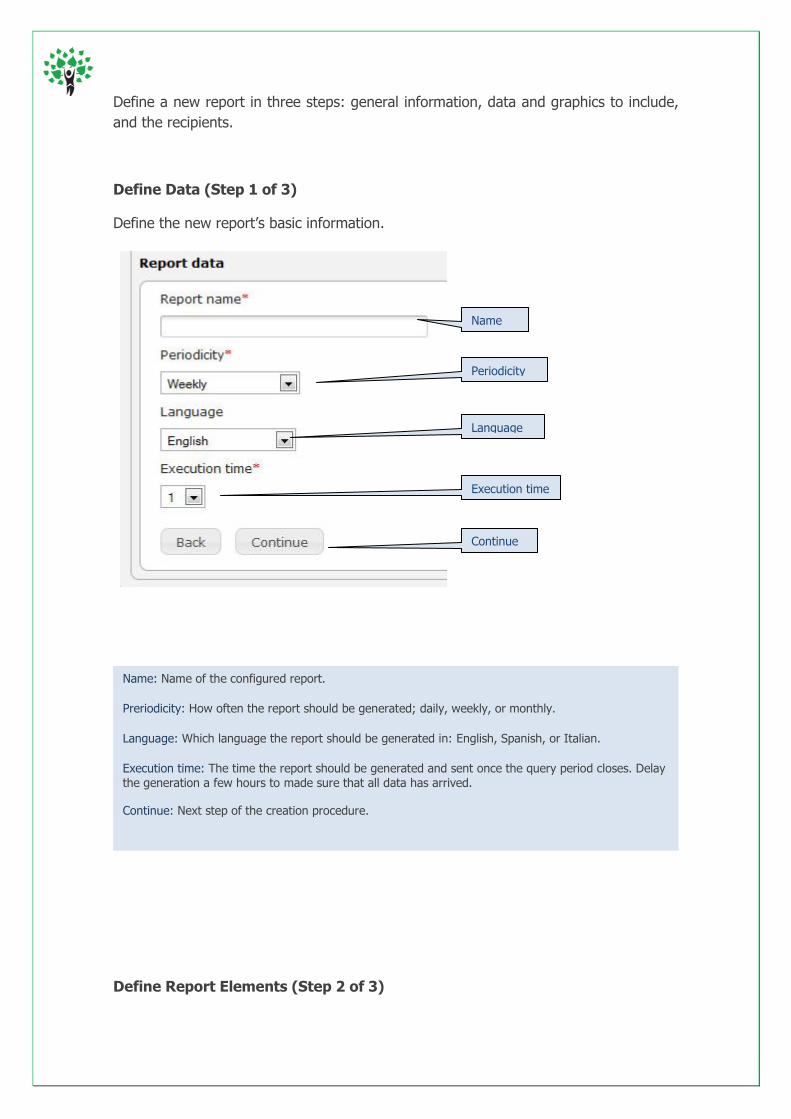
Define a new report in three steps: general information, data and graphics to include,
and the recipients.
Define Data (Step 1 of 3)
Define the new report’s basic information.
Define Report Elements (Step 2 of 3)
Name
Periodicity
Language
Execution time
Continue
Name: Name of the configured report.
Preriodicity: How often the report should be generated; daily, weekly, or monthly.
Language: Which language the report should be generated in: English, Spanish, or Italian.
Execution time: The time the report should be generated and sent once the query period closes. Delay the generation a few hours to made sure that all data has arrived.
Continue: Next step of the creation procedure.

Define the elements to be included in the new configured report. Sequentially add
data, graphics, or PR queries to the report. When finished click on Finalize.
Granularity
Save
Type
Elements included
Finalize
Type: Choose the type of element to include; favorite data, graphics, or PR queries.
Selection: Once the type is selected, choose the query you want to add.
Granularity: Define the period for the selected query; current data, the prior day, the last 5 days,
weekly, or monthly.
Grouping: In the case of data, you can define how to group the values; no grouping, one value for each 10, 15, or 30 minute interval, one value every hour, one value per day, one monthly value, or one annual value.
Save: Add the element to the report.
Elements included: List of all elements added to the report. They will be incorporated to the report in the same order they were included.
Delete: Delete the element from the report.
Data in subject: Certain custom data with a single value can be included in the subject of the email; for example, the total energy produced for the day. Only available for the last day’s granularities and daily grouping.
Finalize: Close the included element form and add the configured report to the report list.
Drop-down list
Grouping
Delete
Data in subject

Define Report Recipients (Step 3 of 3, optional)
Use the report’s Modify recipients button to define the recipients that will periodically
have the report sent to them.
e-mail address
Current recipients
E-mail address: Write the e-mail address of the new recipient and click add.
Current recipients: List of the current report recipients.
Delete: Delete the report recipient.
Delete
Add
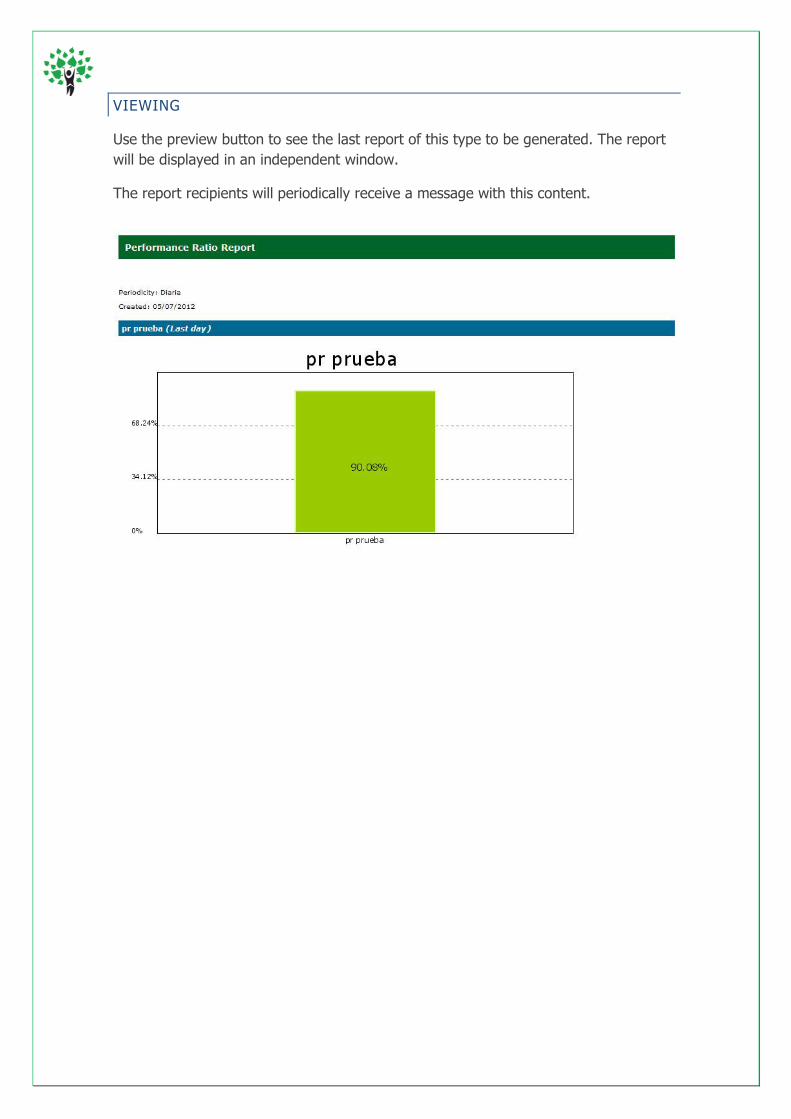
VIEWING
Use the preview button to see the last report of this type to be generated. The report
will be displayed in an independent window.
The report recipients will periodically receive a message with this content.

4. USERS MANAGEMENT MODULE
This module is used to manage users and their authorizations to the facilities available
in this platform.
List Add
Add: Get the form for adding a new user. See Add User.
List: List of current platform users. Includes name, role, and web page style associated with each
profile.
Edit: The data described for the add form may be modified here.
Modify users UAC (User Access Control): Specification of the modules and tools that the user may
display. See User Access Control.
Systems Manager: Specification of the devices and parameters that the user may display. See
Manage Systems.
Installations Manager: Specification of the facilities that the user may display. See Manage Facilities.
Delete: Delete the user from the platform.
Manage systems
Manage facilities
Modifiy users data
Delete
Modify users UAC

ADD USER
Define a new platform user in three steps: user data, contact data, and billing data.
The information can be subsequently modified.
User Data (Step 1 of 3)
Access data
Renewal
Language
Time zone
User access role
Style Sheet
Description
Footer
Continue to next step
Access data: Define the user name and password for accessing the PV Portal.
Renewal: Select the password-renewal policy: authorized (change every 6 months), unauthorized (no
change), or expired (mandatory change in the next session).
Language: The platform default language.
User-access role: The level of authority the user has to platform functionality.
Style Sheet: Write the name of the CSS file to be loaded for this user.
Continue to next step: Access the form’s second step.

Contact Data (Step 2 of 3)
User name
Contact telephone
Physical Address
Continue to next step
User name: Enter the user’s complete name.
Contact telephone: Enter land line and/or mobile phone number. Include the international prefix.
Contact e-mail: Enter the contact’s e-mail address.
Physical Address: Enter the postal address of the contact.
Continue to next step: Access the form’s final step.
Contact e-mail

Billing Data (Step 3 of 3)
Having exited the add form, authorize access to modules and facilities with the
following tools.
User name
Contact telephone
Physical Address
Finalize
User name: Enter the user’s complete name for billing purposes.
Contact telephone: Enter land line and/or mobile phone number. Include the international prefix.
Contact e-mail: Enter the contact’s email address for the invoice.
Physical Address: Enter the postal billing address.
Finalize: End the add form.
Contact e-mail

USER ACCESS CONTROL
Use this tool for managing user authorities. Designate the modules or tools the user
may access. Depending on their role, some modules or tools will not be available.
Search
Available modules Assigned modules
Apply
Search: Enter part or all of a module name and it will be used to filter the list.
Available modules: Display all of the modules that can be assigned to the user. Click on the "+" sign to
assign a specific module to the user. Use "Assign all" to assign all of the modules.
Assigned modules: Display all of the modules assigned to the user. Click on the "-" sign to remove
module authorization. Use "Remove all" to remove all of the modules.
Apply: Confirm the new authorization configuration. To cancel the changes, close the window with
"Close" or the "x" on the upper right.

MANAGE FACILITIES
Use this tool to designate which facilities the user can display with the platform.
Search
Facilities available Facilities assigned
Apply
Search: Enter part or all of a facility name and it will be used to filter the list.
Facilities available: Displays all of the facilities that can be assigned to the user. Click on the "+" sign
to assign a specific one to the user. Use "Add all" to assign all of them.
Facilities assigned: Displays all of the facilities that are assigned to the user. Click on the "-" sign to
remove authority to one of the plants. Use "Remove all" to remove all of them.
Apply: Confirms the new facility authorization configuration. To cancel the changes, close the window
with "Close" or the "x" on the upper right.

MANAGE SYSTEMS
Use this tool to manage which systems, devices, and parameters the user can display
with the platform. Facilities must be assigned to the user before you can specify
system authorizations.
Facilities: Select the configuration you want to configure.
Systems: Select the facility’s system you want to configure. In order to manage a facility’s systems,
you should have authority to the systems management module.
Entire system: Select this option to allow the user to independently access the entire facility and its
systems.
Devices and cards: Specify one or more devices or cards in order to automatically select all their linked
parameters. The user will be authorized to the ones selected.
Parameters: Select parameters individually in order to be more precise with the authorization.
Facilities
Systems
Parameters
Devices and cards
Entire system

5. INSTANT MESSAGING MODULE
This module is for reading and sending message for other platform users. A small red
marker will appear in the upper part of the module when you have a new message.
New message Search messages
Navigation control
Message list
Already read
View
Answer
Delete
Search messages: Filter the messages using Title/Content or sent date.
New message: Open the instant message editor. See New Message.
Navigation controls: Use the forward/back arrows to navigate between the pages of the list, or the
numbers to go to a specific page.
Message list: Shows messages received, displaying the title, author, sent date, and who answered.
Already read: Indicates that message has been read. Clear the box.
View: Shows the message content in a separate window.
Answer: Open the editor to respond to this message.
Delete: Delete the message from the message module.

NEW MESSAGE
Use the instant-messaging text editor to communicate with other platform
users.
Sender
Recipients
Subject
Message text
Send
Sender: Displays the author of the message.
Recipients: Select who you want send the message to, adding them with "+", or use "Add all" for mass
messages. To unselect, use "-" in the column on the right, or "Remove all."
Subject: Indicates the subject of the message.
Message text: Write the message text here.
Send: The message will be sent to the recipients. Use "Close" or the "x" on the upper part of the
window to cancel.

5. CONTACT YOUR ADMINISTRATOR
Use this tool to send a message to your administrator.
Recipient
Subject
Message text
Send
Sender: Displays the author of the message.
Recipient: By default, the message will be sent to your administrator.
Subject: Indicates the subject of the message.
Message text: Write the message text here.
Send: The message will be sent to the recipient. Use "Close" or the "x" on the upper part of the
window to cancel.
Sender

6. HELP
Use this tool to access PV Portal video tutorials and manuals.
Play
Download
Videos: You will find PV Portal Tutorial Videos here.
Documentation: You will find manuals and help documentation here.
Play: Click on the video to play it.
Download: Download the documentation you need to the desktop.
Videos
Documentation

7. GO TO PLATFORM 1.0
Use this tool to access the old version of PV Portal. A new browser window will be
opened.
C

8. PERSONAL SETTINGS
Use the gear icon and user name to access personal settings. Specify your language,
password, and time zone.
Access Personal Configuration Disconnect
Change password
Language
Time zone
Change password: Enter a new password and confirm it.
Language: Choose your PV Portal language.
Time zone: Specify your time zone.
Save: Save the changes.
GLOSSARY
Plant/facility: Photovoltaic or another type of installation.
Element: Device monitored in-plant. The most common are: Meters, Sensors,
Inverters, Dataloggers, Strings, and Trackers.
Parameter: Variable retrieved from a device. E.g.: AC Power.
Value: Parameter information collected from the device at a moment in time.
Custom parameter: Formula for a set of elements and/or parameters. Ex: Average
irradiance, Performance ratio, Availability.
Module: Independent Plug-in.
Alert: Programmed warning that is activated when alarm conditions are met.
Alarm: Conditions defined by means of parameters or fixed values that activate a
warning when they are met.
PR (Performance Ratio): Performance percentage of an inverter or meter based on
Average Insolation.
Total Energy: Power produced by the plant or element in kW/h
© GreenPowerMonitor, 2012