gpgpu$efforts$atlos$alamos,$$ status$and$tool$needs$cscads.rice.edu/lanl_cscads12.pdf · high...
TRANSCRIPT

HPC High Performance Computing
GPGPU efforts at Los Alamos, Status and Tool needs
-‐ plus, CBTF for monitoring efforts David Montoya
Input from: Laura Monroe, Phil Romero, Bob Robey, ScoH Pakin, Pat McCormick, Mike Mason
CScADS 2012 6/26/12
UNCLASSIFIED LA-‐UR-‐12-‐22355

HPC High Performance Computing
• TesSng TLCC2 machines with GPGPUs
• Working out libraries and drivers to support iniSal producSon implementaSon into TOSS
• Working on visualizaSon capability
• Tools to idenSfy code transiSon to GPGPUs
• Compiler Infrastructure research
UNCLASSIFIED LA-‐UR-‐12-‐22355
HPC IntegraSon
Apps Team
CS Research
• DoE "mini-‐app" developed to facilitate collaboraSon between hardware and soZware development
Moonlight
Lightshow
Viewmaster
Helios
Darwin
Intel MIC
VisualizaSon clusters
TLCC2 GPGPU cluster -‐ Recent producSon addiSon
Cray XK6 Development -‐ August target
Research Cluster -‐ manycore -‐ Dense node communicaSon -‐ Access to pre-‐release HW, MIC,
Fusion
Teller
Sandia’s Exascale Research Cluster
Resources

HPC High Performance Computing
Moonlight (TLCC2 -‐first ProducSon Machine) • Intel Sandy Bridge processor + Nvidia M2090 GPU • Each CPU has dedicated PCIe link to Tesla M2090 • Peak Compute Performance: 488 TF/s • Compute nodes: 308 • Compute cores: 4,928 CPU + 315,392 GPU Viewmaster (VisualizaSon cluster) • 92 Back-‐end Rendering Nodes
– 2 NVIDIA Quadro 6000s (6 GB GDDR5 on-‐board memory) – 96 GB DDR3-‐1333 memory
• 12 Advanced User Nodes – 1 NVIDIA Quadro 6000 – 96 GB DDR3-‐1333 memory
• 56 Standard User Nodes – 1 NVIDIA Quadro 5000 (2 GB GDDR5 on-‐board memory) – 24 GB DDR3-‐1333 memory
• 39 FaciliSes Nodes to support CAVE, PowerWall, etc – 1 NVIDIA Quadro 6000, with g-‐sync daughterboard for
framelock – 96 GB DDR3-‐1333 memory
Helios – August (Cray XK6 Development machine) • 16 blades, 4 nodes per blade = 64 nodes total.
– 3 blades are I/O blades – 13 blades are compute blades
• Compute blade: – 4 amd G34 8 core CPU, 32 gb memory per node. – 4 NVIDIA 512 core GPUs (Tesla X2090) 6gb built in
memory per GPU node. • Each GPU esSmated 1331 Gigaflops peak single
precision floaSng point performance.
CS Testbeds • Darwin
– It has 48 AMD Opteron 6168 cores on each node, – with some of the nodes having 2 NVIDIA Tesla C2050
GPUs and others with 2 ATI – FirePro 7800 GPUs.
• Intel MIC – 7 node • Access to Sandia’s Exascale Research Cluster
UNCLASSIFIED LA-‐UR-‐12-‐22355
ProducSon/Development Machines

HPC High Performance Computing
SoZware Stack and TesSng -‐ Moonlight GPGPU So'ware Stack • Integrated into tri-‐lab standard TOSS stack
– Both Moonlight and VM2 are running TOSS – Standard release includes CUDA toolkit 4.1,
OpenCL • InvesSgaSng further packages
– OpenACC – DSLs like Liszt
• Debuggers: Allinea, TotalView • User-‐specified tools: in “experimental” space • Libraries as needed: Thrust, CUDAMat, CUSP
library • TesSng: ORNL’s Scalable Heterogeneous
benchmark suite, future development for monitoring and diagnosScs
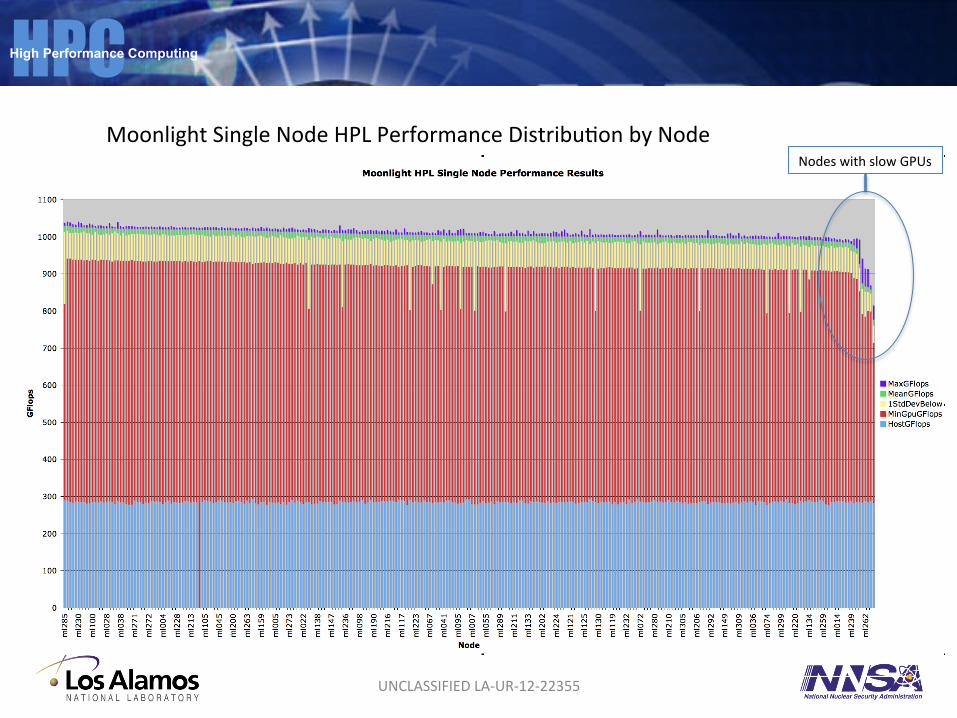
Tes1ng • Ran Nbody, SHOC test and HPL • HPL
– 488 TFLOPS peak – 1041 GFLOPS realized on a single node – Peak power 937 waHs
• Saw several double-‐bit errors – HW replacement on those GPUs
Drivers • LANL goal: one driver to handle
– Compute (on Moonlight) – GPU rendering, display framelocking (on
Viewmaster 2) • Not there yet
– Framelocking an ongoing issue • There’s a fix in a very recent driver, haven’t
tested – Earlier drivers showed some rendering
performance issues on certain specific use cases • Later drivers show beHer performance
UNCLASSIFIED LA-‐UR-‐12-‐22355

HPC High Performance Computing
TesSng Results – Phil Romero • GPUs have different performance characterisScs than CPUs • Performance in transferring data from GPUs to CPUs varies
widely even when correct affiniSes are uSlized. Not true when transferring data from CPUs to GPUs.
• GPUs much more sensiSve to memory usage on the host than CPUs, someSmes even producing non-‐linear results on performance.
• CPUs perform in a Sght performance range approximaSng a normal distribuSon, GPUs do not.
• Three tools that monitor GPU based clusters are now under development.
UNCLASSIFIED LA-‐UR-‐12-‐22355
HPC High Performance Computing
UNCLASSIFIED LA-‐UR-‐12-‐22355
Moonlight Single Node HPL Performance DistribuSon by Node
Nodes with slow GPUs

HPC High Performance Computing
UNCLASSIFIED LA-‐UR-‐12-‐22355
Moonlight Single Node HPL Performance DistribuSon USlizing Only CPUs
USlizing GPUs and CPUs – w/slow node GPUs
USlizing GPUs and CPUs w/o slow node GPUs

HPC High Performance Computing
Monitoring GPUs with CBTF – Phil Romero Three tools that uSlize CBTF (Component Based Tool Framework) and NVML (NVIDIA Management Libraries)
are currently under development:
checkGpuMemory -‐ finds GPUs that have unrecoverable double-‐bit ECC errors, and monitors single-‐bit ECC errors. GPUs with double-‐bit ECC errors are defecSve parts that need to be exchanged. The serial number and bus slot are also idenSfied to ensure the correct GPU is idenSfied. Sample output is shown below:
FAILED Node ml048 Gpu0 2bitMemoryErrors 48 BusId 0000:03:00.0 SerialNumber 0324811024641 WARNING Node ml159 Gpu1 1bitMemoryErrors 5286 BusId 0000:81:00.0 SerialNumber 0324811023640 OK Node ml040 [ will be omiHed from final output ]
checkGpuConfigs -‐ finds GPU configuraSon outliers. Sample output is shown below: 283 ConfiguraSons with Vbios 70.10 2 ConfiguraSons with Vbios 70.09 ml013,ml301 284 ConfiguraSons with PersistenceMode 1 1 ConfiguraSon with PersistenceMode 0 ml273
checkGpuU3liza3on -‐ find GPUs whose current uSlizaSon state is significantly underperforming with regard to its counterparts. This tool is designed to be run while jobs are in progress, unlike the other tools that run on idle nodes. Several different forms of outputs are possible, for example…
IdenSficaSon of staSsScal outliers: 31 Nodes with GpuPowerUsage mean 895.3 kW 1 Node with GpuPowerUsage mean 413.7 kW ml083
• ConSnuously polled Graphical output of various GPU, CPU and memory uSlizaSons by node • Graphical output summarizing various GPU, CPU and memory uSlizaSons by node aggregated over a single job. • Mixing data from IPMI sources with data from NVIDIA Management Library
UNCLASSIFIED LA-‐UR-‐12-‐22355

HPC High Performance Computing
LANL Programming Models Research
• Improved compiler infrastructure and supporSng toolchain • Compiler-‐based ApplicaSon Analysis – ScoH Pakin
UNCLASSIFIED LA-‐UR-‐12-‐22355
HPC High Performance Computing
Front End
Middle Stage
Back End
High-Level IR
Low-Level IR
Programming Languages
Dec
reas
ing
Leve
ls o
f Abs
trac
tion
Machine Code
Hardware
Dev
elop
er T
ools
Compiler StagesIntermediate/Abstract RepresentationsEnd-User Development InterafceSupporting Infrastructure
Res
ilien
cy
Perf
orm
ance
Ener
gy E
ffici
ency
Runtime
UNCLASSIFIED LA-‐UR-‐12-‐22355
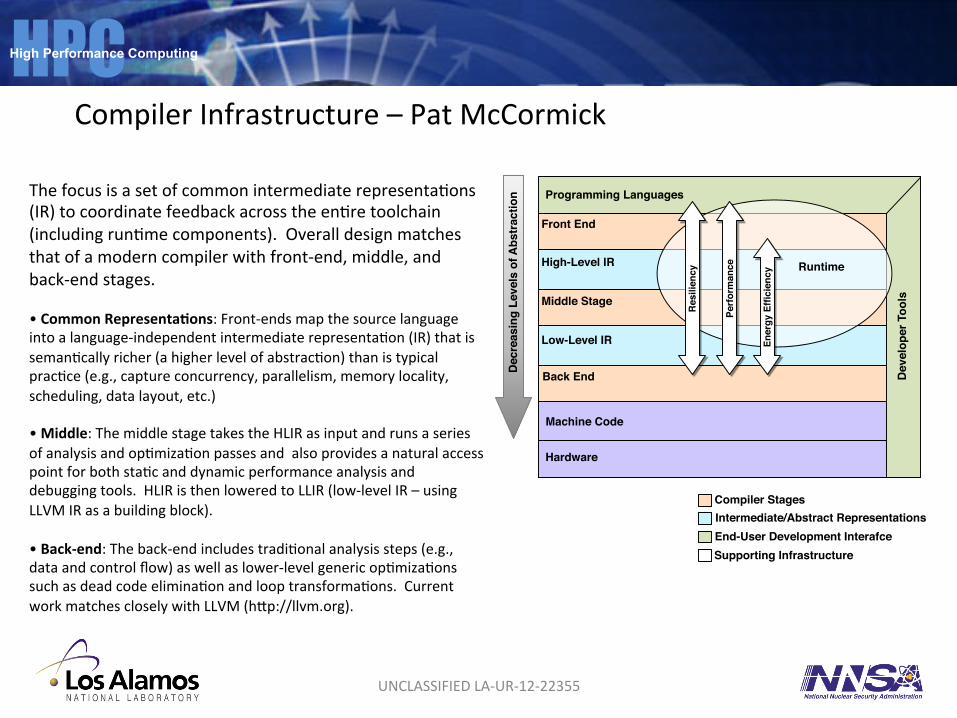
Compiler Infrastructure – Pat McCormick
The focus is a set of common intermediate representaSons (IR) to coordinate feedback across the enSre toolchain (including runSme components). Overall design matches that of a modern compiler with front-‐end, middle, and back-‐end stages. • Common Representa1ons: Front-‐ends map the source language into a language-‐independent intermediate representaSon (IR) that is semanScally richer (a higher level of abstracSon) than is typical pracSce (e.g., capture concurrency, parallelism, memory locality, scheduling, data layout, etc.) • Middle: The middle stage takes the HLIR as input and runs a series of analysis and opSmizaSon passes and also provides a natural access point for both staSc and dynamic performance analysis and debugging tools. HLIR is then lowered to LLIR (low-‐level IR – using LLVM IR as a building block). • Back-‐end: The back-‐end includes tradiSonal analysis steps (e.g., data and control flow) as well as lower-‐level generic opSmizaSons such as dead code eliminaSon and loop transformaSons. Current work matches closely with LLVM (hHp://llvm.org).

HPC High Performance Computing
UNCLASSIFIED LA-‐UR-‐12-‐22355
HW Target or
SimulaSon
DSL Code
Opt./Gen.
DSL IR
DSL Front End
DSL Source
IP Boundary DSL Compiler Infrastructure
Alterna:ve Path
• Co-‐Design acSviSes with vendors for common LLIR (low-‐level IR) based on LLVM IR – Effort underway with AMD, Intel, NVIDIA) – NVIDIA CUDA layers 4.x/5.0 already supported via open-‐source LLVM
release and compiler SDK (beta) – AMD and Intel work in progress
• Leverage vendors’ toolchain (reduced effort) – Also provides an alternaSve path for tying into future architectural simulaSon
Vendor Code
Opt./Gen.
Common IR
Example: SupporSng Domain Specific Languages

HPC High Performance Computing
Compiler-‐based ApplicaSon Analysis – ScoH Pakin Goal: Develop tool to identify functions (or whole applications) that are likely to run well at exascale -‐ and those that need immediate attention. • Implement a form of software performance
counter that measures application characteristic not available at the hardware level. Instrument the code at compile time, adding counters of various operations of interest.
• Byfl – initial ability to measure byte and flop counts – integrates with the LLVM compiler toolchain as a compiler pass.
UNCLASSIFIED LA-‐UR-‐12-‐22355
BYFL_SUMMARY: -‐-‐-‐-‐-‐-‐-‐-‐-‐-‐-‐-‐-‐-‐-‐-‐-‐-‐-‐-‐-‐-‐-‐-‐-‐-‐-‐-‐-‐-‐-‐-‐-‐-‐-‐-‐-‐-‐-‐-‐-‐-‐-‐-‐-‐-‐-‐-‐-‐-‐-‐-‐-‐-‐-‐-‐-‐-‐-‐-‐-‐-‐ BYFL_SUMMARY: 7021934541 basic blocks BYFL_SUMMARY: 5273766649 condiSonal or indirect branches BYFL_SUMMARY: -‐-‐-‐-‐-‐-‐-‐-‐-‐-‐-‐-‐-‐-‐-‐-‐-‐-‐-‐-‐-‐-‐-‐-‐-‐-‐-‐-‐-‐-‐-‐-‐-‐-‐-‐-‐-‐-‐-‐-‐-‐-‐-‐-‐-‐-‐-‐-‐-‐-‐-‐-‐-‐-‐-‐-‐-‐-‐-‐-‐-‐-‐ BYFL_SUMMARY: 140154955078 bytes (106609718886 loads + 33545236192 stores) BYFL_SUMMARY: 568213078 unique bytes BYFL_SUMMARY: 5056852452 flops BYFL_SUMMARY: 82872028639 ops BYFL_SUMMARY: -‐-‐-‐-‐-‐-‐-‐-‐-‐-‐-‐-‐-‐-‐-‐-‐-‐-‐-‐-‐-‐-‐-‐-‐-‐-‐-‐-‐-‐-‐-‐-‐-‐-‐-‐-‐-‐-‐-‐-‐-‐-‐-‐-‐-‐-‐-‐-‐-‐-‐-‐-‐-‐-‐-‐-‐-‐-‐-‐-‐-‐-‐ BYFL_SUMMARY: 1121239640624 bits (852877751088 loads + 268361889536 stores) BYFL_SUMMARY: 4545704624 unique bits BYFL_SUMMARY: 970915667328 flop bits BYFL_SUMMARY: 7468902667646 op bits BYFL_SUMMARY: -‐-‐-‐-‐-‐-‐-‐-‐-‐-‐-‐-‐-‐-‐-‐-‐-‐-‐-‐-‐-‐-‐-‐-‐-‐-‐-‐-‐-‐-‐-‐-‐-‐-‐-‐-‐-‐-‐-‐-‐-‐-‐-‐-‐-‐-‐-‐-‐-‐-‐-‐-‐-‐-‐-‐-‐-‐-‐-‐-‐-‐-‐ BYFL_SUMMARY: 3.1781 loads per store BYFL_SUMMARY: 0.9589 flops per condiSonal/indirect branch BYFL_SUMMARY: 15.7140 ops per condiSonal/indirect branch BYFL_SUMMARY: -‐-‐-‐-‐-‐-‐-‐-‐-‐-‐-‐-‐-‐-‐-‐-‐-‐-‐-‐-‐-‐-‐-‐-‐-‐-‐-‐-‐-‐-‐-‐-‐-‐-‐-‐-‐-‐-‐-‐-‐-‐-‐-‐-‐-‐-‐-‐-‐-‐-‐-‐-‐-‐-‐-‐-‐-‐-‐-‐-‐-‐-‐ BYFL_SUMMARY: 27.7158 bytes per flop BYFL_SUMMARY: 1.1548 bits per flop bit BYFL_SUMMARY: 1.6912 bytes per op BYFL_SUMMARY: 0.1501 bits per op bit BYFL_SUMMARY: -‐-‐-‐-‐-‐-‐-‐-‐-‐-‐-‐-‐-‐-‐-‐-‐-‐-‐-‐-‐-‐-‐-‐-‐-‐-‐-‐-‐-‐-‐-‐-‐-‐-‐-‐-‐-‐-‐-‐-‐-‐-‐-‐-‐-‐-‐-‐-‐-‐-‐-‐-‐-‐-‐-‐-‐-‐-‐-‐-‐-‐-‐ BYFL_SUMMARY: 0.1124 unique bytes per flop BYFL_SUMMARY: 0.0047 unique bits per flop bit BYFL_SUMMARY: 0.0069 unique bytes per op BYFL_SUMMARY: 0.0006 unique bits per op bit BYFL_SUMMARY: 246.6592 bytes per unique byte BYFL_SUMMARY: -‐-‐-‐-‐-‐-‐-‐-‐-‐-‐-‐-‐-‐-‐-‐-‐-‐-‐-‐-‐-‐-‐-‐-‐-‐-‐-‐-‐-‐-‐-‐-‐-‐-‐-‐-‐-‐-‐-‐-‐-‐-‐-‐-‐-‐-‐-‐-‐-‐-‐-‐-‐-‐-‐-‐-‐-‐-‐-‐-‐-‐-‐
Modify the compiler to inject instrumentation code. Data are output as easy-‐to-‐parse “BYFL”-‐prefixed lines.

HPC High Performance Computing
UNCLASSIFIED LA-‐UR-‐12-‐22355
KCachegrind view of Byfl measurements
HPCToolkit view of Byfl measurements

HPC High Performance Computing
ApplicaSon Team Efforts – Bob Robey • The ApplicaSon Team have an shallow-‐water AMR mini-‐app with
thousands of lines of OpenCL code and dozens of GPU kernels. – It also has an MPI layer over the OpenCL to give a hybrid parallel implementaSon. – It is a DoE "mini-‐app" developed to facilitate collaboraSon between hardware and
soZware development. It is available at hHp://www.github.com/losalamos/CLAMR
• The experience developing this mini-‐app is the basis for the much of the thoughts here. – Just starSng to look at the performance issues at the MPI/GPU interface. – Expect significant performance issues at the interface and will be working on how to
improve it.
• Robustness and crash behavior sSll needs work. – Development is in OpenCL so that portability and performance can be assessed on
different hardware playorms. – This is made difficult when one system doesn't like a few lines of kernel code and we
have to hang nodes repeatedly to work out how to recode it. On some hardware, we even have to power cycle the node or computer to fix it. Perhaps an emulator or "safe" operaSng mode that prevents crashes or hangs and gives beHer reports on the locaSon of the problem could be developed.
UNCLASSIFIED LA-‐UR-‐12-‐22355

HPC High Performance Computing
ApplicaSon Team Efforts – tool needs • Memory tools for GPU -‐-‐ to develop an applicaSon they need memory tools similar
to those developed for the CPU. Tools/funcSonality that are needed include memory leaks, memory use, out-‐of-‐bounds. GPU memory and objects are allocated in a linked-‐list structure so they can "walk the heap" (ezcl package in CLAMR at github site). But haven't yet implemented the reporSng calls. A general package for this funcSonality would be useful.
• Debugging -‐-‐ a "mailbox" technique for debugging GPUs is used. (the idea for this technique came from a Stanford graduate student). The process is: – Send in an extra array – Write debug informaSon to it in the kernel – Read back on CPU – Print. It is very effecSve, but Sme-‐consuming to setup. (an aside -‐-‐ could a similar process be used to get parSal Smings for kernels).
UNCLASSIFIED LA-‐UR-‐12-‐22355

HPC High Performance Computing
UNCLASSIFIED LA-‐UR-‐12-‐22355
• At LANL – assessing use as an administraSve tool at large scales and as a component in the monitoring infrastructure
• Component Based Tool Framework (CBTF -‐ a tri-‐lab effort with Krell InsStute) is flexible and general enough to be used for any tool that needs to “do something” on a large number of nodes and filter or collect the results.
• Sysadmin Tools – Poll informaSon on a large number of nodes. – Run commands or manipulate files on the Backends. – Make decisions at the Filter level to reduce output or interacSon
• Debugging Tools – Use cluster analysis to reduce thousands (or more) processes into a small number of
groups • Monitoring Tool
– Memory – GPGPU
Update on CBTF deployment – Mike Mason/TJ Machado

HPC High Performance Computing
UNCLASSIFIED LA-‐UR-‐12-‐22355
• PS Tool (tools/contrib/psTool) – Run ps on all Backends, use filters to idenSfy the procs running on all nodes and what procs are unique to each node.
FE
F
BE BE
Frontend
Filter
Backend
PS
Diff Same
HPC High Performance Computing
UNCLASSIFIED LA-‐UR-‐12-‐22355
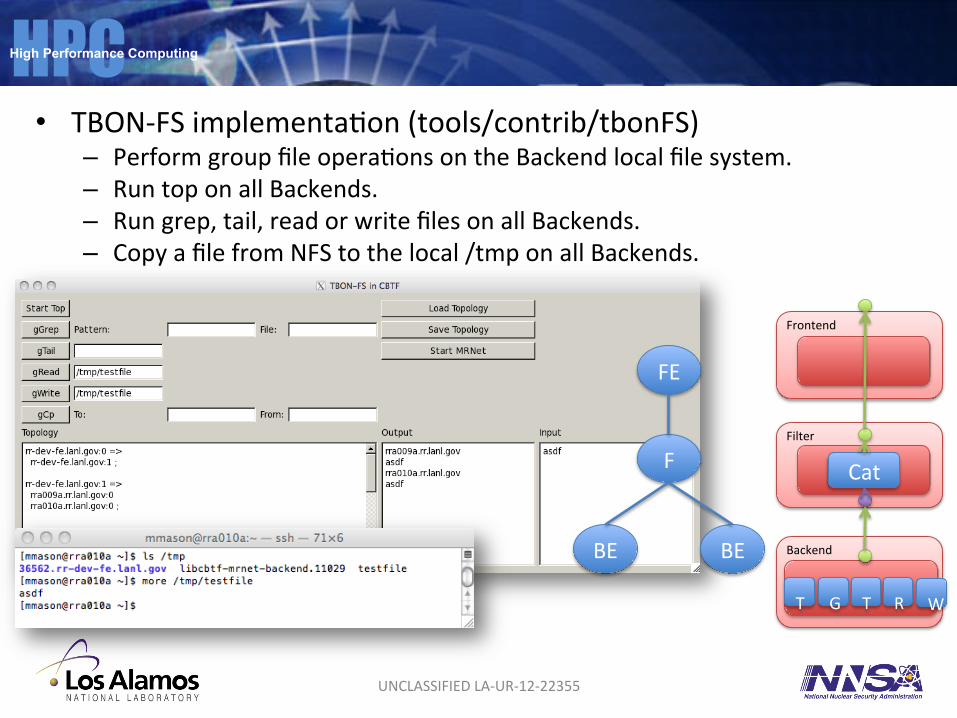
• TBON-‐FS implementaSon (tools/contrib/tbonFS) – Perform group file operaSons on the Backend local file system. – Run top on all Backends. – Run grep, tail, read or write files on all Backends. – Copy a file from NFS to the local /tmp on all Backends.
FE
F
BE BE
Frontend
Filter
Backend
T
G
T
R
W
Cat

HPC High Performance Computing
UNCLASSIFIED LA-‐UR-‐12-‐22355
• Simple memory tool -‐ memTool (tools/contrib/memTool) – Displays memory info for each node and total memory used for each MPI
process.
Frontend
Backend
PID MEM
BE
FE
FE