government support has been strong. overall semi inventory...
TRANSCRIPT

In-Line
MORGAN STANLEY ASIA LIMITED+
Jasmine Lu+852 2239-1348
Bill Lu+852 2848-5214
MORGAN STANLEY TAIWAN LIMITED+
Sharon Shih+886 2 2730-2865
Grace Chen+886 2 2730-2890
Charlie Chan+886 2 2730-1725
MORGAN STANLEY ASIA LIMITED+
Yunchen Tsai+852 2848-5636
MORGAN STANLEY TAIWAN LIMITED+
Gill Yin+886 2 2730-2811
Howard Kao+886 2 2730-2989
Melrose Chiu+886 2 2730-2860
Daniel Yen+886 2 2730-2863
Greater China Technology Hardware
Asia Pacific
IndustryView
Companies FeaturedT icker C om pany R ating Price2018-H K AAC O W 47.20
2038-H K FIH O W 3.58
285-H K BYD E O W 4.60
763-H K ZTE O W 16.26
000050-SZ T ianma O W 15.39
002456-SZ O -film O W 20.40
6415-TW Sile rgy O W 282.00
981-H K SM IC O W 0.69
300115-SZ Everw in EW 29.65
000063-SZ ZTE EW 16.87
300136-SZ Sunway EW 21.86
000725-SZ BO E EW 3.17
300032-SZ Jin long U W 26.03
2618-H K TC LC U W 5.42Source: M organ S tan ley R esearch
Greater China TechnologyGreater China TechnologySeptember 9, 2015
China Tech Conference Takeaways
Our overall tone remains cautious toward end demand, except for afew bright spots – primarily those exposed to Apple with marketshare gain. Capacity expansion is ongoing despite a demandslowdown signaling mounting pricing pressure. Suggest to ownselectively. OW AAC, SMIC, Silergy, O-film, Tianma
Morgan Stanley held China Technology Conference on September 7-8. A totalof 35 companies participated in the conference.
Smartphone supply-chain: No clear sign of strong demand pick up in Chinaheading toward 2H15. Huawei was by far, the only outstanding Chinese OEM.OEMs have dumped inventory to other EMs that has placed pressure onpricing, although the supply-chain does not seem to have slowed down thespeed of capacity expansion. Rising pressure is being seen not just in mobilepanels, touch and camera modules, but also metal casing and FPS, despiterising adoption. Suppliers exposed to Apple are still in better shape and haveguided positively toward 2H15, largely due to suppliers' confidence in theirown share gains. India is clearly the key focus for handset OEMs and thus,respective EMS.
Wireless equipment: Overall equipment investment is still increasing.Wireless will decline, but transmission/access investment will increase due todemand in data. Major overseas opportunities for Chinese equipment vendorsare Asia and to a lesser extent, Africa with 4G investment, and some pre-5Ginvestment for Euro/America. Global capex is still up slightly YoY in 2015.
TV supply-chain: TV demand has stabilized but not enough to digest allexisting inventory at set makers (two weeks above average, mostly in non-4KTVs). The TV size migration trend is clear; 45-69” are the fastest-growing sizes.Small-size panel prices have been going down in the past 1.5 years; but a-Sipanel prices have stabilized in past months.
Surveillance, IA & auto electronics: Chinese suppliers see strong growthfrom overseas markets except Russia while the outlook for China remainsconservative (mainly from the public/private segment). For IA: Not immunefrom China's macro slowdown. Some order uptick in early 3Q but still volatile.Interesting areas are in-room robotics and POS (low penetration in low tiercties). Auto electronics: China's auto market is slowing down but the impactto Chinese vendors is manageable given market share gains in overseasmarkets.
Semiconductors: Foundries (SMIC) see a stable environment in 2H15.Recently, consumer-related demand in China has deteriorated, but that isoffset by other Chinese demand (embedded memory and fingerprint sensors),plus US demand (especially WiFi) has recovered from very low levels.Fingerprints is likely the key driver in 2016. 28nm is on track for 4Q15.
Morgan Stanley does and seeks to do business withcompanies covered in Morgan Stanley Research. As a result,investors should be aware that the firm may have a conflictof interest that could affect the objectivity of MorganStanley Research. Investors should consider MorganStanley Research as only a single factor in making theirinvestment decision.For analyst certification and other important disclosures,For analyst certification and other important disclosures,refer to the Disclosure Section, located at the end of thisrefer to the Disclosure Section, located at the end of thisreport.report.+ = An alysts emp loyed by n on -U .S. a ff ilia tes are n o t reg istered w ith F INRA, mayn o t be associated person s o f th e member an d may n o t be su b ject to NASD/NYSErestriction s on commu n ication s w ith a su b ject compan y, pu b lic appearan ces an dtrad in g secu rities h eld by a research an alyst accou n t.
| September 9, 2015Greater China Technology
MORGAN STANLEY RESEARCH
1

Government support has been strong. Overall semi inventory digestion shouldend by 1Q16.
| September 9, 2015Greater China Technology
MORGAN STANLEY RESEARCH
2
Conference TakeawaysConference Takeaways
Smartphone supply-chain:Smartphone supply-chain:
AAC (2018.HK):AAC (2018.HK):
FIH (2038.HK)FIH (2038.HK)
Acoustic segment: For 2015, acoustic business will grow by low single digits YoY mainlydriven by Chinese OEMs and 2016 will be a year of further recovery due to the upgrade cycle.AAC’s market share is around 10-15% of China's total smartphone market, but for high-endSmartphones, AAC believes that market share should be close to 50% while it has around 20-30% of share in the mid-end. For the sub-Rmb1,000 segment, AAC gauges 10% of share only.AAC expects a bigger platform upgrade in 2016 and thus ASP will trend up for its majorcustomers. For China, it believes the trend of moving toward speaker boxes is in progress.Examples are Huawei’s upgrade on low-end Rmb499 equipped with a speaker box. Samsungswitched its Galaxy S5 speakerbox back to speaker is only an one off event. AAC expects GMto be on an upward trend for acoustics in 2016.
Non-acoustic segment: The non-acoustic segment in 2Q accounts for 30% of total sales.Majority is haptics:
Haptics: For haptics, AAC will remain as a dominant supplier to its major customers. AAC has45 full automation lines for haptics now, covering two-thirds of production lines used foriPhone 6 which has converted to iPhone 6S, so that there is not much extra capex required.Huawei Mate S's Force touch is not an advanced haptics design. Among Chinese OEMs,several projects for wearables will use haptics; For smartphone applications, AAC will stillfocus on Apple.
RF mechanical GM is over 40% and it’s no longer a low margin product. AAC expects RFmechanical solution sales to double in 2016. AAC has 600 CNC machines now and targets toincrease to 2,000 by end 2016. Acquisition of WiSpry should well position AAC to capture thewave for high-end smartphone that sees adoption on metal casing design. So far LeTV is thelargest customer.
Optical: Optical progress is relatively slow. Sales contribution should be less than 1%. ButAAC is penetrating one Chinese OEM to ramp of 4MP front cam, which should be theprimary supplier.
Capex: 50% of capex will be spent on non-acoustic, 30% machinery and the rest is foracoustic. AAC's biggest production base in Changzhou, Jiangsu has over 135 lines to cover75% of total capacity. AAC will gradually move its products that remain labor intensive toVietnam from Shuyang, Jiangsu as long term challenges in China are not only labor wagehikes but supply tightness. Labor costs per head in Vietnam are roughly one-third of that inShuyang.
Overall demand: FIH said that China's slowdown in smartphone demand was wellanticipated by the company as it believes China is almost close to the end of a bigreplacement cycle. FIH is well prepared for the industry slowdown, the company said.
2H15 outlook: Order book in 2H15 remains stable. Xiaomi still to grow volume double digitsYoY while Lenovo/Coolpad has been slow. FIH will expand its share within Huawei, both for
| September 9, 2015Greater China Technology
MORGAN STANLEY RESEARCH
3

Jinlong (300032.SZ)Jinlong (300032.SZ)
Sunway (300136.SZ)Sunway (300136.SZ)
Business Outlook
assembly and metal casing. A majority of Huawei’s models will be upgrading to metal casingnext year.
Strategy in India: FIH expects 600-700m units handsets a year in India will gradually migrateto smartphones. It’s like China 8-10 years ago. All handsets are made overseas and majorityof handset production for India's domestic market is sourced from Shenzhen China. Themainstream segment is sub-US$100 in India; but it should be gradually moving to a higherprice segment, according to the company. FIH plans to expand capacity in India; first stage isready. FIH has built the first site in Andhra Pradesh (eastern part of India) for Xiaomi andInfocus with the second site (the western Indian state of Maharashtra) upcoming. Thatshould enable FIH to differentiate from other competitors in China. The site selection is eitherprovince (tax benefits) or customer preference (proximity). FIH will keep its component supplyin Shenzhen, China and will only build SMT lines initially. FIH believes visibility in India is low.FIH will only work with handset OEMs who do not have in-house production to reduceinsourcing risks.
Metal casings : FIH expects metal casing adoption will continue growing in China and it willbe cautiously adding CNC machines. FIH does not expect that one material can be a long-lasting trend but thinks ceramic is still in the early stages. FIH will also outsource to Hon Haito optimize group resources when Hon Hai is in seasonal slowdown.
Refurbished smartphone business: FIH targets the US market where it is mainly dominatedby operators while the European market is mainly dominated by insurance companies. Asia ismore for trading (grey market) where half of recycled phones are iPhone followed bySamsung and Sony. FIH works closely with US operators. This remains a fragmented marketand needs to carefully manage inventories. FIH books most of its profits under otheroperating income – which should be considered as a part contribution of recurring profits.
Haptic outlook: Jinlong claims it has improved its yield rate on haptics and cited that theyield is close to 80%. Jinlong targets to have a total of 20 lines by year-end and has 12 linesqualified. It expects daily output to hit 250k in September with total 6m units likely in 3Q.Jinlong's ASP for haptics is much lower than other competitors according to the company.Jinlong will only focus on 4.7-inch iPhone 6S. Jinlong expects new model GM will achieve 50-60%. In 1H15, traditional motor GM is around 20-30%. There are two types of linear vibrators.One is a Z direction linear vibrator that addresses faster response and has a smaller size.However, Jinlong believes this will be a more transitional product (led by Samsung, AAC andLG); price is sub US$1. Another LRA-Type featuring X & Y-axis linear vibrator should be moreadvanced but suppliers are limited.
Opportunity for non-Apple customers: Jinlong also develops haptics for non-Applecustomers but is still in progress. It is working on one for Huawei and another for Microsoft.The ASP is US$1-1.5. Given lengthy design cycle and capacity constraints, Jinlong expects anyramp-up might not occur until 3Q16.
Sunway is more than just an antenna company. Sunway provides total solutions includingantennae, RF shield, and RF cable (LDS). It is hard to breakdown the revenue by theseproducts.
| September 9, 2015Greater China Technology
MORGAN STANLEY RESEARCH
4
O-Film (002456.SZ)O-Film (002456.SZ)
Business outlook
Touch business will be under pressure due to decelerating smartphone sales and increasing adoption of in-cellin high-end smartphones. Touch revenue will decline YoY in 2015 but will be higher than Rmb10bn. For CCM,2015 revenue will surpass Rmb5bn. For fingerprint sensors, revenue was limited at Rmb20m in 1H15 but willbe at least Rmb200-300m in 2H15. On a 3-5 years time-horizon, the driver for non-consumer products will bethe auto segment, including IoV (internet of vehicles).
Industry
For fingerprint modules, most are equipped with fingerprint cards sensor and area type. O-Film expects themodule price will decline 20% YoY in 2016; which can be achieved by using different sensors or replacingsapphires with coating. For CCM, anti-shaking and duo-cam will be a future trend. For touch, in-cell adoption isconstrained by panel supply. Moreover, ASP is 30% more expensive than G/F/F.
Business outlook: Revenue will grow 100%-150% Y/Y during 3Q15 to 4Q16 based on thecurrent pipeline. Sunway will see consecutive six quarters of Q/Q growth, according to thecompany.
Key competitors globally are Amphenol, Laird, Molex, and Murata and no domesticcompetitors.
Key customers include Samsung, Apple, and Microsoft, Amazon, Sony, Huawei, and OPPO.There are more tailor-made projects today which consume more engineer resources, so nowSunway will be more selective. Sunway thinks that Huawei and Samsung are long-termpartners for the Android platform. Huawei is going more international now and OPPO has50% overseas business. Coolpad and Meizu volume is now 20-30mn units and is not stable.
Mobile data antenna (WiFi antenna) ASP is much higher than FPC antenna (for voice). FPCantenna ASP is only Rmb0.9. Even though the phone's annual market size is 1bn units, theTAM is only Rmb900mn.
Net margin has improved to 16% in 1H15, and will improve to 20%-25% in the long-term,according to the company. Because Sunway differentiated by pricing before merging withLaird and now the new products are carrying higher margins. Now Sunway provides morecustomized design. US competitors require a 25%-30% margin.
Laird will not compete in antenna and there is challenge to Laird's RF shield business now.
5G antenna is still in early stages.
Sunway also provides both tailor-made and standard RF module.
Apple revenue contributed 30% in 2014, and will contribute less than 50% in 2015.Suwnay will try to maintain Apple exposure at less than 60% in the long-term. Vendor ofiPhone 6S starts P0 and P1 R&D for iPhone 7. Sunway has much stronger operationthan Molex (based in HK) in terms of logistics to supply Apple, it believes.
Sunway estimates total TAM of WiFi antenna for Apple's Macbook and iPad is aroundRmb4.8bn, and for iPhone it expects TAM is around Rmb3.2bn that includes RF shieldand WiFi antenna assuming 200m units a year. Sunway will try to penetrate more. Appletotal revenue size is around Rmb8bn related to Sunway's business.
Current Apple vendor lists: Macbook/iPad antenna module: Amphenol, TE Connectivity,Molex, Sunway; iPhone Antenna: Amphenol and Sunway; iPhone RF shield: LairdShanghai, a HK vendor, Sunway. TE Connectivity is out.
| September 9, 2015Greater China Technology
MORGAN STANLEY RESEARCH
5
Competition
O-Film’s market share in China smartphones is ~50% in 2015 with main its competitor being Crucialtec. HighC/P, flexible capacity, larger customer base, early entry benefit are the key barriers to entry going forward. ForCCM, O-Film overtook Sunny Optical to become No.1 in China in July.
Company specifics
According to the company, Fingerprint sensor gross margin could reach 11-12% in 2H15 (vs. 3% in 1H15) oncescales up. CCM revenue will continue grow in 2016 thanks to capacity expansion and improving mix.
Tianma (000050.SZ)Tianma (000050.SZ)
End demand
Pricing pressure will continue in mobile a-Si panels in 2H15 while LTPS will stay stable.
Industry
For consumers, LTPS penetration will go up from 20% in 2014 to 25% in 2015 in China smartphones; moreover,local sourcing will rise given the ramp up of Xiamen Tianma LTPS line (only 6% LTPS panel was done in XiamenTianma in 2014, all the others sourced from Korea and Japan). Auto display industry growth will be supportedby: a) industry auto sales; b) panel migration from black and white to color; c) more displays per car; and d)panel migration from non-touch to touch. Regarding industry oversupply on LTPS panels, Tianma believes thatcompetitors’ production plans don't guarantee effective output; if all plans go through, LTPS panel will seeoversupply in three years.
Competition
Competitors are from LGD/JDI (consumer) and LGD/JDI/AUO/Innolux (professional). Tianma’s competitiveadvantages include: a) Technology know-how; b) Fast response and delivery is getting incrementally criticalgiven shorter product cycle in mobile devices; and c) Strong relationship with handset OEMs. Tianma doesn’trule out the possibility of cutting prices for market share expansion.
Company specifics
Tianma now ranks global No.5-6 for professional display but targets top 3 in 3-5 years. For consumers, Tianmatargets mid-high end models at large customers. It has already penetrated to global top 15 handset vendorsexcluding Apple and could potentially penetrate into Apple's supply chain after Xiamen/Wuhan LTPS lines startproduction.
TCL Communication(2618.HK)TCL Communication(2618.HK)
1H15 recap and 2H15 outlook
On ASP, total ASP in 1H15 is lower due to: 1) higher mix of feature phones; 2) lower mix of premiumsmartphones. Smartphone blended ASP also declined due to lower mix of mid-high end smartphone mix (lowerthan 10% in 1H15), single product ASP did not have much change. Management expects 2H15 ASP to improveon better product mix (new product launches in 2H15).
1H15 GPM came in at 19%; Management sees more pressure in 2H15 due to pricing pressure. 2015 full yearGPM should range between 18-19%. Current cost is favorable as there is no component shortage.
Region
By region, MEA demonstrated fastest growth in 1H15 (from 7% to 12% of total revenue); South America was inline; Europe lagging on average, while APAC is worst. TCLC’s volume is shrinking in the segment due to more
| September 9, 2015Greater China Technology
MORGAN STANLEY RESEARCH
6

open channels. Management cites a worsening China market that is causing other handset players to dumpinventory to other countries, thus more pricing competition. N. America and MEA should continue tooutperform, it believes.
Financials
Management maintains the guidance for smartphones of 45-50mn in 2015 (1H15 19mn smart devices), tablet5-6mn, and feature phones: 28-30mn (1H15 14mn feature phone). For opex, there is no improvement in theopex to sales ratio in 2015 (compared to 2014). Dividend payout ratio should also be maintained at 30-40%, thecompany said.
Lens (300433.SZ)Lens (300433.SZ)
Business outlook
The company is looking for ~30% earnings growth in 2015. The cover glass build for 12.9” iPad is ramping upin volume in 2H15, while the build for watches shows a decline HoH in 2H15.
Industry
Mobile devices are moving to larger size. In addition, high end devices require more complicated processingsuch as 2.5D and 3D. New materials such as sapphires are also gaining traction. Orders from Apple have beenstable; the company expects next generation Apple Watch to have better function/user experience.
Competition
This is a healthy oligopoly market with only two key suppliers. Lens pursues technology leadership instead ofscale.
Company specifics
The key focus for the company is on the development and future adoption of sapphire covers. Lens develops in-house equipment to grow sapphires by KY method. Lens targets to maintain 80-90% in-house supply ratio forexisting products. Sapphire cost reduction by 30-40% is possible once the company scales up in the future, itbelieves.
BYDE (0285.HK)BYDE (0285.HK)
Metal casings
Revenue of Rmb4bn in 1H15; GPM slightly declined to 16% (vs 18% in 1H14) as Samsung’s sudden volumedrop has had some impact, thus BYDE will gradually do more client diversification. In Aug/Sep, metal casingvolume has shown some improvement thanks to Samsung’s new model; Chinese OEMs will also launch moremodels in 2H15. BYDE is in the majority of Huawei’s models and has largest share in Vivo.
Overall there is still more casing demand than supply. Management still sees no need to lower pricing for moreorders. Current ASP is US$20-30. The company believes the metal casing trend will continue for another coupleof years; BYDE used to do more die-casing for clients, now more clients have switched to CNC models. BYDE’starget is also to increase yield, or targeting to ramp up new models in 1-2 months.
BYDE currently has 16000 CNC machines and will not expand by the end of the 2015. Capex is thus Rmb2bn+in 2015, but 2016 capex will depend on demand.
Plastic casings and assembly
Assembly revenue has larger YoY decline in 1H15; in 1H14 BYDE has a Nokia ODM order (Rmb2-3bn).Assembly revenue in 2H15 should become flattish HoH; for plastic casings, the company also believes 2H15
| September 9, 2015Greater China Technology
MORGAN STANLEY RESEARCH
7
shouldn’t be worse than 1H15.
Outlook
Management's tone still sounds quite positive towards 2H15 with growth mainly from revenue and marginexpansion in metal casings. Longer-term, management sees potential efficiency improvements – BYDE currentlyhas four business departments with some business overlap and 60K-70K employees. Automobiles are not inBYDE yet; BYDE so far only engages in OEM in auto stereo and will start shipping in 2H15.
Everwin (300115.SZ)Everwin (300115.SZ)
1H15 recap and 2H15 outlook
For 1H15 revenue, metal casings is already 60% of total, other 40% in connectors, shield etc. Management'stone on long-term strategy development remains unchanged: in 1-3 years, metal casings will still be the growthdriver, mid-term Everwin will diversify into automobiles, etc, and in 5-10 years, automation will be the focus.
Metal casings update
Everwin has 2800 CNC in-house and some outsource (total 3000), targeting 3000-3500 CNC by the end of the2015. For 2016, the strategy is to focus on efficiency (i.e. generate more machine per year). Overall, Everwin willnot have more than 4000 for 2016. Fanuc will also help Everwin to improve efficiency of the machines. Everwinis cautious on CNC capacity expansion.
Currently metal casing penetration for Chinese OEMs is still only ~20% of total. High-end product could achieve30% of penetration, but supply chain still has no capacity to do that. Everwin’s current strategy is to do businesswith local Chinese OEMs (Huawei, Xiaomi, OPPO, Vivo). Currently Everwin has 50% of share in Xiaomi, still noshare in Huawei, Vivo 30-40% share allocation, OPPO less than that, thus still has room for improvement.
Management remains upbeat on Everwin’s capability to stay ahead of the competition. Everwin is not competingon price and expects pricing to continue growing. Management doesn't think CNC will be interrupted by othertechnology. Everwin has capability in die-casting, but it’s not a good technology for casing because it changesphysicals of the casing, according to the company.
Metal casing GPM is 32% in 1H15 and will improve to close to 40% in 2H15/1H16 (vs Catcher, FIH at close to50%); the improvement comes more from efficiency improvement rather than pricing improvement. Currentyield is ~60%. A yield of 70% will deliver GPM of 40%.
Automobiles
Electronic automobiles is overall under 30% of total vehicle value, and could gradually increase to 40%.Currently Everwin has revenue of Rmb1mn per month. Current product includes smart lockers for cars(shielding/metal parts) and already have certification from Magna. It’s only the third month since Everwinstarted shipping.
Other new business
For the PA the company invested, revenue in 2015 could be larger than US$1mn and revenue in 2016 willincrease to US$20-30mn. Management believes the quality is comparable to Skyworks, etc. and currentlytargets more domestic clients.
Q-Tech (1478.HK)Q-Tech (1478.HK)
1H15 recap
1H15 revenue dropped by 10% YoY, mainly due to declining ASP (blended ASP -14.5%YoY). GPM dropped to12.8%, vs 17.8% in 1H14. Net income dropped by 29%YoY. In terms of pixel breakdown, 1H15 volume mix
| September 9, 2015Greater China Technology
MORGAN STANLEY RESEARCH
8

include 4% in 13MP, 27% in 8MP, 51% in 5MP; 1H15 revenue mix included 10% in 13MP, 38% in 8MP, 43% in5MP. Management targets 8MP to contribute 45% of total volume (60% of revenue) in 2H15 and 13MP mixshould have a higher increase in 2H15. Capacity was 11kk/month in the beginning of 2015, improving to13kk/month in 1H15 and is expected to expand to 20kk/month by end of 2015. Current yield is at ~98%.
Client s
Vivo, ZTE, Lenovo, Huaqin, TCL are top 5 clients (70.6% of revenue in 1H15). Revenue from OPPO shouldincrease in 2H15. Management targets to penetrate into Huawei, Xiaomi, LeTV etc.
New Product
New product development plans include PDAF and fingerprint sensor modules. For fingerprint sensor modulesQ-Tech collaborates with FPC. Management cites barriers to entry include: 1) capacity (Q-Tech planning5kk/month in 2H15); 2) qualification (from FPC); 3) yield. Further, flexibility is also a competitive edge for Q-Tech. Currently Q-Tech is targeting Huawei, Xiaomi, OPPO, Vivo, Meizu for this business.
ZTE (0763.HK, 000063.SZ)ZTE (0763.HK, 000063.SZ)
Domestic equipment
For the next few years, management believes overall equipment investment will still increase althoughinfrastructure investment will probably decline due to tower companies. Wireless will also decline, buttransmission/access investment will increase due to demand in data. In 1H15, transmission/access revenueincreased by 40%YoY. For FTTH, there should be 60-70mn newly added subs in 2015 and 80mn+ in 2016.
On wireless investment, it’s unlikely to decline fast after 2017 as operators will need deeper coverage, as wasthe case in the 3G era. So far there’s no obvious decline in China Mobile investment: CM now already has 0.9mn4G BTS and targets 1.1mn by end of 2015. Currently it is doing TD Phase 4 with 0.4mn BTS, or 1.4mn 4G BTS bythe end of 2016. Going into 2016/2017, there will be more 4G investment from CU/CT and investment intransmission/access.
Overseas equipment
ZTE demonstrates higher growth in Europe, America (30%+YoY); for Africa it is only focusing on a few profitablecountries including South Africa, and revenue from north Africa is declining. Major overseas opportunitiesinclude: 1) in Asia, major countries including India are doing 4G investment; 2) there is some 4G investment inAfrica; 3) for Europe/America, operators have finished 4G investment and some have even started pre 5Ginvestment. Global carriers' capex should increase slightly YoY in 2015 and ZTE's share can increase 1% globallyin 2015, according to the company.
As for 5G, related investment will probably start in 2018. 4.5G has started to commercialize. ZTE has moreopportunities in 5G with European mainstream operators.
Enterprise networks
ZTE started the segment in 2013, with more focus in: 1) smart cities; and 3) transportation. Total addressablemarket for enterprise network is 10x larger than carrier networks. Enterprise networks could contribute 20%+ oftotal revenue in 3-5 years (vs 1H15: 10% of total) with annual growth rate of 30%+YoY, the company believes.
Financials
For 2015, ZTE is expecting revenue growth of 20% YoY and net profit growth of 30% YoY. For 2016, revenueshould have double digits growth; carrier network revenue from China is expected to grow by 20% YoY andfrom overseas 15% YoY; transmission/access is 30-40% of total carrier network. China/overseas revenue mixwon’t have big changes in the next 1-2 years, according to the company.
| September 9, 2015Greater China Technology
MORGAN STANLEY RESEARCH
9

Carrier network GPM in 2Q15 slightly declined, as CT/CU GPM is worse than CM’s (CT/CU is doing first yearlarger network and thus more pricing competition). GPM in 2H15 should recover; overall carrier network shouldenter network expansion stage during 2016-2018, which should deliver higher GPM than GPM during newlybuilt stage, the company said.
TCL Display (0334.HK)TCL Display (0334.HK)
End demand
China smartphone is recovering in 2H15 due to the October season. 5” FHD pricing declined 10% in 1H15 butwill stablize going forward, TCL believes.
Industry
Price gap between In-cell and out-cell is limited.
Competition
Not able to supply panel in-house is a reason why TCLD can’t penetrate into large handset customers. CSOTGen6 fab in Wuhan will give advantage to TCLD given lower cost.
Company specifics
Utilization is currently at 80% and will maintain capacity at 24 lines by year end, which is equivalent to 70munits based on 4.5” screen size. TCLD had no in-cell shipment in 1H15 but already have on-cell technologyready, the company said.
| September 9, 2015Greater China Technology
MORGAN STANLEY RESEARCH
10
TV Supply-ChainTV Supply-Chain
BOE (000725.SZ)BOE (000725.SZ)
End demand
TV demand stabilized but not enough to digest all existing inventory at set makers (two weeks above average,mostly in non-4K TVs). Small-size panels have been going down in the past 1.5 years; but a-Si prices havestabilized in past months.
Industry
Regarding the choice between a-Si and LTPS panels, BOE suggests that the production of high ppi a-Si panel willreduce effective capacity; therefore, cost is not necessarily lower than LTPS. Also, LTPS is preferred by handsetOEMs for promotional purposes.
Competition
Panel makers reaching the breakeven level is inevitable but the impact can be mitigated by adjusting productmix or reducing production. But no one would like to be the first to cut. BOE believes top four panel makers willhave utilization at ~85% in 2H15 vs. BOE at full utilization.
Company specifics
BOE initiated investment in IC but don’t control the operation. The development will focus on display relatedproducts and is for R&D only with no involvement in manufacturing.
Skyworth (0751.HK)Skyworth (0751.HK)
Business outlook
Skyworth is confident of achieving FY2016 (Apr 15-Mar16) China TV sales target at 10m units, which includes4K smart TV FY2016 target at 2.5m units. Overseas TV sales are guided to reach 5m units in FY2016.
Industry
Skyworth expects China TV sales to be 45m units in 2015 (flat YoY), mainly driven by replacements. It alsoexpects quick takeoff of smart TV adoption since it’s a big and cheap terminal to connect all the smart devices athome; penetration is now at 70% in first tier cities, 50-60% in the country overall. The TV size migration trend isclear; 45-69” are the fastest-selling sizes.
Competition
The company views the low-cost strategy from competitors (Leshi sells TVs at hardware cost) as not sustainablesince it takes several years to pay back from content revenue. Skyworth’s price premium is justified by brandawareness and better after sales service (its surveys reveal that customers on average need to call twice in thefirst week to know how to use to product).
Company specifics
Skyworth's smart TV DAU is now at 3.4m, will reach 5-6m by end of this year, and 10m next year; at that time,Skyworth will be able to do advertising itself which secures 100% advertising income (now at 15%); also, aspeople spend more time on smart TVs, there will be more advertising allocated to smart TVs. Skyworth expectsits smart TV revenue (monetization of big data) to increase to Rmb80m in 2015-17 and turn profitable in threeyears. For overseas sales, now mostly are OEM for other international brands (e.g. Panasonic, LG); own brandwill increase from 13% now to 30% in 2017-18, which bodes well for margins.
| September 9, 2015Greater China Technology
MORGAN STANLEY RESEARCH
11

TCLM (1070.HK)TCLM (1070.HK)
Business outlook
TCLM targets 2015 revenue to reach HK$40.5bn with ~Rmb50m revenue from its internet service. Smart TVswill account for 60% of total shipments and 4K TV will represent 20%. Sales through its online channel willincrease to 15% from 7.8% in 2014.
End demand
The market situation is tough but TCLM can try to mitigate the impact by better product offerings such ascurved TV and 4K TV.
Industry
Size migration is a clear trend; 1H15 average size in China reached 41.5” vs. 35-36” in 1H14. TCLM expectscurved TV volumes to reach 1.5m/3m in China in 2015/16. UHD TV will be 15m/24.3m in China in 2015/16.
Competition
The capital game (making loss for market share gain) is not TCLM's battle field. With the benefit of verticalintegration, TCLM is trying to focus on the high-end TV segment to maintain profitability.
Company specifics
TCLM targets to enlarge the spread between margins and costs while maintaining R&D investment. Despitelower shipments, 2Q15 margins hit record highs due to new product launches and better product mix. Byregion, penetration into Walmart helped volume growth and brand awareness in North America. For Europe, themost difficult stage has passed, the company believes.
| September 9, 2015Greater China Technology
MORGAN STANLEY RESEARCH
12

OthersOthers
PAX Global Technology (0327.HK)PAX Global Technology (0327.HK)
Key message from management
1H 15 Reviews
2015 Guidance
Key competition / advantages
Business update/overall
Management expects to increase the global market share to 20% in three years, aiming tobecome a one-stop integrated service provider with e-payment/maintenance/ installation/big data solutions.
1H15 sales up 10% yoy to HK$1.1 bn, owing to higher growth in overseas markets (+23%yoy). Although the blended ASP was down due to product mix changes (higher percentageon low-end product) and ASP erosion, total shipments rose by 20% to offset the negativeASP impact. Management expects ASP falling will be a long term trend.
Margin was up 3.7% thanks to high contribution from overseas markets (GM 45%~55% inoverseas markets vs. domestic one 28-35%).
Third-party vendors account for 45%~50% of sales.
Product segmentation: ASP <Rmb400/Rmb400-800/>Rmb800 as low/mid/high-end POS.
2015 sales grows 10% yoy; despite ASP down around ~20%, shipment will grow by 30~40%yoy.
High-end POS can grow around 10% yoy in units, mid-to-low end POS grows 30%~40% inunits.
Mid-low-end products accounts for 80% of sales in 2015.
Domestic/Overseas will be 55/45 in 2015, expecting to be higher in 2016.
In 2014, Ingenico (French) has 30% market share, while Verifone (USA) has 18% (PAX is 10%)
Management emphasizes its information security and product reliability as the company'sadvantages in China
According to management, the penetration of POS is still low in some tier 2-3 cities. Somesmall stores start to realize that POS is a required device for business.
More products on IoT applications; will provide a whole industry integrated solution in thefuture (integrated payment, collection, software, management, etc.) Management aims tomake the company a data center to provide whole solutions. Also, the company is stillfocusing on lifting its POS security level, in order to maintain the margin.
USA, Iran and Brazil will be the main overseas markets in the future.
Management sees no consolidation in the industry; the company won’t focus on pricecompetition with peers.
| September 9, 2015Greater China Technology
MORGAN STANLEY RESEARCH
13

Joyson (600699.SZ)Joyson (600699.SZ)
2015 growth outlook
Revenue target to be Rmb8.5bn with Rmb800mn contribution from subsidiary, Preh Joyson. Major drivers arein automotive electronics and battery management system. Management expects at least 20% YoY profit growtheach year in the next three years.
End demand
China's auto market is slowing down but the impact to Joyson should be manageable given China's autoexposure is about 25% of Joyson's total revenue. European auto sales are expected to grow by 8% YoY in 2015.Joyson aims to grow market share and its exposure in China and the US auto market, which should act as thekey drivers, the company said.
Industry
Joyson has been ranked No.1 climate control supplier in the US auto market and top 3 in central controlsystems in the European auto segment. It aims to leverage its R&D capability (via Preh in Germany) and lowcost of production in Portugal, Romania, Mexico, China, etc, to raise market share in auto electronics and specialparts offerings. Joyson will continue its M&A activities to look for scale and integration synergies, managementsaid.
Competition
Joyson aims to be on a par with the Bosch group as a leading auto parts company worldwide. At the same time,Joyson plans to focus more on new energy-related system developments (such as BMS, turbo, etc) andintegrated products ( like integrated HMI (human machine interaction) offerings to BMW iDrive and Mercedes)to take the lead ahead of competitions.
Company specifics
Joyson remains in growth mode; thus, has no plans to pay out a cash dividend in the near future. The recentfund raising of Rmb1bn in late August mainly aims to develop the newly acquired Quin for its decoration partsbusiness, the company said.
| September 9, 2015Greater China Technology
MORGAN STANLEY RESEARCH
14
SemiconductorSemiconductor
HisiliconHisilicon
Strategy
Smartphone chipset
Wired communications
Sever semi
Silergy (6415.TW)Silergy (6415.TW)
Hisilicon started in fixed wire communications, then entered into mobile communications(data card dongle), and now focuses on smartphone SoC and STB chipsets.
Hisilicon is very strategic to the Huawei group, because it can develop modem standards thatare not sufficiently provided by third party vendors, for example , the TDD-LTE. Huaweitargets to become as big a platformer as Apple and Samsung, according to Hisilicon.
Hisilicon doesn't really need subsidies or investment from big IC funds. Huaiwei is not likely togo for IPO in next 5-10 years, management said.
Revenue size ranks No.8 in global fabless in terms of revenue (US$3bn revenue in 2015).
Huawei cares more about vendor diversification, not the cost of Hisilicon. Huawei doesn'twant to substitute all third party vendors.
Hisilicon leads Qualcomm in quad-core product, almost the same schedule as Cat 6.
All Hisilicon's smartphone chipset product is SoC (baseband+AP) because Hisilicon hasstronger technology in modems than Samsung and Apple have in-house.
Hisilicon doesn't think Huawei would take over Qualcomm's chipset business unless itincludes IP.
New features for next year: 1) lower power consumption; 2) phone camera; 3) geometrymigration.
TSMC and SMIC are key foundry suppliers. But SMIC's 28nm IP is not sufficient to providefoundry services to multi chipset customers. Hisilicon could not comment on annual waferdemand. Hisilicon is a key customer to both TSMC and SMIC.
Huawei is the only customer for Hisilicon's telecom chips.
Telecom equipment vendors now include Nokia, ZTE, Alcatel, Samsung, Ericsson, Huawei.
Huawei is the number one telecom equipment vendor in terms of shipments. Huawei hassimilar shipments to Ericsson in the wireless segment, but is still quite behind Cisco in wiredcommunications, especially for enterprise customers.
US market: It is very hard to penetrate into the telecom operator market, and Huawei will tryto ramp up its smartphone business first.
Intel remains key partner for its server business because X86 has much better performance.Hisilicon is also surveying ARM-based CPU.
3Q15 is tracking slightly below guidance given poor PC power IC demand. 3Q should be
| September 9, 2015Greater China Technology
MORGAN STANLEY RESEARCH
15

SMIC (0981.HK)SMIC (0981.HK)
China demand continues to drive outperformance
SMIC sees a stable environment in 2H15. Management stated that 3G is tracking to expectations and 4Gappears flattish sequentially. Recently, consumer related demand in China has deteriorated, but that is offset byother China demand (embedded memory and fingerprint sensors), plus US demand (especially WiFi) hasrecovered from very low levels.
Fingerprints is likely the key driver in 2016. Fingerprint related chips are already significant as a percentage ofsales and that could see significant increase in 2016. Morgan Stanley analyst, Sharon Shih, expects fingerprintsensors to be used in 25% of China smartphones in 2016. Management stated that capacity could be an issuebut the company is qualifying new fabs to meet demand.
28nm is on track for 4Q15. Management reiterated that 28nm will start in 3Q15 (in the Shanghai fab), withrevenues in 4Q15. Currently management believes the GM impact will be similar to when the company firstramped up 40nm, when it caused a 600-700 bps GM drop in 4Q11. 28nm and 40nm both should grow into4Q15.
Government support has been strong. Whereas in the past, SMIC saw government support mostly in the formof R&D subsidies, management is now seeing a wider range of support and larger sums overall, includingcapex.
down slightly Q/Q, vs. guidance flat Q/Q.
LED lighting demand is also slowing in 3Q, but should recover in 4Q this year. Overall semiinventory digestion should end by 1Q16.
On China government's policy to develop analog IC industry in China, Silergy thinksgovernment can intensify more R&D through tax exemptions, and also build up strong waferfoundry support for analog IC. That said, Silergy's virtual IDM business model is morecompetitive, but hard to duplicate.
On recent M&A, Silergy thinks the impact from MTK announcing to buy Richtek is limited,given smartphone power IC is still small for Silergy. And the compnay believes end OEMcustomers are the final decision makers for analog IC adoption, and Silergy is competitive inperformance, costs and customer support.
Silergy will continue to grow strongly in 2016, new products include AC-DC, battery chargers,sensors, and panel power IC.
| September 9, 2015Greater China Technology
MORGAN STANLEY RESEARCH
16

Valuation ComparisonValuation Comparison
Exhibit 1:Exhibit 1: Valuation Comparison
9/9/2015 Price MarketClosing Target Cap
Ticker Company Price Rating (LC) (US$ m) 15E 16E 15E 16E 15E 16E 15E 16E 15E 16E 15E 16E 15E 16E 15E 16EA-Share2018-HK AAC 48.05 HKD OW 54.00 HKD 7,613 2.40 e 2.91 e 27% 21% 16.4 e 13.6 e 4.3 e 3.5 e 12.1 9.9 20.5 20.9 28.8 28.6 1.8% e 2.3% e2038-HK FIH 3.67 HKD OW 4.80 HKD 3,738 0.04 e 0.05 e 60% 28% 13.2 e 10.3 e 0.8 e 0.8 e 2.0 1.1 3.7 4.3 6.7 7.8 1.5% e 2.4% e300032-SZ Jinlong 26.44 UW 22.00 2,807 0.61 e 0.72 e 255% 18% 43.2 e 36.6 e 8.2 e 6.9 e 36.6 25.1 9.4 9.8 20.4 20.4 0.3% e 0.4% e000725-SZ BOE 3.24 EW 4.10 17,276 0.09 e 0.11 e 27% 22% 35.1 e 28.9 e 1.4 e 1.4 e 9.0 7.5 2.2 2.4 4.1 4.8 0.0% e 0.3% e000050-SZ Tianma 15.95 OW 29.60 2,835 0.57 e 0.80 e 6% 40% 27.9 e 19.8 e 2.0 e 1.8 e 13.2 9.2 3.7 4.3 7.3 9.6 0.6% e 0.7% e002456-SZ O-film 21.80 OW 40.20 3,529 0.70 e 1.01 e 5% 45% 31.3 e 21.6 e 3.5 e 3.1 e 19.2 12.1 4.5 5.2 11.7 15.1 0.5% e 0.5% e2618-HK TCLC 5.50 UW 4.00 894 0.88 e 0.79 e -3% -10% 6.2 e 7.0 e 1.3 e 1.2 e 5.9 6.8 5.2 4.2 23.3 18.1 5.3% e 4.7% e285-HK BYDE 4.78 HKD OW 10.00 HKD 1,390 0.47 e 0.63 e 17% 34% 8.4 e 6.2 e 0.8 e 0.7 e 2.5 1.9 6.1 7.5 10.4 12.4 0.0% e 0.0% e300115-SZ Everwin 30.55 EW 45.00 2,667 0.90 e 1.20 e 73% 33% 33.9 e 25.4 e 5.0 e 4.3 e 21.5 16.1 10.3 10.8 18.4 18.3 0.7% e 1.0% e763-HK ZTE 16.26 HKD OW 22.50 HKD 1,643 0.80 e 0.98 e 25% 23% 16.8 e 13.7 e 1.9 e 1.7 e 11.7 9.4 3.0 3.6 11.8 13.0 0.6% e 0.7% e000063-SZ ZTE 16.87 EW 22.50 9,118 0.80 e 0.98 e 25% 23% 21.2 e 17.3 e 2.4 e 2.1 e 11.7 9.4 3.0 3.6 11.8 13.0 0.5% e 0.6% e300136-SZ Sunway 23.27 EW 28.00 2,178 0.35 e 0.56 e 52% 58% 66.1 e 41.9 e 14.9 e 11.2 e 52.1 34.6 15.8 18.4 25.1 30.4 0.1% e 0.1% e6415-TW Silergy 286.50 OW 340.00 682 15.21 e 18.82 e 44% 24% 18.8 e 15.2 e 5.1 e 4.1 e 15.6 11.4 26.7 27.0 29.5 29.5 2.0% e 2.5% e981-HK SMIC 0.71 HKD OW 0.90 HKD 3,733 0.01 e 0.01 e 43% 20% 15.9 e 13.2 e 1.1 e 1.0 e 6.2 5.2 4.0 4.5 7.8 8.7 0.0% e 0.0% e751-HK Skyworth 5.20 NC NA 1,921 0.66 0.68 25% 2% 7.8 7.6 1.2 1.0 6.1 5.1 6.2 5.8 17.0 13.3 4.2% e 4.2% e600699-SH Joyson 26.00 NC NA 2,598 0.73 0.94 31% 29% 35.7 27.6 5.2 4.4 13.9 10.7 6.9 7.3 15.3 16.4 0.4% e 0.6% e300433-SZ Lens Tech 66.30 NC NA 7,012 2.79 4.04 NM 45% 23.8 16.4 3.9 3.7 N/A N/A N/A NA 14.9 16.8 0.6% e 1.1% e1070-HK TCL Multi 3.82 NC NA 661 0.26 0.36 18% 38% 14.5 10.5 1.0 1.0 6.6 5.3 1.5 2.3 7.3 9.5 2.2% e 3.1% e1478-HK Q-tech 1.36 NC NA 179 0.23 0.25 15% 9% 5.8 5.4 N/A N/A 3.6 3.0 8.4 8.0 18.7 18.1 N/A N/A300104-SZ Leshi 36.49 NC NA 10,632 0.29 0.41 49% 45% 128.0 88.4 14.2 11.9 16.1 27.9 5.6 7.3 16.1 20.0 0.3% e 0.4% e002008-SZ Hans Laser 21.69 NC NA 3,597 0.74 1.02 10% 37% 29.3 21.3 4.0 3.5 24.1 17.8 9.5 11.6 14.5 17.2 0.9% e 1.3% e
Cash DividendYieldEV/EBITDA ROA (%) ROE (%)EPS (LC) EPS Growth (%) P/B (X)P/E (X)
Sou rce: Th omson Reu ters, Morgan Stan ley Research , E= Morgan Stan ley Research estimates, NC= Non -coverd compan ies. Fo r NC, w e u sed Th omson con sen su s estimates
| September 9, 2015Greater China Technology
MORGAN STANLEY RESEARCH
17

Disclosure SectionThe information and opinions in Morgan Stanley Research were prepared or are disseminated by Morgan Stanley Asia Limited (which accepts theresponsibility for its contents) and/or Morgan Stanley Asia (Singapore) Pte. (Registration number 199206298Z) and/or Morgan Stanley Asia (Singapore)Securities Pte Ltd (Registration number 200008434H), regulated by the Monetary Authority of Singapore (which accepts legal responsibility for its contentsand should be contacted with respect to any matters arising from, or in connection with, Morgan Stanley Research), and/or Morgan Stanley Taiwan Limitedand/or Morgan Stanley & Co International plc, Seoul Branch, and/or Morgan Stanley Australia Limited (A.B.N. 67 003 734 576, holder of Australian financialservices license No. 233742, which accepts responsibility for its contents), and/or Morgan Stanley Wealth Management Australia Pty Ltd (A.B.N. 19 009145 555, holder of Australian financial services license No. 240813, which accepts responsibility for its contents), and/or Morgan Stanley India CompanyPrivate Limited, regulated by the Securities and Exchange Board of India (“SEBI”) and holder of licenses as a Research Analyst (SEBI Registration No.INH000001105); Stock Broker (BSE Registration No. INB011054237 and NSE Registration No. INB/INF231054231), Merchant Banker (SEBI RegistrationNo. INM000011203), and depository participant with National Securities Depository Limited (SEBI Registration No. IN-DP-NSDL-372-2014) which acceptsthe responsibility for its contents and should be contacted with respect to any matters arising from, or in connection with, Morgan Stanley Research, and/orPT Morgan Stanley Asia Indonesia and their affiliates (collectively, "Morgan Stanley").For important disclosures, stock price charts and equity rating histories regarding companies that are the subject of this report, please see the MorganStanley Research Disclosure Website at www.morganstanley.com/researchdisclosures, or contact your investment representative or Morgan StanleyResearch at 1585 Broadway, (Attention: Research Management), New York, NY, 10036 USA.For valuation methodology and risks associated with any price targets referenced in this research report, please contact the Client Support Team as follows:US/Canada +1 800 303-2495; Hong Kong +852 2848-5999; Latin America +1 718 754-5444 (U.S.); London +44 (0)20-7425-8169; Singapore +65 6834-6860;Sydney +61 (0)2-9770-1505; Tokyo +81 (0)3-6836-9000. Alternatively you may contact your investment representative or Morgan Stanley Research at 1585Broadway, (Attention: Research Management), New York, NY 10036 USA.Analyst CertificationThe following analysts hereby certify that their views about the companies and their securities discussed in this report are accurately expressed and thatthey have not received and will not receive direct or indirect compensation in exchange for expressing specific recommendations or views in this report:Charlie Chan; Grace Chen; Melrose Chiu; Bill Lu; Jasmine Lu; Sharon Shih; Yunchen Tsai.Unless otherwise stated, the individuals listed on the cover page of this report are research analysts.Global Research Conflict Management PolicyMorgan Stanley Research has been published in accordance with our conflict management policy, which is available atwww.morganstanley.com/institutional/research/conflictpolicies.Important US Regulatory Disclosures on Subject CompaniesThe following analyst or strategist (or a household member) owns securities (or related derivatives) in a company that he or she covers or recommends inMorgan Stanley Research: Jasmine Lu - Acer Inc.(common or preferred stock), Compal Electronics(common or preferred stock), WistronCorporation(common or preferred stock).As of August 31, 2015, Morgan Stanley beneficially owned 1% or more of a class of common equity securities of the following companies covered in MorganStanley Research: Catcher Technology, Delta Electronics Inc., Epistar, Flexium, Foxconn Technology, Largan Precision, Pegatron Corporation, TPKHolding, Unimicron.Within the last 12 months, Morgan Stanley managed or co-managed a public offering (or 144A offering) of securities of Cowell eHoldings.In the next 3 months, Morgan Stanley expects to receive or intends to seek compensation for investment banking services from AAC TechnologiesHoldings, Cowell eHoldings, GoerTek Inc, Innolux, Lenovo, Pegatron Corporation, SMIC.Within the last 12 months, Morgan Stanley has received compensation for products and services other than investment banking services from AACTechnologies Holdings, Acer Inc., Asustek Computer Inc., AU Optronics, BYD Electronics, Compal Electronics, Hon Hai Precision, Innolux, QuantaComputer Inc., SMIC, Synnex Technology International Corp., Tripod Technology.Within the last 12 months, Morgan Stanley has provided or is providing investment banking services to, or has an investment banking client relationshipwith, the following company: AAC Technologies Holdings, Cowell eHoldings, GoerTek Inc, Innolux, Lenovo, Pegatron Corporation, SMIC.Within the last 12 months, Morgan Stanley has either provided or is providing non-investment banking, securities-related services to and/or in the past hasentered into an agreement to provide services or has a client relationship with the following company: AAC Technologies Holdings, Acer Inc., AsustekComputer Inc., AU Optronics, BYD Electronics, Compal Electronics, Digital China Holdings Limited, Hon Hai Precision, Innolux, Lenovo, Quanta ComputerInc., SMIC, Synnex Technology International Corp., TCL Communication, TPK Holding, Tripod Technology, Wistron Corporation.Morgan Stanley & Co. LLC makes a market in the securities of AU Optronics.The equity research analysts or strategists principally responsible for the preparation of Morgan Stanley Research have received compensation based uponvarious factors, including quality of research, investor client feedback, stock picking, competitive factors, firm revenues and overall investment bankingrevenues.Morgan Stanley and its affiliates do business that relates to companies/instruments covered in Morgan Stanley Research, including market making,providing liquidity, fund management, commercial banking, extension of credit, investment services and investment banking. Morgan Stanley sells to andbuys from customers the securities/instruments of companies covered in Morgan Stanley Research on a principal basis. Morgan Stanley may have aposition in the debt of the Company or instruments discussed in this report.Certain disclosures listed above are also for compliance with applicable regulations in non-US jurisdictions.STOCK RATINGSMorgan Stanley uses a relative rating system using terms such as Overweight, Equal-weight, Not-Rated or Underweight (see definitions below). MorganStanley does not assign ratings of Buy, Hold or Sell to the stocks we cover. Overweight, Equal-weight, Not-Rated and Underweight are not the equivalent ofbuy, hold and sell. Investors should carefully read the definitions of all ratings used in Morgan Stanley Research. In addition, since Morgan StanleyResearch contains more complete information concerning the analyst's views, investors should carefully read Morgan Stanley Research, in its entirety, andnot infer the contents from the rating alone. In any case, ratings (or research) should not be used or relied upon as investment advice. An investor's decisionto buy or sell a stock should depend on individual circumstances (such as the investor's existing holdings) and other considerations.Global Stock Ratings Distribution(as of August 31, 2015)For disclosure purposes only (in accordance with NASD and NYSE requirements), we include the category headings of Buy, Hold, and Sell alongside ourratings of Overweight, Equal-weight, Not-Rated and Underweight. Morgan Stanley does not assign ratings of Buy, Hold or Sell to the stocks we cover.Overweight, Equal-weight, Not-Rated and Underweight are not the equivalent of buy, hold, and sell but represent recommended relative weightings (seedefinitions below). To satisfy regulatory requirements, we correspond Overweight, our most positive stock rating, with a buy recommendation; we correspondEqual-weight and Not-Rated to hold and Underweight to sell recommendations, respectively.
| September 9, 2015Greater China Technology
MORGAN STANLEY RESEARCH
18
COVERAGE UNIVERSE INVESTMENT BANKING CLIENTS (IBC)STOCK RATING CATEGORY COUNT % OF TOTAL COUNT % OF TOTAL
IBC% OF RATING
CATEGORYOverweight/Buy 1206 36% 356 44% 30%Equal-weight/Hold 1446 43% 352 44% 24%Not-Rated/Hold 94 3% 11 1% 12%Underweight/Sell 601 18% 83 10% 14%TOTAL 3,347 802
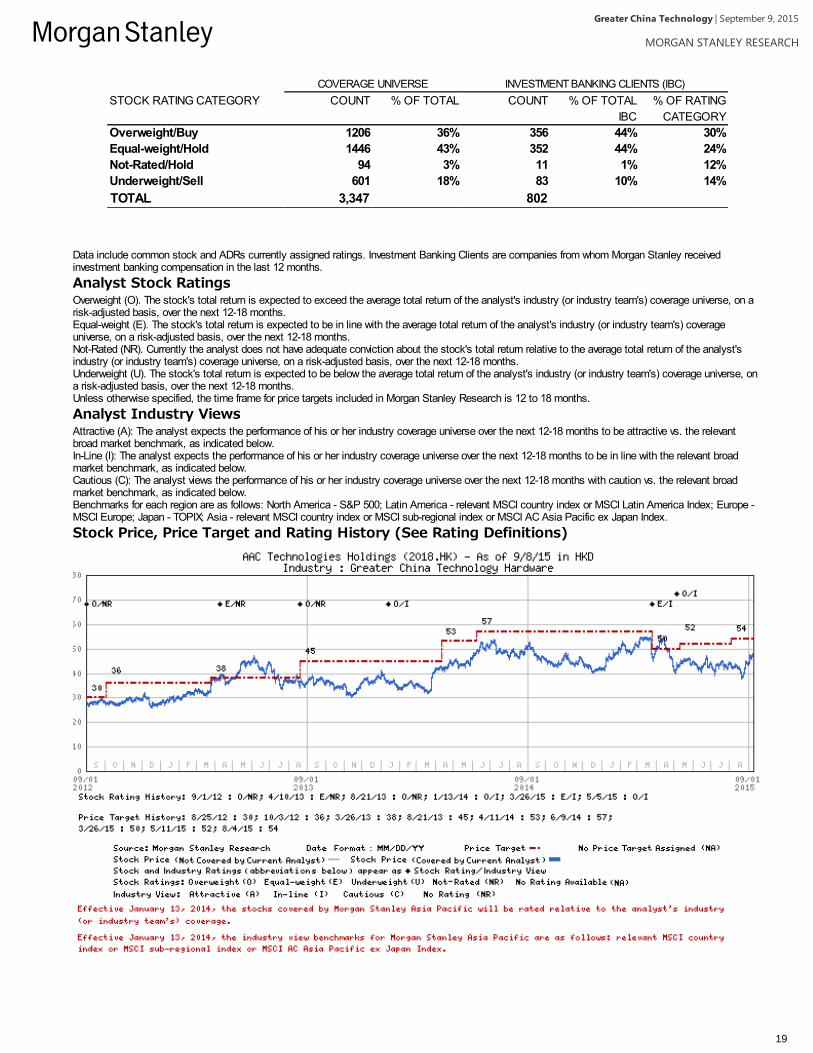
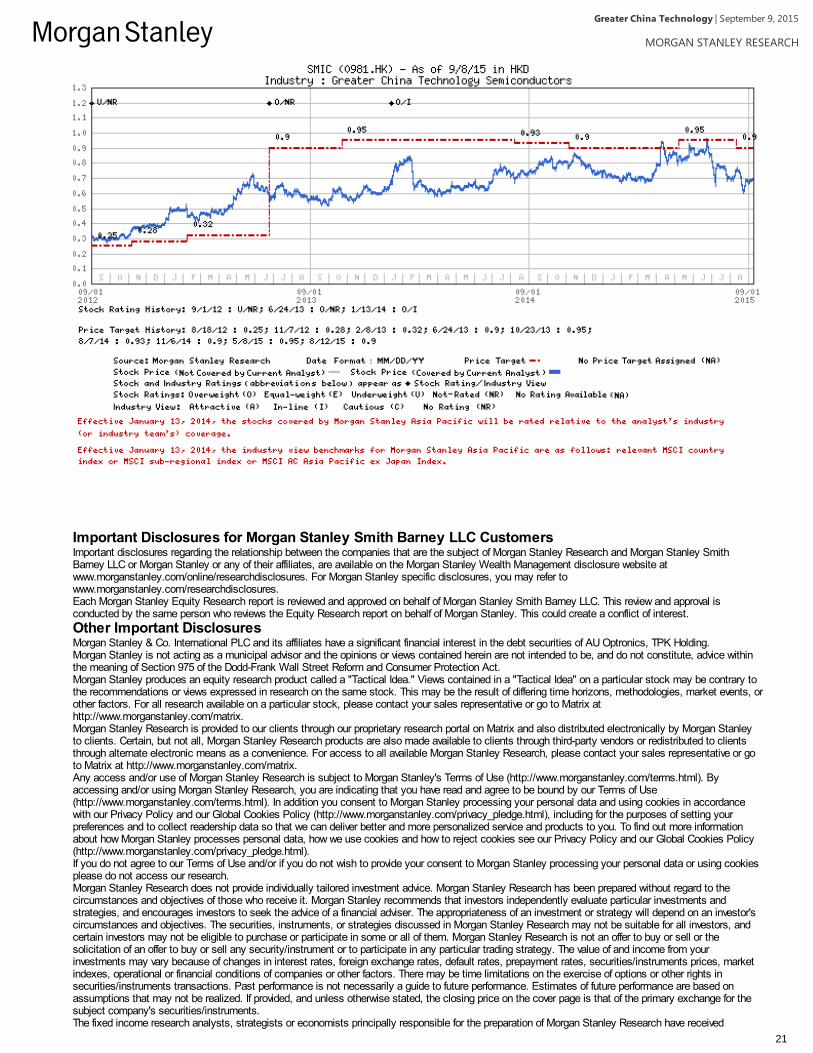
Data include common stock and ADRs currently assigned ratings. Investment Banking Clients are companies from whom Morgan Stanley receivedinvestment banking compensation in the last 12 months.Analyst Stock RatingsOverweight (O). The stock's total return is expected to exceed the average total return of the analyst's industry (or industry team's) coverage universe, on arisk-adjusted basis, over the next 12-18 months.Equal-weight (E). The stock's total return is expected to be in line with the average total return of the analyst's industry (or industry team's) coverageuniverse, on a risk-adjusted basis, over the next 12-18 months.Not-Rated (NR). Currently the analyst does not have adequate conviction about the stock's total return relative to the average total return of the analyst'sindustry (or industry team's) coverage universe, on a risk-adjusted basis, over the next 12-18 months.Underweight (U). The stock's total return is expected to be below the average total return of the analyst's industry (or industry team's) coverage universe, ona risk-adjusted basis, over the next 12-18 months.Unless otherwise specified, the time frame for price targets included in Morgan Stanley Research is 12 to 18 months.Analyst Industry ViewsAttractive (A): The analyst expects the performance of his or her industry coverage universe over the next 12-18 months to be attractive vs. the relevantbroad market benchmark, as indicated below.In-Line (I): The analyst expects the performance of his or her industry coverage universe over the next 12-18 months to be in line with the relevant broadmarket benchmark, as indicated below.Cautious (C): The analyst views the performance of his or her industry coverage universe over the next 12-18 months with caution vs. the relevant broadmarket benchmark, as indicated below.Benchmarks for each region are as follows: North America - S&P 500; Latin America - relevant MSCI country index or MSCI Latin America Index; Europe -MSCI Europe; Japan - TOPIX; Asia - relevant MSCI country index or MSCI sub-regional index or MSCI AC Asia Pacific ex Japan Index.Stock Price, Price Target and Rating History (See Rating Definitions)
| September 9, 2015Greater China Technology
MORGAN STANLEY RESEARCH
19

| September 9, 2015Greater China Technology
MORGAN STANLEY RESEARCH
20
Important Disclosures for Morgan Stanley Smith Barney LLC CustomersImportant disclosures regarding the relationship between the companies that are the subject of Morgan Stanley Research and Morgan Stanley SmithBarney LLC or Morgan Stanley or any of their affiliates, are available on the Morgan Stanley Wealth Management disclosure website atwww.morganstanley.com/online/researchdisclosures. For Morgan Stanley specific disclosures, you may refer towww.morganstanley.com/researchdisclosures.Each Morgan Stanley Equity Research report is reviewed and approved on behalf of Morgan Stanley Smith Barney LLC. This review and approval isconducted by the same person who reviews the Equity Research report on behalf of Morgan Stanley. This could create a conflict of interest.Other Important DisclosuresMorgan Stanley & Co. International PLC and its affiliates have a significant financial interest in the debt securities of AU Optronics, TPK Holding.Morgan Stanley is not acting as a municipal advisor and the opinions or views contained herein are not intended to be, and do not constitute, advice withinthe meaning of Section 975 of the Dodd-Frank Wall Street Reform and Consumer Protection Act.Morgan Stanley produces an equity research product called a "Tactical Idea." Views contained in a "Tactical Idea" on a particular stock may be contrary tothe recommendations or views expressed in research on the same stock. This may be the result of differing time horizons, methodologies, market events, orother factors. For all research available on a particular stock, please contact your sales representative or go to Matrix athttp://www.morganstanley.com/matrix.Morgan Stanley Research is provided to our clients through our proprietary research portal on Matrix and also distributed electronically by Morgan Stanleyto clients. Certain, but not all, Morgan Stanley Research products are also made available to clients through third-party vendors or redistributed to clientsthrough alternate electronic means as a convenience. For access to all available Morgan Stanley Research, please contact your sales representative or goto Matrix at http://www.morganstanley.com/matrix.Any access and/or use of Morgan Stanley Research is subject to Morgan Stanley's Terms of Use (http://www.morganstanley.com/terms.html). Byaccessing and/or using Morgan Stanley Research, you are indicating that you have read and agree to be bound by our Terms of Use(http://www.morganstanley.com/terms.html). In addition you consent to Morgan Stanley processing your personal data and using cookies in accordancewith our Privacy Policy and our Global Cookies Policy (http://www.morganstanley.com/privacy_pledge.html), including for the purposes of setting yourpreferences and to collect readership data so that we can deliver better and more personalized service and products to you. To find out more informationabout how Morgan Stanley processes personal data, how we use cookies and how to reject cookies see our Privacy Policy and our Global Cookies Policy(http://www.morganstanley.com/privacy_pledge.html).If you do not agree to our Terms of Use and/or if you do not wish to provide your consent to Morgan Stanley processing your personal data or using cookiesplease do not access our research.Morgan Stanley Research does not provide individually tailored investment advice. Morgan Stanley Research has been prepared without regard to thecircumstances and objectives of those who receive it. Morgan Stanley recommends that investors independently evaluate particular investments andstrategies, and encourages investors to seek the advice of a financial adviser. The appropriateness of an investment or strategy will depend on an investor'scircumstances and objectives. The securities, instruments, or strategies discussed in Morgan Stanley Research may not be suitable for all investors, andcertain investors may not be eligible to purchase or participate in some or all of them. Morgan Stanley Research is not an offer to buy or sell or thesolicitation of an offer to buy or sell any security/instrument or to participate in any particular trading strategy. The value of and income from yourinvestments may vary because of changes in interest rates, foreign exchange rates, default rates, prepayment rates, securities/instruments prices, marketindexes, operational or financial conditions of companies or other factors. There may be time limitations on the exercise of options or other rights insecurities/instruments transactions. Past performance is not necessarily a guide to future performance. Estimates of future performance are based onassumptions that may not be realized. If provided, and unless otherwise stated, the closing price on the cover page is that of the primary exchange for thesubject company's securities/instruments.The fixed income research analysts, strategists or economists principally responsible for the preparation of Morgan Stanley Research have received
| September 9, 2015Greater China Technology
MORGAN STANLEY RESEARCH
21
compensation based upon various factors, including quality, accuracy and value of research, firm profitability or revenues (which include fixed income tradingand capital markets profitability or revenues), client feedback and competitive factors. Fixed Income Research analysts', strategists' or economists'compensation is not linked to investment banking or capital markets transactions performed by Morgan Stanley or the profitability or revenues of particulartrading desks.The "Important US Regulatory Disclosures on Subject Companies" section in Morgan Stanley Research lists all companies mentioned where MorganStanley owns 1% or more of a class of common equity securities of the companies. For all other companies mentioned in Morgan Stanley Research,Morgan Stanley may have an investment of less than 1% in securities/instruments or derivatives of securities/instruments of companies and may trade themin ways different from those discussed in Morgan Stanley Research. Employees of Morgan Stanley not involved in the preparation of Morgan StanleyResearch may have investments in securities/instruments or derivatives of securities/instruments of companies mentioned and may trade them in waysdifferent from those discussed in Morgan Stanley Research. Derivatives may be issued by Morgan Stanley or associated persons.With the exception of information regarding Morgan Stanley, Morgan Stanley Research is based on public information. Morgan Stanley makes every effort touse reliable, comprehensive information, but we make no representation that it is accurate or complete. We have no obligation to tell you when opinions orinformation in Morgan Stanley Research change apart from when we intend to discontinue equity research coverage of a subject company. Facts and viewspresented in Morgan Stanley Research have not been reviewed by, and may not reflect information known to, professionals in other Morgan Stanleybusiness areas, including investment banking personnel.Morgan Stanley Research personnel may participate in company events such as site visits and are generally prohibited from accepting payment by thecompany of associated expenses unless pre-approved by authorized members of Research management.Morgan Stanley may make investment decisions that are inconsistent with the recommendations or views in this report.To our readers in Taiwan: Information on securities/instruments that trade in Taiwan is distributed by Morgan Stanley Taiwan Limited ("MSTL"). Suchinformation is for your reference only. The reader should independently evaluate the investment risks and is solely responsible for their investment decisions.Morgan Stanley Research may not be distributed to the public media or quoted or used by the public media without the express written consent of MorganStanley. Information on securities/instruments that do not trade in Taiwan is for informational purposes only and is not to be construed as a recommendationor a solicitation to trade in such securities/instruments. MSTL may not execute transactions for clients in these securities/instruments. To our readers inHong Kong: Information is distributed in Hong Kong by and on behalf of, and is attributable to, Morgan Stanley Asia Limited as part of its regulated activitiesin Hong Kong. If you have any queries concerning Morgan Stanley Research, please contact our Hong Kong sales representatives.Certain information in Morgan Stanley Research was sourced by employees of the Shanghai Representative Office of Morgan Stanley Asia Limited for theuse of Morgan Stanley Asia Limited.Morgan Stanley is not incorporated under PRC law and the research in relation to this report is conducted outside the PRC. Morgan Stanley Research doesnot constitute an offer to sell or the solicitation of an offer to buy any securities in the PRC. PRC investors shall have the relevant qualifications to invest insuch securities and shall be responsible for obtaining all relevant approvals, licenses, verifications and/or registrations from the relevant governmentalauthorities themselves.Morgan Stanley Research is disseminated in Brazil by Morgan Stanley C.T.V.M. S.A.; in Mexico by Morgan Stanley México, Casa de Bolsa, S.A. de C.Vwhich is regulated by Comision Nacional Bancaria y de Valores. Paseo de los Tamarindos 90, Torre 1, Col. Bosques de las Lomas Floor 29, 05120 MexicoCity; in Japan by Morgan Stanley MUFG Securities Co., Ltd. and, for Commodities related research reports only, Morgan Stanley Capital Group Japan Co.,Ltd; in Hong Kong by Morgan Stanley Asia Limited (which accepts responsibility for its contents) and by Bank Morgan Stanley AG, Hong Kong Branch; inSingapore by Morgan Stanley Asia (Singapore) Pte. (Registration number 199206298Z) and/or Morgan Stanley Asia (Singapore) Securities Pte Ltd(Registration number 200008434H), regulated by the Monetary Authority of Singapore (which accepts legal responsibility for its contents and should becontacted with respect to any matters arising from, or in connection with, Morgan Stanley Research) and by Bank Morgan Stanley AG, Singapore Branch(Registration number T11FC0207F); in Australia to "wholesale clients" within the meaning of the Australian Corporations Act by Morgan Stanley AustraliaLimited A.B.N. 67 003 734 576, holder of Australian financial services license No. 233742, which accepts responsibility for its contents; in Australia to"wholesale clients" and "retail clients" within the meaning of the Australian Corporations Act by Morgan Stanley Wealth Management Australia Pty Ltd(A.B.N. 19 009 145 555, holder of Australian financial services license No. 240813, which accepts responsibility for its contents; in Korea by MorganStanley & Co International plc, Seoul Branch; in India by Morgan Stanley India Company Private Limited; in Indonesia by PT Morgan Stanley AsiaIndonesia; in Canada by Morgan Stanley Canada Limited, which has approved of and takes responsibility for its contents in Canada; in Germany by MorganStanley Bank AG, Frankfurt am Main and Morgan Stanley Private Wealth Management Limited, Niederlassung Deutschland, regulated by Bundesanstaltfuer Finanzdienstleistungsaufsicht (BaFin); in Spain by Morgan Stanley, S.V., S.A., a Morgan Stanley group company, which is supervised by the SpanishSecurities Markets Commission (CNMV) and states that Morgan Stanley Research has been written and distributed in accordance with the rules of conductapplicable to financial research as established under Spanish regulations; in the US by Morgan Stanley & Co. LLC, which accepts responsibility for itscontents. Morgan Stanley & Co. International plc, authorized by the Prudential Regulatory Authority and regulated by the Financial Conduct Authority andthe Prudential Regulatory Authority, disseminates in the UK research that it has prepared, and approves solely for the purposes of section 21 of theFinancial Services and Markets Act 2000, research which has been prepared by any of its affiliates. RMB Morgan Stanley (Proprietary) Limited is a memberof the JSE Limited and regulated by the Financial Services Board in South Africa. RMB Morgan Stanley (Proprietary) Limited is a joint venture ownedequally by Morgan Stanley International Holdings Inc. and RMB Investment Advisory (Proprietary) Limited, which is wholly owned by FirstRand Limited. Theinformation in Morgan Stanley Research is being disseminated by Morgan Stanley Saudi Arabia, regulated by the Capital Market Authority in the Kingdomof Saudi Arabia , and is directed at Sophisticated investors only.The information in Morgan Stanley Research is being communicated by Morgan Stanley & Co. International plc (DIFC Branch), regulated by the DubaiFinancial Services Authority (the DFSA), and is directed at Professional Clients only, as defined by the DFSA. The financial products or financial services towhich this research relates will only be made available to a customer who we are satisfied meets the regulatory criteria to be a Professional Client.The information in Morgan Stanley Research is being communicated by Morgan Stanley & Co. International plc (QFC Branch), regulated by the QatarFinancial Centre Regulatory Authority (the QFCRA), and is directed at business customers and market counterparties only and is not intended for RetailCustomers as defined by the QFCRA.As required by the Capital Markets Board of Turkey, investment information, comments and recommendations stated here, are not within the scope ofinvestment advisory activity. Investment advisory service is provided exclusively to persons based on their risk and income preferences by the authorizedfirms. Comments and recommendations stated here are general in nature. These opinions may not fit to your financial status, risk and return preferences.For this reason, to make an investment decision by relying solely to this information stated here may not bring about outcomes that fit your expectations.The trademarks and service marks contained in Morgan Stanley Research are the property of their respective owners. Third-party data providers make nowarranties or representations relating to the accuracy, completeness, or timeliness of the data they provide and shall not have liability for any damagesrelating to such data. The Global Industry Classification Standard (GICS) was developed by and is the exclusive property of MSCI and S&P.Morgan Stanley Research, or any portion thereof may not be reprinted, sold or redistributed without the written consent of Morgan Stanley.
| September 9, 2015Greater China Technology
MORGAN STANLEY RESEARCH
22

INDUSTRY COVERAGE: Greater China Technology Hardware
COMPANY (TICKER) RATING (AS OF) PRICE* (09/09/2015)
Grace ChenAcer Inc. (2353.TW) U (07/11/2013) NT$13.50Adlink Technology Inc (6166.TW) E (08/20/2015) NT$84.50Advantech (2395.TW) O (08/20/2015) NT$205.50Asustek Computer Inc. (2357.TW) O (02/10/2014) NT$295.50Casetek Holdings (5264.TW) E (01/13/2015) NT$141.00Catcher Technology (2474.TW) O (04/10/2013) NT$337.50Chroma Ate Inc. (2360.TW) E (07/21/2011) NT$57.40Compal Electronics (2324.TW) E (08/30/2009) NT$18.90Delta Electronics Inc. (2308.TW) O (03/04/2014) NT$173.00Digital China Holdings Limited (0861.HK) E (06/20/2013) HK$6.92Ennoconn Corporation (6414.TW) O (08/20/2015) NT$297.00Hiwin Technologies Corp. (2049.TW) U (11/01/2012) NT$180.00Inspur Electronic Information (000977.SZ) O (10/02/2014) Rmb22.39Lenovo (0992.HK) E (01/31/2014) HK$6.74Pegatron Corporation (4938.TW) E (03/23/2015) NT$86.00Quanta Computer Inc. (2382.TW) O (04/20/2011) NT$60.80Synnex Technology International Corp. (2347.TW) E (08/08/2014) NT$35.35Wistron Corporation (3231.TW) U (08/03/2015) NT$16.05
Jasmine LuAAC Technologies Holdings (2018.HK) O (05/05/2015) HK$47.20FIH Mobile Ltd (2038.HK) O (09/25/2014) HK$3.58Hon Hai Precision (2317.TW) E (12/05/2014) NT$85.50HTC Corporation (2498.TW) U (05/03/2013) NT$53.90Jinlong Machinery & Electronic Co. Ltd. (300032.SZ) U (06/25/2015) Rmb26.44Largan Precision (3008.TW) E (04/26/2013) NT$2,830.00Luxshare Precision Industry Co., Ltd. (002475.SZ) O (06/25/2015) Rmb28.42Shenzhen Sunlord Electronics Co. Ltd. (002138.SZ) U (08/13/2015) Rmb11.17Shenzhen Sunway Communication Co. Ltd. (300136.SZ) E (06/25/2015) Rmb23.27
Melrose ChiuAirtac International (1590.TW) O (08/20/2015) NT$172.00
Sharon ShihAU Optronics (2409.TW) O (05/01/2013) NT$10.80BOE Technology (000725.SZ) E (06/25/2015) Rmb3.24Epistar (2448.TW) O (05/07/2010) NT$28.50Everlight Electronics Co., Ltd. (2393.TW) E (08/17/2011) NT$48.90Flexium (6269.TW) E (08/28/2015) NT$96.00Foxconn Technology (2354.TW) E (12/05/2014) NT$96.60Innolux (3481.TW) E (03/19/2014) NT$11.70Kinsus Interconnect Tech. (3189.TW) E (08/28/2015) NT$61.10Sanan Optoelectronics (600703.SS) E (08/22/2014) Rmb22.04Shenzhen O-film Tech (002456.SZ) O (07/21/2015) Rmb21.80Tianma Microelectronics (000050.SZ) O (06/25/2015) Rmb15.95Tong Hsing (6271.TW) E (05/18/2015) NT$77.90TPK Holding (3673.TW) E (05/04/2015) NT$92.40Tripod Technology (3044.TW) E (10/06/2014) NT$47.95Unimicron (3037.TW) U (04/30/2015) NT$13.30Zhen Ding (4958.TW) E (03/19/2015) NT$93.70
Yunchen TsaiBYD Electronics (0285.HK) O (09/25/2014) HK$4.60Cowell eHoldings (1415.HK) E (05/05/2015) HK$3.47Everwin Precision Technology (300115.SZ) E (09/25/2014) Rmb30.55GoerTek Inc (002241.SZ) E (02/12/2015) Rmb26.20Sunny Optical (2382.HK) U (01/20/2014) HK$13.80Sunwoda Electronic Co., Ltd. (300207.SZ) E (06/25/2015) Rmb22.00TCL Communication (2618.HK) U (08/13/2015) HK$5.42ZTE Corporation (000063.SZ) E (03/29/2015) Rmb17.23ZTE Corporation (0763.HK) O (10/04/2013) HK$16.26
Stock Ratings are subject to change. Please see latest research for each company.* Historical prices are not split adjusted.
© 2015 Morgan Stanley
| September 9, 2015Greater China Technology
MORGAN STANLEY RESEARCH
23