government spending on public services in … spending on public services in scotland: current...
TRANSCRIPT
Government spending on public services in Scotland: current patterns and future issues
IFS Briefing Note BN140
Ben Deaner David Phillips
Government spending on public services in Scotland:
current patterns and future issues1
Ben Deaner and David Phillips2
Institute for Fiscal Studies
© The Institute for Fiscal Studies, September 2013 ISBN: 978-1-909463-12-7
Contents
1. Executive summary 2
1. Introduction 8
2. Public spending in Scotland and the rest of the UK: the big picture 9 2.1 Comparing total managed expenditure in Scotland and the UK 10 2.2 Breaking total managed expenditure down into its components 15
3. Public service spending in Scotland 18 3.1 Spending on public services by the UK, Scottish and local governments 18 3.2 Comparing spending by service area in Scotland and the UK 21 3.3 A more detailed look at health, education, social services and transport 29 3.3 spending
4. Changes in public service spending in Scotland and the UK since 2002–03 42 4.1 Historical changes in public service spending, 2002–03 to 2011–12 43 4.2 How has the Scottish government cut spending since 2010–11? 51
5. Issues for public service spending in an independent Scotland 61 5.1 Spending by service area – how might it change? 62 5.2 Public service spending in the fiscal context of an independent Scotland 71
6. Conclusions 77
1 The authors thank Carl Emmerson, Paul Johnson and Gemma Tetlow for comments and advice. They also gratefully acknowledge funding from the Economic and Social Research Council (ESRC) through the Centre for the Microeconomic Analysis of Public Policy at IFS (grant reference ES/H021221/1). The ESRC is supporting a programme of work addressing issues around the future of Scotland. One of the strands focuses on supporting new work at current major ESRC investments before and potentially after the referendum.
2 Ben Deaner was a summer student at IFS in Summer 2013. The main and corresponding author for this report is David Phillips ([email protected]).
1 © Institute for Fiscal Studies, 2013
Executive Summary
Public spending in Scotland – the big picture
• In today’s (2013–14) prices, government spending for the benefit of Scotland totalled £66.9 billion in 2011–12 according to the Scottish government’s official Government Expenditure and Revenue Scotland (GERS). This was around 9.3% of government spending in the UK – substantially higher than Scotland’s 8.4% share of the UK population – and means that spending per person in Scotland (£12,629) was 11% higher than for the UK as a whole (£11,381).
• A typical way to compare the level of government spending across different countries is to calculate spending as a proportion of GDP; this provides information on the level of public spending relative to the size of the economy. Government spending in 2011–12 was equal to 45.5% of GDP for the UK as a whole. Whether Scotland’s figure was more or less than this depends upon how one allocates output generated in the North Sea (from oil and gas) between Scotland and the rest of the UK. Giving Scotland a population share of North Sea output would mean government spending represented 50.6% of Scottish GDP in 2011–12, 5.1 percentage points higher than the UK as a whole. However, allocating Scotland an illustrative geographical share of North Sea output results in government spending in Scotland representing 42.7% of Scottish GDP in 2011–12, 2.8 percentage points lower than in the UK as a whole. This shows that the level of government spending as a proportion of GDP in Scotland is very sensitive to the level of economic output generated in the North Sea – which does vary significantly over time.
• Analysis of official statistics on households’ incomes and government spending in different parts of the UK shows that spending is typically higher in areas with low incomes and lower in areas with high incomes. However, Scotland has both relatively high levels of government spending and household income per person a little (4%) above the UK average.
2 © Institute for Fiscal Studies, 2013
Public service spending in Scotland
• It is spending on public services that explains most of the difference in total public spending per person between Scotland and the UK as a whole. In today’s prices, spending on public services was £7,932 per person in Scotland, 16.6% (£1,128) higher than the £6,803 spent on average across the UK. In contrast, spending on benefits and tax credits was only a little higher per person, and because official statistics allocate spending on debt interest in proportion to population, spending on debt interest per person was the same as the UK average.
• Around 15% of spending on public services in Scotland in 2011–12, equal to £1,210 per person, was undertaken by the UK government, with the largest components of this being on defence and international services. The other 85% of spending on public services, equal to £6,722 per person, was undertaken by the Scottish government and local government in Scotland. It was on the services provided by these levels of government that spending per person was estimated to be higher in Scotland than for the UK as a whole. This reflects the fact that the Scottish government is largely funded via a block grant from the UK government determined by the Barnett formula. This is based on historical levels of spending in Scotland (which have long been higher per person) and changes in spending on services in England, rather than a contemporaneous needs-based assessment.
• Current spending on public services per person in Scotland was 12.5% higher than the average for the UK as a whole, whilst capital spending per person was 48.2% higher. This means that whereas capital spending made up around 11.5% of all public service spending in the UK as a whole in 2011–12, it made up around 14.7% of all public service spending in Scotland.
• The pattern of public service spending in Scotland differs quite substantially from that in the UK as whole. Across the UK as a whole, spending on health, education, public order, defence and international services made up 71% of all public service spending. However, in Scotland, these items made up only 63% of spending. This reflects the fact that spending on these five areas was only 3.2% higher per person in Scotland than in the UK as a whole, while public service spending as a whole was 16.6% higher per person.
3 © Institute for Fiscal Studies, 2013
• In contrast, spending on other services was 49% higher in Scotland than in the UK as a whole. For some services, the gap is particularly large, with spending on enterprise and development well over three times as high per person as for the UK as a whole, and spending on agriculture, forestry and fisheries, and housing and community amenities, around double that for the UK as a whole. Spending on transport was 56.5% above the UK average, driven by high spending on roads and large subsidies to rail services and to ferry and air services serving the Highlands and Islands.
• Spending per person on social services in Scotland is 26% higher than in the UK as a whole, reflecting higher amounts spent on children and families and on older people. Higher spending on older people is likely to reflect the Scottish government’s policy of free personal care for the elderly, the cost of which has risen by 77% in real terms since 2003–04.
• Analysis based on the funding formulas used to allocate NHS and schools spending suggests that if the English formulas were used to allocate funding to Scotland on an assessed needs basis, slightly less would be allocated to Scotland for health than was spent in Scotland in 2011–12, and slightly more would be allocated for schools than was spent in 2011–12.
Changes in public service spending in Scotland since 2002–03
• These differences in spending patterns in large part reflect differences in the spending increases given to different public service areas in Scotland, compared with the UK as a whole, since 2002–03: spending patterns were more similar 10 years ago. This is the result of the Scottish government prioritising spending on the various devolved services differently from the UK government’s priorities for spending in England.
• Spending on health and education, for instance, has been increased by substantially less per person in Scotland than across the UK as a whole. This means that whereas spending per person on health was 18.9% above the UK average in 2002–03, it was only 8.9% above the UK average in 2011–12. For education, the gap in spending fell from 14.8% in 2002–03 and a peak of 15.1% in 2006–07 to just 0.4% in 2011–12.
4 © Institute for Fiscal Studies, 2013
• On the other hand, there have been larger increases than in the UK as a whole for other devolved services. For instance, spending on social services increased from 15.7% above the UK average in 2002–03 to 25.7% above the UK average in 2011–12, driven at least in part by the rising costs of free personal care for the elderly, a policy first introduced in 2003–04. The relative increase in transport spending was even more dramatic: spending was 11.5% below the UK average in 2002–03 but was, on average, 53% higher per person between 2006–07 and 2011–12. This reflects the devolution of the Network Rail grant to Scotland in 2006 and a high priority placed on transport infrastructure and subsidies by successive Scottish governments.
• This pattern of smaller-than-average increases in spending on education and health – the two largest service areas – and generally larger-than-average increases elsewhere means total public service spending increased at broadly the same pace in Scotland as in the rest of the UK between 2002–03 and 2011–12. Between those two years, the gap sometimes narrowed a little and at other times widened a little, but it has consistently been between about 14% and 19%.
• While the Scottish government chose to prioritise services differently from the rest of the UK in the past, in making the cuts required since 2010–11 it has set out plans that look fairly similar to those set out by the UK government for England. In particular, spending on health has been protected, and most other areas of spending, including grants to local authorities, have been reduced more substantially as a result. One notable contrast is spending on housing and community development, which has been relatively protected in Scotland but reduced substantially in England.
Issues for public service spending in an independent Scotland
• Under current constitutional arrangements, the Scottish government determines how much is spent on most public services, with the major exceptions being defence and international affairs. Independence would also give Scotland control over these non-devolved areas and it could make quite different choices over how much to spend from the ones the UK government currently makes.
5 © Institute for Fiscal Studies, 2013
• The UK is a relatively high spender on both defence and overseas aid. How much an independent Scotland would choose to spend on these areas would be the choice of its government. The current SNP government of Scotland says that it would aim to spend about £2.5 billion per year on defence – around £900 million less than the £3.4 billion spent in today’s prices on behalf of Scotland by the UK government in 2011–12 – and would want to aim to spend up to 1% of gross national income on overseas aid – about £400 million more than if Scotland kept to the 0.7% target the UK has signed up to. Such plans would leave Scotland spending a greater fraction of national income than most small advanced economies on defence, and make it one of the largest aid donors relative to national income in the world.
• Spending per person on services that are, in the main, already the responsibility of the Scottish government or local governments was 18.7% higher than the average for the UK as a whole in 2011–12, according to GERS. An independent Scotland could choose to continue to spend more per person than the average for the UK (or, indeed, increase the spending relative to the rest of the UK) or might want to reduce spending in these areas in order to spend more elsewhere, improve its fiscal position or reduce taxes.
• With health and education spending fairly close to the UK average, a Scottish government looking for spending cuts might decide to look to those other services – such as transport, economic development, housing and community development, and social services – where spending is substantially above the UK average. Indeed, under the current policy of free university tuition for Scottish students, independence would lead to pressure to spend more on higher education. This is because under EU law, whereas Scottish universities are able to charge students from the rest of the UK up to £9,000 a year in tuition fees at the moment, students from other EU member states – which post independence would include the rest of the UK – must be charged the same as Scottish students. Given current student numbers and average fees, and if it does turn out that it is no longer possible to charge students from other parts of the UK, the loss of income to Scottish universities could amount to about £100 million per year.
6 © Institute for Fiscal Studies, 2013
• One might also expect the loss of economies of scale in a smaller state to push up spending in some areas in an independent Scotland. Unfortunately, there is relatively little evidence about whether scale economies are important. But the evidence that does exist – such as the proportion of tax revenues taken up by collection and administration costs – suggests that while there may be significant variation in the efficiency with which services are administered across countries, these differences are not related to the size of countries, in general.
Public service spending in the fiscal context of an independent Scotland
• The UK government has currently pencilled in cuts to public service spending totalling 1.6% of GDP in 2016–17 and 2017–18. Supposing that the government of an independent Scotland felt the need to deliver an equivalent fiscal tightening, it could decide to raise taxes or reduce benefit spending rather than allow the impact to fall fully on public services. To get a feel for the scale of the cuts that may be required, 1.6% of Scottish GDP was around £2.5 billion in today’s prices in 2011–12. Given public services spending of £42.0 billion in the same year, a cut of around 6.0% would be required to deliver such a fiscal tightening through cuts to public services alone.
• However, the fiscal situation facing an independent Scotland might differ from that facing the rest of the UK. Under the OBR’s projections for North Sea revenues, Scotland’s budget deficit may be 2.2% of GDP further into the red than that of the UK as a whole in 2017–18. To fill this hole would require a further £3.4 billion of tax rises or spending cuts, on top of the £2.5 billion required as part of the plans set out by the UK government.
• How such a consolidation would be delivered would be up to the government of an independent Scotland. Assuming that it changed defence and ODA spending in line with stated SNP policy, and the rest of the required consolidation was delivered entirely by cuts to other public services, a
£5.9 billion total fiscal consolidation (£2.5 billion plus £3.4 billion) would amount to a cut of almost 15%, based on 2011–12 levels of spending. If the Scottish government wanted to protect health and education spending, the cuts to other non-protected services would be close to one-third. Alternatively, cutting defence and ODA spending by more, and raising taxes or cutting benefits, would significantly reduce the scale of cuts to public services required.
7 © Institute for Fiscal Studies, 2013
• However, if North Sea revenues turn out to be substantially stronger than the OBR forecasts, the fiscal situation in Scotland might actually be somewhat stronger than that for the UK as a whole for the first few years of independence. In this case, an independent Scotland would, in principle, be able to cut spending or increase taxes by less than if it remained part of the UK.
• But doing this might be ill-advised. An independent Scotland might instead want to maintain a stronger fiscal position than the UK, both in order to gain credibility in the financial markets and as preparation for the longer-term fiscal challenges of an ageing population and the eventual inevitable decline of North Sea revenues.
1. Introduction
Under current devolution arrangements for Scotland, most public services are the responsibility of the Scottish government or Scottish local authorities. This includes areas such as law and order, transport, health, social services and education. However, a number of areas, including defence and foreign affairs, are ‘reserved matters’, meaning that policy in these areas is set for the UK as a whole by the UK government. And, whilst Scotland has had some tax varying powers since devolved government was introduced in 1999, the services the Scottish government provides are largely funded via a block grant from the UK Treasury, rather than via taxes controlled by the Scottish government.
As in the rest of the UK, spending on public services in Scotland has been cut in the last few years as part of the fiscal consolidation designed to eliminate the UK’s large structural budget deficit following the late 2000s financial crisis and associated recession. The fiscal consolidation is set to continue until 2017–18, the year after Scotland is set to become independent if the people of Scotland vote for independence next September. This means that one of the first jobs of the incoming government of an independent Scotland in 2016 might be to announce either further cuts to spending on public services, cuts to benefits and tax credits or increases in taxes. The scale of those necessary will depend on the size of the deficit that an independent Scotland would have in the absence of any further changes, the level of deficit the Scottish government was aiming for and how quickly it wanted to bring that about.
However, independence would also give Scotland more freedom to choose its overall level of tax and public spending, and to determine how much to spend on those public services that are currently the responsibility of the UK government.
8 © Institute for Fiscal Studies, 2013
In some areas, such as higher education, independence might lead to pressure to spend more, given current policies. On the other hand, in other areas – most notably defence – spending by the UK government is substantially higher per person than in much of the rest of Europe, which may offer Scotland an opportunity to make some cuts in order to finance higher spending in other areas, to cut taxes or to improve its fiscal position.
This briefing note aims to describe the patterns of public service expenditure in Scotland and to set out a number of issues for the future. In particular, it:
• describes the big picture for public spending in Scotland and compares the amount spent with that in the rest of the UK (Section 2);
• examines how the amount spent on different service areas compares with the average for the UK as a whole and sets out some causes and consequences of these differences (Section 3);
• looks at how spending on different public services has changed over time (Section 4);
• discusses the options and issues in public service spending if Scotland were to vote for independence (Section 5).
An earlier note examined benefit spending in Scotland and some of the issues that would face an independent Scotland in designing and funding a benefit system.3 A note to be published shortly will analyse the patterns of tax receipts in Scotland and set out some options for tax reform in an independent Scotland. The focus of this note is spending on public services, although Section 2 sets out the overall level of government spending in Scotland as background information. Unless otherwise stated, monetary amounts are adjusted for inflation and reported in 2013–14 prices.
2. Public spending in Scotland and the rest of the UK: the big picture
Under current constitutional arrangements, whilst a large part of public expenditure in Scotland is undertaken by the Scottish government and Scottish local government, certain areas – including defence, foreign affairs, and benefits and tax credits – are ‘reserved matters’ and are the responsibility of the UK government. Thus, to obtain a full understanding of public spending undertaken for the benefit of the people of Scotland, one has to include not only spending
3 D. Phillips, ‘Government spending on benefits and state pensions in Scotland: current patterns and future issues’, IFS Briefing Note 139, 2013, available at http://www.ifs.org.uk/publications/6818.
9 © Institute for Fiscal Studies, 2013
undertaken by the Scottish government and local government, but also estimate spending by the UK government for the benefit of people living in Scotland. This is the approach taken in the Scottish government’s Government Expenditure and Revenues Scotland (GERS) publication, which is the basis for much of this briefing note. Box 1 provides more information on this approach.
Box 1. GERS and its approach to measuring ‘Scottish’ public spending
GERS is the Scottish government’s official report on the amount of tax and other revenues generated in Scotland and on the amount spent on goods and services for the benefit of the people of Scotland. It seeks to measure not only the amount spent by the Scottish government, but also spending by the UK government that is deemed to benefit people in Scotland, even if that spending takes place outside Scotland.
Application of the ‘who benefits’ principle when deciding how much government spending to allocate to Scotland is easier for some services than for others. For instance, the benefits of most spending on public services by the Scottish government, and on tax credits for Scottish households by the UK government, are clearly concentrated in Scotland. Such spending that can be easily identified as being for the benefit of people in Scotland is termed ‘identifiable spending’ and makes up around 86% of total estimated government spending in Scotland. On the other hand, certain spending is carried out by the UK government on behalf of the UK as a whole, and the amount that was incurred ‘for the benefit of Scotland’ cannot easily be identified. This is termed ‘non-identifiable expenditure’ and includes defence spending and debt interest; it makes up the remaining 14% of spending. In order to construct its estimate of total government spending, GERS generally apportions this non-identifiable spending on the basis of an equal amount per person across the UK.
2.1 Comparing total managed expenditure in Scotland and the UK
In today’s (2013–14) prices, total managed expenditure (TME) in Scotland is estimated to have been £66.9 billion in 2011–12, the latest year for which GERS data are available. This was approximately 9.3% of the UK-wide figure for TME of £720.2 billion, substantially higher than Scotland’s 8.4% share of the UK population.4 This means that estimated TME per person in Scotland (£12,629)
4 Measured in 2011–12 prices (as in GERS 2011–12), TME in Scotland was £64.5 billion in 2011–12 and TME in the UK as a whole was £693.6 billion. Economy-wide inflation, as measured by the GDP deflator, is used to convert these figures into 2013–14 prices (see
10 © Institute for Fiscal Studies, 2013
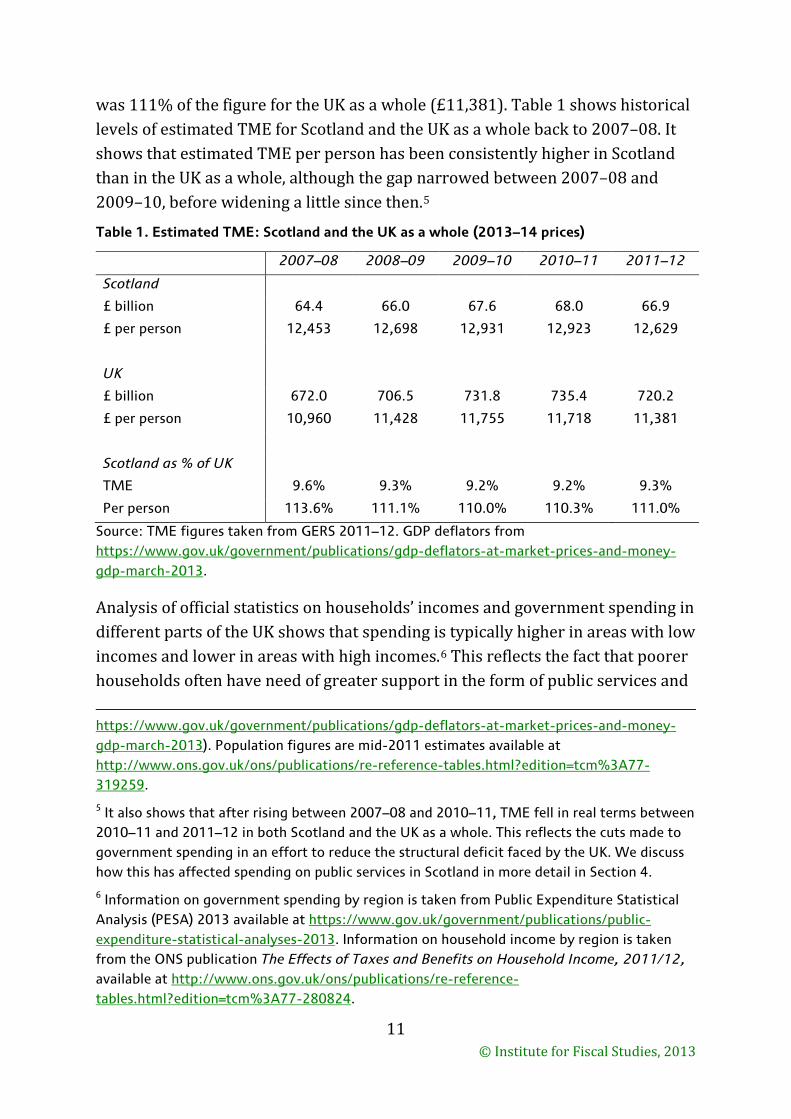
was 111% of the figure for the UK as a whole (£11,381). Table 1 shows historical levels of estimated TME for Scotland and the UK as a whole back to 2007–08. It shows that estimated TME per person has been consistently higher in Scotland than in the UK as a whole, although the gap narrowed between 2007–08 and 2009–10, before widening a little since then.5
Table 1. Estimated TME: Scotland and the UK as a whole (2013–14 prices)
2007–08 2008–09 2009–10 2010–11 2011–12
Scotland
£ billion 64.4 66.0 67.6 68.0 66.9
£ per person 12,453 12,698 12,931 12,923 12,629
UK
£ billion 672.0 706.5 731.8 735.4 720.2
£ per person 10,960 11,428 11,755 11,718 11,381
Scotland as % of UK
TME 9.6% 9.3% 9.2% 9.2% 9.3%
Per person 113.6% 111.1% 110.0% 110.3% 111.0%
Source: TME figures taken from GERS 2011–12. GDP deflators from https://www.gov.uk/government/publications/gdp-deflators-at-market-prices-and-money-gdp-march-2013.
Analysis of official statistics on households’ incomes and government spending in different parts of the UK shows that spending is typically higher in areas with low incomes and lower in areas with high incomes.6 This reflects the fact that poorer households often have need of greater support in the form of public services and
https://www.gov.uk/government/publications/gdp-deflators-at-market-prices-and-money-gdp-march-2013). Population figures are mid-2011 estimates available at http://www.ons.gov.uk/ons/publications/re-reference-tables.html?edition=tcm%3A77-319259.
5 It also shows that after rising between 2007–08 and 2010–11, TME fell in real terms between 2010–11 and 2011–12 in both Scotland and the UK as a whole. This reflects the cuts made to government spending in an effort to reduce the structural deficit faced by the UK. We discuss how this has affected spending on public services in Scotland in more detail in Section 4. 6 Information on government spending by region is taken from Public Expenditure Statistical Analysis (PESA) 2013 available at https://www.gov.uk/government/publications/public-expenditure-statistical-analyses-2013. Information on household income by region is taken from the ONS publication The Effects of Taxes and Benefits on Household Income, 2011/12, available at http://www.ons.gov.uk/ons/publications/re-reference-tables.html?edition=tcm%3A77-280824.
11 © Institute for Fiscal Studies, 2013
cash benefits and tax credits. For instance, in 2011–12, identifiable public spending7 per person was relatively high (107% and 111% of the UK average) in the North East of England and Wales, respectively, while pre-tax-and benefit household income per person was relatively low (just over 80% of the UK average). On the other hand, the South East and East of England have relatively low government spending (87% and 89% of the UK average) and high levels of household income per person (114% and 111% of the UK average).
In contrast, Scotland has both relatively high levels of government spending (115% of the UK average in the case of identifiable public spending) and household income per person a little above the UK average (104%).8 This is also true of London but does make Scotland stand out compared with most of the rest of the UK.
Another way to consider the relative levels of TME in Scotland and the UK as a whole is to measure TME as a proportion of GDP: this provides information on the size of the state relative to the economy. In the case of Scotland, a difficulty arises in determining the level of GDP, however, as there is no formally agreed position on how large a share of output generated from offshore North Sea resources – i.e. oil and gas – should be treated as Scotland’s. Because of this, GERS uses two methods to apportion North Sea output and revenues. In the first case, Scotland is allocated a fraction of North Sea output and revenues equal to its share of the UK population. The second method, based on a study by Kemp and Stephen,9 uses estimates of the share of North Sea output that would be in Scottish waters if the median-line principle were used to divide up the North Sea on a geographical basis. Figure 1 shows estimates of TME as a proportion of GDP for Scotland using both methods and for the UK as a whole.
7 Identifiable public spending is the part that can easily be attributed to a particular region. See Box 1.
8 Household income per household is a little lower than the UK average (97%). The difference is explained by the fact that Scottish households are smaller than the average for the UK, meaning this household income is shared among fewer people, on average.
9 A. G. Kemp and L. Stephen, ‘The hypothetical Scottish shares of revenues and expenditures from the UK Continental Shelf 2000–2013’, 2008, http://www.scotland.gov.uk/Resource/Doc/133434/0061924.pdf.
12 © Institute for Fiscal Studies, 2013
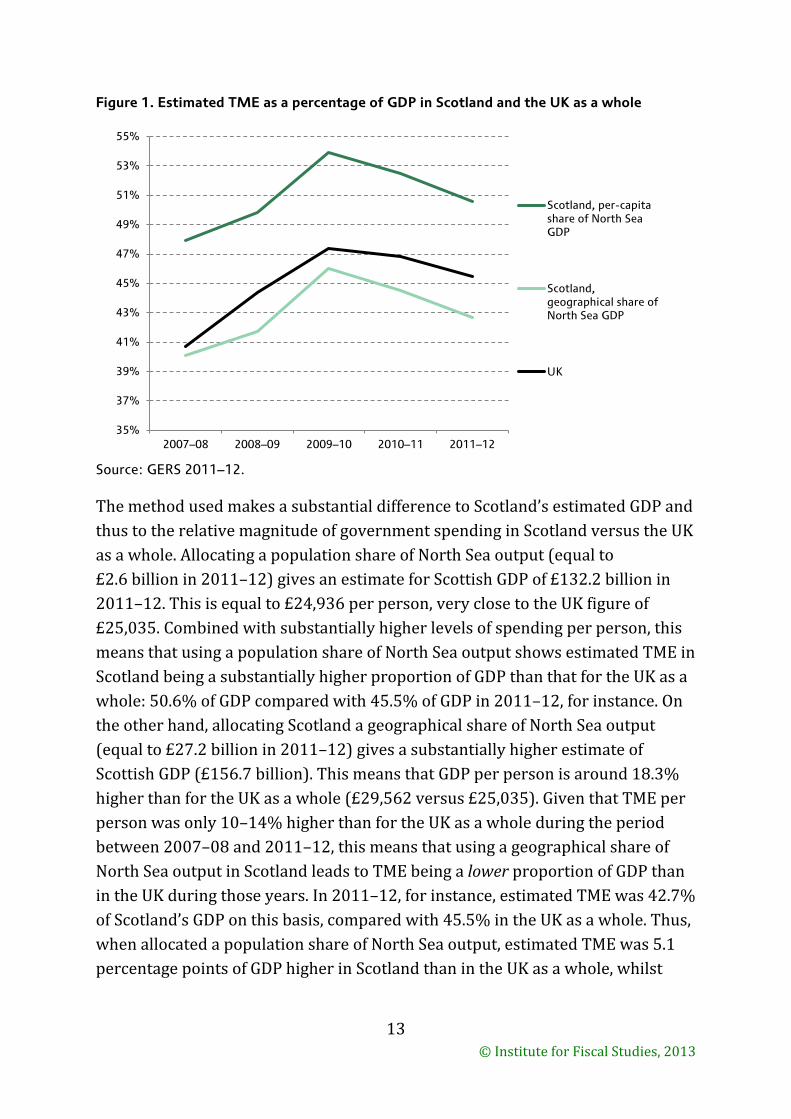
Figure 1. Estimated TME as a percentage of GDP in Scotland and the UK as a whole
Source: GERS 2011–12.
The method used makes a substantial difference to Scotland’s estimated GDP and thus to the relative magnitude of government spending in Scotland versus the UK as a whole. Allocating a population share of North Sea output (equal to £2.6 billion in 2011–12) gives an estimate for Scottish GDP of £132.2 billion in 2011–12. This is equal to £24,936 per person, very close to the UK figure of £25,035. Combined with substantially higher levels of spending per person, this means that using a population share of North Sea output shows estimated TME in Scotland being a substantially higher proportion of GDP than that for the UK as a whole: 50.6% of GDP compared with 45.5% of GDP in 2011–12, for instance. On the other hand, allocating Scotland a geographical share of North Sea output (equal to £27.2 billion in 2011–12) gives a substantially higher estimate of Scottish GDP (£156.7 billion). This means that GDP per person is around 18.3% higher than for the UK as a whole (£29,562 versus £25,035). Given that TME per person was only 10–14% higher than for the UK as a whole during the period between 2007–08 and 2011–12, this means that using a geographical share of North Sea output in Scotland leads to TME being a lower proportion of GDP than in the UK during those years. In 2011–12, for instance, estimated TME was 42.7% of Scotland’s GDP on this basis, compared with 45.5% in the UK as a whole. Thus, when allocated a population share of North Sea output, estimated TME was 5.1 percentage points of GDP higher in Scotland than in the UK as a whole, whilst
35%
37%
39%
41%
43%
45%
47%
49%
51%
53%
55%
2007–08 2008–09 2009–10 2010–11 2011–12
Scotland, per-capita share of North Sea GDP
Scotland, geographical share of North Sea GDP
UK
13 © Institute for Fiscal Studies, 2013
when allocated a geographical share of North Sea output, estimated TME was 2.8 percentage points of GDP lower, in 2011–12.
The difference between the two measures of estimated TME as a proportion of GDP in Scotland depends upon the amount of GDP generated in the North Sea versus that onshore, which can vary considerably over time as oil production and prices can and do fluctuate significantly.
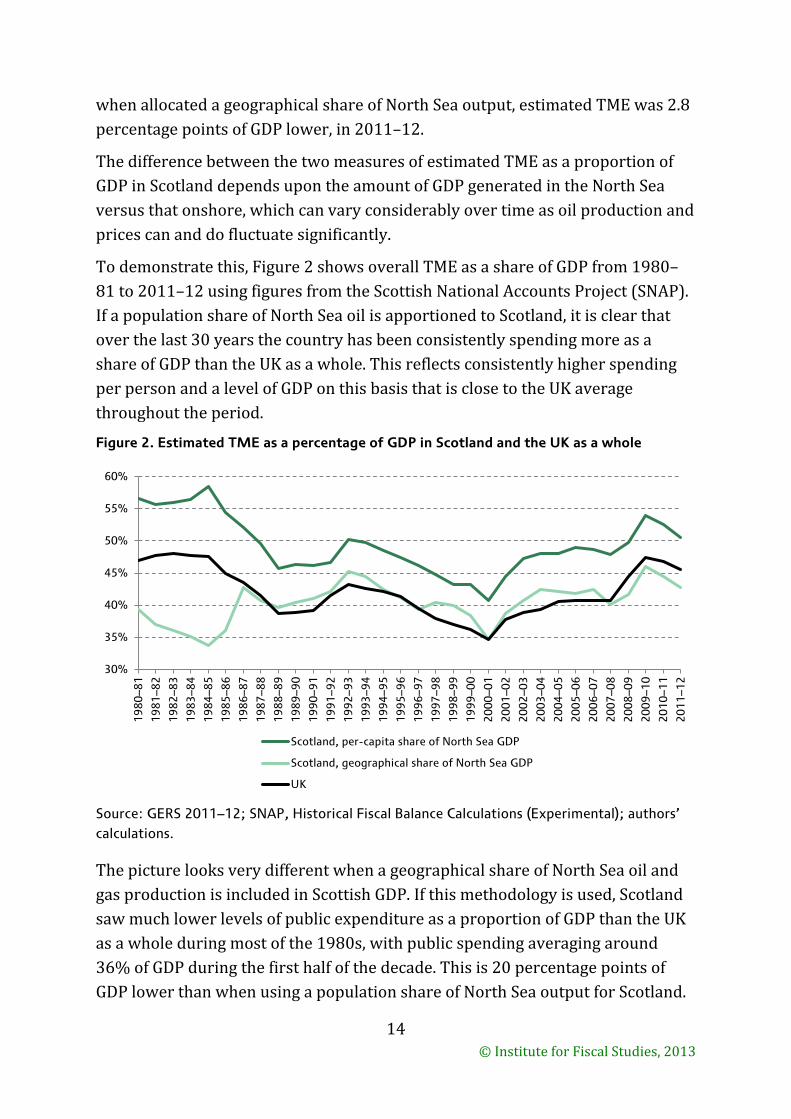
To demonstrate this, Figure 2 shows overall TME as a share of GDP from 1980–81 to 2011–12 using figures from the Scottish National Accounts Project (SNAP). If a population share of North Sea oil is apportioned to Scotland, it is clear that over the last 30 years the country has been consistently spending more as a share of GDP than the UK as a whole. This reflects consistently higher spending per person and a level of GDP on this basis that is close to the UK average throughout the period.
Figure 2. Estimated TME as a percentage of GDP in Scotland and the UK as a whole
Source: GERS 2011–12; SNAP, Historical Fiscal Balance Calculations (Experimental); authors’ calculations.
The picture looks very different when a geographical share of North Sea oil and gas production is included in Scottish GDP. If this methodology is used, Scotland saw much lower levels of public expenditure as a proportion of GDP than the UK as a whole during most of the 1980s, with public spending averaging around 36% of GDP during the first half of the decade. This is 20 percentage points of GDP lower than when using a population share of North Sea output for Scotland.
30%
35%
40%
45%
50%
55%
60%
1980
–81
1981
–82
1982
–83
1983
–84
1984
–85
1985
–86
1986
–87
1987
–88
1988
–89
1989
–90
1990
–91
1991
–92
1992
–93
1993
–94
1994
–95
1995
–96
1996
–97
1997
–98
1998
–99
1999
–00
2000
–01
2001
–02
2002
–03
2003
–04
2004
–05
2005
–06
2006
–07
2007
–08
2008
–09
2009
–10
2010
–11
2011
–12
Scotland, per-capita share of North Sea GDP
Scotland, geographical share of North Sea GDP
UK
14 © Institute for Fiscal Studies, 2013
This, of course, reflects both the scale of North Sea output in this period and the fact that onshore GDP was performing badly in the early 1980s: in 1984–85, for instance, North Sea output contributed 46.9% of total Scottish GDP measured on this basis (but still only about 7% of total UK output). However, falls in oil prices then led to a substantial fall in North Sea output, causing TME to increase as a share of Scottish GDP at the same time as it was falling for the UK as a whole. Thus even when including a geographical share of North Sea output in Scotland’s GDP figures, TME was if anything slightly higher as a proportion of GDP than for the UK as a whole, on average, from the late 1980s to the mid-2000s. Higher oil prices in recent years mean that, since 2007–08, allocation of a geographical share of North Sea output leads to expenditure being a somewhat smaller fraction of GDP than in the UK as a whole. Whether this will remain the case in the future depends upon how much output is generated in the North Sea, the performance of Scotland’s onshore economy compared with that of the UK as a whole, and the level of TME in Scotland compared with the rest of the UK.
2.2 Breaking total managed expenditure down into its components
TME can be broken down into a number of different components based on the purpose of the spending. This is done for both Scotland and the UK as a whole in Table 2.
The largest item is spending on public services. This type of spending includes both the amount spent on the day-to-day running and administration of services such as health, education and transport, and investment in facilities such as new hospitals, schools and roads. In today’s prices, spending on public services amounted to £42 billion in 2011–12 in Scotland, or £7,931 per person. This was £1,128 or 16.6% higher than the £6,803 spent per person on public services across the UK as a whole in the same year. In absolute terms, estimated spending per person on public services is therefore substantially above that in the UK as a whole. Measured relative to GDP, things crucially depend upon whether Scotland is allocated a population-based or geographical share of North Sea output. In the latter instance, public service spending was a slightly lower share of GDP in Scotland (26.8%) than in the UK as a whole (27.2%).
15 © Institute for Fiscal Studies, 2013
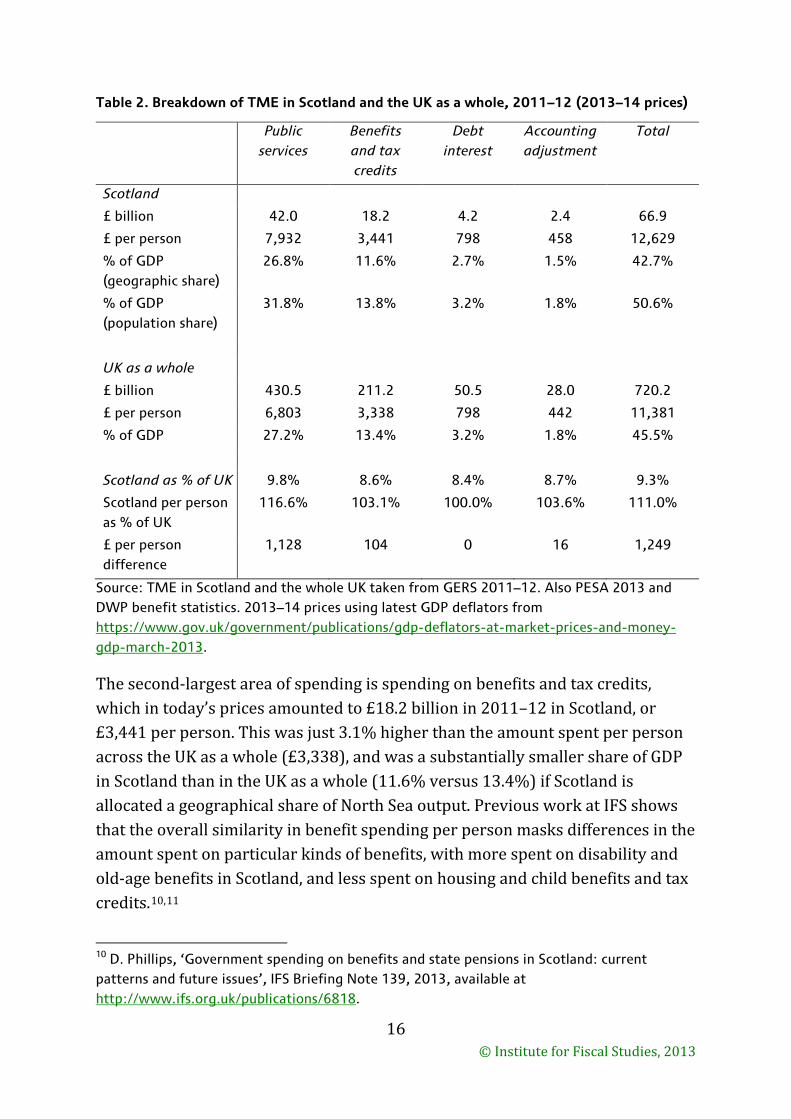
Table 2. Breakdown of TME in Scotland and the UK as a whole, 2011–12 (2013–14 prices)
Public services
Benefits and tax credits
Debt interest
Accounting adjustment
Total
Scotland
£ billion 42.0 18.2 4.2 2.4 66.9
£ per person 7,932 3,441 798 458 12,629
% of GDP (geographic share)
26.8% 11.6% 2.7% 1.5% 42.7%
% of GDP (population share)
31.8% 13.8% 3.2% 1.8% 50.6%
UK as a whole
£ billion 430.5 211.2 50.5 28.0 720.2
£ per person 6,803 3,338 798 442 11,381
% of GDP 27.2% 13.4% 3.2% 1.8% 45.5%
Scotland as % of UK 9.8% 8.6% 8.4% 8.7% 9.3%
Scotland per person as % of UK
116.6% 103.1% 100.0% 103.6% 111.0%
£ per person difference
1,128 104 0 16 1,249
Source: TME in Scotland and the whole UK taken from GERS 2011–12. Also PESA 2013 and DWP benefit statistics. 2013–14 prices using latest GDP deflators from https://www.gov.uk/government/publications/gdp-deflators-at-market-prices-and-money-gdp-march-2013.
The second-largest area of spending is spending on benefits and tax credits, which in today’s prices amounted to £18.2 billion in 2011–12 in Scotland, or £3,441 per person. This was just 3.1% higher than the amount spent per person across the UK as a whole (£3,338), and was a substantially smaller share of GDP in Scotland than in the UK as a whole (11.6% versus 13.4%) if Scotland is allocated a geographical share of North Sea output. Previous work at IFS shows that the overall similarity in benefit spending per person masks differences in the amount spent on particular kinds of benefits, with more spent on disability and old-age benefits in Scotland, and less spent on housing and child benefits and tax credits.10,11
10 D. Phillips, ‘Government spending on benefits and state pensions in Scotland: current patterns and future issues’, IFS Briefing Note 139, 2013, available at http://www.ifs.org.uk/publications/6818.
16 © Institute for Fiscal Studies, 2013
The third-largest item is spending on debt interest. GERS allocates such spending on a population basis, meaning that, by assumption, spending per person is the same in Scotland as in the UK as a whole: £798 in today’s prices in 2011–12. It is important to note that this does not mean that an independent Scotland would be required to spend the same amount per person on debt interest if it inherited the same amount of debt per person. This would depend on the level of debt inherited by an independent Scotland and the rate of interest it faced on that debt. Newly published research by NIESR12 suggests that Scotland might have to pay an interest premium on any newly issued debt, in part because of the size of its financial and oil and gas sectors, and the associated risk to the public finances.
The last item consists of a number of accounting adjustments to account for things such as capital consumption (depreciation) of public sector assets and VAT paid by public sector bodies. In 2011–12, this amounted to £2.4 billion in Scotland in today’s prices, or £458 per person, around 4% higher than the accounting adjustment per person for the UK as a whole.13
It is therefore clear that it is higher spending on public services per person that drives most of the difference in overall TME per person: spending per person in Scotland is much closer to the average for the UK as a whole for other areas of
11 Note that the figures reported in Table 2 differ from those reported in Phillips (2013) due to differences in sources and the methodology underlying those sources. Table 2 is largely based on GERS and PESA data, whilst Phillips (2013) was based on DWP benefit expenditure data and estimates of child benefit and tax credit expenditure calculated using HMRC child benefit and tax credit statistics on claimant numbers and average claim amounts. GERS and PESA count some tax credit payments as ‘negative tax’ as opposed to government spending, which acts to reduce the estimates of benefit spending reported in Table 2. On the other hand, it includes certain Social Fund payments, which were not captured in Phillips (2013). Both of these factors tend to increase slightly the ratio of benefits spending in Scotland compared with the UK as whole, explaining why Table 2 reports Scottish benefits spending being 103% of the UK average, compared with the 102% of the Great Britain average reported in Phillips (2013). The key point is that, under both methods of calculating benefits spending in Scotland, the difference between Scotland and the average for the UK as a whole is much smaller than for public service spending.
12 National Institute of Economic and Social Research, Scotland’s Currency Options, 2013. The main report is to be published on 19 September but the executive summary is available at http://niesr.ac.uk/sites/default/files/files/Exec%20sum_final.pdf.
13 Note that GERS reports two figures for the accounting adjustment for Scotland. We report that contained in Table 5.7, which is consistent with the breakdown of spending by service area and the reported TME. A second disaggregated accounting adjustment is reported in Table B.4, which differs from that reported in Table 5.7.
17 © Institute for Fiscal Studies, 2013
spending. The rest of this briefing note focuses upon how public service spending compares between Scotland and the UK as a whole, and the options and issues that will arise in public service spending if Scotland votes for independence in the September 2014 referendum.
3. Public service spending in Scotland
The last section showed that public service spending per person in Scotland was over 16% higher per person than the average for the UK as a whole. In this section, we explore what is spent on public services in Scotland in more detail and examine how this differs from in the UK as a whole. Section 3.1 breaks down spending into that carried out by the Scottish government and local governments and that carried out by the UK government. It also describes how money is allocated to the Scottish government by the UK government via the Barnett formula. Section 3.2 examines the amounts spent by different service areas and the amounts spent on capital versus current spending. Section 3.3 then looks in more detail at four important areas of spending: health, education, social services and transport.
3.1 Spending on public services by the UK, Scottish and local governments
Spending on public services for the benefit of Scotland is undertaken by the UK and Scottish governments and their agencies and by Scottish local authorities. The UK government is responsible for areas including defence, foreign affairs, overseas aid and a number of areas of economic and fiscal policy. Other major services, including health, education (pre-school, school, further and higher education), transport and social services, are the responsibility of the Scottish government or Scottish local government.
GERS breaks down public spending for the benefit of Scotland into that which is carried out by the Scottish government and local government and that which is carried out by the UK government. This shows that around 40% of all TME for the benefit of Scotland was undertaken by the UK government, with the remaining 60% undertaken by the Scottish national and local governments. However, most of the spending by the UK government for the benefit of Scotland is on benefits, tax credits and debt interest rather than on public services. GERS does not report how much is spent on services by the various levels of government, but using GERS and other data and a number of assumptions it is possible to produce an estimated breakdown. The results of this are shown in
18 © Institute for Fiscal Studies, 2013
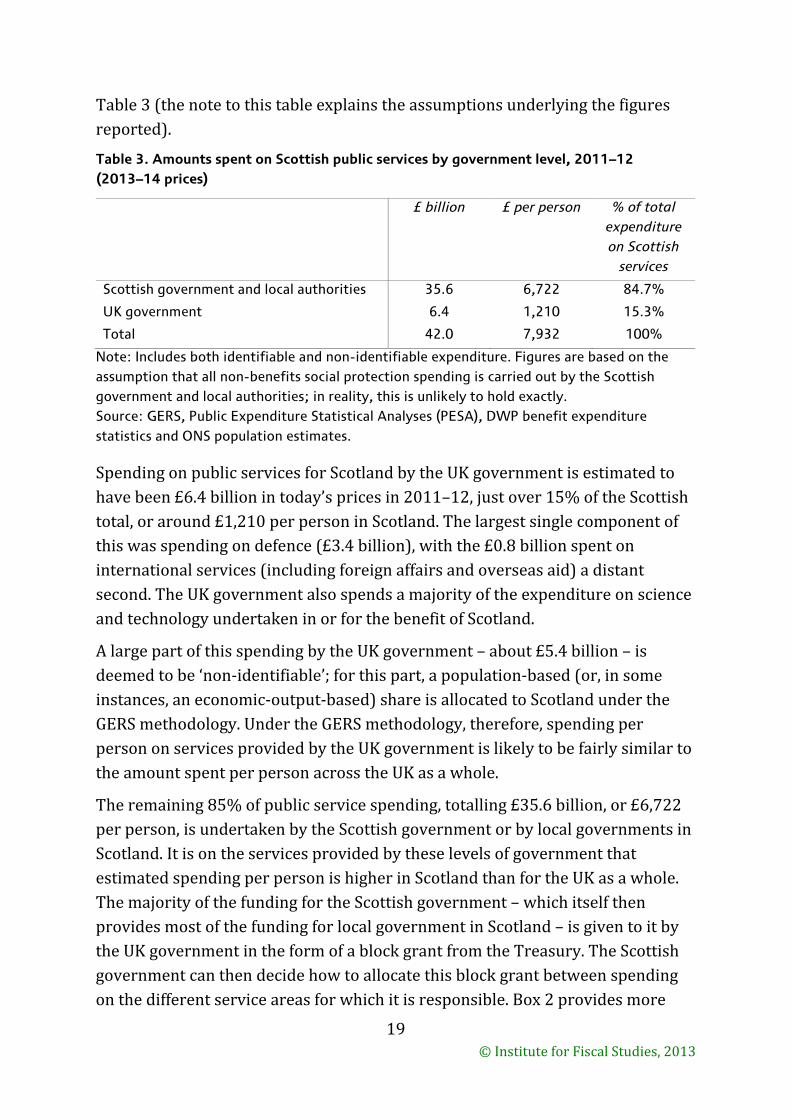
Table 3 (the note to this table explains the assumptions underlying the figures reported).
Table 3. Amounts spent on Scottish public services by government level, 2011–12 (2013–14 prices)
£ billion £ per person % of total expenditure on Scottish
services
Scottish government and local authorities 35.6 6,722 84.7%
UK government 6.4 1,210 15.3%
Total 42.0 7,932 100%
Note: Includes both identifiable and non-identifiable expenditure. Figures are based on the assumption that all non-benefits social protection spending is carried out by the Scottish government and local authorities; in reality, this is unlikely to hold exactly. Source: GERS, Public Expenditure Statistical Analyses (PESA), DWP benefit expenditure statistics and ONS population estimates.
Spending on public services for Scotland by the UK government is estimated to have been £6.4 billion in today’s prices in 2011–12, just over 15% of the Scottish total, or around £1,210 per person in Scotland. The largest single component of this was spending on defence (£3.4 billion), with the £0.8 billion spent on international services (including foreign affairs and overseas aid) a distant second. The UK government also spends a majority of the expenditure on science and technology undertaken in or for the benefit of Scotland.
A large part of this spending by the UK government – about £5.4 billion – is deemed to be ‘non-identifiable’; for this part, a population-based (or, in some instances, an economic-output-based) share is allocated to Scotland under the GERS methodology. Under the GERS methodology, therefore, spending per person on services provided by the UK government is likely to be fairly similar to the amount spent per person across the UK as a whole.
The remaining 85% of public service spending, totalling £35.6 billion, or £6,722 per person, is undertaken by the Scottish government or by local governments in Scotland. It is on the services provided by these levels of government that estimated spending per person is higher in Scotland than for the UK as a whole. The majority of the funding for the Scottish government – which itself then provides most of the funding for local government in Scotland – is given to it by the UK government in the form of a block grant from the Treasury. The Scottish government can then decide how to allocate this block grant between spending on the different service areas for which it is responsible. Box 2 provides more
19 © Institute for Fiscal Studies, 2013
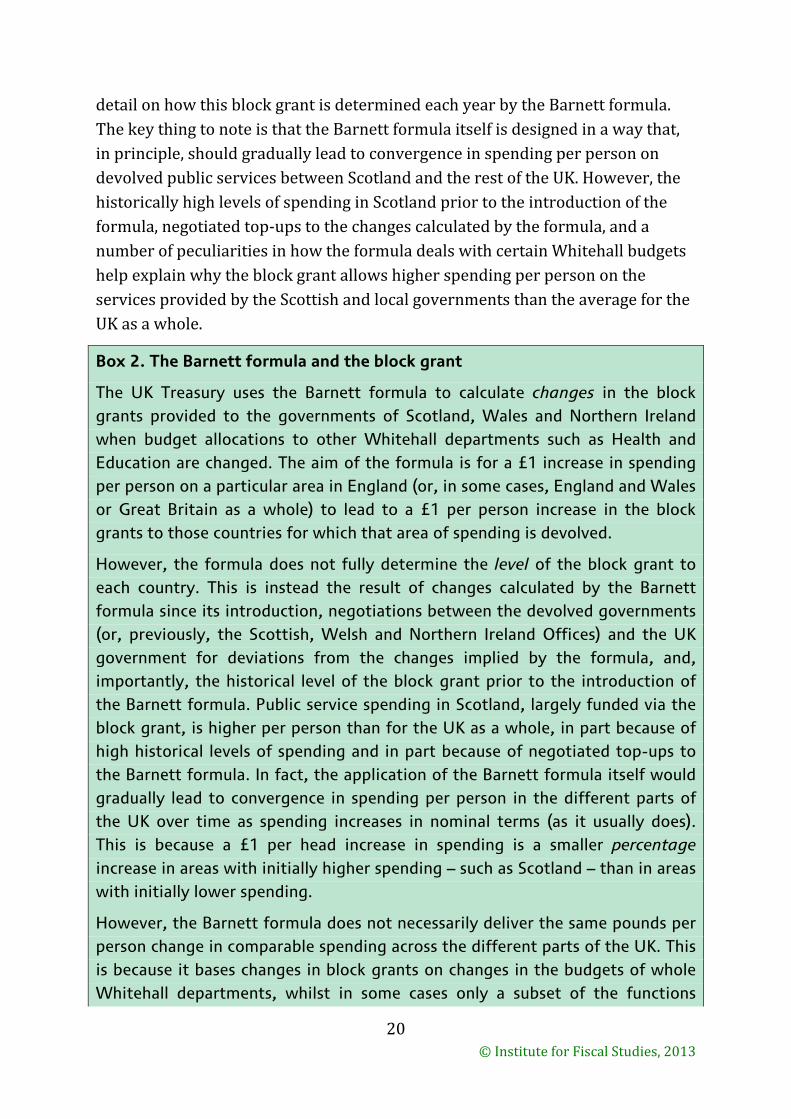
detail on how this block grant is determined each year by the Barnett formula. The key thing to note is that the Barnett formula itself is designed in a way that, in principle, should gradually lead to convergence in spending per person on devolved public services between Scotland and the rest of the UK. However, the historically high levels of spending in Scotland prior to the introduction of the formula, negotiated top-ups to the changes calculated by the formula, and a number of peculiarities in how the formula deals with certain Whitehall budgets help explain why the block grant allows higher spending per person on the services provided by the Scottish and local governments than the average for the UK as a whole.
Box 2. The Barnett formula and the block grant
The UK Treasury uses the Barnett formula to calculate changes in the block grants provided to the governments of Scotland, Wales and Northern Ireland when budget allocations to other Whitehall departments such as Health and Education are changed. The aim of the formula is for a £1 increase in spending per person on a particular area in England (or, in some cases, England and Wales or Great Britain as a whole) to lead to a £1 per person increase in the block grants to those countries for which that area of spending is devolved.
However, the formula does not fully determine the level of the block grant to each country. This is instead the result of changes calculated by the Barnett formula since its introduction, negotiations between the devolved governments (or, previously, the Scottish, Welsh and Northern Ireland Offices) and the UK government for deviations from the changes implied by the formula, and, importantly, the historical level of the block grant prior to the introduction of the Barnett formula. Public service spending in Scotland, largely funded via the block grant, is higher per person than for the UK as a whole, in part because of high historical levels of spending and in part because of negotiated top-ups to the Barnett formula. In fact, the application of the Barnett formula itself would gradually lead to convergence in spending per person in the different parts of the UK over time as spending increases in nominal terms (as it usually does). This is because a £1 per head increase in spending is a smaller percentage increase in areas with initially higher spending – such as Scotland – than in areas with initially lower spending.
However, the Barnett formula does not necessarily deliver the same pounds per person change in comparable spending across the different parts of the UK. This is because it bases changes in block grants on changes in the budgets of whole Whitehall departments, whilst in some cases only a subset of the functions
20 © Institute for Fiscal Studies, 2013
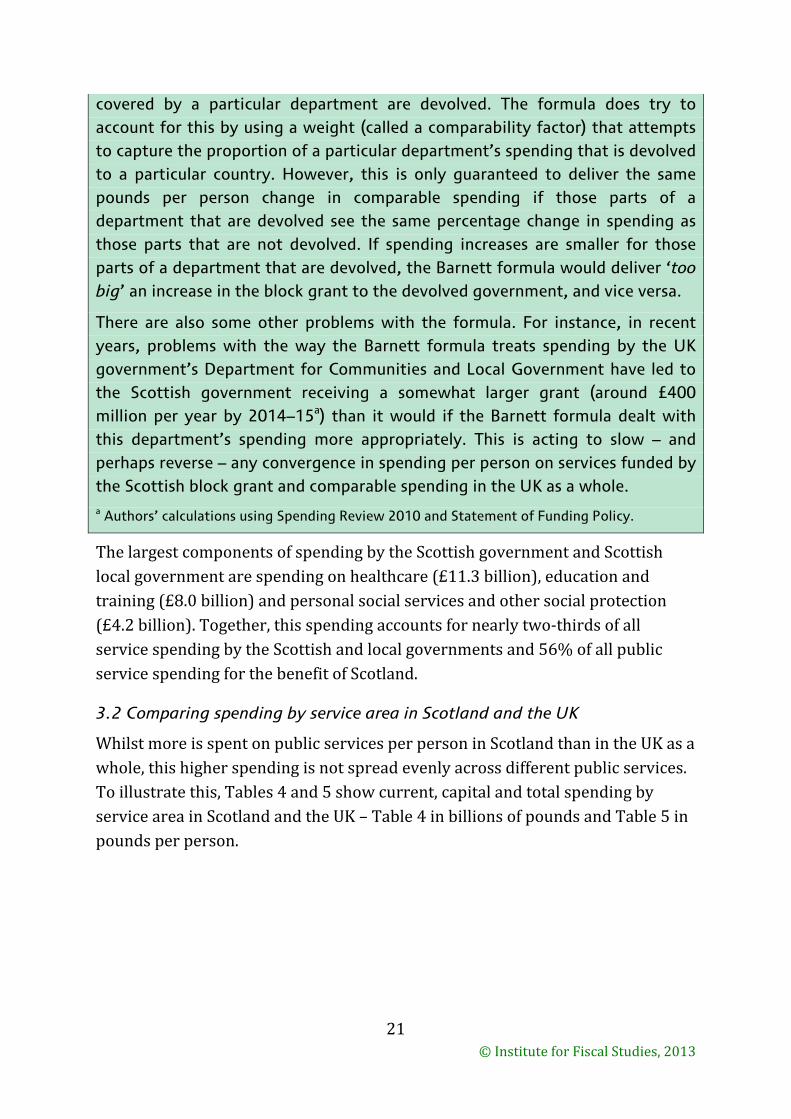
covered by a particular department are devolved. The formula does try to account for this by using a weight (called a comparability factor) that attempts to capture the proportion of a particular department’s spending that is devolved to a particular country. However, this is only guaranteed to deliver the same pounds per person change in comparable spending if those parts of a department that are devolved see the same percentage change in spending as those parts that are not devolved. If spending increases are smaller for those parts of a department that are devolved, the Barnett formula would deliver ‘too big’ an increase in the block grant to the devolved government, and vice versa.
There are also some other problems with the formula. For instance, in recent years, problems with the way the Barnett formula treats spending by the UK government’s Department for Communities and Local Government have led to the Scottish government receiving a somewhat larger grant (around £400 million per year by 2014–15a) than it would if the Barnett formula dealt with this department’s spending more appropriately. This is acting to slow – and perhaps reverse – any convergence in spending per person on services funded by the Scottish block grant and comparable spending in the UK as a whole. a Authors’ calculations using Spending Review 2010 and Statement of Funding Policy.
The largest components of spending by the Scottish government and Scottish local government are spending on healthcare (£11.3 billion), education and training (£8.0 billion) and personal social services and other social protection (£4.2 billion). Together, this spending accounts for nearly two-thirds of all service spending by the Scottish and local governments and 56% of all public service spending for the benefit of Scotland.
3.2 Comparing spending by service area in Scotland and the UK
Whilst more is spent on public services per person in Scotland than in the UK as a whole, this higher spending is not spread evenly across different public services. To illustrate this, Tables 4 and 5 show current, capital and total spending by service area in Scotland and the UK – Table 4 in billions of pounds and Table 5 in pounds per person.
21 © Institute for Fiscal Studies, 2013
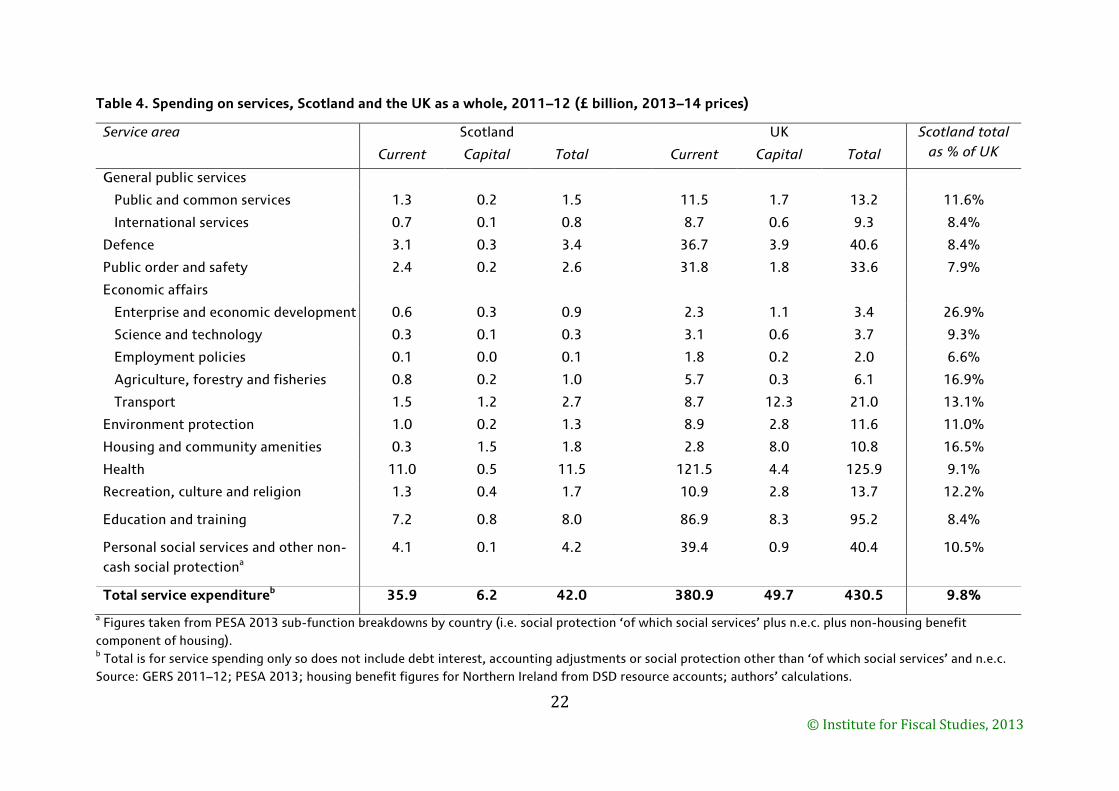
Table 4. Spending on services, Scotland and the UK as a whole, 2011–12 (£ billion, 2013–14 prices)
Service area Scotland UK Scotland total as % of UK Current Capital Total Current Capital Total
General public services
Public and common services 1.3 0.2 1.5 11.5 1.7 13.2 11.6%
International services 0.7 0.1 0.8 8.7 0.6 9.3 8.4%
Defence 3.1 0.3 3.4 36.7 3.9 40.6 8.4%
Public order and safety 2.4 0.2 2.6 31.8 1.8 33.6 7.9%
Economic affairs
Enterprise and economic development 0.6 0.3 0.9 2.3 1.1 3.4 26.9%
Science and technology 0.3 0.1 0.3 3.1 0.6 3.7 9.3%
Employment policies 0.1 0.0 0.1 1.8 0.2 2.0 6.6%
Agriculture, forestry and fisheries 0.8 0.2 1.0 5.7 0.3 6.1 16.9%
Transport 1.5 1.2 2.7 8.7 12.3 21.0 13.1%
Environment protection 1.0 0.2 1.3 8.9 2.8 11.6 11.0%
Housing and community amenities 0.3 1.5 1.8 2.8 8.0 10.8 16.5%
Health 11.0 0.5 11.5 121.5 4.4 125.9 9.1%
Recreation, culture and religion 1.3 0.4 1.7 10.9 2.8 13.7 12.2%
Education and training 7.2 0.8 8.0 86.9 8.3 95.2 8.4%
Personal social services and other non-cash social protectiona
4.1 0.1 4.2 39.4 0.9 40.4 10.5%
Total service expenditureb 35.9 6.2 42.0 380.9 49.7 430.5 9.8% a Figures taken from PESA 2013 sub-function breakdowns by country (i.e. social protection ‘of which social services’ plus n.e.c. plus non-housing benefit component of housing). b Total is for service spending only so does not include debt interest, accounting adjustments or social protection other than ‘of which social services’ and n.e.c. Source: GERS 2011–12; PESA 2013; housing benefit figures for Northern Ireland from DSD resource accounts; authors’ calculations.
22 © Institute for Fiscal Studies, 2013
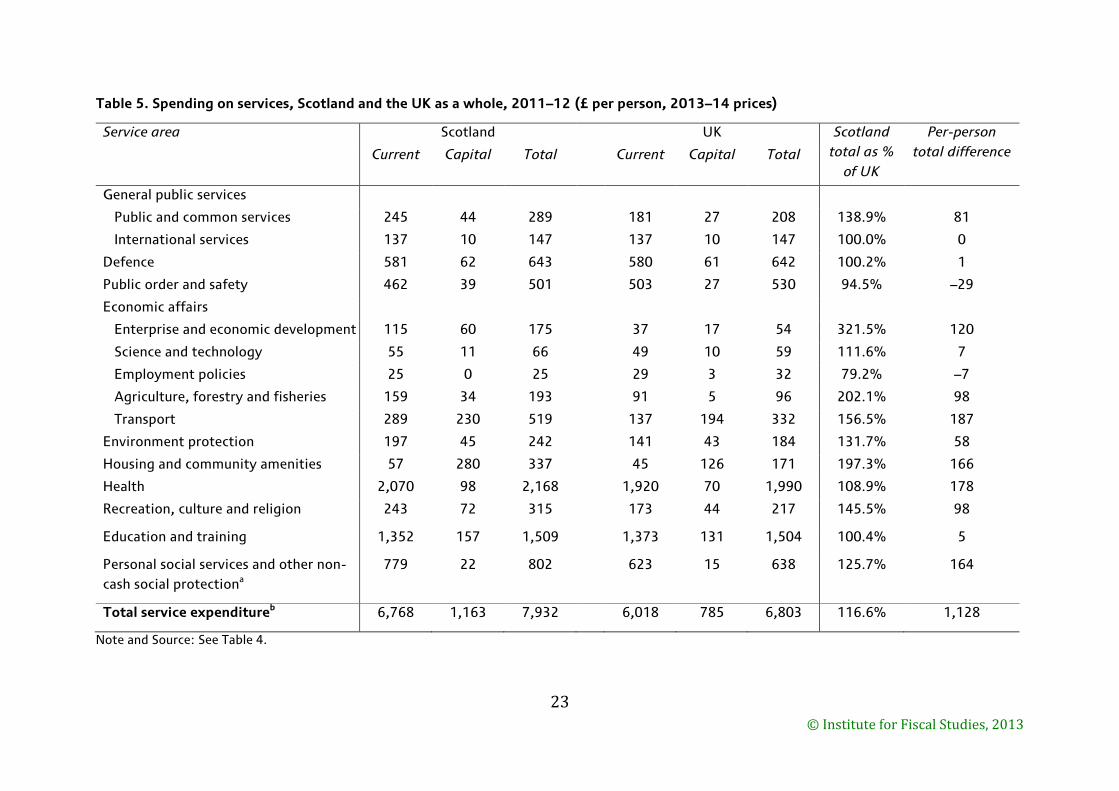
Table 5. Spending on services, Scotland and the UK as a whole, 2011–12 (£ per person, 2013–14 prices)
Service area Scotland UK Scotland total as %
of UK
Per-person total difference Current Capital Total Current Capital Total
General public services
Public and common services 245 44 289 181 27 208 138.9% 81
International services 137 10 147 137 10 147 100.0% 0
Defence 581 62 643 580 61 642 100.2% 1
Public order and safety 462 39 501 503 27 530 94.5% –29
Economic affairs
Enterprise and economic development 115 60 175 37 17 54 321.5% 120
Science and technology 55 11 66 49 10 59 111.6% 7
Employment policies 25 0 25 29 3 32 79.2% –7
Agriculture, forestry and fisheries 159 34 193 91 5 96 202.1% 98
Transport 289 230 519 137 194 332 156.5% 187
Environment protection 197 45 242 141 43 184 131.7% 58
Housing and community amenities 57 280 337 45 126 171 197.3% 166
Health 2,070 98 2,168 1,920 70 1,990 108.9% 178
Recreation, culture and religion 243 72 315 173 44 217 145.5% 98
Education and training 1,352 157 1,509 1,373 131 1,504 100.4% 5
Personal social services and other non-cash social protectiona
779 22 802 623 15 638 125.7% 164
Total service expenditureb 6,768 1,163 7,932 6,018 785 6,803 116.6% 1,128
Note and Source: See Table 4.
23 © Institute for Fiscal Studies, 2013
The largest item of public service spending for the benefit of Scotland is health, on which £11.5 billion was spent in 2011–12, of which £11.0 billion was current spending and £0.5 billion was capital spending (all in 2013–14 prices). The next-largest items were education and training (£8.0 billion), personal social services and other non-cash social protection measures (£4.2 billion) and defence (£3.4 billion). Across the UK as a whole, health (£125.9 billion) and education and training (£95.2 billion) were also the two largest items, but spending on defence (£40.6 billion) was just larger than spending on social services (£40.4 billion). This difference in ranking of spending items is the first indication that the patterns of public service spending differ somewhat in Scotland from the average for the UK as a whole.
However, it is generally not on these large items of spending that spending differs most proportionally in Scotland from the figures for the UK as a whole. For instance, spending per person on health in Scotland was £2,168 in 2011–12, £178 higher than the £1,990 per person spent on average across the UK as a whole. This represents a difference of only 8.9%, compared with a difference of 16.6% in total public service spending per person. Likewise, spending per person on education and training is only £5 or 0.4% higher in Scotland than in the UK as a whole14 and, by assumption, spending on defence is almost exactly the same per person. Spending on social services and other non-cash social protection is the exception, being £164 or 25.7% higher per person than the average for the UK as a whole. As will be discussed in Section 3.3, this higher spending on social services is likely to reflect both a more generous policy and a relatively higher level of need for this spending in Scotland.
It is on the smaller items of spending, which are largely the responsibility of the Scottish government, that spending per person in Scotland is proportionally greatest. For instance, spending on enterprise and economic development was £175 per person, well over three times higher than the UK-wide average of £54 per person. This reflects both levels of current spending (£115 versus £37 per person) and capital spending (£60 versus £17 per person) of over three times the average for the UK as a whole, and means that Scotland is the area with the highest levels of spending on this service area per person in the country.15
14 Capital spending on education and training was £26 (20.3%) per person higher in Scotland than in the UK as a whole, and current spending £21 (1.5%) lower per person.
15 PESA 2013 shows Scotland having identifiable spending per person on enterprise and economic development in 2011–12 around 15% higher than Northern Ireland, 50% higher than Wales and 160% higher than the North East of England, the regions with the next-highest
24 © Institute for Fiscal Studies, 2013
Spending per person on agriculture, forestry and fisheries was around twice the average for the UK as a whole (£193 versus £96), likely reflecting, at least in part, the large forestry and fishing industries and the large rural areas of Scotland. Spending per head was also around twice the UK average for housing and community amenities (£337 versus £171), due in large part to higher capital spending associated with the development of social housing, one effect of which, as noted in Phillips (2013),16 is to reduce payments of housing benefit in Scotland. The Scottish figure also includes some spending by Scottish Water, a publicly-owned company that provides water and sewerage services in Scotland. In contrast, in England and Wales, water supply services are privatised and spending by companies providing these services does not count as part of government expenditure. However, stripping out water supply services to make Scottish figures comparable to those for the UK as a whole would still leave spending per person on housing and community facilities close to 50% above the UK average. This would make the percentage difference in spending per person similar to transport (56.5% above the UK average) and to recreation, culture and religion (45.5% higher than the UK average).
There are only two areas where less was recorded as being spent than the average for the UK as a whole. The first is employment policies, where spending per person was around 21% lower than the average for the UK as a whole. However, this is a very small area of spending, amounting to less than 0.5% of all public service spending, which means a 21% difference equates to just £7 per person. It is also an area where there is likely to be a significant overlap with enterprise and economic development, and education and training, meaning one should not infer too much from this small difference.
The second is public order and safety, where spending per person was 5.5% (£29) below the average for the UK as a whole. However, spending on this area, which covers the police and fire services, law courts and prisons, is much higher in London than anywhere else in the UK, and this skews the figure for the UK as a whole. Figures from PESA 2013 show that spending per person on public order and safety was higher in Scotland than in all regions of England with the
levels of spending. PESA 2013 figures are not fully comparable with those in GERS 2011–12, but are constructed on a very similar basis and are thus broadly comparable.
16 D. Phillips, ‘Government spending on benefits and state pensions in Scotland: current patterns and future issues’, IFS Briefing Note 139, 2013, available at http://www.ifs.org.uk/publications/6818.
25 © Institute for Fiscal Studies, 2013
exceptions of the North East, North West and London, and it was above the figure for the UK as a whole excluding London.
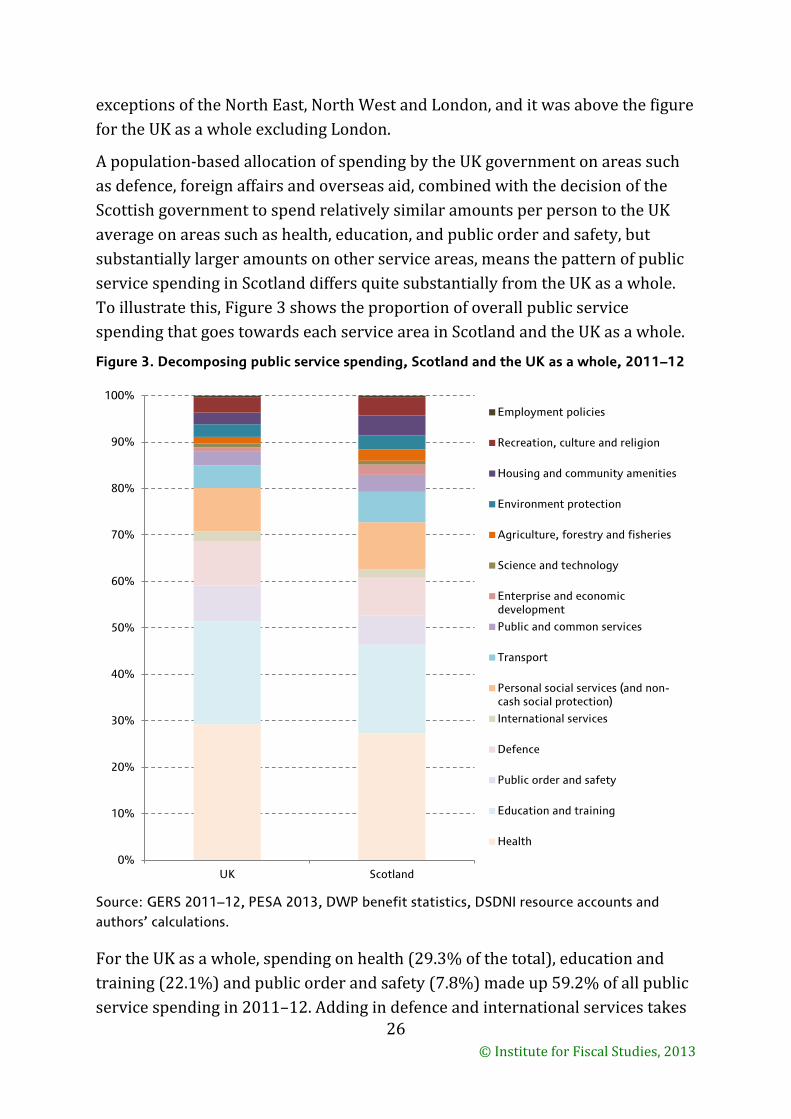
A population-based allocation of spending by the UK government on areas such as defence, foreign affairs and overseas aid, combined with the decision of the Scottish government to spend relatively similar amounts per person to the UK average on areas such as health, education, and public order and safety, but substantially larger amounts on other service areas, means the pattern of public service spending in Scotland differs quite substantially from the UK as a whole. To illustrate this, Figure 3 shows the proportion of overall public service spending that goes towards each service area in Scotland and the UK as a whole.
Figure 3. Decomposing public service spending, Scotland and the UK as a whole, 2011–12
Source: GERS 2011–12, PESA 2013, DWP benefit statistics, DSDNI resource accounts and authors’ calculations.
For the UK as a whole, spending on health (29.3% of the total), education and training (22.1%) and public order and safety (7.8%) made up 59.2% of all public service spending in 2011–12. Adding in defence and international services takes
0%
10%
20%
30%
40%
50%
60%
70%
80%
90%
100%
UK Scotland
Employment policies
Recreation, culture and religion
Housing and community amenities
Environment protection
Agriculture, forestry and fisheries
Science and technology
Enterprise and economic development
Public and common services
Transport
Personal social services (and non-cash social protection)
International services
Defence
Public order and safety
Education and training
Health
26 © Institute for Fiscal Studies, 2013
the figure to 70.7% of all public service spending. In contrast, in Scotland, spending on health (27.3% of the total), education and training (19.0%) and public order and safety (6.3%) made up a substantially smaller 52.7% of all public service spending in the same year. And adding in defence and international services, on which spending per person is assumed to be the same as the UK average, takes the figure to 62.6% of the total spent on public services in Scotland. This reflects the fact that whilst spending per person on public services for the benefit of Scotland was 16.6% (£1,128) higher than the UK average, for these five service areas the difference was only 3.2% (£155).
This means spending per person on the remaining areas was 48.9% (£973) higher than the average for the UK as a whole in 2011–12. In particular, spending for the benefit of Scotland on enterprise and economic development (2.2% of the total), agriculture, forestry and fisheries (2.4% of the total), housing and community amenities (4.2% of the total) and transport (6.5% of the total) together contributed 15.4% of overall spending in Scotland: for the UK as a whole, the figure was just 9.6%.
This pattern of similar or slightly higher-than-average spending per person on health and education, and substantially higher spending on most other devolved services, is similar to the situation in Wales and Northern Ireland.17 This suggests that the devolved governments have used their discretion over how to spend their block grant allocations to prioritise different service areas; or that relative spending needs for these smaller service areas are greater in Scotland, Wales and Northern Ireland; or a mixture of the two.
Tables 4 and 5 also show that as well as differing between services, the relative levels of spending in Scotland and the UK as a whole differ between capital and current spending. Current spending on public services per person in Scotland was 12.5% higher than the average for the UK as a whole, whilst capital spending per person was 48.2% higher. This means that whereas capital spending made up around 11.5% of all public service spending in the UK as a whole in 2011–12, it made up around 14.7% of all public service spending in Scotland. As is shown in Section 4, capital spending per person has been consistently higher in Scotland than in the UK as a whole since 2002–03, although the difference has grown substantially since 2009–10 as capital spending has been cut as part of the fiscal consolidation.
17 See PESA 2013, table 9.15, for instance.
27 © Institute for Fiscal Studies, 2013
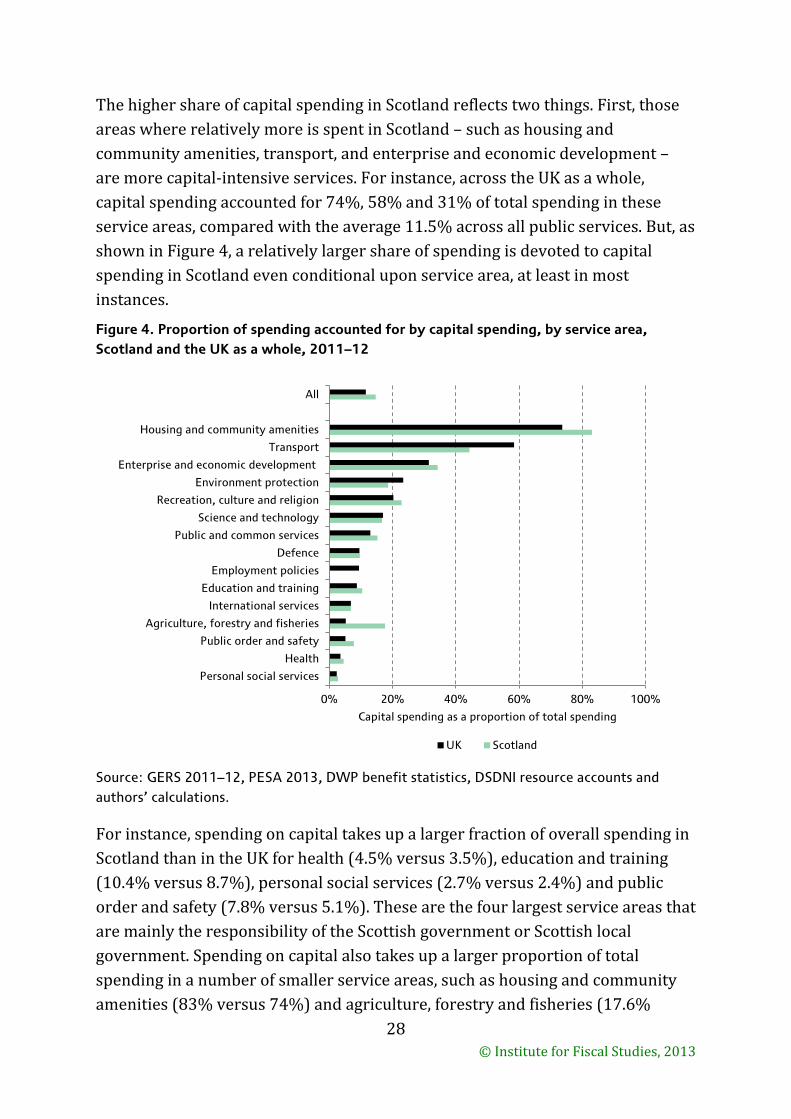
The higher share of capital spending in Scotland reflects two things. First, those areas where relatively more is spent in Scotland – such as housing and community amenities, transport, and enterprise and economic development – are more capital-intensive services. For instance, across the UK as a whole, capital spending accounted for 74%, 58% and 31% of total spending in these service areas, compared with the average 11.5% across all public services. But, as shown in Figure 4, a relatively larger share of spending is devoted to capital spending in Scotland even conditional upon service area, at least in most instances.
Figure 4. Proportion of spending accounted for by capital spending, by service area, Scotland and the UK as a whole, 2011–12
Source: GERS 2011–12, PESA 2013, DWP benefit statistics, DSDNI resource accounts and authors’ calculations.
For instance, spending on capital takes up a larger fraction of overall spending in Scotland than in the UK for health (4.5% versus 3.5%), education and training (10.4% versus 8.7%), personal social services (2.7% versus 2.4%) and public order and safety (7.8% versus 5.1%). These are the four largest service areas that are mainly the responsibility of the Scottish government or Scottish local government. Spending on capital also takes up a larger proportion of total spending in a number of smaller service areas, such as housing and community amenities (83% versus 74%) and agriculture, forestry and fisheries (17.6%
0% 20% 40% 60% 80% 100%
Personal social services
Health
Public order and safety
Agriculture, forestry and fisheries
International services
Education and training
Employment policies
Defence
Public and common services
Science and technology
Recreation, culture and religion
Environment protection
Enterprise and economic development
Transport
Housing and community amenities
All
Capital spending as a proportion of total spending
UK Scotland
28 © Institute for Fiscal Studies, 2013
versus 5.2%). The most notable exception to this general pattern is transport, where capital spending makes up just 44% of total spending in Scotland compared with 58% for the UK as a whole. As we show in the next section, this reflects the high levels of current transport spending in Scotland driven by subsidies to the railways and to ferry and air services in the Highlands and Islands.
3.3 A more detailed look at health, education, social services and transport spending
In this subsection, we examine in more detail spending on health, education, social services and transport in Scotland. Whilst differences in spending per person between Scotland and the rest of the UK are small in the first two instances (at least relative to the differences in other areas), together these account for almost half of all public service spending in Scotland, making such an analysis worthwhile, especially given the somewhat different demographic structure of Scotland compared with the UK as a whole. For social services, differences in policy between Scotland and the rest of the UK are a likely cause of differences in spending. Transport represents a fairly sizeable budget on which Scotland spends substantially more.
Health spending
Health spending per person in Scotland was around 9% higher than the average for the UK as a whole in 2011–12, due to both higher current spending (8% higher) and higher capital spending (39% higher). Demographic, socio-economic and geographical factors are each likely to play some role in explaining this higher level of expenditure.
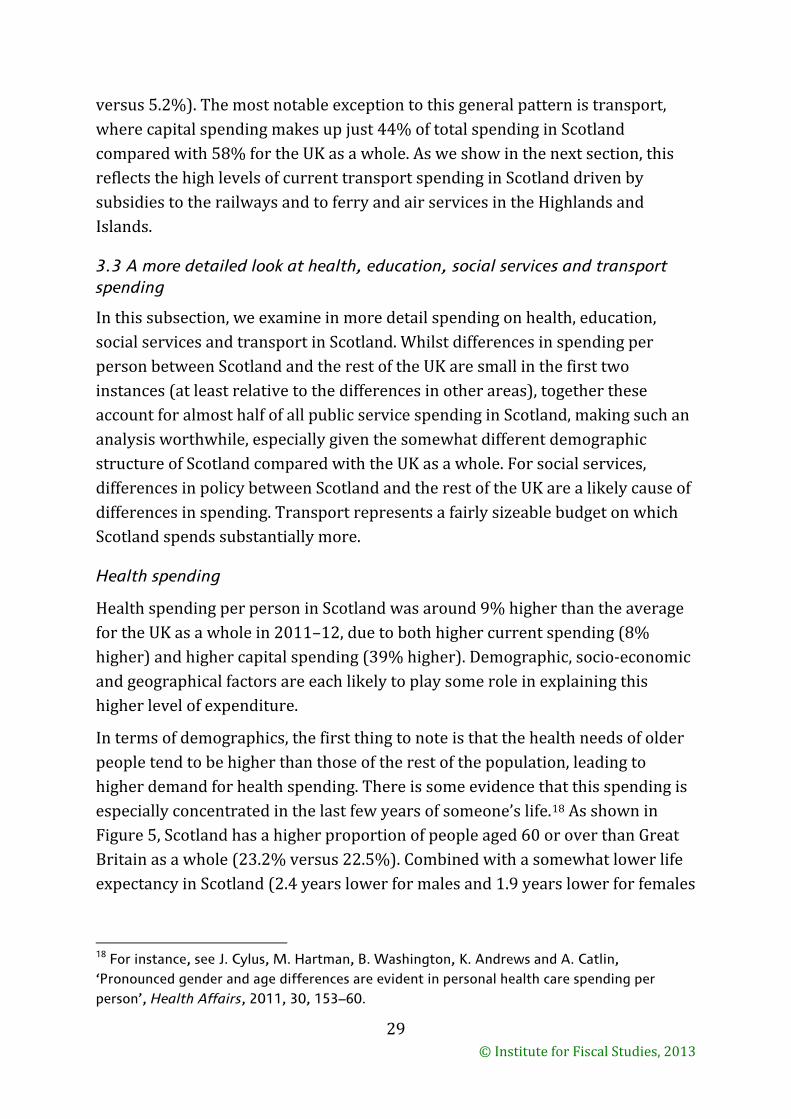
In terms of demographics, the first thing to note is that the health needs of older people tend to be higher than those of the rest of the population, leading to higher demand for health spending. There is some evidence that this spending is especially concentrated in the last few years of someone’s life.18 As shown in Figure 5, Scotland has a higher proportion of people aged 60 or over than Great Britain as a whole (23.2% versus 22.5%). Combined with a somewhat lower life expectancy in Scotland (2.4 years lower for males and 1.9 years lower for females
18 For instance, see J. Cylus, M. Hartman, B. Washington, K. Andrews and A. Catlin, ‘Pronounced gender and age differences are evident in personal health care spending per person’, Health Affairs, 2011, 30, 153–60.
29 © Institute for Fiscal Studies, 2013
than the UK averages19), this is likely to mean a higher fraction of people in Scotland than in the UK as a whole are in a part of their lives when their need for healthcare spending is relatively high.
Figure 5. The age structure of Scotland and Great Britain
Source: Census 2011 statistics.
However, Figure 5 also shows that Scotland has fewer children, another group on which health spending is above average, and the birth rate is also lower in Scotland,20 leading to lower demand for ante- and post-natal care. Thus, differences in basic demographic structure do not unambiguously act to increase relative health spending needs in Scotland.
The health status of people of given ages will also impact upon health spending needs. This means that Scotland’s seemingly less-healthy-than-average population is likely to be a factor underlying its relatively high health spending. A broad range of health measures are worse in Scotland than for the UK as a whole, including average life expectancy and mortality rates,21 the proportion of life that
19 The Office for National Statistics (ONS) estimates that life expectancy in 2008–10 was 80.4 for females and 75.8 for males in Scotland, whereas it was 82.3 for females and 78.2 for males in the UK as a whole – see http://www.ons.gov.uk/ons/rel/regional-trends/region-and-country-profiles/social-indicators/regional-profiles---social-indicators---feb-2012.xls.
20 In 2010, there were 11.3 live births per 1,000 people in Scotland compared with the UK average of 13.0, according to ONS – see http://www.ons.gov.uk/ons/taxonomy/index.html?nscl=Birth+Rates#tab-data-tables.
21 In 2009, there were 667 deaths per 100,000 people in Scotland compared with the UK average of 563, according to ONS – see http://www.ons.gov.uk/ons/taxonomy/index.html?nscl=Birth+Rates#tab-data-tables.
0%
5%
10%
15%
20%
25%
30%
0–14 15–24 25–44 45–59 60 and over
% o
f th
e po
pula
tion
in a
ge g
roup
Age group
Scotland Great Britain
30 © Institute for Fiscal Studies, 2013
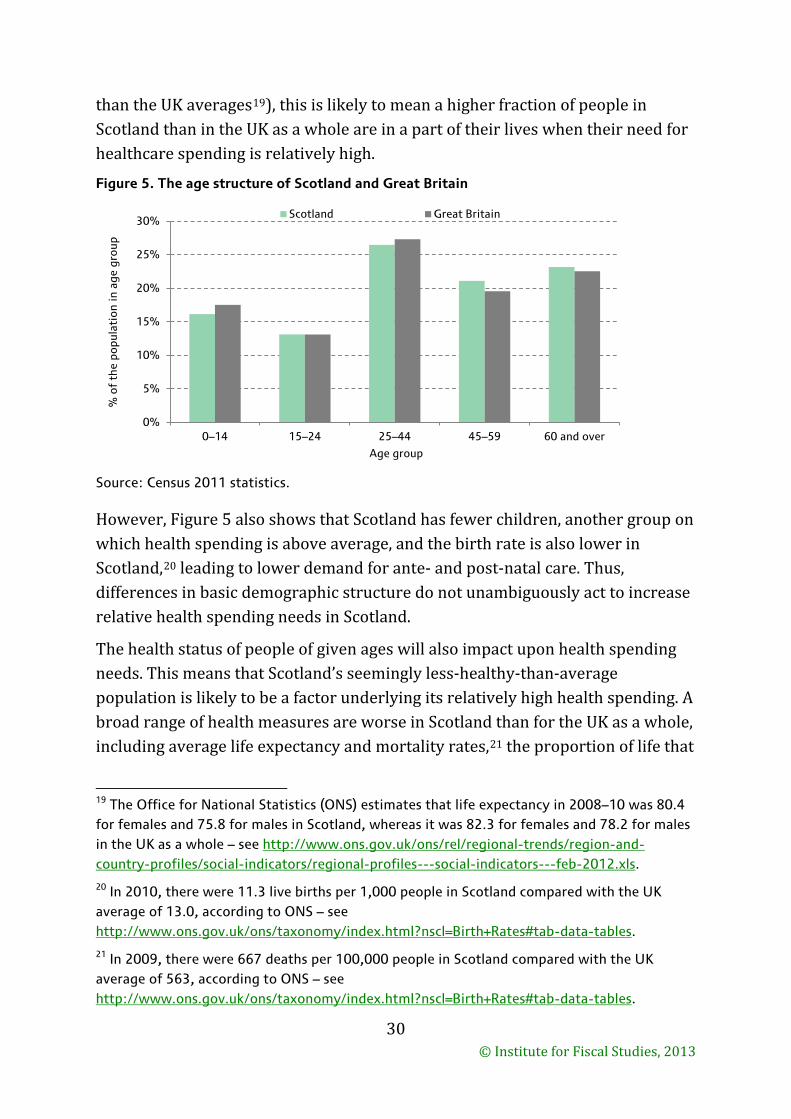
can be expected to be healthy (for males),22 the numbers of people reporting a work-limiting disability or claiming a disability benefit23 and the numbers reporting ill health. Figure 6, for instance, shows that the proportion of Scots claiming that they have an illness that limits their daily activity in some way is higher than the average for Great Britain, with the exception of the over-70s (the lower levels of ill health for this age group in Scotland might reflect the lower life expectancy in Scotland, especially in those parts of the country where ill health is more prevalent).24 Levels of alcohol abuse and smoking,25 and the rates of heart disease26 and many forms of cancer,27 are also higher in Scotland than the UK average.
Figure 6. Self-reported activity-limiting illness by age in Scotland and Great Britain
Source: Labour Force Survey, 2012.
22 ONS, ‘Health expectancies at birth and at age 65 in the United Kingdom, 2008–2010’, Statistical Bulletin, 29 August 2012, http://www.ons.gov.uk/ons/dcp171778_277684.pdf.
23 For a discussion of disability spending and claims in Scotland, see D. Phillips, ‘Government spending on benefits and state pensions in Scotland: current patterns and future issues’, IFS Briefing Note 139, 2013, available at http://www.ifs.org.uk/publications/6818.
24 In Perth and Kinross, life expectancy in 2008–10 was estimated to be 79.1 for males and 82.3 for females; by contrast, in Glasgow city, it was just 71.6 for males and 78.0 for females.
25 ONS, General Lifestyle Survey Overview: A Report on the 2010 General Lifestyle Survey, 2012, available at http://www.ons.gov.uk/ons/rel/ghs/general-lifestyle-survey/2010/index.html.
26 See http://www.bhf.org.uk/media/news-from-the-bhf/bhf-facts.aspx.
27 ONS, ‘Cancer incidence and mortality in the United Kingdom, 2008–10’, Statistical Bulletin, 6 December 2012, http://www.ons.gov.uk/ons/dcp171778_289890.pdf.
0%
5%
10%
15%
20%
25%
30%
35%
40%
45%
50%
% o
f ag
e gr
oup
wit
h lim
itin
g ill
ness
Age group
Scotland Great Britain
31 © Institute for Fiscal Studies, 2013
However, it is also worth noting that poorer health in Scotland may be indicative of a lower quality of healthcare. Research by the Nuffield Trust, for instance, suggests that the healthcare systems in Scotland, Wales and Northern Ireland generally performed less well than that in England, at least in the period up until 2006–07, when its data end.28 And, for instance, cancer mortality rates exceed the UK average rate by more than cancer incidence rates do, which is indicative of poorer treatment outcomes (perhaps reflecting later diagnosis).
Other factors that may influence health spending needs include the relative sparsity of Scotland’s population (which would tend to increase health spending needs, as more facilities would be required to serve the same number of people) and Scotland’s lower property and labour costs (which would tend to reduce health spending needs).29
The NHS systems in England and Scotland use funding formulas to allocate funding to primary care trusts. These formulas are used to allocate around 80% of all health spending in England and 67% of all health spending in Scotland. They are designed so that they provide the amount of funding required in an area to deliver the same services at the same standard, taking into account the age structure of the local population, additional needs (higher levels of certain illnesses etc.) and differences in costs that accrue from differences in wages or property costs (in the case of England) or a lack of economies of scale in rural areas (in the case of Scotland). The two formulas contain many similar items but do differ, especially with respect to the cost indicators used.
Ball, Eiser and King (2013) use these funding formulas to assess relative health spending needs in different parts of the UK and compare these with actual differences in health spending.30 Their calculations are based on data from 2001
28 S. Connolly, G. Bevan and N. Mays, Funding and Performance of Healthcare Systems in the Four Countries of the UK before and after Devolution, Nuffield Trust, London, 2011, http://www.nuffieldtrust.org.uk/sites/files/nuffield/funding_and_performance_of_healthcare_systems_in_the_four_countries_report_full.pdf.
29 Whilst median earnings in Scotland are similar to the average for the UK as a whole, there are fewer high earners, which may mean health professionals can be recruited at lower cost than across the UK as a whole. See D. Phillips, ‘Government spending on benefits and state pensions in Scotland: current patterns and future issues’, IFS Briefing Note 139, 2013, available at http://www.ifs.org.uk/publications/6818.
30 R. Ball, D. Eiser and D. King, ‘Assessing relative spending needs of devolved government: the case of healthcare spending in the UK’, Regional Studies, 2013, available at http://www.tandfonline.com/doi/abs/10.1080/00343404.2013.779660#.UienG_kq651.
32 © Institute for Fiscal Studies, 2013
to 2009 when spending per person on health was 13.9% higher in Scotland than in England, on average. This difference had fallen to 11.6% per person by 2011–12, according to PESA 2013. They estimate that use of the English formula would result in assessed health spending needs in Scotland 7.2% above those in England, substantially less than the 11.6% difference in actual spending in 2011–12 and the larger difference in earlier years. Using the Scottish NHS formula would lead to spending in Scotland being 11.2% higher than that in England, much closer to the gap in actual spending in 2011–12. The difference in results when using the two formulas reflects the fact that the Scottish formula gives greater weight to mortality rates, self-assessed health and sparsity of population, and less weight to labour and property costs and to indicators of labour market disadvantage and ethnic diversity. In effect, the Scottish formula weights more highly those factors that would indicate more should be spent on Scotland.
Ball et al. conclude that their findings ‘reinforce the view that levels of public spending are relatively generous (compared with need) in Scotland’. However, they also produce results that show the impact of taking into account another part of the health funding formula in use in England, which provides additional funding for those areas with poor health outcomes in an effort to reduce health inequalities. If this were applied to Scotland, health spending needs per person are estimated to be 11.7% higher than in England when using the English formula, very close to the difference in actual spending. Using the Scottish formula, spending needs per person would be 15.6% higher on this basis, rather higher than the difference actually observed.
If health spending is above the level required to provide the same level of service in Scotland as in England, this does not appear to be associated with any clear superiority in terms of NHS outputs. Scotland tends to fare worse than England in many indicators of the quality of care and health outcomes and in its achievement of waiting-time targets.31 Also, in 2008–09, cost-weighted activity per hospital medical staff member was lower in Scotland than in England, Wales and Northern Ireland for outpatient, inpatient and day-case admissions,
31 National Audit Office, Healthcare across the UK: A Comparison of the NHS in England, Scotland, Wales and Northern Ireland, 2012, http://www.wao.gov.uk/assets/englishdocuments/Healthcare_across_the_UK.pdf.
33 © Institute for Fiscal Studies, 2013
suggesting lower NHS productivity in Scotland, although more time spent per patient could also act to improve quality.32
Education spending
Whilst education spending is only marginally greater per person in Scotland, the proportion of the population aged between 3 and 22, on whom most education spending is concentrated, is lower in Scotland than in the UK as a whole (23.2% compared with 24.2%). The amount spent per person aged 3–22 is therefore 4.8% (£299) higher in Scotland than across the UK as a whole.
Potential differences in classification of education spending in different parts of the UK mean comparisons of the relative amounts spent on different levels of education using PESA data must be treated with some caution. However, they suggest that spending on pre-school and school-based education is 0.9% (£55) per person aged 3 to 18 higher in Scotland than in the UK as a whole (with spending on pre-school and primary school substantially above the UK average, mostly offset by spending on secondary school substantially below the UK average). This gap reflects the fact that a higher proportion of pupils attend state schools in Scotland than in the UK as a whole, meaning that spending per pupil enrolled in primary and secondary education was £302 higher in the UK as a whole than in Scotland.33
Ball, Eiser and King (2012) use the funding formulas of the Scottish and English education departments to examine the relative schools spending requirements of the different parts of the UK as of 2009–10.34 As with the health funding
32 National Audit Office, 2012 – see previous footnote. See also S. Connolly, G. Bevan and N. Mays, Funding and Performance of Healthcare Systems in the Four Countries of the UK before and after Devolution, Nuffield Trust, London, 2011, http://www.nuffieldtrust.org.uk/sites/files/nuffield/funding_and_performance_of_healthcare_systems_in_the_four_countries_report_full.pdf.
33 Numbers of enrolled pupils in England, Northern Ireland, Scotland and Wales come from https://www.gov.uk/government/uploads/system/uploads/attachment_data/file/221786/sfr11-2013.pdf, http://www.deni.gov.uk/enrolments_in_schools_1112__-_february_release_-_final_revised2-2.pdf, http://www.scotland.gov.uk/Topics/Statistics/Browse/School-Education/TrendPupilNumbers and https://statswales.wales.gov.uk/Catalogue/Education-and-Skills/Schools-and-Teachers/Schools-Census/Regions-of-Wales/Pupils/NumberOfPupils-by-Region-YearGroup.
34 R. Ball, D. King and D. Eiser, ‘Replacing the Barnett formula by needs assessment: lessons from school funding formulae in England and Scotland’, University of Stirling, 2012, http://www.barnett-or-needs.stir.ac.uk/documents/educationpaper1Nov2012web_000.pdf.
34 © Institute for Fiscal Studies, 2013
formulas, there are similarities but also differences, with the English formula placing more weight on labour and property costs and the Scottish formula placing more weight on sparsity of the population. The authors find that according to the English formula, schools spending should be 1.2% lower per pupil in Scotland than in England, in large part down to Scotland’s lower factor costs. On the other hand, the Scottish formula implies spending per pupil 0.3% higher than that in England. At the time of their report, spending per pupil in Scotland exceeded that in England by more than both of these, suggesting relative spending was between about 1% and 2.5% higher per pupil relative to England than a needs-based approach to funding would lead to. However, since then, a fall in relative spending on education in Scotland compared with the UK as a whole (see Section 4) means that relative spending per pupil in Scotland is now lower than it might ought to be if relative needs are the same as in 2009–10.35
Differences in the examinations taken by students in Scotland and the rest of the UK mean official national examination scores cannot be used to compare educational outcomes. A number of internationally-comparable tests are taken by samples of state school students in Scotland and the rest of the UK, but these are inconclusive. In the most recent PISA tests in 2009, Scotland outperformed the UK as a whole in both reading and mathematics (scoring 500 and 499, respectively, as opposed to 494 and 492), whilst performance in science matched the level for the UK as a whole (514).36 However, Scotland fared poorly in the PIRLS and TIMSS tests in 2006 and 2007 respectively (the last time it participated in the tests), with scores statistically significantly lower than in England in reading, maths and science, for all the ages assessed (4th grade for PIRLS – i.e. 9- to 10-year-olds – and grades 4 and 8 for TIMSS).37
Identifiable spending on higher education is much higher per person in Scotland than in the UK as a whole: £265 compared with £187 in 2011–12 (in 2013–14
35 PESA 2013 sub-function spending figures and 2011 pupil numbers reported by the Scottish and UK governments suggest expenditure on primary and secondary school education per pupil enrolled in state primary and secondary schools was 6.1% lower in Scotland than in England in 2011–12.
36 The executive summary for PISA (the OECD Programme for International Student Assessment) 2009, which contains a table with most countries’ results, can be found at http://www.oecd.org/pisa/pisaproducts/46619703.pdf. Scotland’s results can be found at http://www.scotland.gov.uk/Resource/Doc/333833/0109007.pdf.
37 PIRLS reports can be found at http://timssandpirls.bc.edu/isc/publications.html#p06. TIMSS reports can be found at http://timssandpirls.bc.edu/isc/publications.html#t07.
35 © Institute for Fiscal Studies, 2013
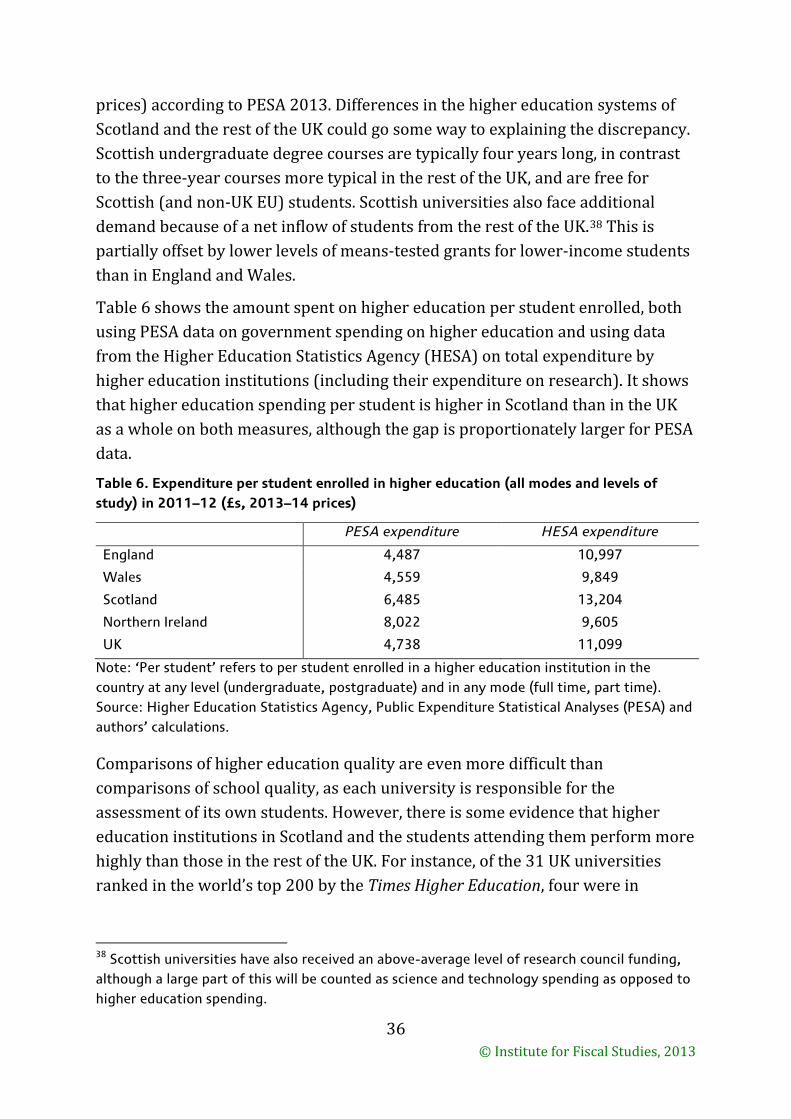
prices) according to PESA 2013. Differences in the higher education systems of Scotland and the rest of the UK could go some way to explaining the discrepancy. Scottish undergraduate degree courses are typically four years long, in contrast to the three-year courses more typical in the rest of the UK, and are free for Scottish (and non-UK EU) students. Scottish universities also face additional demand because of a net inflow of students from the rest of the UK.38 This is partially offset by lower levels of means-tested grants for lower-income students than in England and Wales.
Table 6 shows the amount spent on higher education per student enrolled, both using PESA data on government spending on higher education and using data from the Higher Education Statistics Agency (HESA) on total expenditure by higher education institutions (including their expenditure on research). It shows that higher education spending per student is higher in Scotland than in the UK as a whole on both measures, although the gap is proportionately larger for PESA data.
Table 6. Expenditure per student enrolled in higher education (all modes and levels of study) in 2011–12 (£s, 2013–14 prices)
PESA expenditure HESA expenditure
England 4,487 10,997
Wales 4,559 9,849
Scotland 6,485 13,204
Northern Ireland 8,022 9,605
UK 4,738 11,099
Note: ‘Per student’ refers to per student enrolled in a higher education institution in the country at any level (undergraduate, postgraduate) and in any mode (full time, part time). Source: Higher Education Statistics Agency, Public Expenditure Statistical Analyses (PESA) and authors’ calculations.
Comparisons of higher education quality are even more difficult than comparisons of school quality, as each university is responsible for the assessment of its own students. However, there is some evidence that higher education institutions in Scotland and the students attending them perform more highly than those in the rest of the UK. For instance, of the 31 UK universities ranked in the world’s top 200 by the Times Higher Education, four were in
38 Scottish universities have also received an above-average level of research council funding, although a large part of this will be counted as science and technology spending as opposed to higher education spending.
36 © Institute for Fiscal Studies, 2013
Scotland.39 Scottish universities also managed to attract a proportionally greater share of research funding, the provision of which is competitive and hence this could again be an indicator of quality (although it may also suggest a prioritisation of research over teaching). The results of the National Student Survey suggested that Scottish students also tend to report slightly higher levels of satisfaction with their courses than those enrolled in the institutions in other UK constituent countries.40 The graduate unemployment rate 6 months after the end of course is also lower – 7% versus 8% in England and Wales for full-time students and 2% compared with 4% for part-time students.41
Social services and social protection spending
As shown above, spending per person on social services and non-cash social protection was 25.7% higher in Scotland than in the UK as a whole in 2011–12. Analysis of PESA 2013 figures shows that this partly reflects higher identifiable spending on social services for children and families (£165 per person compared with £115 across the UK as a whole42), but it is mainly due to higher spending on social services for older people (£258 per person compared with£161). Perhaps surprisingly given the higher levels of ill health and disability in Scotland, spending per person on this area is much closer to the average for the UK as a whole.
A key reason for the difference in spending on older people was the Scottish government’s decision in 2002 to provide free personal care to those over 65 who are assessed as needing such support. Residents who self-fund their stay at a care home receive £166 per week towards their personal care and an additional £75 per week if they also require nursing care. They remain
39 The Times Higher Education World University Rankings for 2012–13 (available at http://www.timeshighereducation.co.uk/world-university-rankings/2012-13/world-ranking) show the University of Edinburgh, the University of St Andrews, the University of Glasgow and the University of Aberdeen in the top 200.
40 The results of the 2013 National Student Survey are available online at http://www.hefce.ac.uk/whatwedo/lt/publicinfo/nationalstudentsurvey/nationalstudentsurveydata/2013/.
41 These figures are from the Higher Education Statistics Agency and are available at http://www.hesa.ac.uk/index.php?option=com_content&task=view&id=2903&Itemid=161#tables.
42 Which equates to an even larger difference per child, given that children make up a lower fraction of the population in Scotland.
37 © Institute for Fiscal Studies, 2013
responsible for their food and accommodation costs (although those with low incomes and few assets may also receive help paying for these). People who are able to remain in their own residence can either receive care services from their local authority or receive an amount of money with which to pay their own chosen provider.
This is much more generous than the systems currently in place in England and Wales. In England, for instance, people with assets of more than £23,250 (which includes the value of their primary residence) are responsible for paying for all of their care and those with assets of between £14,250 and £23,250 are responsible for paying for part of their care. In Wales, those with assets of more than £23,750 are responsible for paying for their personal care (whilst those with less than this receive free care), although the cost is capped at £50 per week for those remaining in their own home. Reforms introduced by the English government in response to the Dilnot Commission43 will make the system in England substantially more generous than currently from 2016 (raising the level of assets used in the means test substantially and capping lifetime costs at £72,000, which is expected to benefit more than one-in-ten people44), but will still leave it less generous than the system in Scotland.
The cost of free personal care provision is substantial, amounting to £451.6 million in 2011–12 (in 2013–14 prices), the latest year for which data are available. The cost of this provision has increased by 77% in real terms since the policy was introduced in 2003–04. This is a result of spending on personal care for those living in their own homes more than doubling (from £168.7 million to £360.1 million), reflecting an increase in the number of recipients of such care, an increase in the average hours of care provided to them and an increase in the costs of care per hour. Box 3 provides more details on these trends.
43 http://webarchive.nationalarchives.gov.uk/20130221130239/http://www.dilnotcommission.dh.gov.uk/.
44 Department of Health, ‘Policy statement on care and support funding reform and legislative requirements’, https://www.gov.uk/government/uploads/system/uploads/attachment_data/file/217024/Policy-statement-on-funding-reform.pdf.
38 © Institute for Fiscal Studies, 2013
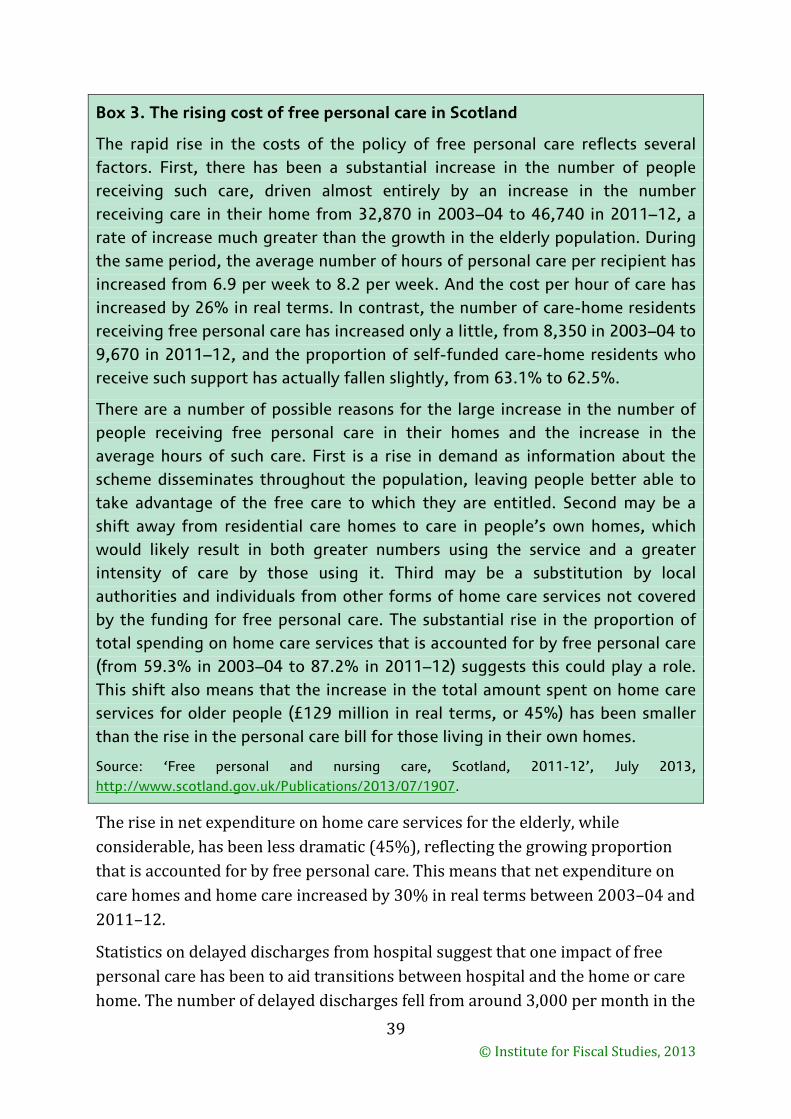
Box 3. The rising cost of free personal care in Scotland
The rapid rise in the costs of the policy of free personal care reflects several factors. First, there has been a substantial increase in the number of people receiving such care, driven almost entirely by an increase in the number receiving care in their home from 32,870 in 2003–04 to 46,740 in 2011–12, a rate of increase much greater than the growth in the elderly population. During the same period, the average number of hours of personal care per recipient has increased from 6.9 per week to 8.2 per week. And the cost per hour of care has increased by 26% in real terms. In contrast, the number of care-home residents receiving free personal care has increased only a little, from 8,350 in 2003–04 to 9,670 in 2011–12, and the proportion of self-funded care-home residents who receive such support has actually fallen slightly, from 63.1% to 62.5%.
There are a number of possible reasons for the large increase in the number of people receiving free personal care in their homes and the increase in the average hours of such care. First is a rise in demand as information about the scheme disseminates throughout the population, leaving people better able to take advantage of the free care to which they are entitled. Second may be a shift away from residential care homes to care in people’s own homes, which would likely result in both greater numbers using the service and a greater intensity of care by those using it. Third may be a substitution by local authorities and individuals from other forms of home care services not covered by the funding for free personal care. The substantial rise in the proportion of total spending on home care services that is accounted for by free personal care (from 59.3% in 2003–04 to 87.2% in 2011–12) suggests this could play a role. This shift also means that the increase in the total amount spent on home care services for older people (£129 million in real terms, or 45%) has been smaller than the rise in the personal care bill for those living in their own homes.
Source: ‘Free personal and nursing care, Scotland, 2011-12’, July 2013, http://www.scotland.gov.uk/Publications/2013/07/1907.
The rise in net expenditure on home care services for the elderly, while considerable, has been less dramatic (45%), reflecting the growing proportion that is accounted for by free personal care. This means that net expenditure on care homes and home care increased by 30% in real terms between 2003–04 and 2011–12.
Statistics on delayed discharges from hospital suggest that one impact of free personal care has been to aid transitions between hospital and the home or care home. The number of delayed discharges fell from around 3,000 per month in the
39 © Institute for Fiscal Studies, 2013
early 2000s, to between 500 and 750 by 2008, a level that has since been maintained.45 Although such delayed discharges can occur for a number of reasons and are not limited to patients who have reached 65 years of age, over the last 10 years the most frequently cited reasons for the delay were awaiting the availability of or funding for a place at a care home or care at home. Time series for these statistics are not available elsewhere in the UK, however, meaning it is not possible to examine whether a similar trend is evident elsewhere within the UK.
Transport spending
Transport spending was the fifth-largest category of public service spending in Scotland (and the sixth-largest in the UK as a whole) in 2011–12 and was 56.5% higher per person than the average for the UK as a whole in that year. However, a large part of spending in the rest of the UK is concentrated in London: identifiable transport expenditure in London was more than twice the UK average (104% higher), according to PESA 2013. This reflects the substantial investment in the capital’s public transport infrastructure and large subsidies to its operating costs by Transport for London (TfL). Identifiable transport spending per person in Scotland was more than twice that in any other region of England with the exception of the North West and the East (although there it was still 86% higher), and was almost three times as high as in the South West of England.
Table 7 uses PESA 2013 data to investigate on which types of transport services more is spent per person in Scotland than in the UK as a whole. It shows that more is spent on all areas, with the exception of local public transport, where spending in the rest of the UK is likely to be pushed up substantially by high spending in London (including the underground system) by TfL. The largest differences are for other transport – which includes air and water-based travel – spending on which was over five times higher in Scotland than in the UK in 2011–12, and for local and national roads, on which 73% more was spent per person. Spending per person on railways was estimated to be 43% higher than in the UK as a whole.
45 http://www.isdscotland.org/Health-Topics/Health-and-Social-Community-Care/Publications/2013-08-27/DD_Jul13_tables_charts_A_standard.xls.
40 © Institute for Fiscal Studies, 2013
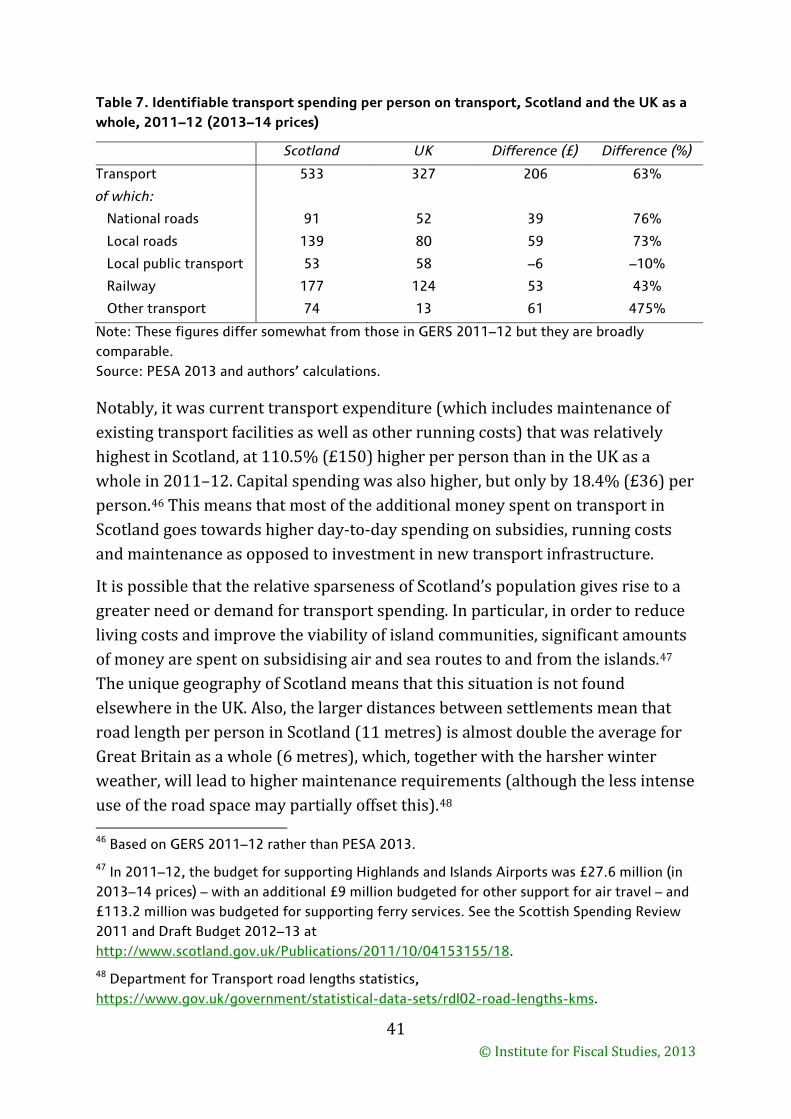
Table 7. Identifiable transport spending per person on transport, Scotland and the UK as a whole, 2011–12 (2013–14 prices)
Scotland UK Difference (£) Difference (%)
Transport 533 327 206 63%
of which:
National roads 91 52 39 76%
Local roads 139 80 59 73%
Local public transport 53 58 –6 –10%
Railway 177 124 53 43%
Other transport 74 13 61 475%
Note: These figures differ somewhat from those in GERS 2011–12 but they are broadly comparable. Source: PESA 2013 and authors’ calculations.
Notably, it was current transport expenditure (which includes maintenance of existing transport facilities as well as other running costs) that was relatively highest in Scotland, at 110.5% (£150) higher per person than in the UK as a whole in 2011–12. Capital spending was also higher, but only by 18.4% (£36) per person.46 This means that most of the additional money spent on transport in Scotland goes towards higher day-to-day spending on subsidies, running costs and maintenance as opposed to investment in new transport infrastructure.
It is possible that the relative sparseness of Scotland’s population gives rise to a greater need or demand for transport spending. In particular, in order to reduce living costs and improve the viability of island communities, significant amounts of money are spent on subsidising air and sea routes to and from the islands.47 The unique geography of Scotland means that this situation is not found elsewhere in the UK. Also, the larger distances between settlements mean that road length per person in Scotland (11 metres) is almost double the average for Great Britain as a whole (6 metres), which, together with the harsher winter weather, will lead to higher maintenance requirements (although the less intense use of the road space may partially offset this).48
46 Based on GERS 2011–12 rather than PESA 2013.
47 In 2011–12, the budget for supporting Highlands and Islands Airports was £27.6 million (in 2013–14 prices) – with an additional £9 million budgeted for other support for air travel – and £113.2 million was budgeted for supporting ferry services. See the Scottish Spending Review 2011 and Draft Budget 2012–13 at http://www.scotland.gov.uk/Publications/2011/10/04153155/18.
48 Department for Transport road lengths statistics, https://www.gov.uk/government/statistical-data-sets/rdl02-road-lengths-kms.
41 © Institute for Fiscal Studies, 2013
However, the scale of the differences between Scotland and regions such as the South West of England (which has road length per person close to the Scottish figure) and the North West and North East of England (which both contain large metropolitan areas and large rural areas, similar to Scotland) is so great that it does seem as though funding for transport in Scotland is relatively generous. As an example, a large part of the additional spending on rail likely reflects the fact that the Scottish government contributes three-quarters of the cost of operating ScotRail, compared with around one-third contributed by government across the UK as a whole.49 This means that the subsidies paid by the UK’s Department for Transport services equalled 6.8p per passenger mile in 2012–13, compared with around 17.2p per passenger mile paid by the Scottish government to ScotRail.50
4. Changes in public service spending in Scotland and the UK since 2002–03
The previous section analysed how public service spending in Scotland compared with that in the UK as a whole in 2011–12, the latest year for which data are available. In this section, we examine changes in public service spending over time in order to see whether the patterns observed in 2011–12 are representative of the last decade or so, and to explore whether the Scottish government has been prioritising the same services as governments in the rest of the UK.
Section 4.1 examines how public service spending changed between 2002–03 and 2011–12 using a number of years of GERS publications. This shows that public service spending per person has been substantially higher than in the UK as a whole during that entire period, with the gap sometimes shrinking and sometimes widening. It also shows that the prioritisation of different services in Scotland is not always in line with the pattern for the UK as a whole. Section 4.2 explores the choices made by the Scottish government in allocating the cuts required since 2010–11. This shows a similar pattern of large cuts in grants to local government and protection of the NHS.
49 Figures from Transport Scotland, http://www.transportscotland.gov.uk/strategy-and-research/publications-and-consultations/j203179-08.htm.
50 Figures from the Department for Transport and the Office of Rail Regulation, https://www.gov.uk/government/publications/rail-subsidy-per-passenger-mile and http://dataportal.orr.gov.uk/displayreport/html/html/6d363642-c3a9-4a29-9477-542810798fa7.
42 © Institute for Fiscal Studies, 2013
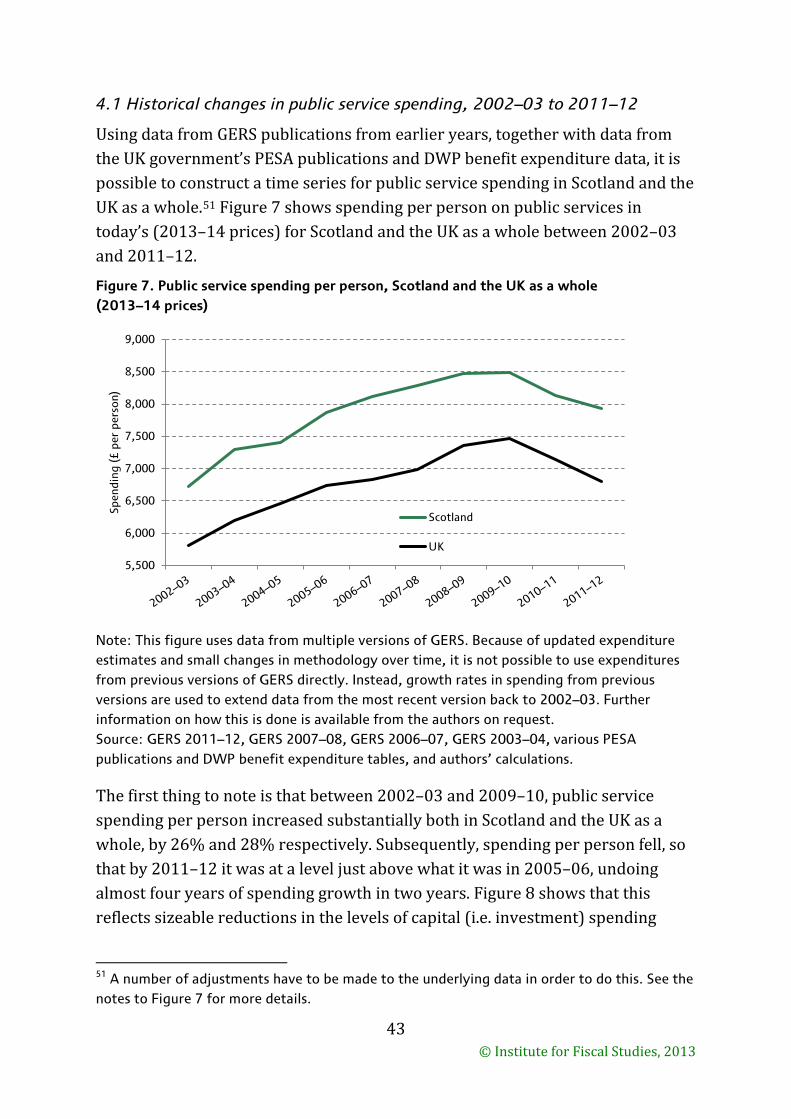
4.1 Historical changes in public service spending, 2002–03 to 2011–12
Using data from GERS publications from earlier years, together with data from the UK government’s PESA publications and DWP benefit expenditure data, it is possible to construct a time series for public service spending in Scotland and the UK as a whole.51 Figure 7 shows spending per person on public services in today’s (2013–14 prices) for Scotland and the UK as a whole between 2002–03 and 2011–12.
Figure 7. Public service spending per person, Scotland and the UK as a whole (2013–14 prices)
Note: This figure uses data from multiple versions of GERS. Because of updated expenditure estimates and small changes in methodology over time, it is not possible to use expenditures from previous versions of GERS directly. Instead, growth rates in spending from previous versions are used to extend data from the most recent version back to 2002–03. Further information on how this is done is available from the authors on request. Source: GERS 2011–12, GERS 2007–08, GERS 2006–07, GERS 2003–04, various PESA publications and DWP benefit expenditure tables, and authors’ calculations.
The first thing to note is that between 2002–03 and 2009–10, public service spending per person increased substantially both in Scotland and the UK as a whole, by 26% and 28% respectively. Subsequently, spending per person fell, so that by 2011–12 it was at a level just above what it was in 2005–06, undoing almost four years of spending growth in two years. Figure 8 shows that this reflects sizeable reductions in the levels of capital (i.e. investment) spending
51 A number of adjustments have to be made to the underlying data in order to do this. See the notes to Figure 7 for more details.
5,500
6,000
6,500
7,000
7,500
8,000
8,500
9,000
Spen
ding
(£ p
er p
erso
n)
Scotland
UK
43 © Institute for Fiscal Studies, 2013
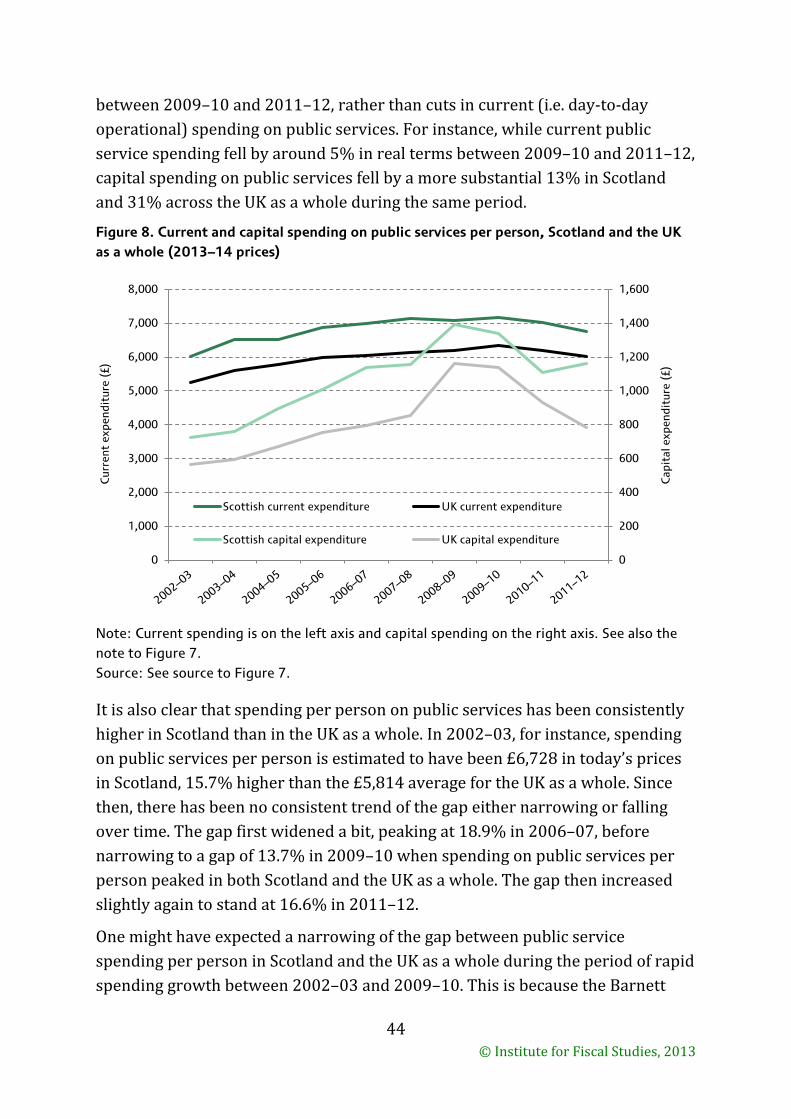
between 2009–10 and 2011–12, rather than cuts in current (i.e. day-to-day operational) spending on public services. For instance, while current public service spending fell by around 5% in real terms between 2009–10 and 2011–12, capital spending on public services fell by a more substantial 13% in Scotland and 31% across the UK as a whole during the same period.
Figure 8. Current and capital spending on public services per person, Scotland and the UK as a whole (2013–14 prices)
Note: Current spending is on the left axis and capital spending on the right axis. See also the note to Figure 7. Source: See source to Figure 7.
It is also clear that spending per person on public services has been consistently higher in Scotland than in the UK as a whole. In 2002–03, for instance, spending on public services per person is estimated to have been £6,728 in today’s prices in Scotland, 15.7% higher than the £5,814 average for the UK as a whole. Since then, there has been no consistent trend of the gap either narrowing or falling over time. The gap first widened a bit, peaking at 18.9% in 2006–07, before narrowing to a gap of 13.7% in 2009–10 when spending on public services per person peaked in both Scotland and the UK as a whole. The gap then increased slightly again to stand at 16.6% in 2011–12.
One might have expected a narrowing of the gap between public service spending per person in Scotland and the UK as a whole during the period of rapid spending growth between 2002–03 and 2009–10. This is because the Barnett
0
200
400
600
800
1,000
1,200
1,400
1,600
0
1,000
2,000
3,000
4,000
5,000
6,000
7,000
8,000
Cap
ital
exp
endi
ture
(£)
Cur
rent
exp
endi
ture
(£)
Scottish current expenditure UK current expenditure
Scottish capital expenditure UK capital expenditure
44 © Institute for Fiscal Studies, 2013
formula, which determines changes to the block grant given to the Scottish government, is designed to provide the same pounds-per-person change in the block grant to the Scottish government as the pounds-per-person change in spending on comparable services in England; and a given pounds-per-person change in spending would translate into a smaller percentage change given that baseline spending was higher in Scotland. Slower population growth in Scotland than in the UK as a whole is likely to be one factor underlying the lack of convergence – the population is estimated to have grown by 4.8% in Scotland52 compared with 6.6% for the UK as a whole between mid-2002 and mid-2011, for instance. In addition, problems with the way the Barnett formula deals with changes in the budgets of Whitehall departments that fund partly devolved and partly non-devolved services (see Box 2 in Section 3.1) mean it does not always deliver the same pounds-per-head increase in spending on devolved services; also, not all services – the biggest example being defence – are devolved to Scotland, and spending on these is therefore not subject to the Barnett formula.
Figure 8 shows that consistently higher overall spending per person on public services in Scotland compared with the UK as a whole reflects both higher current and capital spending. However, the size of the gap, and how the gap has changed over time, differ for current and capital spending.
Current spending on public services was, on average, 14.3% higher in Scotland than in the UK as a whole between 2002–03 and 2011–12. On the other hand, capital spending on public services averaged 30.6% more per person in Scotland than in the UK as a whole during the same period. However, because current expenditure per person is much higher than capital expenditure, the gap in current spending per person was still greater in cash terms than the gap in capital spending per person (£851 on average, compared with £243, in 2013–14 prices).
Since 2007–08, the gap between current spending per person in Scotland and the UK as a whole has narrowed from 16.2% to 12.5% (it was 14.4% in 2002–03). The gap in capital spending on public services between Scotland and the UK, which had fluctuated between around 30% and 40% in the early to mid-2000s, was much lower between 2008–09 and 2010–11, when it averaged around
52 Figures for mid-2002 for Scotland consistent with the 2011 census are not yet available. The reported 4.8% increase is an estimate by the authors based on adjusting the existing 2001 census-based mid-2002 figures available for Scotland. More information on how we adjust mid-year population estimates between 2002 and 2010 is available from the authors on request.
45 © Institute for Fiscal Studies, 2013
19%.53 However, in 2011–12, an increase in capital spending on public services in Scotland and a further substantial cut for the UK as a whole led to the gap increasing to 48.3%. It is this increase in capital spending per person relative to the UK as a whole that caused the gap in overall public service spending per person to widen in 2011–12 (the gap for current spending narrowed). Our analysis of the Scottish government’s budgets in Section 4.2 suggests that this relatively high level of capital spending is likely to continue in subsequent years.
Changes in spending per person by service area
Whilst spending on public services per person has increased at a broadly similar rate in Scotland and the UK as a whole since 2002–03, this is not the case for individual areas of public services. For instance, the two largest items of public service spending – health and education – saw substantially smaller increases in spending per person in Scotland than in the UK as a whole between 2002–03 and 2011–12. On the other hand, many other service areas that are largely the responsibility of the Scottish government and local government saw larger increases in spending per person than across the UK as a whole. Whilst this may reflect changing relative needs for different services in Scotland, it is also likely to reflect differences in the priorities placed on different service areas.
Figure 9 shows how spending per person on health and education has changed over time in real terms, and how it differs between Scotland and the UK as a whole: spending per person in the UK as a whole in 2002–03 is indexed to 100. This shows that spending on healthcare per person has been consistently higher in Scotland than in the UK as a whole and that, as in the rest of the UK, spending on healthcare per person increased substantially in real terms between 2002–03 and 2011–12. However, the increase was less dramatic in Scotland: 26%, compared with 37% in the UK as a whole. This means that whereas spending per person on healthcare was 118.9% of the UK average in 2002–03, it was only 108.9% of the UK average in 2011–12.
53 Part of this narrowing, for 2008–09 and 2009–10 at least, reflects the impact of the UK government’s financial sector interventions (the ‘bank bailouts’), net expenditure on which is counted as capital spending and is allocated proportionally to population across the UK under the GERS methodology. In 2008–09 and 2009–10, this amounted to £883 million and £415 million in 2013–14 prices in Scotland, increasing capital spending by 14% and 6% respectively. Given lower levels of non-financial-sector capital spending per person elsewhere in the UK, the financial sector interventions increased capital spending by more elsewhere in the UK.
46 © Institute for Fiscal Studies, 2013
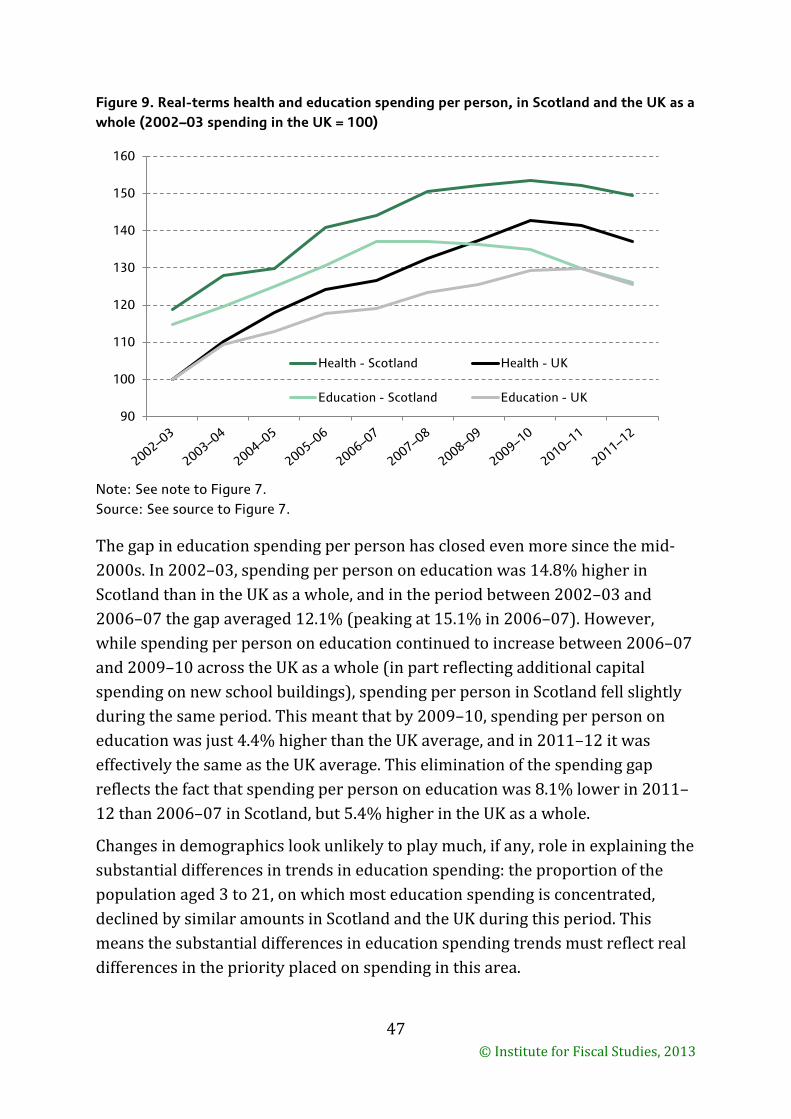
Figure 9. Real-terms health and education spending per person, in Scotland and the UK as a whole (2002–03 spending in the UK = 100)
Note: See note to Figure 7. Source: See source to Figure 7.
The gap in education spending per person has closed even more since the mid-2000s. In 2002–03, spending per person on education was 14.8% higher in Scotland than in the UK as a whole, and in the period between 2002–03 and 2006–07 the gap averaged 12.1% (peaking at 15.1% in 2006–07). However, while spending per person on education continued to increase between 2006–07 and 2009–10 across the UK as a whole (in part reflecting additional capital spending on new school buildings), spending per person in Scotland fell slightly during the same period. This meant that by 2009–10, spending per person on education was just 4.4% higher than the UK average, and in 2011–12 it was effectively the same as the UK average. This elimination of the spending gap reflects the fact that spending per person on education was 8.1% lower in 2011–12 than 2006–07 in Scotland, but 5.4% higher in the UK as a whole.
Changes in demographics look unlikely to play much, if any, role in explaining the substantial differences in trends in education spending: the proportion of the population aged 3 to 21, on which most education spending is concentrated, declined by similar amounts in Scotland and the UK during this period. This means the substantial differences in education spending trends must reflect real differences in the priority placed on spending in this area.
90
100
110
120
130
140
150
160
Health - Scotland Health - UK
Education - Scotland Education - UK
47 © Institute for Fiscal Studies, 2013
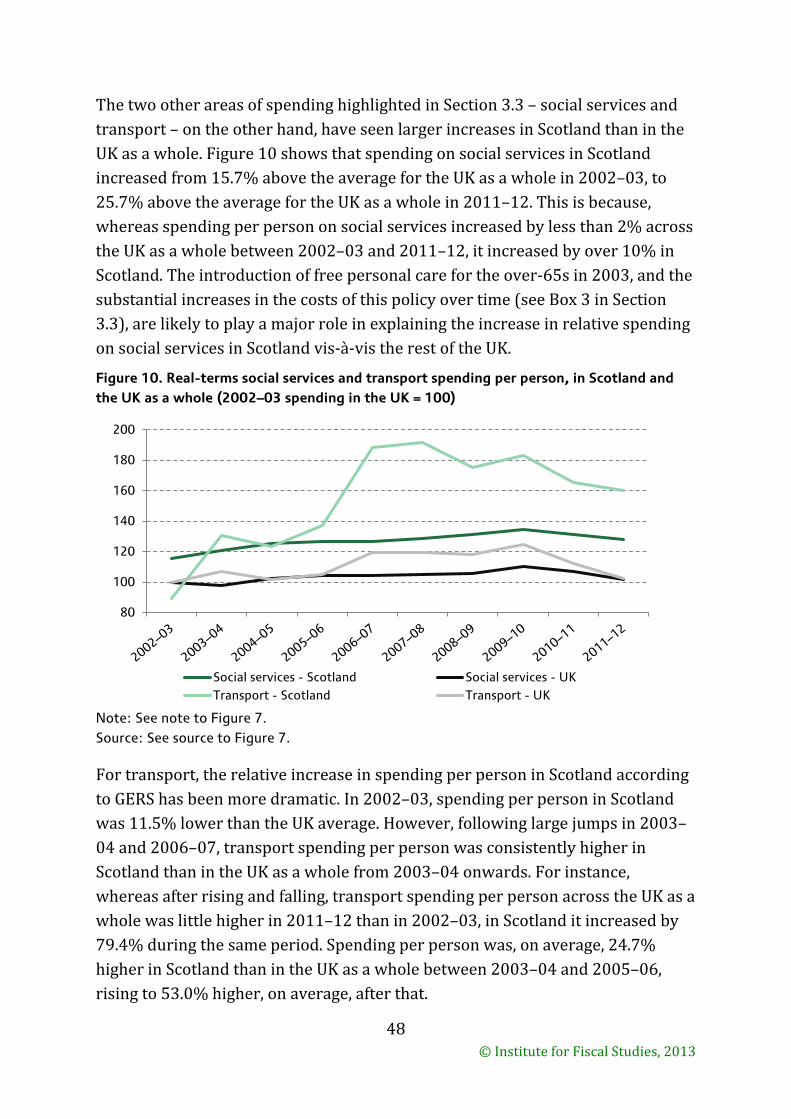
The two other areas of spending highlighted in Section 3.3 – social services and transport – on the other hand, have seen larger increases in Scotland than in the UK as a whole. Figure 10 shows that spending on social services in Scotland increased from 15.7% above the average for the UK as a whole in 2002–03, to 25.7% above the average for the UK as a whole in 2011–12. This is because, whereas spending per person on social services increased by less than 2% across the UK as a whole between 2002–03 and 2011–12, it increased by over 10% in Scotland. The introduction of free personal care for the over-65s in 2003, and the substantial increases in the costs of this policy over time (see Box 3 in Section 3.3), are likely to play a major role in explaining the increase in relative spending on social services in Scotland vis-à-vis the rest of the UK.
Figure 10. Real-terms social services and transport spending per person, in Scotland and the UK as a whole (2002–03 spending in the UK = 100)
Note: See note to Figure 7. Source: See source to Figure 7.
For transport, the relative increase in spending per person in Scotland according to GERS has been more dramatic. In 2002–03, spending per person in Scotland was 11.5% lower than the UK average. However, following large jumps in 2003–04 and 2006–07, transport spending per person was consistently higher in Scotland than in the UK as a whole from 2003–04 onwards. For instance, whereas after rising and falling, transport spending per person across the UK as a whole was little higher in 2011–12 than in 2002–03, in Scotland it increased by 79.4% during the same period. Spending per person was, on average, 24.7% higher in Scotland than in the UK as a whole between 2003–04 and 2005–06, rising to 53.0% higher, on average, after that.
80
100
120
140
160
180
200
Social services - Scotland Social services - UK Transport - Scotland Transport - UK
48 © Institute for Fiscal Studies, 2013
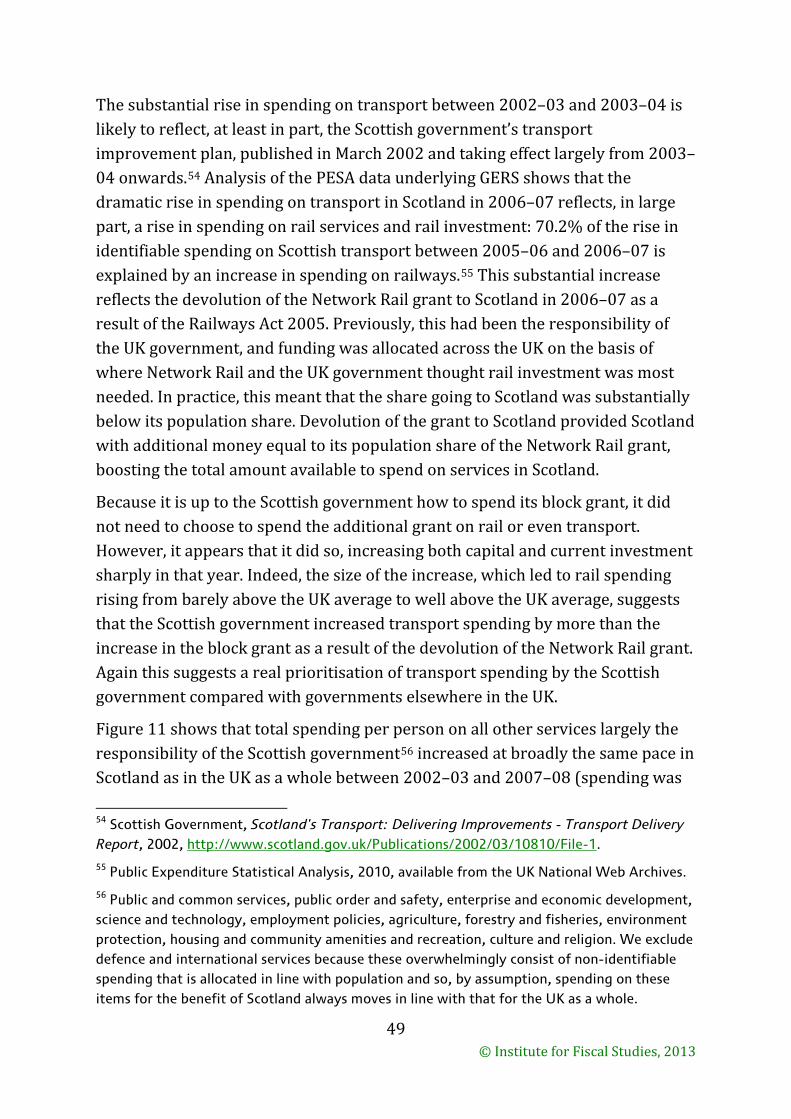
The substantial rise in spending on transport between 2002–03 and 2003–04 is likely to reflect, at least in part, the Scottish government’s transport improvement plan, published in March 2002 and taking effect largely from 2003–04 onwards.54 Analysis of the PESA data underlying GERS shows that the dramatic rise in spending on transport in Scotland in 2006–07 reflects, in large part, a rise in spending on rail services and rail investment: 70.2% of the rise in identifiable spending on Scottish transport between 2005–06 and 2006–07 is explained by an increase in spending on railways.55 This substantial increase reflects the devolution of the Network Rail grant to Scotland in 2006–07 as a result of the Railways Act 2005. Previously, this had been the responsibility of the UK government, and funding was allocated across the UK on the basis of where Network Rail and the UK government thought rail investment was most needed. In practice, this meant that the share going to Scotland was substantially below its population share. Devolution of the grant to Scotland provided Scotland with additional money equal to its population share of the Network Rail grant, boosting the total amount available to spend on services in Scotland.
Because it is up to the Scottish government how to spend its block grant, it did not need to choose to spend the additional grant on rail or even transport. However, it appears that it did so, increasing both capital and current investment sharply in that year. Indeed, the size of the increase, which led to rail spending rising from barely above the UK average to well above the UK average, suggests that the Scottish government increased transport spending by more than the increase in the block grant as a result of the devolution of the Network Rail grant. Again this suggests a real prioritisation of transport spending by the Scottish government compared with governments elsewhere in the UK.
Figure 11 shows that total spending per person on all other services largely the responsibility of the Scottish government56 increased at broadly the same pace in Scotland as in the UK as a whole between 2002–03 and 2007–08 (spending was
54 Scottish Government, Scotland's Transport: Delivering Improvements - Transport Delivery Report, 2002, http://www.scotland.gov.uk/Publications/2002/03/10810/File-1.
55 Public Expenditure Statistical Analysis, 2010, available from the UK National Web Archives.
56 Public and common services, public order and safety, enterprise and economic development, science and technology, employment policies, agriculture, forestry and fisheries, environment protection, housing and community amenities and recreation, culture and religion. We exclude defence and international services because these overwhelmingly consist of non-identifiable spending that is allocated in line with population and so, by assumption, spending on these items for the benefit of Scotland always moves in line with that for the UK as a whole.
49 © Institute for Fiscal Studies, 2013
higher in Scotland throughout this period, but the gap remained fairly similar during these six years). The gap narrowed a little in 2008–09, in large part reflecting the increased capital spending associated with the late 2000s recession (both the financial sector interventions, and discretionary increases in investment in ‘shovel ready’ projects), which provided a larger proportional boost to spending in the UK as a whole than in Scotland.
Figure 11. Real-terms spending on other services (excluding defence and international services) per person, in Scotland and the UK as a whole (2002–03 spending in the UK = 100)
Note: See note to Figure 7. Source: See source to Figure 7.
However, between 2009–10 and 2011–12, the gap widened substantially: it reached 38.3% in 2011–12, compared with 23.5% in 2009–10.57 This is because although spending on other services fell by around 11% per person during these two years in Scotland, it fell by 21% per person across the UK as a whole. This suggests that when making spending cuts, the Scottish government (which is responsible for most spending in these areas) placed somewhat more priority on these other services, relative to governments in the rest of the UK. However, the smaller overall cuts to public service spending per person in Scotland (6.6%) compared with the UK as a whole (8.9%) between 2009–10 and 2011–12 mean that the relatively small cuts to ‘other services’ did not result in areas such as health and social services facing cuts larger than the UK average during these two
57 And an average of 27.2% between 2002–03 and 2007–08.
80
100
120
140
160
180
Scotland UK
50 © Institute for Fiscal Studies, 2013
years. Indeed, cuts to spending per person on health (2.6% compared with 3.9%), social services (5.0% compared with 8.0%) and transport (12.4% versus 17.7%) were also smaller in Scotland than across the UK as a whole. It is only for education that the cuts between 2009–10 and 2011–12 were larger for Scotland than for the UK as a whole (6.6% versus 2.8%).
The next subsection explores in more detail the cuts made by the Scottish government as part of the UK-wide fiscal consolidation, and how these compare to those made by the Welsh government, and the UK government.
4.2 How has the Scottish government cut spending since 2010–11?
Although UK-wide spending on public services fell between 2009–10 and 2010–11, a substantial part of these reductions reflected the end of temporarily higher capital spending, with most of the rest taking the form of the ‘in-year’ cuts announced by the incoming UK coalition government in May 2010. Larger cuts to public service spending were announced in the October 2010 Spending Review, with reductions initially planned every year for four years from 2011–12 to 2014–15. However, continuing economic weakness led the OBR to increase the estimated size of fiscal consolidation required, and the UK government has responded by setting out plans for further cuts to public service spending in 2015–16 (set out in the July 2013 Spending Round) and pencilling in further cuts in 2016–17 and 2017–18. As part of these planned cuts, the block grant provided to the Scottish government has been reduced in real terms, and the Scottish government has therefore had to reduce the amount it spends and decide how to spread the necessary cuts across different service areas.
Table 8 shows the Scottish government’s total budget in 2010–11 (the year before the main series of cuts began) and the current financial year (2013–14), and the draft plans set out for 2015–16 (all in 2013–14 prices). For 2010–11, figures for both initially budgeted expenditure and expenditure out-turns are reported. The table also breaks budgeted expenditure down into the amount accounted for by current and capital departmental expenditure limits (DEL) – which are the main departmental budgets – and the anticipated levels of annually managed expenditure (AME) – which covers items that cannot be planned in advance, such as business rates revenue funding for local government (the amount of business rates revenue that will be raised is not known in advance) or pension payments to retired teachers and nurses (the cost of providing pensions fluctuates depending on the number of pensioners and the performance of pension fund assets).
51 © Institute for Fiscal Studies, 2013
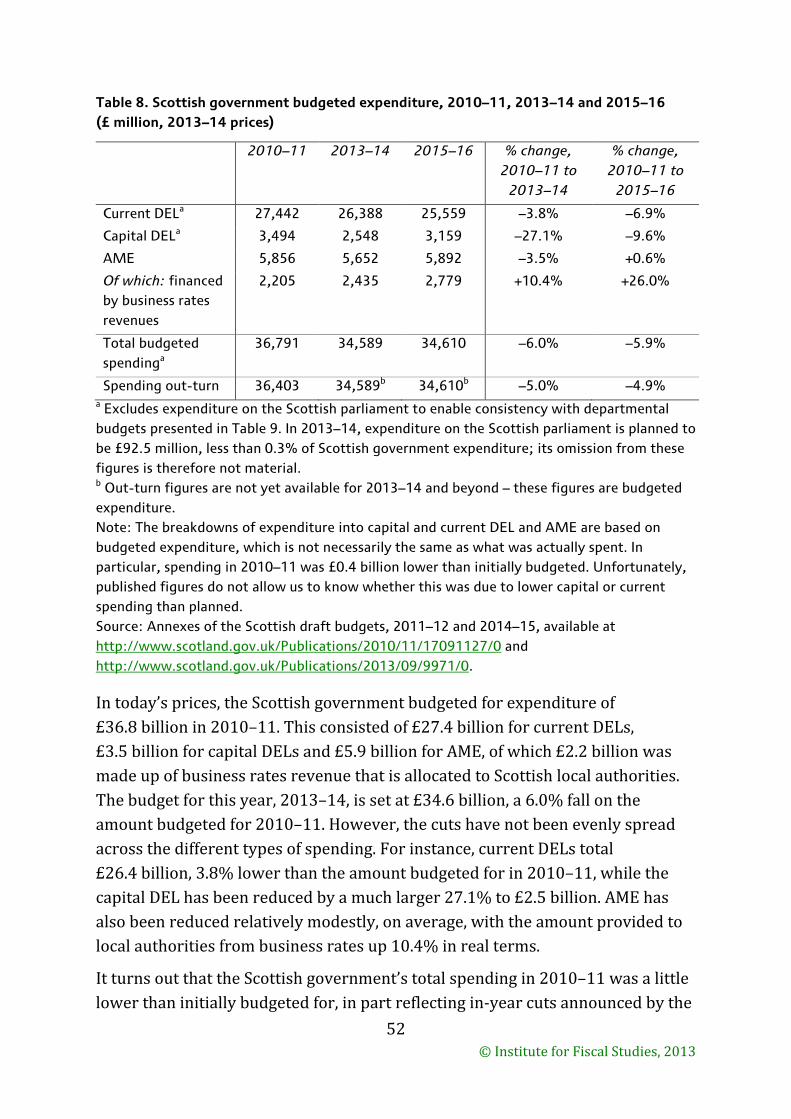
Table 8. Scottish government budgeted expenditure, 2010–11, 2013–14 and 2015–16 (£ million, 2013–14 prices)
2010–11 2013–14 2015–16 % change, 2010–11 to
2013–14
% change, 2010–11 to
2015–16
Current DELa 27,442 26,388 25,559 –3.8% –6.9%
Capital DELa 3,494 2,548 3,159 –27.1% –9.6%
AME 5,856 5,652 5,892 –3.5% +0.6%
Of which: financed by business rates revenues
2,205 2,435 2,779 +10.4% +26.0%
Total budgeted spendinga
36,791 34,589 34,610 –6.0% –5.9%
Spending out-turn 36,403 34,589b 34,610b –5.0% –4.9% a Excludes expenditure on the Scottish parliament to enable consistency with departmental budgets presented in Table 9. In 2013–14, expenditure on the Scottish parliament is planned to be £92.5 million, less than 0.3% of Scottish government expenditure; its omission from these figures is therefore not material. b Out-turn figures are not yet available for 2013–14 and beyond – these figures are budgeted expenditure. Note: The breakdowns of expenditure into capital and current DEL and AME are based on budgeted expenditure, which is not necessarily the same as what was actually spent. In particular, spending in 2010–11 was £0.4 billion lower than initially budgeted. Unfortunately, published figures do not allow us to know whether this was due to lower capital or current spending than planned. Source: Annexes of the Scottish draft budgets, 2011–12 and 2014–15, available at http://www.scotland.gov.uk/Publications/2010/11/17091127/0 and http://www.scotland.gov.uk/Publications/2013/09/9971/0.
In today’s prices, the Scottish government budgeted for expenditure of £36.8 billion in 2010–11. This consisted of £27.4 billion for current DELs, £3.5 billion for capital DELs and £5.9 billion for AME, of which £2.2 billion was made up of business rates revenue that is allocated to Scottish local authorities. The budget for this year, 2013–14, is set at £34.6 billion, a 6.0% fall on the amount budgeted for 2010–11. However, the cuts have not been evenly spread across the different types of spending. For instance, current DELs total £26.4 billion, 3.8% lower than the amount budgeted for in 2010–11, while the capital DEL has been reduced by a much larger 27.1% to £2.5 billion. AME has also been reduced relatively modestly, on average, with the amount provided to local authorities from business rates up 10.4% in real terms.
It turns out that the Scottish government’s total spending in 2010–11 was a little lower than initially budgeted for, in part reflecting in-year cuts announced by the
52 © Institute for Fiscal Studies, 2013
incoming UK coalition government, as well as a small underspend by the Scottish government. Unfortunately, expenditure out-turns broken down into capital and current DELs on a consistent basis are not published for Scotland, meaning we cannot be certain about how much was actually spent via current and capital DELs in 2010–11 – and therefore cannot be certain of the actual reduction in capital and current spending by 2013–14 (as opposed to the reduction compared with what was planned to be spent). However, even assuming that the entire difference between budgeted and actual spending in 2010–11 was due to lower-than-planned capital spending, the Scottish government’s capital budget would still have been cut by proportionally much more (17.9%) than its current budget (3.8%) in the last three years.
Looking at the budgets for each year between 2010–11 and 2013–14 shows that most of the reduction in the Scottish government’s capital spending was planned to have taken place between 2010–11 and 2011–12. The budgets for 2010–11 and 2011–12 show a fall of 22.6%, and even assuming the entire difference between budgeted and actual spending in 2010–11 was due to lower-than-planned capital spending, the fall would have been 12.9%. This fall stands in stark contrast to the small increase in capital spending by the Scottish and local government between 2010–11 and 2011–12 recorded in GERS (see Figure 8 in Section 4.1). One explanation for this difference seems to be capital investment by local authorities. Scottish local government financial statistics show a real-terms increase in capital spending by local government of 13.5% from just under £2.3 billion in 2010–11 to just under £2.6 billion in 2011–12 in today’s prices, although in addition to greater borrowing, a large part of this increase seems to have been due to higher grants for capital spending from the Scottish government (which one might have expected to fall given the reductions in the Scottish government’s capital DEL).58 Differences in definitions between GERS and the Scottish government budget may also play some role in explaining the differences.
In order to examine how the Scottish government has allocated the overall cuts to its budget across services, Table 9 shows the amounts allocated to each department in 2010–11 and 2013–14 and the plans for 2015–16 (all in 2013–14 prices), and the real-terms changes over the last three years and planned for the
58 Scottish Local Government Financial Statistics 2011–12, capital expenditure and financing tables, available at http://www.scotland.gov.uk/Publications/2013/02/4659/4#c3.1.
53 © Institute for Fiscal Studies, 2013
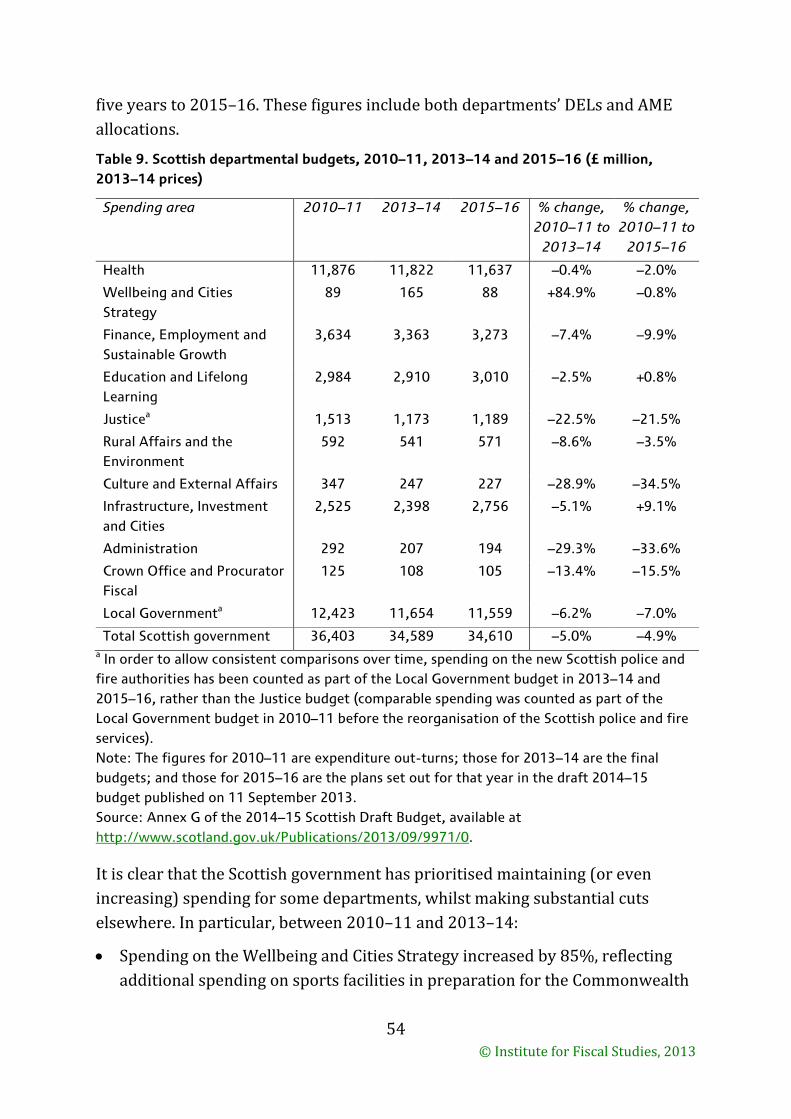
five years to 2015–16. These figures include both departments’ DELs and AME allocations.
Table 9. Scottish departmental budgets, 2010–11, 2013–14 and 2015–16 (£ million, 2013–14 prices)
Spending area 2010–11 2013–14 2015–16 % change, 2010–11 to
2013–14
% change, 2010–11 to
2015–16
Health 11,876 11,822 11,637 –0.4% –2.0%
Wellbeing and Cities Strategy
89 165 88 +84.9% –0.8%
Finance, Employment and Sustainable Growth
3,634 3,363 3,273 –7.4% –9.9%
Education and Lifelong Learning
2,984 2,910 3,010 –2.5% +0.8%
Justicea 1,513 1,173 1,189 –22.5% –21.5%
Rural Affairs and the Environment
592 541 571 –8.6% –3.5%
Culture and External Affairs 347 247 227 –28.9% –34.5%
Infrastructure, Investment and Cities
2,525 2,398 2,756 –5.1% +9.1%
Administration 292 207 194 –29.3% –33.6%
Crown Office and Procurator Fiscal
125 108 105 –13.4% –15.5%
Local Governmenta 12,423 11,654 11,559 –6.2% –7.0%
Total Scottish government 36,403 34,589 34,610 –5.0% –4.9% a In order to allow consistent comparisons over time, spending on the new Scottish police and fire authorities has been counted as part of the Local Government budget in 2013–14 and 2015–16, rather than the Justice budget (comparable spending was counted as part of the Local Government budget in 2010–11 before the reorganisation of the Scottish police and fire services). Note: The figures for 2010–11 are expenditure out-turns; those for 2013–14 are the final budgets; and those for 2015–16 are the plans set out for that year in the draft 2014–15 budget published on 11 September 2013. Source: Annex G of the 2014–15 Scottish Draft Budget, available at http://www.scotland.gov.uk/Publications/2013/09/9971/0.
It is clear that the Scottish government has prioritised maintaining (or even increasing) spending for some departments, whilst making substantial cuts elsewhere. In particular, between 2010–11 and 2013–14:
• Spending on the Wellbeing and Cities Strategy increased by 85%, reflecting additional spending on sports facilities in preparation for the Commonwealth
54 © Institute for Fiscal Studies, 2013
Games in Glasgow in 2014. However, this still represents only a very small fraction (less than 0.5%) of the Scottish government’s overall budget.
• Healthcare spending was prioritised, being just 0.4% lower in 2013–14 than in 2010–11. Spending on Education and Lifelong Learning was also reduced by much less than average (2.5% compared with 5.0%), although this reflects increases in the costs of student loans and maintenance, meaning that funding for other services, such as further and higher education, has fared much less well (budgeted expenditure on further and higher education was 14.7% lower in 2013–14 than in 2010–11, for instance).
• The budget for the Infrastructure, Investment and Cities portfolio, which largely consists of funding for transport, housing and regeneration, has been reduced by 5.1%, very similar to the 5.0% reduction in the Scottish government’s overall budget. This is perhaps surprising given that this department is capital intensive (capital spending makes up almost half of its DEL in 2013–14) and that capital spending has been cut by substantially more than current spending. This suggests that the Scottish government has prioritised investments in transport, housing and regeneration over investment spending in other areas (such as education).
• The Local Government portfolio, on the other hand, has seen a reduction in its funding of 6.2%, slightly larger than the average reduction of 5.0%.
• The areas of spending that have seen the largest cuts include Justice (22.5%) and Culture and External Affairs (28.9%), suggesting lower priority has been placed on these services than others. There have also been relatively large cuts to the Administration budget (29.3%) and the budget of the Crown Office and Procurator Fiscal (13.4%), suggesting that the Scottish government has been looking to reduce the costs of government in order to limit the size of cuts to high-priority services.
In aggregate, real-terms spending is set to increase very slightly between 2013–14 and 2015–16, but within this there are still substantial differences in the budgeted change in spending across different services:
• After the Commonwealth Games, spending on the Wellbeing and Cities Strategy is set to return to more normal levels and is planned to be 0.8% lower in real terms in 2015–16 than it was in 2010–11.
• Health spending is set to be reduced a little more quickly in the next two years than it has been so far, leaving it 2.0% lower in 2015–16 than in 2010–11.
55 © Institute for Fiscal Studies, 2013
This reflects the fact that health spending largely consists of current spending (which is being cut further in the next two years) rather than capital spending (which is being increased).
• The pace of spending cuts to Local Government is planned to moderate, and it will fall a further 0.8% to 7.0% below its 2010–11 level by 2015–16. This moderation may reflect the strong anticipated growth in business rates revenues over the next two years.
• Increased capital investment is set to boost the budget of the Infrastructure, Investment and Cities portfolio from just under £2.40 billion in 2013–14 to £2.76 billion in 2015–16, which will leave it 9% above its level in 2010–11. This reflects, to a large extent, planned increases in investment in social housing.
• Spending on the Education and Lifelong Learning portfolio is also planned to be (slightly) above its 2010–11 level in 2015–16 in real terms. However, this is the result of further anticipated increases in the net costs of student support, with spending on other services facing further real-terms reductions. Other spending on further and higher education, for instance, is planned to be 17.1% below its 2010–11 level (and 2.7% below current levels) in 2015–16.
• Further planned cuts in spending on Culture and External Affairs and on Administration will leave the budgets for these portfolios more than one-third lower in 2015–16 than in 2010–11.
Taken together, these figures clearly show that the Scottish government has prioritised spending in certain areas (such as Health, Infrastructure, Investment and Cities, and the student-support element of the Education and Lifelong Learning portfolio), by making larger cuts to other services (most notably Administration, Culture and External Affairs, Justice and, to an extent, Local Government). How does this prioritisation of different service areas compare with decisions made elsewhere in the UK?
Comparisons with Welsh and UK government spending decisions
It is not straightforward to compare the spending allocations made by the Scottish government with those made by governments elsewhere in the UK. This is because departmental structures differ substantially meaning it is difficult to compare like-for-like spending. The fact that Whitehall departments that are largely responsible for services in England also sometimes cover some functions for other parts of the UK too, also makes comparisons somewhat tricky.
56 © Institute for Fiscal Studies, 2013
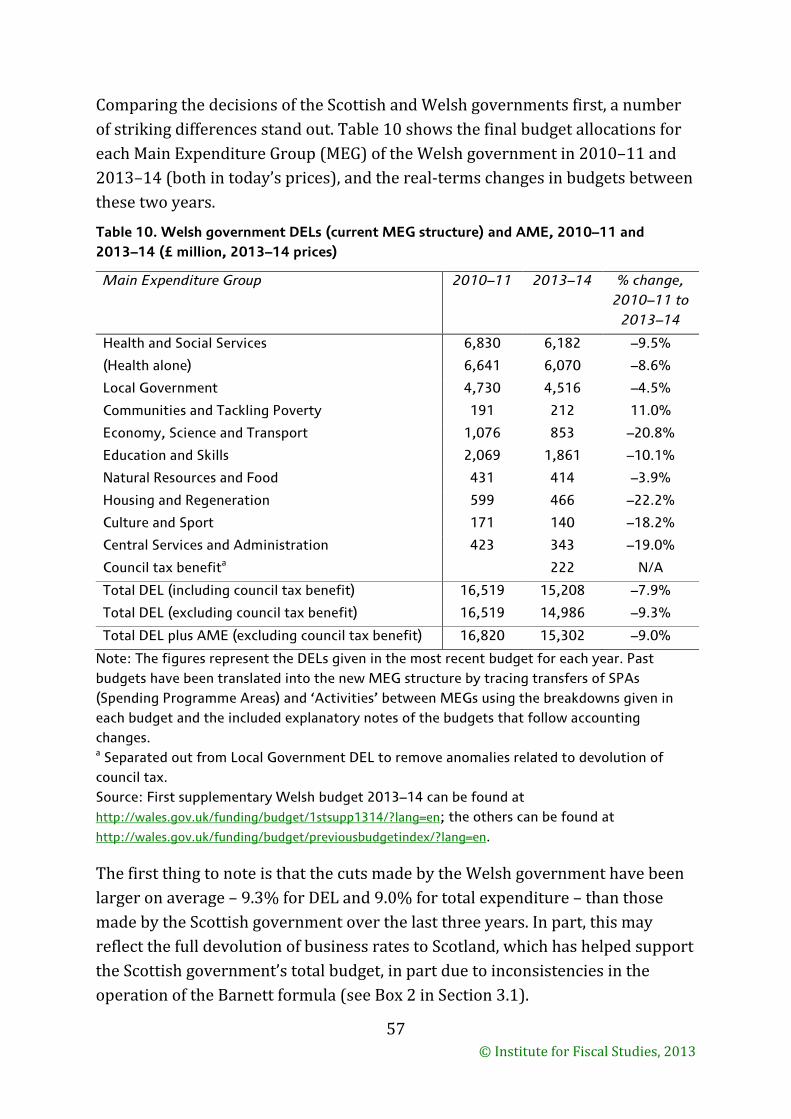
Comparing the decisions of the Scottish and Welsh governments first, a number of striking differences stand out. Table 10 shows the final budget allocations for each Main Expenditure Group (MEG) of the Welsh government in 2010–11 and 2013–14 (both in today’s prices), and the real-terms changes in budgets between these two years.
Table 10. Welsh government DELs (current MEG structure) and AME, 2010–11 and 2013–14 (£ million, 2013–14 prices)
Main Expenditure Group 2010–11 2013–14 % change, 2010–11 to
2013–14
Health and Social Services 6,830 6,182 –9.5%
(Health alone) 6,641 6,070 –8.6%
Local Government 4,730 4,516 –4.5%
Communities and Tackling Poverty 191 212 11.0%
Economy, Science and Transport 1,076 853 –20.8%
Education and Skills 2,069 1,861 –10.1%
Natural Resources and Food 431 414 –3.9%
Housing and Regeneration 599 466 –22.2%
Culture and Sport 171 140 –18.2%
Central Services and Administration 423 343 –19.0%
Council tax benefita 222 N/A
Total DEL (including council tax benefit) 16,519 15,208 –7.9%
Total DEL (excluding council tax benefit) 16,519 14,986 –9.3%
Total DEL plus AME (excluding council tax benefit) 16,820 15,302 –9.0%
Note: The figures represent the DELs given in the most recent budget for each year. Past budgets have been translated into the new MEG structure by tracing transfers of SPAs (Spending Programme Areas) and ‘Activities’ between MEGs using the breakdowns given in each budget and the included explanatory notes of the budgets that follow accounting changes. a Separated out from Local Government DEL to remove anomalies related to devolution of council tax. Source: First supplementary Welsh budget 2013–14 can be found at http://wales.gov.uk/funding/budget/1stsupp1314/?lang=en; the others can be found at http://wales.gov.uk/funding/budget/previousbudgetindex/?lang=en.
The first thing to note is that the cuts made by the Welsh government have been larger on average – 9.3% for DEL and 9.0% for total expenditure – than those made by the Scottish government over the last three years. In part, this may reflect the full devolution of business rates to Scotland, which has helped support the Scottish government’s total budget, in part due to inconsistencies in the operation of the Barnett formula (see Box 2 in Section 3.1).
57 © Institute for Fiscal Studies, 2013
The most striking point of difference between the spending decisions made by the Scottish and Welsh governments over the period of the cuts has been the different prioritisations of Health and Local Government expenditure. Whereas Health spending was reduced by only 0.4% in Scotland during this period, in Wales the reduction was a much larger 8.6%, which is broadly in line with the overall reduction in the Welsh government’s budget. On the other hand, while the Scottish Local Government portfolio saw a slightly larger-than-average cut between 2010–11 and 2013–14, in Wales the cut was substantially smaller than average, at only 4.5%. Although this figure may reflect, in part, the rolling-in of funds formerly provided by specific grants into the main Welsh local government settlement, it is clear that the prioritisation of Health vis-à-vis Local Government has differed substantially between Scotland and Wales over the last three years.
As discussed above, despite Infrastructure, Investment and Cities being a capital-intensive area, spending in Scotland was reduced by an amount close to the average for all services between 2010–11 and 2013–14. In Wales, however, the Economy, Science and Transport and the Housing and Regeneration MEGs saw substantially larger-than-average cuts. This may reflect, in part, the fact that Wales has had to make substantially larger cuts to capital spending than Scotland during this period (34%, compared with between 18% and 27%), necessitating larger cuts to capital-intensive service areas. However, it also suggests some difference in the priority placed on capital spending on transport, housing and regeneration compared with other capital spending. Indeed, even based on the planned budget for 2010–11 (which was likely subsequently cut), capital spending on these areas was cut by just 20% in Scotland (compared with an average cut of 27%), whilst in Wales the cut was around 30%, compared with an average cut of 34%).
However, there are some similarities in decisions. The DEL for the Welsh government’s Education and Skills MEG, which funds a similar set of services to Scotland’s Education and Lifelong Learning portfolio, has been reduced by a little over 10%. Adding in AME for this MEG, which funds student support, reduces the size of the fall to 7%, a bit less than the overall cut in the Welsh government’s budget. This means that one similarity between the cuts in Wales and Scotland is larger-than-average cuts to spending on further and higher education institutions, but increases in spending on student support. Another similarity is the larger-than-average cuts to areas such as administration and culture.
Turning to comparisons with the decisions of the UK government, Table 11 shows budget allocations for selected UK government departments in 2010–11,
58 © Institute for Fiscal Studies, 2013
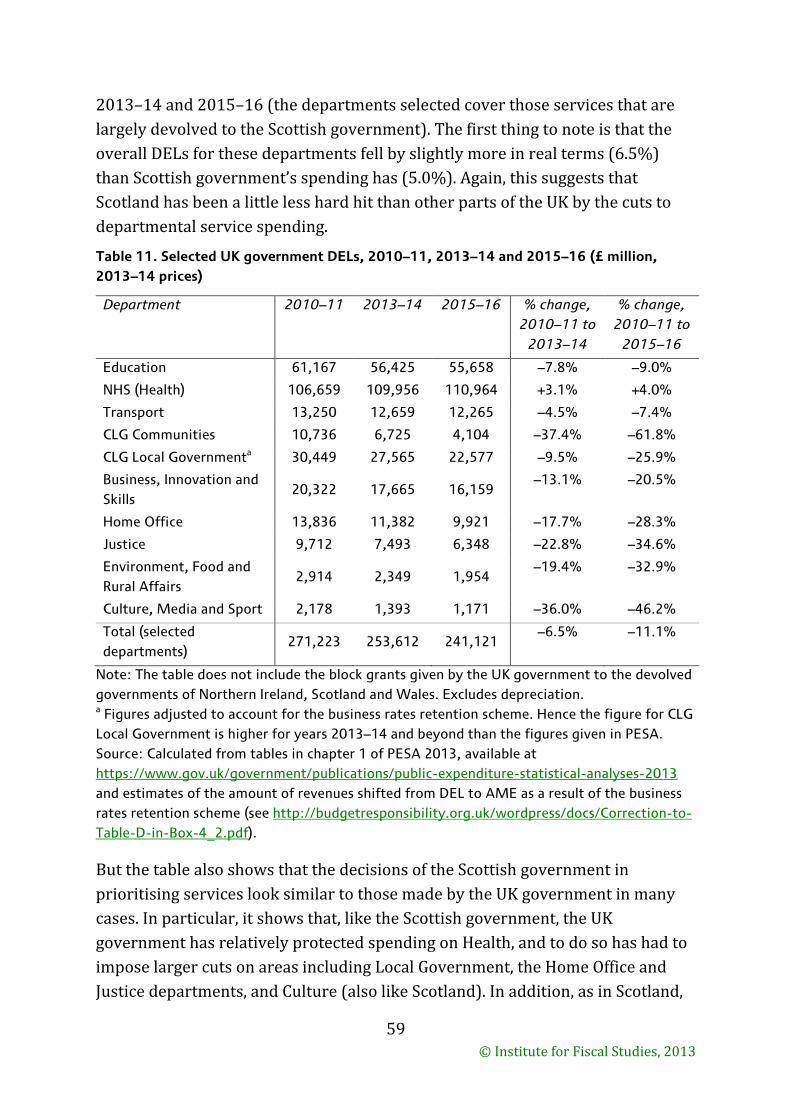
2013–14 and 2015–16 (the departments selected cover those services that are largely devolved to the Scottish government). The first thing to note is that the overall DELs for these departments fell by slightly more in real terms (6.5%) than Scottish government’s spending has (5.0%). Again, this suggests that Scotland has been a little less hard hit than other parts of the UK by the cuts to departmental service spending.
Table 11. Selected UK government DELs, 2010–11, 2013–14 and 2015–16 (£ million, 2013–14 prices)
Department 2010–11 2013–14 2015–16 % change, 2010–11 to
2013–14
% change, 2010–11 to
2015–16
Education 61,167 56,425 55,658 –7.8% –9.0%
NHS (Health) 106,659 109,956 110,964 +3.1% +4.0%
Transport 13,250 12,659 12,265 –4.5% –7.4%
CLG Communities 10,736 6,725 4,104 –37.4% –61.8%
CLG Local Governmenta 30,449 27,565 22,577 –9.5% –25.9%
Business, Innovation and Skills
20,322 17,665 16,159 –13.1% –20.5%
Home Office 13,836 11,382 9,921 –17.7% –28.3%
Justice 9,712 7,493 6,348 –22.8% –34.6%
Environment, Food and Rural Affairs
2,914 2,349 1,954 –19.4% –32.9%
Culture, Media and Sport 2,178 1,393 1,171 –36.0% –46.2%
Total (selected departments)
271,223 253,612 241,121 –6.5% –11.1%
Note: The table does not include the block grants given by the UK government to the devolved governments of Northern Ireland, Scotland and Wales. Excludes depreciation. a Figures adjusted to account for the business rates retention scheme. Hence the figure for CLG Local Government is higher for years 2013–14 and beyond than the figures given in PESA. Source: Calculated from tables in chapter 1 of PESA 2013, available at https://www.gov.uk/government/publications/public-expenditure-statistical-analyses-2013 and estimates of the amount of revenues shifted from DEL to AME as a result of the business rates retention scheme (see http://budgetresponsibility.org.uk/wordpress/docs/Correction-to-Table-D-in-Box-4_2.pdf).
But the table also shows that the decisions of the Scottish government in prioritising services look similar to those made by the UK government in many cases. In particular, it shows that, like the Scottish government, the UK government has relatively protected spending on Health, and to do so has had to impose larger cuts on areas including Local Government, the Home Office and Justice departments, and Culture (also like Scotland). In addition, as in Scotland,
59 © Institute for Fiscal Studies, 2013
spending on transport has been relatively protected by the UK government despite being capital intensive. But one point of distinction is the relatively large cuts to spending on the Communities budget, which funds housing and regeneration in England: this has been reduced by 37% since 2010–11, whereas in Scotland spending on these areas has been relatively protected as part of the Infrastructure, Investment and Cities portfolio.
Looking ahead to 2015–16, the biggest difference between the plans set out by the Scottish government and by the UK government is that the Scottish government is planning to increase spending slightly in real terms, while the UK government is planning to cut spending by a further 4.9% (for these selected departments, on average). What can explain such a dramatic difference, given that the Scottish government is largely funded via a block grant from the UK Treasury?
First, the reduction in the Treasury’s block grant to Scotland is just 2.5% in real terms between now and 2015–16, around half the reduction planned for spending by departments delivering broadly similar services in England. This relatively small reduction in the block grant is likely due, at least in part, to the relatively generous way the Barnett formula deals with cuts to the CLG Local Government budget in the case of Scotland because of inconsistencies in the way it treats business rates revenues (see Box 2 in Section 3.1). Second, the Scottish government itself is predicting a substantial increase in spending funded by business rates revenues in Scotland (see Table 8), which just-more-than offsets planned reductions in its other spending. Together, these explain, at least in part, the differences in trends in planned spending over the next two years by the Scottish government and the UK government.59
However, the priorities placed on different services by the UK government over the next two years look to be very similar to those over the last three years, with further protection for the NHS, Education and Transport, and further substantial cuts to other budgets.
59 Although it is notable that the planned real-terms reduction in the Scottish government’s DEL (0.8%), which excludes spending funded by business rates revenue and other AME, is smaller than the reduction in the block grant (2.5%). The reasons for this difference are not clear.
60 © Institute for Fiscal Studies, 2013
Summarising the trends in spending since 2002–03
The analysis of this section shows clearly that the Scottish government has used its discretion in setting the budgets for different service areas to make different decisions from governments elsewhere in the UK. In particular, between 2002–03 and 2011–12, the somewhat lower priority given to increases in health and education spending in Scotland compared with the UK as a whole means that the gap in health spending per person was substantially narrowed and the gap in education spending per person was virtually eliminated. On the other hand, greater priority was placed on increasing spending on social services, transport and many other services, substantially widening the gap in spending per person on these areas. In the case of social services, this reflects the growing costs of a distinctly more generous policy for personal care for the elderly. And in the case of transport, it partly reflects the fact that the devolution of the Network Rail grant allowed substantial increases in investment in rail services in Scotland (previously, Scotland had received substantially less than a population-based share of Network Rail spending).
However, the cuts required since 2010–11 have been delivered similarly to those made by the UK government for England, with the exception of the decision to cut spending on housing and regeneration by much less than the UK government has. This stands in contrast to the Welsh government, which decided to cut health spending substantially in order to allow for relatively smaller cuts to local government spending.
However, as shown by the experience between 2002–03 and 2011–12, the Scottish government could, in future, decide to prioritise spending on different services in a way that substantially differs from the priorities of the UK government for England. If Scotland were to become independent in 2016 following a ‘yes’ vote in September 2014, its new government would also have the opportunity to reassess spending on services such as defence and international affairs that are currently the responsibility of the UK government. In the next section, we discuss the areas where the government of an independent Scotland may want, or may face pressures, to spend a different amount from what is presently spent in or on behalf of Scotland as part of the UK.
5. Issues for public service spending in an independent Scotland
Under current constitutional arrangements, the Scottish government determines how much is spent on most public services, with the major exceptions being
61 © Institute for Fiscal Studies, 2013
defence and international affairs. Although funded largely via a block grant from the UK Treasury, the Scottish government does more than divide up the pie: its control of local taxation (council tax and business rates) and its ability to vary the basic rate of income tax by 3p in the pound means it can also change the overall level of spending on devolved services.60 While the Scottish government has not made use of its powers to vary income tax, it has frozen council tax at 2007–08 levels, which has reduced spending on devolved services from what it otherwise would have been.
Independence would give Scotland fuller control over how much is spent on currently devolved services (because the government of an independent Scotland would have more control of taxation and borrowing61), in addition to control over those areas not currently devolved. In this section, we use comparisons of the current levels of spending in Scotland with those of other countries and the rest of the UK to look at some areas where the government of an independent Scotland might choose to spend less and where there may be pressures to spend more than is currently the case. We do this both for those areas that are currently the responsibility of the UK government and those that are already the responsibility of the Scottish government. We then set this against the fiscal situation Scotland may inherit at independence in 2016.
5.1 Spending by service area – how might it change?
An independent Scotland would have greater choice over how much to spend on different public services. It could, for instance, cut spending in some areas to spend more elsewhere, or instead cut taxes or strengthen its fiscal position. But it may also face pressure to spend more in certain areas as a result of independence. In the short term, this could include transitional costs associated with the reorganisation of services and setting up of new institutions required for an independent country. Unfortunately, there is little evidence about the likely magnitude of these costs.
60 And under the Scotland Act, further powers over income tax, stamp duty land tax, and a number of smaller taxes have been devolved to Scotland with effect from April 2015 onwards.
61 It would not have full control, however. Membership of the EU entails abiding by certain rules on VAT, for instance, and, in principle, adoption of the Euro, which comes with restrictions on borrowing. And, as pointed out in recent research by NIESR, an independent Scotland will likely face pressure to run a tighter fiscal policy than is the case for the UK (National Institute of Economic and Social Research, Scotland’s Currency Options, 2013. The main report is to be published on 19 September but the executive summary is available at http://niesr.ac.uk/sites/default/files/files/Exec%20sum_final.pdf.)
62 © Institute for Fiscal Studies, 2013
More important, though, is whether an independent Scotland would face higher longer-term costs in providing certain services. One issue that might lead one to expect it could in some instances is the potential loss of economies of scale in a smaller nation. For instance, the presence of fixed costs may mean that the cost of delivering and maintaining an IT system that can handle 5 million records is not one-twelfth of the cost of one that can handle 60 million records. Similarly, the process of designing and administering tax and benefit systems and public services for 5 million people will likely require more than one-twelfth of the resources of doing so for 60 million people. Also, providing the same number of embassies offering the same services is not likely to be feasible on one-twelfth of the budget simply because the embassies represent one-twelfth the number of people.
Statistics on public spending are not broken down in a way that allows one to easily identify whether such economies of scale (or, indeed, the reverse dis-economies of scale) are important or not. For instance, figures are not broken down into the costs of front-line service provision and the costs of administration (where one might expect relevant scale economies to mainly be) on a comparable basis in different countries. But there is some suggestive evidence that scale economies are relatively unimportant, at least when comparing states the sizes of Scotland and the UK.
For instance, Eurostat publishes information on the proportion of GDP spent by each member state (and some non-members) on ‘executive and legislative organs, financial and fiscal affairs, and external affairs’, which covers a number of areas where one may expect scale economies to be most important.62 This shows that there was substantial variation in the amount spent by different countries on these functions in 2011. The UK is estimated to have spent 1.3% of GDP, the joint lowest proportion of GDP along with France and Iceland. Smaller European countries, such as Denmark (2.3% of GDP), Ireland (1.6%), Greece (1.8%), Austria (2.5%), Finland (1.6%) and Norway (1.7%), tended to spend a slightly-to-substantially higher proportion of their GDP on such services. However, other large member states also spent more, with Germany spending 1.6% of GDP on these services, Poland 2.6% and Italy 2.5%. This means that there is little evidence that it is economies of scale that drive the differences between the UK and smaller European countries, although the UK’s existing low levels of
62 Eurostat statistics on general government expenditure by function (COFOG), available at http://epp.eurostat.ec.europa.eu/portal/page/portal/statistics/search_database.
63 © Institute for Fiscal Studies, 2013
spending do suggest that the scope for Scotland to cut spending here may be relatively limited. Analysis of the fraction of tax collected taken up in collection and administration costs likewise shows significant variation but little evidence for scale economies.63 However, a number of other European countries, including smaller ones such as Ireland, Denmark, Norway and Sweden, do spend a smaller fraction of revenues on such costs than the UK does. This means there may actually be scope for reductions in the costs of tax collection, especially if an independent Scotland were to move towards a simpler tax system that limited the opportunities for evasion and avoidance.
Fortunately, there is more information about the amount spent on different service areas such as defence, foreign aid, health and education, which can be used to analyse where Scotland may be able to spend more or less as an independent nation.
Areas currently the responsibility of the UK government
Two key areas currently the responsibility of the UK government that independence would give the Scottish government responsibility for are defence and overseas direct aid. In both cases, the UK is presently a relatively high spender by international standards, which suggests there may be scope for reductions in spending in these areas if the government of an independent Scotland so wished.
Table 12 shows defence spending measured as a percentage of GDP for the UK, Scotland (when allocated either a per-person or a geographical share of North Sea output) and a selection of small advanced economies using data from the World Bank and GERS 2011–12. It shows that, at 2.6% of GDP, defence spending by the UK government is around double the average for our selection of small advanced economies. This does not reflect higher overall government spending in the UK: defence spending also takes up a substantially larger fraction of overall government spending than the average. Allocated a population share of UK defence spending under the GERS methodology, defence spending in Scotland in 2011–12 is estimated to have been 2.6% of GDP when giving Scotland a per-person share of output generated in the North Sea. If Scotland is allocated a geographical share of North Sea output, defence spending for the benefit of Scotland is estimated to have been 2.2% of Scottish GDP.
63 Figures taken from membership profiles of the revenue authorities of member states of the Intra-European Organisation of Tax Administrations, available at http://www.iota-tax.org/.
64 © Institute for Fiscal Studies, 2013
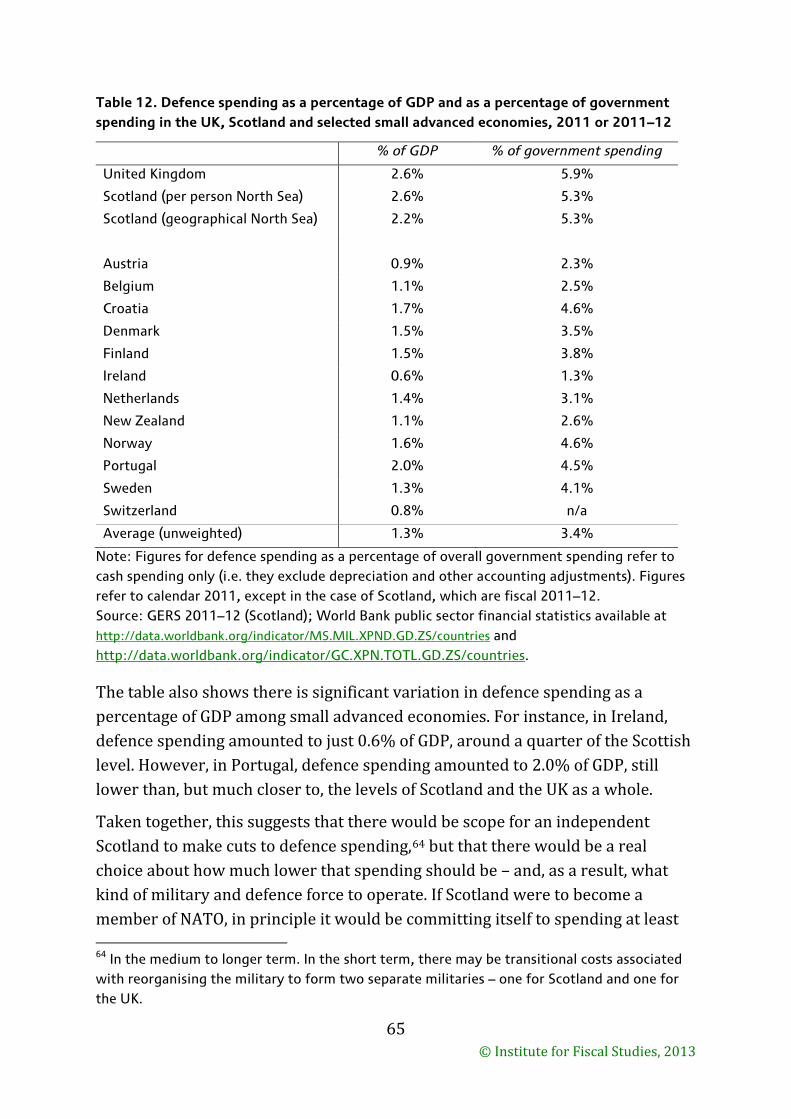
Table 12. Defence spending as a percentage of GDP and as a percentage of government spending in the UK, Scotland and selected small advanced economies, 2011 or 2011–12
% of GDP % of government spending
United Kingdom 2.6% 5.9%
Scotland (per person North Sea) 2.6% 5.3%
Scotland (geographical North Sea) 2.2% 5.3%
Austria 0.9% 2.3%
Belgium 1.1% 2.5%
Croatia 1.7% 4.6%
Denmark 1.5% 3.5%
Finland 1.5% 3.8%
Ireland 0.6% 1.3%
Netherlands 1.4% 3.1%
New Zealand 1.1% 2.6%
Norway 1.6% 4.6%
Portugal 2.0% 4.5%
Sweden 1.3% 4.1%
Switzerland 0.8% n/a
Average (unweighted) 1.3% 3.4%
Note: Figures for defence spending as a percentage of overall government spending refer to cash spending only (i.e. they exclude depreciation and other accounting adjustments). Figures refer to calendar 2011, except in the case of Scotland, which are fiscal 2011–12. Source: GERS 2011–12 (Scotland); World Bank public sector financial statistics available at http://data.worldbank.org/indicator/MS.MIL.XPND.GD.ZS/countries and http://data.worldbank.org/indicator/GC.XPN.TOTL.GD.ZS/countries.
The table also shows there is significant variation in defence spending as a percentage of GDP among small advanced economies. For instance, in Ireland, defence spending amounted to just 0.6% of GDP, around a quarter of the Scottish level. However, in Portugal, defence spending amounted to 2.0% of GDP, still lower than, but much closer to, the levels of Scotland and the UK as a whole.
Taken together, this suggests that there would be scope for an independent Scotland to make cuts to defence spending,64 but that there would be a real choice about how much lower that spending should be – and, as a result, what kind of military and defence force to operate. If Scotland were to become a member of NATO, in principle it would be committing itself to spending at least
64 In the medium to longer term. In the short term, there may be transitional costs associated with reorganising the military to form two separate militaries – one for Scotland and one for the UK.
65 © Institute for Fiscal Studies, 2013
2.0% of GDP on defence, which would limit how far spending could be cut back. However, in practice, this condition is not binding – a number of the countries in Table 12 are members of NATO and the only two European member countries to meet the target are France and the UK.
UK spending on overseas direct aid (ODA) amounted to 0.56% of gross national income (GNI) in 2011, and it has since been increased in order to meet the 0.7% of GNI target for this year (2013).65 This was substantially higher than the 0.31% of GNI being spent on ODA by the members of the Development Assistance Committee (DAC) on average in 2011, which fell to 0.29% of GNI in 2012. This means there would be scope for Scotland to make reductions in spending on ODA (GERS 2011–12 currently allocates it a population share of UK spending, which is likely to translate into a very similar share of GNI66) and still spend a more-than-average share of GDP. As with defence, there is significant variation in spending on ODA, with Scandinavian countries spending more as a proportion of GNI than the UK (around 1% of GNI in the case of Norway and Sweden) and countries such as Greece and South Korea spending just over 0.1% of GNI on ODA. This shows clearly that the government of an independent Scotland would have a real choice about how much to give in overseas aid.
How much an independent Scotland would spend on defence and overseas aid would depend on the choices of its future governments. The current SNP government of Scotland has said that if it were elected, it would aim to reduce spending on defence to £2.5 billion per year,67 compared with the £3.4 billion spent in 2011–12 (in 2013–14 prices), but that it would aspire to exceed the UN target of 0.7% of GNI going to overseas aid by spending 1.0%.68
65 Figures are taken from Department for International Development, Statistics on International Development 2007/08 – 2011/12 (https://www.gov.uk/government/uploads/system/uploads/attachment_data/file/67317/SID-2012.pdf) and OECD statistics.
66 GERS 2011–12 does not separate ODA spending from other ‘international services’ such as foreign affairs, and GNI figures for Scotland are not currently produced. However, GNI per person in Scotland is likely to be fairly similar to that in the UK as a whole as onshore output is similar per person, and much of the profits and wages from output in the North Sea are likely to flow to people living outside Scotland, and thus not count towards Scottish GNI.
67 Taken from the SNP’s FAQs on independence: http://www.snp.org/referendum/faqs/d#.
68 Speech by Humza Yousaf, External Relations Minister, as reported by the Scottish Herald, 14 January 2013 (http://www.heraldscotland.com/politics/referendum-news/yousaf-plans-15bn-foreign-aid-budget.19911790).
66 © Institute for Fiscal Studies, 2013
It is beyond the scope of this briefing note to analyse what kind of defence force would be achievable with a budget of £2.5 billion.69 The SNP has not said whether the £2.5 billion figure is in today’s prices, but assuming that it is, it equates to defence spending roughly equivalent to 1.9% of GDP assuming a population share of North Sea output is Scottish, or 1.6% of GDP assuming a geographical share of North Sea output. In both instances, this is above the average for the sample of small advanced economies in Table 12 and around three times as much as Ireland spends as a proportion of GDP. According to GERS, defence spending for the benefit of Scotland in 2011–12 was around £3.4 billion in today’s prices, meaning the SNP’s plans amount to a cut of about £900 million.
Overseas direct aid of 1% of GNI, on the other hand, would represent a sizeable increase compared with current levels of spending and would make Scotland one of the largest spenders on ODA as a proportion of GNI in the world. Assuming that GNI is similar to Scottish GDP when allocated a geographical share of North Sea output, spending at this level would represent an increase of around £400 million compared with the 0.7% target and almost £600 million more than the 0.56% of GNI spent by the UK in 2011.
Areas already the responsibility of the Scottish government
An independent Scotland could also choose to continue to prioritise spending on those services already devolved to Scotland – which account for 85% of all public service spending in Scotland – differently from the rest of the UK. What options and issues are there for spending in these areas?
Spending per person on services that are, in the main, the responsibility of the Scottish government or local governments was 18.7% higher than the average for the UK as a whole in 2011–12, according to GERS.70 An independent Scotland could choose to continue to spend more per person than the average for the UK (or, indeed, increase the spending relative to the rest of the UK) or might want to reduce spending in these areas in order to spend more elsewhere or to improve its fiscal position or to reduce taxes. In deciding what to do, the government of an
69 The SNP says that such funding would allow Scotland to have armed forces numbering 15,000 regular personnel and 5,000 reservists (and allow it to maintain historic Scottish regiments), as well as to maintain existing naval and air bases and to fund modest naval and air forces.
70 This figure refers to all services excluding defence and international services.
67 © Institute for Fiscal Studies, 2013
independent Scotland might want to consider how the spending needs of Scotland might differ from those of the rest of the UK.
The Holtham Commission, set up by the Welsh government to assess the implications of various funding options for Wales, attempted to estimate how much a needs-based approach would provide Wales, Scotland and Northern Ireland for devolved services compared with what was spent in England.71 Using data that cover around 80% of devolved government spending in Wales, 70% in Scotland and 75% in Northern Ireland,72 and a formula-based approach to assessing relative needs, the Holtham Commission suggests that spending per person in Scotland would need to be around 5% higher than the average for England to compensate for differences in needs. This compares with an approximate 20% difference in 2011–12, according to GERS and PESA data.73
This would suggest that there is substantial scope for Scotland to reduce spending on currently devolved public services: the 15% difference is equivalent to around £4.7 billion in today’s prices. However, there are several caveats to bear in mind. First, these needs-based assessments are not uncontroversial and, as the Holtham Commission points out, the figures for Scotland and Northern Ireland are indicative only (the focus of the Commission was naturally on Wales). But even assuming the gap was only half as large as suggested by the Holtham Commission (i.e. assuming spending per person should be 112.5% of the average for England) would suggest spending is almost £2.4 billion higher than it would be on a relative-needs basis. The second caveat is that the word ‘relative’ is important: the work by the Holtham Commission represents an assessment of relative needs rather than absolute needs, and it could be argued that spending per person is lower than needed in England, rather than higher than needed in Scotland. Third, there may be a preference for higher levels of public service spending and provision in Scotland relative to England.
71 Independent Commission on Funding and Finance for Wales, Fairness and Accountability: A New Funding Settlement for Wales, 2010, available at http://wales.gov.uk/funding/financereform/report/?lang=en.
72 This includes health, education, local government and some smaller items but excludes policing and justice, and central (as opposed to local) government spending on areas such as transport, culture and economic development.
73 As stated above, the difference between Scotland and the UK average is 18.7%. However, that average is pushed up by above-average spending in Wales, Scotland and Northern Ireland, meaning the gap between spending in Scotland and England is a little greater (20% is an approximate figure).
68 © Institute for Fiscal Studies, 2013
The analysis of Sections 3 and 4 of this briefing note showed that most of the gap in public service spending per person between Scotland and the UK as a whole is due to higher spending on smaller services, rather than spending on major items such as health, education, and justice and policing.
GERS estimates that spending per person on education and training was very similar to the average for the UK in 2011–12. As discussed in Section 3.3, analysis of relative funding needs using the schools funding formulas used in England by Ball, Eiser and King (2012)74 suggests that spending on schools was a little lower relative to England than if funding were allocated to Scotland using the formulas. If comparisons continued to be made between the amounts spent on education in an independent Scotland and in the rest of the UK, this might make additional reductions in education spending relative to England unattractive.
Under current policy, there would also likely be pressure to spend more on higher education in an independent Scotland than at present (and spending per person is already above the average for the UK – unlike for schools, where it is lower). This is because, under EU law, whereas Scottish universities are able to charge students from the rest of the UK up to £9,000 a year in tuition fees at the moment, students from other EU member states must be charged the same as Scottish students, for whom tuition is currently free: upon independence, students elsewhere in the UK would also become eligible for free tuition.
Figures from the Higher Education Statistics Agency75 suggest students from England, Wales and Northern Ireland made up 11.1% of all UK-domiciled first-year undergraduates in 2011–12 and 10.8% of first-year undergraduates in 2010–11. Assuming they made up 11% of all UK-domiciled undergraduate students in 2011–12 would suggest there were around 15,200 students from elsewhere in the UK studying undergraduate courses at Scottish universities in that year.76 The average fee charged to such students in 2012–13 was £6,841.77
74 R. Ball, D. King and D. Eiser, ‘Replacing the Barnett formula by needs assessment: lessons from school funding formulae in England and Scotland’, University of Stirling, 2012, http://www.barnett-or-needs.stir.ac.uk/documents/educationpaper1Nov2012web_000.pdf.
75 UK-domiciled first-year student enrolments, available at http://www.hesa.ac.uk/dox/pressOffice/sfr183/6995_SFR183_Student_2011_12_Table_4.xls.
76 Total number of UK-domiciled students studying at Scottish higher education institutions is available from the ‘Headline Statistics’ panel at http://www.hesa.ac.uk/.
77 Universities Scotland press release, available at http://www.universities-scotland.ac.uk/index.php?mact=News,cntnt01,detail,0&cntnt01articleid=95&cntnt01returnid=23.
69 © Institute for Fiscal Studies, 2013
Loss of this fee income would therefore amount to around £100 million per year – although the exact amount will depend upon the average level of fees and the number of students from elsewhere in the UK at the time of independence. Furthermore, free tuition would make Scottish universities significantly more attractive to students from elsewhere in the UK. This may lead to fewer Scottish students being able to enrol in Scottish universities (there would be greater competition for places with English, Welsh and Northern Irish students), which might lead to pressure to expand the number of student places or moves to discriminate in favour of Scottish students in admissions (which may fall foul of EU regulations). Alternatively, Universities Scotland has suggested that it may be possible to treat Scottish and other EU students (including those from the rest of the UK) differently via grant and loan arrangements and administration fees, rather than via tuition fees themselves.78
In terms of healthcare, 11.6% more was spent per person in Scotland than in England in 2011–12 according to PESA.79 As discussed in Section 3.3, Ball, Eiser and King (2013)80 suggest that this may be a somewhat larger difference than an assessment of relative needs under the English NHS funding formulas would imply (7.2%), although use of the Scottish formula to allocate funding across the UK would imply a difference (11.2%) similar to the actual difference. They also explore the implications of using higher healthcare spending to compensate for health inequalities, and incorporating this would suggest that the Scottish government might actually want to increase health spending slightly, relative to England. It is also worth noting that, as with the Holtham Commission, this work assesses relative needs rather than absolute needs. With this in mind, it is interesting to note that while government spending on health in Scotland and the UK as a whole was a little above the EU average (7.3% of GDP) in 2011–12, total spending on health including private healthcare was lower (9.3% for the UK as a whole) than in most advanced EU economies, including Austria, Belgium, Denmark, France, Germany and the Netherlands, and broadly similar to that in
78 Initial legal advice from Anderson Strathern solicitors has been published on Universities Scotland’s website: http://www.universities-scotland.ac.uk/uploads/briefings/Note%20for%20Universities%20Scotland%288025053_v4%29%20DOC%288033180_3%29.pdf.
79 GERS reports an 8.9% difference compared with the average for the UK as a whole.
80 R. Ball, D. Eiser and D. King, ‘Assessing relative spending needs of devolved government: the case of healthcare spending in the UK’, Regional Studies, 2013, available at http://www.tandfonline.com/doi/abs/10.1080/00343404.2013.779660#.UienG_kq651.
70 © Institute for Fiscal Studies, 2013
Italy, Spain and Sweden. This, together with pressure on healthcare services from an ageing population and generally low productivity growth in the healthcare sector, may limit the scope for reductions in spending on healthcare by an independent Scotland.
It is on services other than health, education, and public order and safety that spending per person is most different from the UK average: 48.9% higher, on average, in 2011–12, according to GERS. This may reflect differences in need or differences in preferences for different types of public service spending (or both), but does make these other service areas look to be more likely targets for spending cuts if the government of an independent Scotland wanted or felt the need to make cuts. The government of an independent Scotland would also have the choice of whether to continue spending relatively more on capital investment as opposed to current spending than is the case in the rest of the UK, or to cut capital spending in order to protect current spending on services.
5.2 Public service spending in the fiscal context of an independent Scotland
If Scotland votes for independence in September 2014, the current plan is for it to become independent in April 2016. This is almost two years before the planned end of the UK government’s fiscal consolidation. This means that one of the first jobs of the government of an independent Scotland may be to announce further cuts to spending on public services – although this is also a likely prospect for the government of a Scotland still part of the UK in 2016.
Although it has not confirmed how the further fiscal consolidation required after March 2016 will be delivered, the UK government has pencilled in additional cuts to public service spending of around £25 billion per year in real terms by the end of 2017–18, equivalent to about 1.6% of GDP. These cuts reduce the UK’s budget deficit to a predicted 2.2% of GDP in 2017–18.81
Supposing that the government of an independent Scotland felt the need to deliver an equivalent 1.6% of GDP fiscal tightening, it could decide to raise taxes or reduce benefit spending rather than allow the impact to fall fully on public services. But to get a feeling for the scale of cuts that would be required if such an adjustment fell fully on public services, 1.6% of GDP (including a geographical
81 Office for Budget Responsibility, Economic and Fiscal Outlook, March 2013, http://budgetresponsibility.org.uk/economic-and-fiscal-outlook-march-2013/. The figure of £25 billion is taken from a presentation by Gemma Tetlow at IFS’s post June 2013 Spending Round presentations, available at http://www.ifs.org.uk/budgets/sr2013/gemma_tetlow.pdf.
71 © Institute for Fiscal Studies, 2013
share of North Sea output) was around £2.5 billion in today’s prices in 2011–12. This compares with £42.0 billion spent on public services for the benefit of Scotland in the same year, meaning a cut of around 6.0% would be required to deliver such a fiscal tightening.
However, the fiscal situation facing an independent Scotland might differ from that facing the rest of the UK. The Centre for Public Policy for Regions (CPPR) at the University of Glasgow has analysed the prospects for Scotland’s fiscal balance between 2012–13 and 2017–18 under a number of scenarios for North Sea revenues, drawing on the projections of the OBR and alternative projections by the Scottish government.82 Under the OBR’s projections for North Sea revenues, this analysis shows Scotland facing a fiscal balance 2.2% of GDP further in the red than for the UK as a whole in 2017–18. To put this in perspective, this would have equated to about £3.4 billion in today’s prices in 2011–12, on top of the £2.5 billion required as part of the plans set out by the UK government. However, under the Scottish government’s various scenarios, the fiscal balance of Scotland is estimated to be between 0.8% of GDP worse and 1.2% of GDP better than the position for the UK as a whole in 2017–18. In the latter case, an independent Scotland would, in principle, be able to cut spending by less than if it remained part of the UK. However, as highlighted by both the Scottish government’s fiscal commission and recent analysis by NIESR,83 the government of an independent Scotland might feel the need to maintain a tighter fiscal policy than the UK, eating up this notional additional spending power.
Given this uncertainty about the fiscal situation in Scotland in the latter half of this decade, and the fact that the Scottish government could choose to fill any fiscal hole through a combination of tax rises and benefit cuts as well as cuts to public service spending, one cannot easily predict what would happen to public service spending in an independent Scotland. However, it is possible to set out a number of plausible scenarios illustrating the scale of the cuts that public service spending may face in Scotland. There are a number of stages to such an exercise.
82 CPPR, ‘Analysis of Scotland’s past and future fiscal position: reflections on GERS 2013, the Scottish government’s Oil and Gas Analytical Bulletin and the 2013 UK Budget’, CPPR Briefing Paper, 2013, http://www.gla.ac.uk/media/media_273150_en.pdf.
83 The executive summary of this report is available at http://niesr.ac.uk/sites/default/files/files/Exec%20sum_final.pdf. The full report, Scotland’s Currency Options, is being published on 19 September 2013.
72 © Institute for Fiscal Studies, 2013
The first is to consider Scotland’s fiscal position relative to the UK as a whole. We consider three alternative scenarios:
• a fiscal balance 2.2% of GDP worse than for the UK as a whole; • a fiscal balance 0.8% of GDP worse than for the UK as a whole; • a fiscal balance 1.2% of GDP better than for the UK as a whole.
The second stage is to divide up the adjustment required to eliminate this gap between changes in public service spending and changes in taxation, benefits spending or the level of borrowing. We examine two alternative assumptions:
• the entire adjustment is made via public service spending; • 50% of the adjustment is made via public service spending and 50% via other
means.
In the next stage, we make assumptions about how the government of an independent Scotland would change spending on defence and ODA. Again, we examine two alternative assumptions:
• the Scottish government reduces defence spending to £2.5 billion but increases spending on ODA to 1% of GNI (assumed to be equivalent to 1% of GDP given a population share of North Sea output);
• the Scottish government reduces defence spending to the average for the small advanced economies in Table 12 and ODA spending to the 2011 average for DAC members.
Last, we make two alternative assumptions about how any remaining adjustment is allocated across all other services:
• it is spread equally across all services; • in the case of cuts, health and education are protected, and cuts are spread
equally across other services.
Together, this makes 24 different combinations (3×2×2×2), full details of which are available from the authors on request. However, in this briefing note, instead of presenting each of these different combinations in detail, in Table 13 we focus on a small number of scenarios that illustrate the potential trade-offs facing the government of an independent Scotland.
73 © Institute for Fiscal Studies, 2013
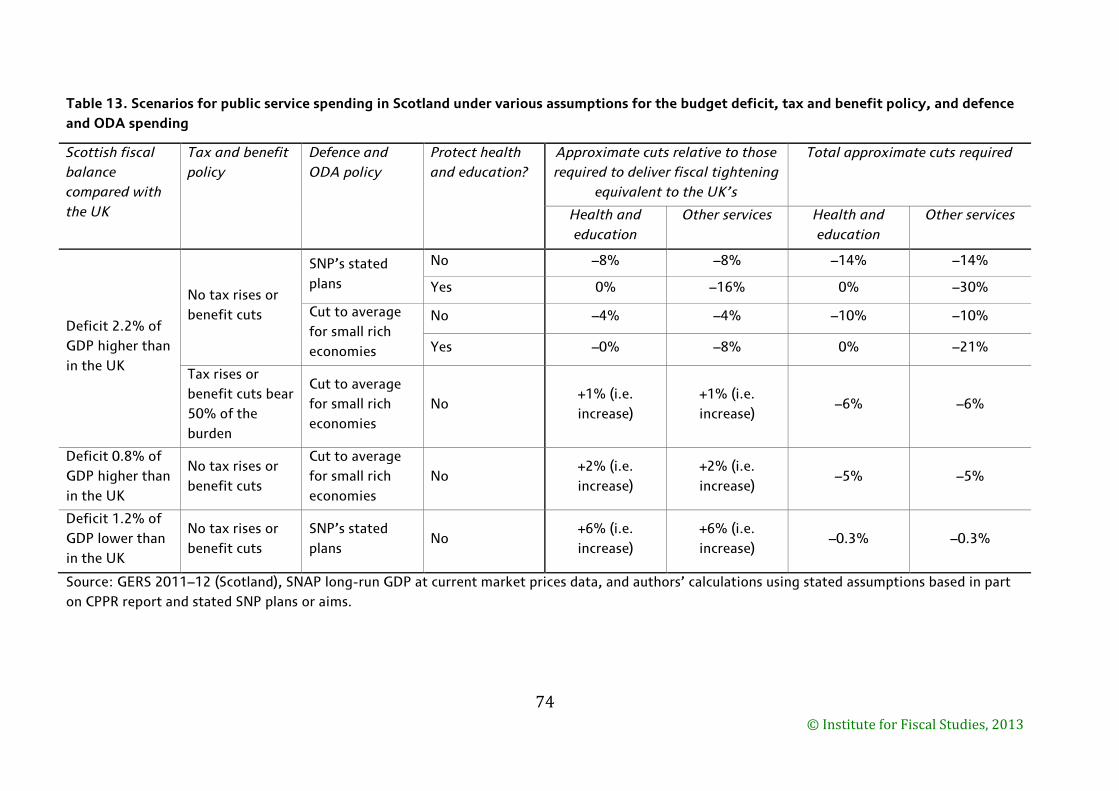
Table 13. Scenarios for public service spending in Scotland under various assumptions for the budget deficit, tax and benefit policy, and defence and ODA spending
Scottish fiscal balance compared with the UK
Tax and benefit policy
Defence and ODA policy
Protect health and education?
Approximate cuts relative to those required to deliver fiscal tightening
equivalent to the UK’s
Total approximate cuts required
Health and education
Other services Health and education
Other services
Deficit 2.2% of GDP higher than in the UK
No tax rises or benefit cuts
SNP’s stated plans
No –8% –8% –14% –14%
Yes 0% –16% 0% –30%
Cut to average for small rich economies
No –4% –4% –10% –10%
Yes –0% –8% 0% –21%
Tax rises or benefit cuts bear 50% of the burden
Cut to average for small rich economies
No +1% (i.e. increase)
+1% (i.e. increase)
–6% –6%
Deficit 0.8% of GDP higher than in the UK
No tax rises or benefit cuts
Cut to average for small rich economies
No +2% (i.e. increase)
+2% (i.e. increase)
–5% –5%
Deficit 1.2% of GDP lower than in the UK
No tax rises or benefit cuts
SNP’s stated plans
No +6% (i.e. increase)
+6% (i.e. increase)
–0.3% –0.3%
Source: GERS 2011–12 (Scotland), SNAP long-run GDP at current market prices data, and authors’ calculations using stated assumptions based in part on CPPR report and stated SNP plans or aims.
74 © Institute for Fiscal Studies, 2013
Consider first the CPPR’s estimates based upon the OBR’s projection: this is for a deficit 2.2% of GDP worse in Scotland than in the UK as a whole by 2017–18, as North Sea revenues decline. To put this in context, this would have equated to about £3.4 billion in today’s prices in 2011–12. If this gap were eliminated entirely via cuts to public service spending, and if defence and ODA spending were changed in line with stated SNP policy, around £2.9 billion would be required to be cut from other spending. This was around 8% of all spending on services other than defence and international services in 2011–12, and would come on top of the 6% cuts that would be required as part of the UK’s fiscal consolidation. If the Scottish government decided it wanted to protect health and education spending from these cuts, remaining services would face a cut of around 16% on top of those required as part of the UK’s fiscal consolidation (or 30% in total). However, even a cut this size would still leave spending per head on these services higher than in the rest of the UK, on average.
If, on the other hand, defence and ODA spending were reduced to the relevant advanced economy averages, the additional cuts required elsewhere would amount to about £1.4 billion, or just under 4% (8% if restricted to services other than health and education). Again, this comes on top of the £2.5 billion cuts required as part of the fiscal consolidation.
Alternatively, if instead of letting public service spending bear all the burden of the fiscal adjustment, increases in taxes or cuts to benefits spending accounting for 50% of the adjustment were made, cuts in defence and ODA spending to the advanced economy averages would be enough to allow a little more to be spent on other public services than implied by the UK government’s plans (although some cuts would still be required). This shows that the decisions the government of an independent Scotland would make about taxes and benefits, and what it decides to spend on those services currently the responsibility of the UK government, would make a real difference to how much is available to spend on services such as health, education, social services and transport.
Of course, the overall fiscal situation will matter too. If instead of a deficit 2.2% of GDP larger than the average for the UK, it were only 0.8% of GDP larger, the cuts required would be smaller. In this instance, a reduction in defence and ODA spending to the average for small rich economies would mean cuts elsewhere could be smaller than under the UK’s fiscal plans, although some cuts would still be required (5% if spread across all other public services equally).
75 © Institute for Fiscal Studies, 2013
Finally, if Scotland’s fiscal position were 1.2% of GDP stronger than the UK’s in 2017–18, as in the Scottish government’s most optimistic scenario, Scotland might be able to engage in less fiscal tightening after 2016 than if it remained part of the UK, at least in the medium term. Together with the SNP’s plans for defence and ODA spending, a spending increase of 1.2% of GDP would have allowed about £2.5 billion more to be spent on other services in today’s prices in 2011–12, just over 6% more than what was actually spent in that year and just about offsetting the cuts implied by the UK’s fiscal consolidation pencilled in for 2016–17 and 2017–18.
The scenarios therefore clearly show how the prospects for public service spending in the first few years of an independent Scotland will depend both on the fiscal situation and on the choices made about taxation, benefits and the level of borrowing. If it finds itself with a somewhat larger deficit than the UK as a whole, an independent Scotland may find itself facing pressure to make somewhat larger cuts to public service spending, although increases in tax or cuts in benefits, or larger-than-planned cuts to defence and ODA spending, would reduce this pressure. On the other hand, if it inherited a better medium-term fiscal situation than the UK as a whole, the government of an independent Scotland might feel able to increase public service spending relative to the situation if Scotland remained part of the UK. However, it might also use the opportunity to strengthen its public finances to reassure financial markets about the credibility of its fiscal policy and as preparation for longer-term challenges.
It is worth pointing out that this analysis has covered the medium term only. In the longer term, it does seem likely that North Sea revenues will decline, putting pressure on the budget of an independent Scotland that, all else equal, would require spending cuts or tax rises to address it. It is, of course, the position of both the Scottish government and the UK government that all else would not be equal. The Scottish government argues that independence would allow policies to be adapted to better suit Scotland, thus allowing for more rapid economic growth.84 On the other hand, the UK government has recently argued that additional barriers to trade and mobility could reduce output in Scotland by 4% after 30 years.85 Our next major piece of analysis, due to be published in
84 See, for instance, the Scottish government’s publication Scotland’s Economy: The Case for Independence, 2013, available at http://www.scotland.gov.uk/Resource/0042/00422987.pdf.
85 HM Government, Scotland Analysis: Macroeconomic and Fiscal Performance, 2013, available at https://www.gov.uk/government/publications/scotland-analysis-macroeconomic-and-fiscal-performance.
76 © Institute for Fiscal Studies, 2013
November 2013, will examine the longer-term fiscal prospects for Scotland, and the sensitivity of these to various scenarios for the economy, demographics, tax revenues and spending needs. It will also examine the longer-term adjustments the government of an independent Scotland may have to make to its levels of taxes or spending to ensure its fiscal sustainability.
6. Conclusions
Over the period since 2002–03, government spending per person has been consistently higher in Scotland than in the UK as a whole, with the vast majority of this gap explained by higher spending on public services rather than higher spending on benefits. In 2011–12, the last year for which data are available, public service spending was 16.6% higher per person than for the UK as a whole, according to the Scottish government’s official GERS publication.
However, the composition of public service spending is also different in Scotland from in the UK as a whole. Spending on health was 8.9% higher per person than the UK average, and spending on education and training was broadly the same per person as in the UK as a whole, despite a notably more generous policy on higher education tuition fees. Together with public order and safety, defence, and international services, these five core services accounted for 62.6% of the total spent on public services for the benefit of Scotland in 2011–12, compared with 70.7% for the UK as a whole. Indeed, for these five areas, average spending per person was just 3.2% higher in Scotland than across the UK as a whole. On the other hand, spending per person on other services – such as enterprise and economic development, housing and community amenities, transport and social services – was, on average, 48.9% higher in Scotland than in the UK as a whole in the same year. This pattern of similar or slightly higher-than-average spending per person on health and education, and substantially higher spending on most other devolved services, is similar to the situation in Wales and Northern Ireland.
Analysis of previous years of data shows that this difference in spending patterns has become much more pronounced over time. This is because, since 2002–03, while spending per person on health and education has increased significantly in Scotland, it has done so by substantially less than the average across the UK as a whole, while other largely devolved services have seen larger increases in spending per person than in the rest of the UK. This shows that the Scottish government has been able and willing to make use of its powers under current devolution arrangements to prioritise budgets for different service areas differently from the way the UK government has done for England.
77 © Institute for Fiscal Studies, 2013
Looking ahead, independence would give the Scottish government fuller control over how much is spent on currently devolved services in addition to control over those areas not currently devolved, such as defence and international affairs. The UK is currently a relatively high spender on defence and overseas aid, and an independent Scotland might have significant scope to reduce spending on these areas if it so wished. The indicative plans set out by the Scottish government suggest that it would spend less on defence but more on overseas aid. Taken together, this would represent an overall cut of about 0.3% of GDP (i.e. spending 0.6% of national income less on defence, offset slightly by spending 0.3% of national income more on aid). If, instead, defence spending were cut to the average for a sample of similar small advanced economies, and overseas aid were cut to the average of donor countries, a reduction in spending of about 1.3% of Scottish GDP would be made.
However, independence would also bring risks to public service spending in both the medium and longer term. If Scotland became independent in 2016, there would still be a further two years of the UK government’s fiscal consolidation to go. If the government of an independent Scotland felt the need to deliver an equivalent fiscal tightening, spending cuts or tax rises equivalent to 1.6% of GDP (about £2.5 billion in today’s terms) would be required. But analysis of the fiscal situation facing Scotland in its first few years of independence suggest that if the OBR’s forecasts for North Sea revenues are borne out, a newly independent Scotland could actually find itself with a somewhat larger budget deficit than the rest of the UK. In this case, additional spending cuts or tax rises of about £3.4 billion would be required, on top of those planned by the UK government. The SNP’s plans for defence and foreign aid would fill only a small part of that gap, and even reducing defence and foreign aid to the relevant averages would leave a gap of £1.4 billion, which would equate to just under a 4% cut in spending on other public services.
Of course, if North Sea revenues turn out to be substantially stronger than the OBR forecasts, the fiscal situation in Scotland might actually be somewhat stronger than that for the UK as a whole for the first few years of independence. The temptation in these circumstances may be to tax less or to spend more. But this might be ill-advised. An independent Scotland might want – or indeed need – to maintain a stronger fiscal position than the UK, both in order to gain credibility in the financial markets and as preparation for the longer-term fiscal challenges of an ageing population and the eventual inevitable decline of North Sea revenues.
78 © Institute for Fiscal Studies, 2013