government of jamaica - mof.gov.jm · jamaica’s geographical location puts it at risk of being...
TRANSCRIPT

Ministry of Finance and the Public Service Fiscal Policy Paper Interim Report September 2018 Page 1
GOVERNMENT OF JAMAICA
FISCAL POLICY PAPER
FY 2018/19
INTERIM REPORT
25th September 2018

Ministry of Finance and the Public Service Fiscal Policy Paper Interim Report September 2018 Page 2
TABLE OF CONTENTS
Part 1: Fiscal Responsibility Statement
Introduction
Economic Update and Outlook
Notable Fiscal Developments
Conclusion
Part 2: Macroeconomic Framework
Real Sector Developments
Monetary Developments
External Sector
Macroeconomic Outlook FY 2018/19 to 2021/22
Part 3: Fiscal Management Strategy
Background
Central Government Performance: FY 2017/18 Outturn
Central Government Performance: April – July 2018
Public Debt
Self-Financing Public Bodies
Fiscal Outlook
Appendix I Fiscal Tables
Appendix II Fiscal Risk Statement
Appendix III Tax Administration Jamaica & Jamaica Custom Agency Update
Appendix IV Developments in the Financial Sector

Ministry of Finance and the Public Service Fiscal Policy Paper Interim Report September 2018 Page 3
PART 1
FISCAL RESPONSIBILITY STATEMENT
INTRODUCTION
Further amendments to the Financial Administration and Audit (FAA) and the Public Bodies
Management and Accountability (PBMA) Acts in March 2014 enabled the Government of
Jamaica (GOJ) to adopt enhanced fiscal rules. The enhanced rules call for the simultaneous
tabling of the annual Estimates of Revenue and Expenditure as well as the accompanying Fiscal
Policy Paper (FPP), in February of each year, commencing February 2015, to facilitate the
approval of the budget prior to the start of the next fiscal year to which those estimates relate.
The change to the budget preparation and approval process enables Parliamentarians to examine
both aspects of the budget (revenue and expenditure) thus ensuring more robust debate and better
decision making. This early approval of the budget has now occurred thrice, since the adoption
of the enhanced fiscal rules as it relates to the new budget calendar.
The FY 2018/19 Estimates of Revenue and Expenditure, as well as the annual FPP, were tabled,
as required under the enhanced rules, during February, 2018 which allowed the approval of the
budget by both Houses of Parliament on March 29, 2018. The enhanced fiscal rules require the
Minister to table in both Houses of Parliament, an Interim FPP within six months of the passage
of the Appropriation Act for the financial year to which the relevant Estimates of Revenue and
Expenditure relate. The tabling of this Interim FPP satisfies that requirement.
The FAA Act also requires that the Interim FPP include:
(a) The economic outturn of the previous financial year;
(b) The performance of the first quarter of the financial year;
(c) Projections to the end of the current financial year; and
(d) Projections for the succeeding financial year and the medium term.
The Minister with responsibility for Finance, under the FAA (Amendment) Act 2014, is also
required to, by September 30 in each financial year, issue to accounting officers in Ministries,
Departments and Agencies (MDAs), the Budget Call containing the economic and fiscal
parameters which will determine the preparation of the Annual Estimates of Revenue and
Expenditure for the next financial year and the medium term. The First Supplementary Estimate
for FY 2018/19 is being tabled alongside the Interim FPP which speaks to the adjustments
outlined in the First Supplementary Estimates. This Interim FPP has been prepared and is being
tabled to: support the issue of the Budget Call by the stipulated date; and update

Ministry of Finance and the Public Service Fiscal Policy Paper Interim Report September 2018 Page 4
Parliamentarians, whom have been entrusted with the oversight of the management of the public
finances of Jamaica.
The country’s positive performance under the precautionary Stand-By Arrangement (PSBA)
with the International Monetary Fund (IMF) continues, with the IMF Executive Board, following
the completion of the third review conducted in April 2018, concluding that all quantitative
performance criteria and structural benchmarks for end-December 2017 were met. The Board is
expected to assess the fourth review under the programme in November 2018.
The Government of Jamaica’s commitment to economic reform and growth remains strong. The
Government continues to maintain fiscal discipline and seeks to ensure that all quantitative
performance criteria and structural benchmarks are met going forward.
ECONOMIC UPDATE AND OUTLOOK
The Government has been steadfastly implementing its economic reform program, now
supported under the PSBA. Growth, in real terms, continues unabated, with the country
recording thirteen (13) consecutive quarters of real growth. For FY 2017/18, real output
expanded by 0.9% and is projected to grow by 1.7% in the current fiscal year. Much, however,
remains to be done and the GOJ remains committed to staying the course. Inflation remains low,
with a Calendar Year-to-August 2018 inflation rate of 1.6% compared to the 3.0% outturn for
Calendar Year-to-August 2017. Net International Reserves (NIR) remain strong, and the
debt/GDP ratio continues to be on a downward trajectory.
Primary objectives of the economic reform program include:
• Maintaining a Central Government annual Primary Surplus of 7.0% of GDP across the
medium term;
• Achieving a Debt/GDP ratio of 96.0% or less by end-FY 2019/20;
• Accelerating the growth in real GDP to an average of 2.0% over the medium term;
• Attaining a Wage/GDP ratio of 9.0% by end-FY 2018/19; and
• Maintaining adequate funding of Social Expenditures through adhering to a floor on
social spending.
The economic reform program remains on track with the successful completion of the third
review under the PSBA with the IMF. Key highlights of the progress so far and future
expectations are outlined below:
• The Central Government’s Primary Surplus target of 7.0% was exceeded in FY 2017/18
with an outturn of 7.4% of GDP. This performance was driven by a combination of

Ministry of Finance and the Public Service Fiscal Policy Paper Interim Report September 2018 Page 5
strong revenue outturn ($7.2bn or 1.3% higher than budget) and lower total expenditure
($7.6bn or 1.4% lower than budget). The primary balance target for FY 2018/19 and
beyond remains at 7.0% of GDP;
• Central Government operations generated a fiscal surplus of 0.5% of GDP in FY 2017/18
relative to a deficit of 0.2% of GDP in FY 2016/17. A fiscal surplus of 0.2% for
FY 2018/19 was programmed in the original Budget which was approved in March.
With respect to FY 2018/19, revenue performance to date has been robust, contributing to
the achievement of the targeted primary surpluses to date. Given the emergence of a
number of critical expenditure pressures a First Supplementary Budget has been
prepared. The primary balance is still programmed at 7.0% of GDP with the additional
expenditures being covered by additional revenue as well as reallocations.
• The Public Sector generated an overall balance surplus of 1.5% of GDP in FY 2016/17,
and a surplus of 1.3% of GDP in FY 2017/18. Surpluses on the overall balance are
expected to persist across the medium term;
• The Current Account deficit of the Balance of Payments (BOP) for FY 2017/18 was
5.4% of GDP, compared to 2.6% in FY 2016/17. The projected Current Account deficit
for FY 2018/19 is 5.8% of GDP, and is expected to subsequently average around 3.7%
over the medium term;
• Real GDP growth accelerated over the last three fiscal years (FY 2015/16 -
FY 2017/18), averaging 1.1%, in comparison to an average of 0.2% over the three
previous fiscal years. Real growth for FY 2018/19 has been revised downwards to 1.7%
from the projected 2.4% reflected in the February 2018 publication of the FPP. Growth is
forecast to average 2.0% per annum over the medium term;
• The Wage/GDP ratio has trended downwards from 10.0% in FY 2015/16 to 9.2% in
FY 2017/18 and is expected to fall further by the end of FY 2018/19;
Inflation remained relatively low in FY 2017/18, with an outturn of 3.9%. A modest
increase in the inflation rate, to 4.5%, is projected for FY 2018/19. At end-August 2018,
the twelve-month (point to point) inflation rate was 3.9% relative to the 4.4% recorded
for the twelve-month period up to end-August 2017. Over the medium term, the forecast
is for inflation to remain at moderate single digit rates within the context of favourable
weather to support agricultural output, stable oil prices and an improvement in domestic
demand.

Ministry of Finance and the Public Service Fiscal Policy Paper Interim Report September 2018 Page 6
• The NIR remains in a strong position, increasing from US$2,515.5mn at end-August
2016 to US$3,058.4mn at end-August 2018;
• The average unemployment rate declined annually over a four-year period to reach
11.7% in 2017, after peaking at 15.3% in 2013. The employed labour force of 1,217,300
persons reported by STATIN in its April 2018 Labour Force Survey is a record high for
Jamaica. The unemployment rate of 9.7% reported in that survey is 2.5 percentage points
lower than the rate recorded in April 2017 and is the lowest rate recorded since October
2007;
Notable Fiscal Developments
For the April-July period of FY 2018/19, both the Central Government’s Primary Balance and
Fiscal Balance performed better than budget. Provisional data indicate that Central Government
operations to end-July 2018 generated a fiscal deficit of $3,024.7mn, 76.9% better than the
programmed deficit of $13,095.5mn. The Primary Surplus amounted to $38,235.1mn, which
was 15.2% higher than the $33,201.2mn targeted. This favourable fiscal performance was
driven, largely, by lower than programmed expenditure as well as the strong performance of tax
revenue. Revenue & Grants were ahead of budget by $2,645.8mn or 1.4%. This positive
performance was driven mainly by Tax Revenue which was $5,748.9mn better than budget.
Grants and Non-Tax Revenue, which were $1,603.0mn and $14,938.3mn, respectively, fell short
of budget by $3,021.7mn (65.3%) and $375.0mn (2.4%), respectively. The shortfall in Grants
was due to the non-receipt of EU Budget Support which was expected in June 2018.
Total expenditure (net of amortization) at end-July 2018 was $7,425.0mn (3.8%) lower than
programmed, due mainly to lower spending on recurrent expenses (interest payments,
programmes and compensation of employees) which outweighed the higher than programmed
capital expenditure. Interest payments were $5,037.0mn (10.9%) below budget, reflecting lower
than budgeted payments on both the domestic and external portfolios. Capital expenditure of
$17,390.2mn was $802.0mn or 4.8% more than programmed. It is to be noted that the fiscal
operations so far have occurred within the context of no new revenue measures and speaks to the
solid improvements in Revenue Administration over the last four years alongside the shift from
direct to indirect taxation. Additional non-debt expenditure is proposed as outlined in the First
Supplementary Estimates (see below). Fiscal operations remain on track to meet the established
targets for December 2018 and March 2019.
First Supplementary Budget
The First Supplementary Budget for FY 2018/19 is being tabled (for the first time)
simultaneously alongside the Interim Fiscal Policy Paper. In the First Supplementary Estimates,
against the backdrop of the over performance on Tax Revenues to end-July 2018, the revised Tax
Revenue forecast to March 2019, the very robust performance of capital expenditure and savings

Ministry of Finance and the Public Service Fiscal Policy Paper Interim Report September 2018 Page 7
on the recurrent side of the original budget , the proposed additional expenditures will be on both
the recurrent and capital budgets. On the Recurrent side, the additional expenditures amount to
$12.4bn, while the capital budget is proposed to be increased by $5.3bn, for a total additional
expenditure of $17.8bn. Amortization is estimated to decline by $0.3bn. The additional
expenditure is to be covered by additional Tax Revenue of $8.5bn, and special distributions and
other revenue from public bodies amounting to $10.1bn. The Primary Balance is now
programmed to be $142.98bn which satisfies the 7.0% of GDP requirement.
Fiscal Council
In a move to further bolster fiscal responsibility in Jamaica, on May 10th 2018, the Minister of Finance & the Public Service announced that Cabinet had approved the establishment of an independent fiscal council for Jamaica as part of measures to strengthen Jamaica’s Fiscal Responsibility Framework. This move is consistent with plans by the Government to secure Jamaica’s gains under successive economic reform programmes with the International Monetary Fund and build on the success of domestic partnership initiatives.
With that in mind, the Minister announced that with the assistance of the Inter-American Development Bank (IDB), Jamaica has engaged international experts who have advised on the setting up of Independent Fiscal Institutions around the world. A Jamaican Fiscal Council would be the guardian, interpreter and arbiter of Jamaica’s fiscal rules. It could also monitor Jamaica’s compliance with the fiscal responsibility rules and keep the public aware and updated on fiscal matters.
Disaster Risk Financing Policy
As a small island developing state (SID), Jamaica is particularly susceptible to natural disasters
and the consequences thereof. Natural disasters affect both human capital and physical
infrastructure with recovery and reconstruction efforts often being costly. Financing to provide
for these unplanned events pose a significant risk to fiscal stability and have the potential to
erode economic growth. Risks associated with these events go beyond existing physical
infrastructure and extend to vital growth-inducing capital projects that could be side-lined in
order to address more immediate social, health and security issues.
It is within the context of the increasing exposure of the island to multiple natural disaster
threats, that the GOJ is developing a Public Financial Management (PFM) Policy for Natural
Disaster Risk as a coordinating measure to ensure that adequate resources are available to
address ex post financing requirements through a mix of fiscal instruments. The policy will
consider principles of cost-effectiveness, temporality and sound administrative arrangements for
the reduction of the fiscal impact of natural disasters by proposing a risk-layering strategy
consisting of a combination of risk retention and transfer instruments, noting the importance of
timely disbursements, and prioritizing spending for different needs over time. To that end, the
GOJ will continue to work with its development partners (IMF, World Bank, Caribbean
Development Bank (CDB), and Inter-American Development Bank) as it seeks to adopt a cost

Ministry of Finance and the Public Service Fiscal Policy Paper Interim Report September 2018 Page 8
effective set of financing instruments that will complement the Caribbean Catastrophe Risk
Insurance Facility - Segregated Portfolio Company (CCRIF-SPC).
CONCLUSION
The Government of Jamaica, having successfully completed three reviews under the PSBA with
the IMF remains fully committed to the pathway of fiscal discipline and stands ready to take
whatever prudent policy actions are needed to reduce public debt to no more than 60% of GDP
by FY 2025/26. The fiscal programme crafted for FY 2018/19 and the medium term are
anchored around debt reduction and facilitating economic expansion, through the preservation of
an enabling environment for private sector investment and expansion. The fiscal accounts are
programmed to be in balance, thanks to buoyant tax revenue flows. These resources have
allowed the GOJ to strategically pay down the debt through timely liability management
operations. As the GOJ ramps up its capital spending, prudent monitoring and tracking of the
revenues will continue to be crucial. The efficient execution of the budget, alongside buoyant
tax revenue flows, places the GOJ firmly on a path to meeting its fiscal and debt targets for the
current FY and the medium term.
The GOJ is cognizant that there are downside risks and some of these risks have been detailed in
Appendix II. The remnants of Tropical Storm Isaac passed south of Jamaica on
September 16, 2018, a timely reminder of the natural disaster risks that face the economy.
Increased focus will be placed on the development of a financing policy to manage natural
disaster risks and particularly how the GOJ seeks to take on-board certain financing instruments
that will complement the CCRIF-SPC.
The GOJ through the development of a Disaster Risk Financing (DRF) Policy to finance natural
disasters will enable the country’s economy to become a resilient economy. Jamaica will then
be (2030): the place of choice to live, work, raise families and do business.
______________________________________
Nigel Clarke, D.Phil, MP Minister of Finance and the Public Service
September 25, 2018
Ministry of Finance and the Public Service Fiscal Policy Paper Interim Report September 2018 Page 9
PART 2
MACROECONOMIC FRAMEWORK
Real Sector Developments
FY 2017/18 - Update
The Jamaican economy recorded real GDP growth of 0.9% for FY 2017/18, reflecting a
deceleration in the rate of growth in real GDP relative to the 1.3% recorded for FY 2016/17.
This represents the fifth consecutive year of real GDP growth for Jamaica (Table 2A). The real
growth recorded for FY 2017/18 was a result of growth in both the Goods Producing Industry
(0.4%) and the Services Industry (1.1%).
The main contributors to growth within the Goods Producing Industry were Mining and
Quarrying (4.7%), Manufacture (1.4%) and Construction (1.1%). The growth in Mining and
Quarrying resulted from increased bauxite production reflecting higher alumina and crude
bauxite production as the Jiuquan Iron and Steel Company (JISCO) ALPART resumed
operations during the third quarter of FY 2017/18. Growth in Construction reflected increases in
both the building and other construction components. The building construction component
recorded growth in both residential and non-residential construction as there was an increase in
the number of housing starts by the National Housing Trust (NHT) during the fiscal year. The
non-residential component recorded increased activities in hotel construction and renovation as
well as construction and renovation of several commercial buildings during the fiscal year.
Manufacturing was boosted by growth in both Food, Beverages and Tobacco and Other
Manufacturing. Agriculture, Forestry and Fishing, however, declined by 2.5% for the review
period and primarily reflected the impact of above normal rainfall on domestic agricultural
production.
All eight (8) groups within the Services Industry recorded growth for FY 2017/18, with the
largest contributor being Hotels & Restaurants, which grew by 4.2%. Growth in Hotels and
Restaurants for the period primarily reflected increased stop-over arrivals from the United States
of America, Canada and Europe as well as increased airlift into the Island.
FY 2018/19- First Quarter Estimated Performance
The Jamaican economy is estimated to have grown by 1.8% during the first quarter of
FY 2018/19 when compared with the corresponding quarter of FY 2017/18. This represents an
acceleration in the rate of economic growth over the 0.1% growth rate observed for the
analogous quarter of FY 2017/18 and a further expansion of the economy from the 1.4%

Ministry of Finance and the Public Service Fiscal Policy Paper Interim Report September 2018 Page 10
recorded for the March 2018 quarter. This positive performance was driven by expansion of both
the Goods Producing and Services Industries.
The Goods Producing Industry is estimated to have grown by 5.7% and was largely driven by
estimated growth of 10.0% in Agriculture, Forestry and Fishing and 30.0% in Mining &
Quarrying. The estimated growth in Agriculture, Forestry and Fishing largely reflected the
impact of more favourable weather conditions resulting in estimated growth in Other
Agricultural Crops of 17.0% (reflecting higher production in seven of the nine crop groups),
Traditional Export Crops of 12.7% (reflecting a 44.2% increase in the production of Sugar Cane
and 0.6% increase in Banana) and Animal Farming of 3.7% (reflecting an increase in Broiler
Meat production of 3.8% and in Egg Production of 14.5%). The industry, however, continues to
be negatively impacted by the Coffee Leaf Rust disease and the Cocoa Frosty Pod disease.
Growth in Mining & Quarrying largely reflected the continued impact of resumption of
operations at Jamaica’s largest alumina refinery, JISCO ALPART, with both alumina and crude
bauxite production up by 36.3% and 9.3%, respectively. Construction continues to perform
positively, growing by an estimated 1.2% for the quarter, and reflects growth in both Building
Construction and Other Construction components. The Manufacture Industry was the only
industry within the Goods Producing Industry estimated to have contracted during the June 2018
quarter. It contracted by an estimated 0.4% and largely reflected the decline in output from the
Other Manufacturing component, which outweighed an estimated increase in output from the
Food, Beverages & Tobacco component.
The Service industry is estimated to have grown by 0.5%, reflecting growth in the following
industries: Transport, Storage and Communications; Finance and Insurance Services; Electricity
and Water; and Wholesale & Retail Trade, Repairs, Installation of Machinery & Equipment.
However, the Hotel & Restaurants industry recorded a decline of 1.5% despite a 5.2% growth in
Stopover Arrivals. It has been suggested that this seemingly contradictory result may be
attributed to the decline in the average length-of-stay by 6.7 to 7.5 nights as “visitors seek to
maximize their experience through shorter stays and multiple destinations”. Meanwhile, Cruise
Passenger arrivals grew by 3.0% and total visitors’ expenditure, increased by 4.4% to US$723.0
million.
FY 2018/19- Second Quarter and Fiscal Year Outlook
For the September 2018 quarter, the economic outlook is expected to remain positive, with an
expected growth within the 1.5% to 2.5% range. This is predicated on improved performance for
both the Goods Producing and Service industries. Growth is, primarily, expected to be driven by
Mining & Quarrying, Construction and Hotel & Restaurants industries. Notwithstanding, the
downside risk to economic growth are weather related shocks, downtime of the alumina refinery
or other manufacturing plants and slower than anticipated growth in the global economy.

Ministry of Finance and the Public Service Fiscal Policy Paper Interim Report September 2018 Page 11
Positive economic growth and strengthening in the pace of economic growth is the outlook for
the full fiscal year ending March 2019. Economic growth for FY 2018/19 was projected to range
between 2.0% - 3.0%, reflecting growth in the Mining & Quarrying, Agriculture, Forestry &
Fishing, and Construction industries.
The growth outlook for the fiscal year ending March 2019 remains positive, although the
anticipated outturn has been revised downward to 1.7% from the 2.5% indicated in the February
2018 publication of the FPP. The current forecast reflects expected growth of 4.1% in the Goods
Producing Industry and 1.0% in the Services Industry. The Jamaican economy is also expected to
benefit from continued macroeconomic stability, an uptick in domestic economic activities and
continued strengthening of the global economy.
Table 2A
Labour Market Developments
The labour market continues to show improvements, with further declines in the unemployment
rate. This improvement is reflective of the “pick-up” in the economy generally, and supported
by continued efforts to enhance the business environment, thereby increasing investments and
job creation.
According to the April 2018 Labour Force Survey which was conducted by the Statistical
Institute of Jamaica (STATIN), the unemployment rate fell by 2.5 percentage points to 9.7%
compared to April 2017 (figure 2(i)). The unemployment rate for both males and females
decreased for the period. The unemployment rate for males decreased by 2.2 percentage points to
7.3% while the female unemployment rate decreased by 2.8 percentage points to 12.5%. The
INDUSRTY FY 2015/2016 FY 2016/17 FY 2017/18 FY 2017/18:Q1 FY 2018/19:Q1
GOODS PRODUCING INDUSTRY 1.7 3.5 0.4 -3.1 5.7
Agriculture, Forestry & Fishing 1.5 11.0 -2.5 -9.0 10.0
Mining & Quarrying 0.3 -5.5 4.7 -10.9 30.0
Manufacture 2.8 2.6 1.4 1.4 -0.4
Construction 1.1 0.5 1.1 1.2 1.2
SERVICES INDUSTRY 0.8 0.7 1.1 1.1 0.5
Electricity & Water Supply 3.4 2.6 1.0 0.2 0.7
Transport, Storage & Communication 1.1 0.8 1.2 0.8 1.5
Wholesale & Retail Trade; Repair & Installation of Machinery 0.6 0.3 0.6 0.7 0.5
Finance & Insurance Services 0.9 1.3 1.2 1.5 1.0
Real Estate, Renting & Business Activities 0.5 0.5 0.7 0.5 0.5
Producers of Government Services -0.1 -0.1 0.2 0.1 0.1
Hotels and Restaurants 1.5 1.8 4.2 5.1 -1.5
Other Services 1.0 0.9 1.4 1.7 0.8
Less Financial Intermediation Services Indirectly Measured (FISIM) 1.2 1.4 1.1 1.5 1.0
REAL GDP GROWTH 1.0 1.4 0.9 0.1 1.8
Source: STATIN

Ministry of Finance and the Public Service Fiscal Policy Paper Interim Report September 2018 Page 12
unemployment rate for youth aged between fourteen and twenty-four years was 25.8% in April
2018. This represented a decrease of 3.1 percentage points relative to the unemployment rate for
this group at the similar point last year. Within this age group, male unemployment decreased by
4.7 percentage points moving to 20.9% while for females it fell by 1.1 percentage points to
32.1%. The reduction in the unemployment rate reflected the combined effect of a 1.2% (14,700
persons) growth in the employed labour force and a 1.5% (20,700 persons) growth in the number
of persons in the labour force. This reduction in the labour force resulted from: (1) a natural
increase in the working age population by 1,300 persons, that is, persons 14 years and older; and
(2) an increase of 22,000 persons classified outside the labour force.
Figure 2(i): Unemployment Rate April 2013 to April 2018
The Industry group that led the improvement in employment was ‘Wholesale & Retail Repair of
Motor Vehicle and Equipment’ which recorded an increase of 13,300 persons (5.8%). The level
of employment for the period was however offset by reductions in other industries, most notably
‘Agriculture, Hunting, Forestry & Fishing’ which experienced a decline of 11,000 persons
(5.2%).
Monetary Developments
During the June 2018 quarter, the BOJ maintained its accommodative monetary stance by
lowering its signal rate, (the rate the Bank pays on overnight deposit instruments held by deposit-
taking institutions (DTIs)), by 75 basis points on two occasions to 2.0%. The policy action was
motivated by the BOJ’s assessment that the inflation rate for the next eight (8) quarters will be
within the inflation target range of 4.0% to 6.0%. In addition, the Government’s continued
commitment to fiscal consolidation under the PSBA supported this move.

Ministry of Finance and the Public Service Fiscal Policy Paper Interim Report September 2018 Page 13
Consistent with the signal rate decline and continued strong demand for liquid assets, money
market rates also declined during the June 2018 quarter (figure 2(ii)).
Figure 2(ii): T-Bills
The continued robust growth in private sector loans was also reflected in the performance of the
monetary aggregates, as evidenced by expansion in the monetary base. This increase was
reflected in larger currency stock and higher levels of commercial banks’ cash reserves. The
main source of growth in the monetary base was the increase in the NIR, the impact of which
was partially offset by a contraction in net domestic assets (NDA). The increase in the NIR was
associated with investment income inflows as well as net public sector entities purchases, the
impact of which was partly offset by GOJ debt payments.
Inflation
The All Jamaica ‘All Divisions’ Consumer Price Index increased from 243.4 at the end of
August 2017 to 252.8 at the end of August 2018, representing a twelve-month inflation rate of
3.9% (Table 2B). Relative to the 4.4% recorded for the twelve-month period up to end-August
2017, this inflation rate is 0.5 percentage point lower.
The largest increases over the period were registered by the divisions: ‘Housing, Water,
Electricity, Gas and Other Fuels’, ‘Furnishings, Household Equipment and Routine Household
Maintenance’, ‘Food and Non-Alcoholic Beverages’ and ‘Transport’. The period’s inflation
largely reflected the impact of higher energy and transport costs associated with increases in
international crude oil prices, and higher domestic agricultural prices associated with flood rains
during the December 2017 quarter. In addition, the upward movement in the ‘Furnishings,
Household Equipment and Routine Household Maintenance’ division reflected the increase in
the National Minimum Wage by approximately 13.0%.
Data from the Statistical Institute of Jamaica (STATIN) indicates that the inflation rate for
August 2018 was 0.9%. The upward movement in the CPI was mainly attributed to a 1.6%
increase in the heavily weighted ‘Food and Non-Alcoholic Beverages’ division. This was
primarily due to higher prices for agricultural produce, particularly in the class ‘Vegetable and

Ministry of Finance and the Public Service Fiscal Policy Paper Interim Report September 2018 Page 14
Starchy Foods’ where higher prices were recorded for produce such as carrot, cabbage, lettuce,
string beans and irish potato. Also, of note was the 3.0% increase in the CPI for the division
‘Furnishings, Household Equipment and Routine Household Maintenance’ which was largely
driven by the class ‘Goods and Services for Routine Household Maintenance’. This movement
was due to the increase in the National Minimum Wage by approximately 13.0%. The only
division to record a decline in its index was ‘Housing, Water, Electricity, Gas and Other Fuels’
as the group ‘Electricity, Gas and Other Fuels’ recorded a 0.6% decline in its index reflecting a
fall in electricity rates.
Table 2B
Inflation for the calendar year up to end-August 2018 was 1.6%, and 1.9% for the fiscal year to
end-August 2018.
Exchange Rate
At end-August 2018, the selling rate of the US Dollar was J$137.01 = US$1.00, compared to
J$129.65 = US$1.00 at the end of August 2017. This 5.7% rate of depreciation was significantly
faster than the 1.6% 12-month depreciation at the similar point last year. The selling rate of the
US Dollar was J$130.39 = US$1.00 at the end of the first quarter of FY 2018/19, reflecting a rate
of depreciation of 3.5% for the quarter compared to a marginal appreciation for the
corresponding period of FY 2017/18. The uptick in the pace of depreciation for the June 2018
quarter is partly attributable to an increase in demand by agents seeking to reduce their foreign
currency liabilities in a context of buoyant Jamaica dollar liquidity and lower borrowing rates.
Jun 2017
Index
Aug 2017
Index
Dec 2017
Index
Mar 2018
Index
Jun 2018
Index
Jul 2018
Index
Aug 2018
Index
Monthly
%
change
for Aug
2018
FY 18/19:
Q1 (%
change)
Annual
%
change at
Jun 2018
Annual
%
change at
Aug 2018
FY 18/19
to Aug
2018 (%
change)
CY 2018
to Aug
2018
(%
change)
ALL DIVISIONS - ALL
ITEMS 241.2 243.4 248.7 248.1 248.0 250.4 252.8 0.9 0.0 2.8 3.9 1.9 1.6
1 Food and Non-Alcoholic
Beverages 300.0 305.5 313.6 308.2 308.7 311.5 316.6 1.6 0.2 2.9 3.6 2.7 1.0
2 Alcoholic Beverages and
Tobacco 304.1 306.4 310.8 312.5 313.0 313.1 313.3 0.1 0.2 2.9 2.3 0.3 0.8
3 Clothing and Footwear 236.6 237.4 240.1 241.2 242.4 242.8 243.1 0.1 0.5 2.5 2.4 0.8 1.2
4 Housing, Water,
Electricity, Gas and
Other Fuels 230.3 228.4 239.0 247.0 239.7 247.9 247.7 -0.1 -3.0 4.1 8.5 0.3 3.6
5 Furnishings, Household
Equipment and Routine
Household Maintenance
234.7 235.1 236.7 237.7 238.8 239.3 246.5 3.0 0.5 1.7 4.8 3.7 4.1
6 Health 146.3 146.7 147.6 147.8 148.8 149.0 149.0 0.0 0.7 1.7 1.6 0.8 0.9
7 Transport 207.4 207.9 210.0 210.0 213.4 215.2 215.3 0.0 1.6 2.9 3.6 2.5 2.5
8 Communication 66.9 66.9 67.1 67.1 67.1 67.1 67.1 0.0 0.0 0.3 0.3 0.0 0.0
9 Recreation and Culture 188.8 191.3 192.2 192.7 193.9 194.1 194.9 0.4 0.6 2.7 1.9 1.1 1.4
10 Education 190.3 190.3 194.4 195.4 195.4 195.4 195.4 0.0 0.0 2.7 2.7 0.0 0.5
11 Restaurants and
Accommodation Services 193.7 193.9 196.1 196.5 197.1 197.5 197.5 0.0 0.3 1.8 1.9 0.5 0.7
12 Miscellaneous Goods
and Services 230.5 231.0 232.5 235.0 235.8 236.1 236.4 0.1 0.3 2.3 2.4 0.6 1.7
All Jamaica ‘All Divisions’ and Division Indices and Movements
(Base period December 2006 = 100)
Source: STATIN

Ministry of Finance and the Public Service Fiscal Policy Paper Interim Report September 2018 Page 15
For the 2018 calendar year to end-August, the domestic currency depreciated by 9.6% compared
to the 0.9% depreciation for the comparable period of calendar year 2017.
External Sector
The Current Account balance worsened for FY 2017/18 and amounted to a deficit of
US$812.7mn, US$440.7mn higher than the deficit of US$372.0mn reported for FY 2016/17. As
a percent of GDP, the Current Account deficit increased from 2.6% in FY 2016/17 to 5.4% in
FY 2017/18 (figure 2(iii)). With the exception of the Primary Income sub-account, the balance
on all sub-accounts deteriorated. Despite a modest increase in exports, the Goods and Services
sub-account worsened as a result of a much larger increase in imports. The expansion in exports
was largely driven by increased earnings from alumina and non-traditional exports. Of note,
higher earnings from alumina reflected the impact of increases in both volume and value.
Net earnings in Services increased by US$175.9mn or 17.3% to US$1,194.2mn in FY 2017/18.
Of note, the increase in the Services sub-account was largely reflective of an increase of
US$309.3mn or 12.1% in Travel. This was partly offset by a reduction in Transportation and
Other Services.
Figure 2(iii): Current Account Balance
The deficit on the Primary Income sub-account improved by US$87.6mn or 14.7% for
FY 2017/18. This primarily reflected lower direct and portfolio investment outflows for the
period. The Secondary Income sub-account remained relatively flat for the review period. The
Ministry of Finance and the Public Service Fiscal Policy Paper Interim Report September 2018 Page 16
Capital Account worsened, and together with the deficit in the Current Account yielded a net
borrowing balance on the Capital and Current Account.
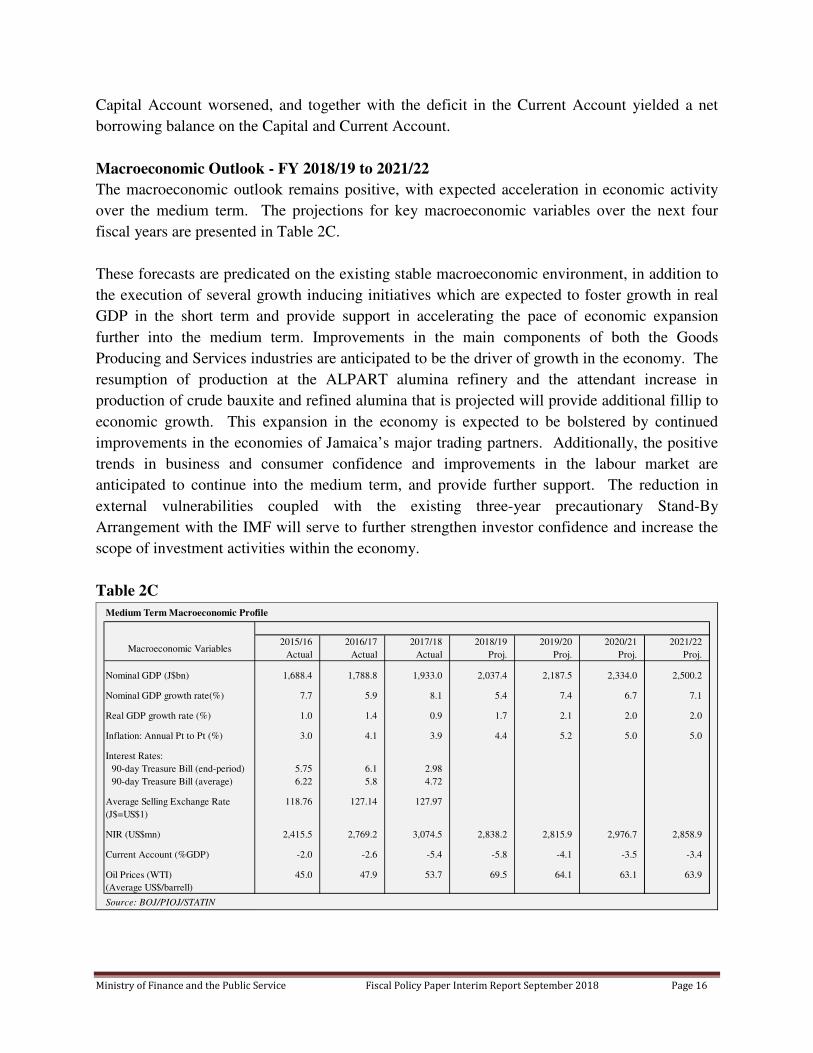
Macroeconomic Outlook - FY 2018/19 to 2021/22
The macroeconomic outlook remains positive, with expected acceleration in economic activity
over the medium term. The projections for key macroeconomic variables over the next four
fiscal years are presented in Table 2C.
These forecasts are predicated on the existing stable macroeconomic environment, in addition to
the execution of several growth inducing initiatives which are expected to foster growth in real
GDP in the short term and provide support in accelerating the pace of economic expansion
further into the medium term. Improvements in the main components of both the Goods
Producing and Services industries are anticipated to be the driver of growth in the economy. The
resumption of production at the ALPART alumina refinery and the attendant increase in
production of crude bauxite and refined alumina that is projected will provide additional fillip to
economic growth. This expansion in the economy is expected to be bolstered by continued
improvements in the economies of Jamaica’s major trading partners. Additionally, the positive
trends in business and consumer confidence and improvements in the labour market are
anticipated to continue into the medium term, and provide further support. The reduction in
external vulnerabilities coupled with the existing three-year precautionary Stand-By
Arrangement with the IMF will serve to further strengthen investor confidence and increase the
scope of investment activities within the economy.
Table 2C
Macroeconomic Variables2015/16
Actual
2016/17
Actual
2017/18
Actual
2018/19
Proj.
2019/20
Proj.
2020/21
Proj.
2021/22
Proj.
Nominal GDP (J$bn) 1,688.4 1,788.8 1,933.0 2,037.4 2,187.5 2,334.0 2,500.2
Nominal GDP growth rate(%) 7.7 5.9 8.1 5.4 7.4 6.7 7.1
Real GDP growth rate (%) 1.0 1.4 0.9 1.7 2.1 2.0 2.0
Inflation: Annual Pt to Pt (%) 3.0 4.1 3.9 4.4 5.2 5.0 5.0
Interest Rates:
90-day Treasure Bill (end-period) 5.75 6.1 2.98
90-day Treasure Bill (average) 6.22 5.8 4.72
Average Selling Exchange Rate 118.76 127.14 127.97
(J$=US$1)
NIR (US$mn) 2,415.5 2,769.2 3,074.5 2,838.2 2,815.9 2,976.7 2,858.9
Current Account (%GDP) -2.0 -2.6 -5.4 -5.8 -4.1 -3.5 -3.4
Oil Prices (WTI) 45.0 47.9 53.7 69.5 64.1 63.1 63.9
(Average US$/barrell)
Source: BOJ/PIOJ/STATIN
Medium Term Macroeconomic Profile

Ministry of Finance and the Public Service Fiscal Policy Paper Interim Report September 2018 Page 17
There are however, downside risks to the medium-term projections. These include weaker
external demand arising from slower than anticipated global growth and Jamaica’s vulnerability
to adverse weather hazards.
The average growth in real GDP for the four-year period between FY 2018/19 and FY 2021/22 is
projected to be 2.0%. A slight increase in the inflation rate is expected for FY 2018/19 and
FY 2019/20, followed by stabilization around the 5.0% mark for the two fiscal years thereafter.
The current account deficit as a percentage of GDP is projected to average about 4.2% between
FY 2018/19 and FY 2021/22.

Ministry of Finance and the Public Service Fiscal Policy Paper Interim Report September 2018 Page 18
PART 3
FISCAL MANAGEMENT STRATEGY
Background
Prudent fiscal management is an essential element to achieve long-term growth and economic
development. As Jamaica approaches the end of the three-year Precautionary Stand-By
Arrangement (PSBA) with the International Monetary Fund, the Government of Jamaica (GOJ)
remains committed to achieving its fiscal objectives. To that end, the GOJ has announced its
intention to establish a Fiscal Council in Jamaica. A Jamaican Fiscal Council would be the
guardian, interpreter and arbiter of Jamaica’s fiscal rules. It would also monitor Jamaica’s
compliance with the fiscal responsibility rules and keep the public aware and updated on fiscal
matters. Activities under the IMF programmes have contributed to a reduction in macroeconomic
vulnerabilities and improvements in the macro-economy that have been positively received by
the country’s international partners and investors. This was affirmed by Moody’s Investors
Service in the strengthening of their long-term foreign currency Issuer Default ratings for
Jamaica from B3 “stable” to B3 “positive” in July 2018. This followed a similar improved
revision by Fitch Ratings agency in January 2018. The gains achieved to date provide a catalyst
to further entrench fiscal responsibility as a viable means of attaining fiscal and debt
sustainability alongside sustained economic growth.
Tax Revenue collections remained buoyant over the first four months of the fiscal year,
contributing to improved fiscal and primary balances. Maintenance of the improved flows will
enable the GOJ to, inter alia, invest in strategic growth-inducing capital projects, lower the
public debt and reduce existing arrears.
The Fiscal Management Strategy presents an overall assessment of Jamaica’s fiscal performance,
and offers insight into the projected evolution of the GOJ’s fiscal operations over the medium
term through the following sections:
● An assessment of FY 2017/18 performance;
● A summary of the FY 2018/19 Budget;
● The implications of the FY 2017/18 Outturn on the FY 2018/19 Budget;
● A review of the Central Government’s Performance: April - July 2018;
● An update on the Public Debt and Self Financing Public Bodies; and
● A revised Medium Term Outlook.

Ministry of Finance and the Public Service Fiscal Policy Paper Interim Report September 2018 Page 19
Central Government Performance: FY 2017/18 Outturn
The fiscal outturn for FY 2017/18 was better than the estimated outturn presented in the
February 2018 Annual Fiscal Policy Paper. The operations of the Government for the fiscal year
generated a fiscal surplus of $8,723.4mn. This represents a significant positive variance from the
$1,765.0mn surplus estimated in February and reflects an even greater improvement relative to
the $6,070.2mn deficit projected in the FY 2017/18 Revised Budget1.
Similar to the Fiscal Balance, the Primary Balance also showed improvement. The Primary
Balance outturn was $143,904.4mn, which was $7,977.9mn higher than February’s estimate and
$12,420.1mn higher than the Revised Budget (Table 3A). This actualized balance represents
7.4% of GDP and surpasses the Primary Balance target of 7.0%.
For the fiscal year, Debt Service was higher (0.4%) than the February estimate but 3.0% lower
than the Revised Budget. As a percentage of GDP, the actual Debt Service is 1.1 percentage
points less than the Revised Budget and 0.4 percentage point less than the February estimate.
Revenue & Grants
Revenue & Grants for FY 2017/18 was $560,773.6mn, reflecting an improvement of 1.3% and
1.4% relative to the Revised Budget and the February 2018 Fiscal Policy Paper (FPP) estimates,
respectively. The over performance of the Revenue & Grants category by $7,211.5mn above
budget was primarily due to Tax Revenue. Total Tax Revenue collections were $496,894.6mn,
$6,969.9mn or 1.4% higher than budget. The better than budgeted performance relates to a
wider tax net as a result of increased employment, alongside improvements in administration and
compliance. High performing tax types included Company Tax, Pay-As-You-Earn (PAYE), Tax
on Interest, Special Consumption Tax (SCT) Local, Education Tax and Betting Gaming and
Lotteries.
Non-Tax Revenue for FY 2017/18 totalled $53,249.9mn, falling short of the revised Budget by
1.8% but was broadly in line with the estimate presented in the Annual FPP. Capital Revenue
amounted to $4,887.1mn, exceeding the Revised Budget estimate by $1,490.1mn and the Annual
FPP estimate by $1,085.0mn. This over-performance was primarily due to higher than budgeted
loan repayments. Grant receipts of $5,614.4mn were recorded for FY 2017/18, which was
slightly lower than the Revised Budget projection but $1,100.8mn more than the amount
estimated in the Annual FPP, due partially to higher than programmed project disbursements.
Despite the nominal growth in Revenue & Grants, as a percentage of GDP there was a decline by
0.3 percentage point. This was largely due to the fact that GDP growth outstripped the growth in
the Tax Base.
1 In March 2018, a second supplementary budget was approved. (see Table 3A)

Ministry of Finance and the Public Service Fiscal Policy Paper Interim Report September 2018 Page 20
Expenditure
The Expenditure outlays (net of amortization) for FY 2017/18 was $552,050.2mn which was
$7,852.1mn or 1.4% lower than the Revised Budget and $851.9mn or 0.2% higher than the
February 2018 FPP estimate. As a percentage of GDP, the actualized figure for expenditures
was 28.6% against the 29.7% and 29.2% statistics for the Revised Budget and February
estimates respectively.
Recurrent Non-Interest Expenditure of $370,063.0mn was 0.9% and 0.5% less than the Revised
Budget and the Annual FPP estimate. This shortfall was the result of some under executed
planned expenditures by Ministries, Departments and Agencies (MDAs). Compensation of
Employees was $1,191.7mn below the Revised Budget. Contributing to the shortfall were delays
in the recruitment of personnel for: the Police Force; the Correctional Services; the Ministry of
Justice; and the restructured Accountant General’s Department. Additionally, under Programmes
there were processing delays as it relates to pension payments and lower execution of the budget.
Recurrent Interest Expenditure of $135,181.0mn was 1.7% lower than the Revised Budget and
slightly higher than the Annual FPP estimate by 0.2%. This outlay benefitted from appreciation
of the Jamaica dollar relative to the United States dollar (USD) over the last two months of the
fiscal year.
Table 3A: FY 2017/18 Performance ($mn)
Budget Feb 2018 FPP
Est. Actual
% Diff between
Budget and Actual
% Diff between FPP
Est. and Actual
Revenue & Grants 553,562.1 552,963.3 560,773.6 1.3 1.4
Tax Revenue 489,924.8 491,110.1 496,894.6 1.4 1.2
Expenditure 559,632.3 551,198.3 552,050.1 -1.4 0.2
Recurrent Non-Interest 373,596.5 371,866.0 370,063.0 -0.9 -0.5
Interest 137,554.5 134,161.5 135,181.0 -1.7 0.8
Capital 48,481.3 45,170.8 46,806.1 -3.5 3.6
Fiscal Balance -6,070.2 1,765.0 8,723.4 -243.7 394.2
Debt Service 378,908.0 366,059.1 367,470.9 -3.0 0.4
Interest 137,554.5 134,161.5 135,181.0 -1.7 0.8
Principal 241,353.5 231,897.6 232,289.9 -3.8 0.2
Overall Balance -36,221.8 -32,705.2 -19,294.1 -46.7 -41.0
Primary Balance 131,484.3 135,926.5 143,904.4 9.4 5.9
GDP 1,892,612.1 1,887,800.0 1,932,998.0 2.1 2.4
Source: MOFPS, BOJ, STATIN

Ministry of Finance and the Public Service Fiscal Policy Paper Interim Report September 2018 Page 21
Table 3B: FY 2017/18 Performance as a Percentage of GDP2
Revised Budget Feb 2018 FPP
Est. Actual
% Point Diff
between Budget
and Actual
% Point Diff
between FPP Est.
and Actual
Revenue & Grants 29.2 29.3 29.0 -0.2 -0.3
Tax Revenue 25.9 26.0 25.7 -0.2 -0.3
Expenditure 29.6 29.2 28.6 -1.0 -0.6
Recurrent Non-Interest 19.7 19.7 19.1 -0.6 -0.6
Interest 7.3 7.1 7.0 -0.3 -0.1
Capital 2.6 2.4 2.4 -0.1 0.0
Fiscal Balance -0.3 0.1 0.5 0.8 0.4
Debt Service 20.0 19.4 19.0 -1.0 -0.4
Interest 7.3 7.1 7.0 -0.3 -0.1
Principal 12.8 12.3 12.0 -0.7 -0.3
Overall Balance -1.9 -1.7 -1.0 0.9 0.7
Primary Balance 7.0 7.2 7.4 0.4 0.2
Source: MOFPS, BOJ, STATIN
Capital Expenditure of $46,806.1mn is lower than the Revised Budget by 3.5%, but higher than
the Annual FPP estimate by 3.6%. Compared to the Revised Budget, the shortfall was primarily
due to the slower than anticipated pace of capital project implementation, influenced partly by
unfavourable weather conditions. Capital Expenditure for FY 2017/18 was 2.4% of GDP, which
was similar to the ratio estimated in the Annual FPP and 0.2 percentage point less than the ratio
presented in the Revised Budget.
Expenditure Budget FY 2018/19
Prudent expenditure management is a key pillar in the GOJ’s Fiscal Management Strategy. The
approved Expenditure Budget (excluding Amortization) for FY 2018/19 is $586,480.6mn, equal
to 29.1% of GDP. This budget is $35,282.3mn or 6.4% higher than the expenditure estimate
presented in the Annual FPP for FY 2017/183.
Non-Debt Recurrent Expenditure is budgeted at $389,707.5mn or 19.3% of GDP. Of this total,
$188,656.1mn was allocated for Programmes Expenditure, up by 7.5% over the FY 2017/18
estimate. This increased allocation is consistent with the expanded budget for the Ministry of
National Security and provisions made for the Special Early Retirement Programme (SERP).
2 With the exception of inflation 3 Estimates were produced in the February edition of the Fiscal Policy Paper.

Ministry of Finance and the Public Service Fiscal Policy Paper Interim Report September 2018 Page 22
Compensation of Employees, budgeted at $201,051.4mn, is up $4,715.4mn or 2.4%. The
increased allocation includes provision for higher Wages and Salaries in accordance with the
new Wage Agreement and financing for an expansion in the staff size of the Jamaica Defence
Force.
Interest payments are budgeted at $136,947.9mn (6.8% of GDP) for the fiscal year, up by 2.1%.
Domestic Interest payments are budgeted to be 2.8% lower than the previous fiscal year while
External Interest payments are expected to be 6.4% higher. The increase in budgeted External
Interest payments reflected an expected net depreciation of the Jamaica dollar.
The Capital Expenditure budget is $59,825.1mn (3.0% of GDP) and represents an increase of
32.4% over the last fiscal year. Of this increase, 96.0% is programmed under the works portfolio
for the Major Infrastructure Development Programme (MIDP) and the Southern Coastal
Highway Improvement Project (SCHIP). Allocations were also made to the Ministry of National
Security and the Ministry of Finance and the Public Service, for crime fighting initiatives and a
contingency to facilitate public investment projects, respectively.
Table 3C: FY 2018/19 Revenue & Expenditure Budget vs. FY 2017/18 FPP Estimate ($mn)4
2017/18 est 2018/19 % Change
Revenue & Grants 552,963.3 590,588.3 6.8
Tax Revenue 491,110.1 518,435.1 5.6
Non-Tax Revenue 53,409.8 60,880.4 14.0
Bauxite Levy 127.5 126.0 -1.2
Capital Revenue 3,802.2 2,088.1 -45.1
Grants 4,513.6 9,058.7 100.7
Expenditure 551,198.3 586,480.6 6.4
Non-Debt Recurrent 371,866.0 389,707.5 4.8
Recurrent Interest 134,161.5 136,947.9 2.1
Capital Expenditure 45,170.8 59,825.1 32.4
Source: MOFPS
Revenue & Grants Budget FY 2018/19
With no new tax measures introduced for the fiscal year, Revenues and Grants are programmed
in the approved budget to be $590,588.4mn (29.3% of GDP), an increase of $37,625.0mn or
6.8% over the FY 2017/18 estimate presented in the Annual FPP 5. The main source of this
growth, Tax Revenues, is projected to increase as a result of the pick-up in economic activities
and the administrative and compliance initiatives of the revenue agencies. The budgeted Tax
4 The FY 2017/18’s forecast was extracted from the Fiscal Policy Paper FY 2018/19. 5 Estimates were produced in the February edition of the Fiscal Policy Paper.
Ministry of Finance and the Public Service Fiscal Policy Paper Interim Report September 2018 Page 23
Revenue is $518,435.1mn or 25.7% of GDP, representing an increase of 5.6% over the
FY 2017/18 estimate.
Non-Tax Revenue collections constitute 10.3% of the Revenue & Grants budget. The
programmed collections of $60,880.4mn reflect growth of 14.0% over last year. These revenue
projections include receipts from the Customs Administration Fees, transfers from three
de-earmarked entities and a special distribution from the PetroCaribe Development Fund
(PCDF).
The temporary bauxite levy regime modification for the sector is still in effect and has altered the
levy collections significantly. The FY 2018/19 collections are expected to be $126.0mn, a
decrease of 1.2% compared to the estimate presented in the Annual FPP.
Capital Revenue is programmed at $2,088.1mn (0.1% of GDP) and represents a decrease of
45.1% over last year. This decrease is anticipated as there was a one-off spike last fiscal year
associated with a loan repayment by the Airport Authority of Jamaica (AAJ).
Grants of $9,058.7mn (0.4% of GDP) is forecast for FY 2018/19, more than doubling the
estimate presented in the Annual FPP. This increase is due to budgetary support from the
European Union (EU) associated with the achievement of conditions under the Justice Sector
Reform Programme and the second tranche disbursement under the Accompanying Measures for
Sugar (AMS) Protocol Countries, 2013 Financing Agreement.
Impact of FY 2017/18 Outturn on FY 2018/19 Budget
The fiscal surplus achieved at the end of FY 2017/18 is in line with the programmed fiscal
surpluses over the medium term. Relative to the FY 2017/18 actual outturn, inflows from
Revenue and Grants for FY 2018/19 are expected to grow by $29,814.8mn or 5.3% with Tax
Revenue contributing $21,540.5mn to the growth. Due to the higher FY 2017/18 Tax Revenue
outturn relative to the estimate presented in the February 2018 FPP, the programmed Tax
collections for FY 2018/19 represent a growth of 4.3%, down from the 5.6% stated in the Annual
FPP. Non-Tax Revenue has a budgeted growth of 14.3% over FY 2017/18 which is greater than
the 14.0% identified in the February 2018 FPP.
The FY 2018/19 budget for Capital Revenue is 57.3% lower than the actual outturn for the last
fiscal year, compared to the 45.1% indicated in the Annual FPP. The actual receipts from the
Bauxite Levy for FY 2017/18 do not have a distortionary impact on the FY 2018/19 budget as
collections mirrored the estimate presented in the Annual FPP. Based on the actual inflows from
Grants for FY 2017/18, the budgeted receipts for FY 2018/19 are 61.3% higher instead of
100.7% as was presented in the Annual FPP.

Ministry of Finance and the Public Service Fiscal Policy Paper Interim Report September 2018 Page 24
Table 3D: FY 2018/19 Revenue & Expenditure Forecast vs. FY 2017/18 Actual ($mn)
2017/18 act 2018/19 % Change
Revenue & Grants 560,773.57 590,588.33 5.3
Tax Revenue
496,894.6
518,435.1 4.3
Non-Tax Revenue
53,249.9
60,880.4 14.3
Bauxite Levy
127.5
126.0 -1.2
Capital Revenue
4,887.1
2,088.1 -57.3
Grants
5,614.4
9,058.7 61.3
Expenditure 552,050.15 586,480.56 6.2
Non-Debt Recurrent
370,063.0
389,707.5 5.3
Recurrent Interest
135,181.0
136,947.9 1.3
Capital Expenditure
46,806.1
59,825.1 27.8
Source: MOFPS
Relative to the FY 2017/18 actual outturn, Expenditure is programmed to grow by 6.2% rather
than the 6.4% presented in the Annual FPP. The increase in Non-Debt Recurrent Expenditure is
expected to be higher than indicated in the Annual FPP, with a growth of 5.3% compared to the
previously stated 4.8%. On the other hand, a lower growth of 1.3% in Recurrent Interest is
programmed versus the 2.1% growth originally presented. Given that actual Capital
Expenditures were higher than the February 2018 estimate, the amount budgeted for
FY 2018/19 is 27.8% higher compared to the 32.4% growth reported in the Annual FPP.
Central Government Performance: April-July 2018
For the period April to July 2018, the main fiscal indicators have continued to demonstrate
robust performance. This emanates from higher than anticipated revenue collections and lower
than programmed expenditures. The strong revenue performance materialized despite the policy
decision not to impose any new tax measures for the current fiscal year. The growth in the
individual tax types is therefore attributable to the continued compliance efforts by the tax

Ministry of Finance and the Public Service Fiscal Policy Paper Interim Report September 2018 Page 25
collecting agencies (TAJ and JCA), improvement in the macroeconomic environment as well as
favourable changes in certain international parameters relative to expectations at the time of the
development of the FY 2018/19 budget.
Figure 3A: April – July Fiscal and Primary Balances from FY 2014/15-FY 2018/19
The fiscal and the primary balance trends over the last five (5) years illustrate that through the
concerted efforts of the GOJ to pursue fiscal discipline, the country has been able to achieve a
lower fiscal deficit and a higher primary balance (see Figure 3A). For FY 2018/19, the fiscal
deficit of $3,024.7mn was 76.9% (or $10,070.9mn) lower than budgeted deficit of $13,095.5mn
while the primary balance of $38,235.1mn was 15.2% (or $5,033.9mn) higher than the projected
$33,201.2mn. In comparison to the April to July outturn for FY 2017/18, the current fiscal deficit
is $2,954.1mn lower while the primary balance is approximately equal.
Revenue & Grants Outturn
The provisional Revenue & Grants outturn for April to July 2018 reflects a substantial positive
variance relative to budget. Specifically, inflows from Revenue & Grants amounted to
$185,511.1mn which was $2,645.8mn (or 1.4%) higher than budget. This over-performance is
mainly accredited to Tax Revenue receipts, which were $5,748.9mn higher than programmed
and, to a lesser extent, Capital Revenue flows which were $293.6mn above projection. The
performance of Revenue & Grants was stymied by the $3,021.7mn lower than projected Grant
inflows and the below budget collections from Non-Tax Revenue which were $375.0mn short of
the projection. Compared to the corresponding period in FY 2017/18, Revenue & Grants grew by
11.6% or $19,296.9mn mainly driven by increased inflows from Tax and Non-Tax Revenue
sources. Grants and collections from all other Revenue sources were lower relative to receipts
for the corresponding period last year.
-14,894.0
-3,024.7
25,348.738,235.1
-40,000.0
-20,000.0
0.0
20,000.0
40,000.0
60,000.0
FY 2014/15 FY 2015/16 FY 2016/17 FY 2017/18 FY 2018/19
Mil
lio
n (
JMD
)
Fiscal Balance Primary Balance

Ministry of Finance and the Public Service Fiscal Policy Paper Interim Report September 2018 Page 26
Tax Revenue
Tax Revenue has demonstrated, for the fourth year, stronger than projected collections (see
Figure 3B). Collections for Tax Revenue totalled $168,407.1mn or 3.5% over the budget and
9.6% higher than last fiscal year.
Figure 3B: April – July Tax Revenue Deviation from FY 2014/15-FY 2018/19
All the tax categories have contributed to the higher Tax Revenue outturn (see Figure 3B). The
Production and Consumption category reflected the highest increase relative to the budget (up by
5.0%), followed by International Trade taxes (up by 2.9%) and the Income and Profit (up by
2.3%). The continued improvement in the real sector has influenced growth in the tax category
‘Production and Consumption’. The Income & Profit category has been similarly impacted.
International Trade taxes benefited from better than anticipated domestic and external
macroeconomic conditions. The continued tax buoyancy has provided an anchor for progress
towards fiscal sustainability.
Income & Profit
The taxes collected from Income & Profit amounted to $39,231.1mn, which was 2.3% higher
than budget. This positive outturn was mainly due to the Tax on Interest category which
superseded the budgeted amount and was able to cushion the shortfall from the other tax types in
the category. Tax on Interest recorded $6,480.9mn in collections which was $1,715.5mn higher
than the budget due to stronger compliance mechanisms employed by the TAJ and increased
withholding tax flows from private sector sources.
Corporate Income Tax (CIT) was $501.4mn lower than budget for the period. This
underperformance mainly stemmed from the July 2018 collections (shortfall of 65.2%) as CIT
900.2
2,965.3
1,883.5
5,748.9
-2000
0
2000
4000
6000
8000
FY 2014/15 FY 2015/16 FY 2016/17 FY 2017/18 FY 2018/19
Income and Profit Production and Consumption
Environmental Levy International Trade
Tax Revenue

Ministry of Finance and the Public Service Fiscal Policy Paper Interim Report September 2018 Page 27
payments, which are due quarterly6, were generally on target up to the quarter ending June 2018.
The receipts for July 2018 reflected an anomaly relative to the collections for the last 4 years.
Also, with the increased compliance activities by the TAJ, on-time filing and payment rates have
increased and lowered the arrears payments normally observed in the month of July.
Similar performances were recorded for the other tax types with a quarterly payment structure
(PAYE, Other Individuals and Tax on Dividend, which were below budget by $140.4mn,
$91.8mn and $81.7mn, respectively).
Production & Consumption
With the Jamaican economy experiencing thirteen (13) consecutive quarters of positive growth
and the pace of expansion accelerating, this has augured well for the tax collected from the
Production and Consumption category. During the review period General Consumption Tax
(GCT) superseded expectations with collections totalling $32,987.8mn, which was $1,055.0mn
above the budget and is consistent with the positive trend in GDP growth. GCT (Local) which
also exceeded collections for the similar period last year (up $4,237.2mn) positively contributed
to the overall revenue surplus (see Table 3E). Similarly, the Betting Gaming and Lottery
collections recorded a $445.5mn increase over the budget. This is in light of the increased
participation in lotteries from both locals and visitors to the island. The Betting Gaming and
Lottery tax was 61.9% higher than collections for the corresponding period of last year.
Table 3E: Performance of Major Tax types April to July 2018
Tax Type
Shares of Tax
Revenue
Collected
Deviation from
Budget
Projection (%)
Change
over prior
year (%)
% Contribution to
deviation relative
to budget
Custom Duty 8.7% 3.0% 11.0% 6.5%
Education tax 6.1% 4.5% 7.7% 6.7%
GCT Imports 18.5% 6.0% 11.3% 26.9%
GCT Local 21.5% 3.3% 14.7% 17.6%
Other Companies 8.4% -3.8% -2.2% -8.4%
PAYE 12.1% -0.8% 9.0% -2.3%
SCT Imports 10.3% -5.8% 14.3% -16.3%
SCT Local 5.7% 13.7% -22.9% 17.6%
Also evident from the improved economic conditions was an uptick in Contractors Levy, Other
Licenses and Minimum Business Tax (MBT). These tax types realized 27.2%, 17.2% and 12.6%
higher than budgeted flows, respectively. The improved collection for these three (3) tax types
6 March, June, September and December annually

Ministry of Finance and the Public Service Fiscal Policy Paper Interim Report September 2018 Page 28
coincides with continued growth in the construction sector and high business confidence. These
three taxes also showed substantial growth over the corresponding period of last year (see
Appendix I - Table A2).
Special Consumption Tax (SCT) and Environmental Levy also contributed to the increased
revenue flow. SCT collections of $8,722.7mn was $1,050.7mn higher than budget and reflected
significant payments related to production of both refined petroleum products (prior to
shutdown) as well as alcoholic beverages. Environmental Levy generated a 10.6% higher than
programmed flow.
International Trade
The International Trade category achieved a surplus of $1,883.5mn, with collections totalling
$66,345.1mn. All the import taxes performed better than expected, with the exception of SCT
(Imports) which had a shortfall of $973.9mn. The trade taxes benefited from a higher than
programmed exchange rate and higher core imports, among other factors. The highest positive
deviation emanated from GCT Imports, amounting to $1,612.1mn. This resulted from continued
improvement in efficiency at the ports, specifically as it pertains to post clearance audits and the
effectiveness of the contraband enforcement activities. Better economic conditions and the
resulting expansion of imports have contributed to the increased collection from GCT (Imports),
Customs Duty and Stamp Duty. Travel Tax collected for the period was also above target by
$735.1mn or 11.9%, consistent with higher than expected tourist arrivals.
Other Revenue
Non-Tax Revenue for April to July amounted to $14,938.3mn, which was broadly in line with
the budget. Included in the overall collections were Custom Administration Fee (CAF) transfers
amounting to $1,197.7mn, NHT programmed transfer of $2,850.0mn, De-Earmarked Funds,
Royalties as well as miscellaneous receipts from Ministries, Departments and Agencies (MDAs).
Capital Revenue of $562.7mn contributed to the positive Revenue outturn, with the realization of
higher than programmed inflows. This was due in part to the higher than anticipated exchange
rate applied to the scheduled loan repayment received. Grants, on the other hand, were
significantly below budget. Grants inflow amounted to $1,603.0mn compared to the programmed
$4,624.8mn. This was due to a programmed disbursement from the EU being delayed and
rescheduled for later in the fiscal year.
There were no Bauxite Levy receipts scheduled or received for the review period.

Ministry of Finance and the Public Service Fiscal Policy Paper Interim Report September 2018 Page 29
Expenditure
The Central Government Expenditure (net of amortization) amounted to $188,535.8mn. This
spending was $7,425.0mn or 3.8% lower than programmed. The underutilization of the budget
allocation was due to a lower outlay from the Recurrent Expenditure by $8,227.1mn. Capital
expenditure of $17,390.2mn, with an above-budget outlay of $802.0mn, partially offset the
Recurrent Expenditure shortfall. Majority of the under-spending was due to savings on Interest
Payments (both domestic and external) of $5,037.0mn. Consistent with the priority of the
Government in this regard, social spending for the period was fully executed to provide
protection for the most vulnerable members of the society.
Recurrent Expenditure
The programmed Recurrent Expenditure of $179,372.6mn was not fully executed due to lower
Programme spending of $2,343.7mn, lower than budgeted payments for Compensation of
Employees of $846.4mn and a substantial saving derived from lower Interest payments of
$5,037.0mn. Despite the lower recurrent spending for April to July 2018, expenditures were
$8,253.7mn or 5.1% higher than the corresponding period in FY 2017/18.
Programmes
For the review period, $62,610.0mn was spent on Programmes resulting in a 3.6% shortfall. This
was due to lower than scheduled payments to MDAs. This gap in spending is expected to be
minimized by the end of the fiscal year. Notwithstanding the shortfall in spending for the review
period, Programmes were 15.3% higher than the outturn for the similar period of last year. Major
line items accounted for in the outturn of programme spending were:
• The Special Early Retirement Programme (SERP)
• Caribbean Catastrophe Risk Insurance Facility (CCRIF)
• Pension Payments
• Utility Payments
Compensation of Employees
Compensation of Employees totalled $67,275.7mn, of which $61,274.2mn was allocated to
wages and Salaries and the remaining $6,001.6mn was spent on Employers’ Contribution. Both
components contributed to an overall shortfall of $846.4mn or 1.2%. Payments for
Compensation of Employees were however increased by $3,230.4mn when compared to
FY 2017/18, consistent with the scheduled increase associated with the wage agreements signed
by the unions representing public sector workers.

Ministry of Finance and the Public Service Fiscal Policy Paper Interim Report September 2018 Page 30
Interest Payments
Interest Payments recorded the largest deviation from the approved budget. Originally
programmed to be $46,296.8mn, the Government of Jamaica actually paid out $41,259.8mn in
interest, resulting in a $5,037.0mn or 10.9% saving. On the domestic portfolio, $3,601.9mn
(21.6%) was unspent while the external portfolio had savings amounting to $1,435.1mn (4.9%).
The domestic outturn was primarily attributable to lower than anticipated interest rates on
Treasury Bills. Lower than projected increases in the LIBOR rates influenced the external
interest outturn. Relative to last fiscal year, Interest payments were 7.4% lower.
Capital Expenditure
Capital spending continues to perform well relative to budget. For the review period, capital
spending amounted $17,390.2mn. This spending was $802.0mn (or 4.8%) higher than the budget
and $8,089.2mn or 87.0% higher than the capital expenditure for the similar period of last year.
In recognition of the importance of capital spending towards the growth, the GOJ continues to
make special efforts to focus on spending in this area.
Financing
The gross financing need for the period of $123,634.0mn was reduced by 13.1% due to a lower
fiscal deficit (by 76.9%), lower amortization payments (of 6.4%) and lower additional outflows
(by 0.6%). This financing need was funded by loan receipts of $55,655.0mn, additional inflows
amounting to $14,524.5mn and cash balances brought forward from FY 2017/18.
Loan receipts were $1,835.9mn or 3.4% higher than budget due to higher than anticipated
inflows from project loans. This was consistent with the higher capital spending profile. During
the period there was a policy based loan disbursement from the Inter-American Development
Bank (IDB) of approximately $7.0bn. The domestic inflows were in line with projections.
Public Debt
Public Debt increased over the first three months of the fiscal year. The stock at end-June 2018
totalled $2,006.0bn, reflecting an increase of $53.8bn or 2.8% over the $1,952.1bn recorded at
end-March 2018 (Table 3F). This nominal increase is attributable to increases in all major
components driven predominantly by valuation effects arising from depreciation of the Jamaica
dollar and the budgeted market issuances. These issuances outweighed the amortization
payments for the quarter.

Ministry of Finance and the Public Service Fiscal Policy Paper Interim Report September 2018 Page 31
Table 3F: Public Debt
Source: MOFPS
Note: Total Public Debt reflects the new GOJ definition
Total Central Government Debt increased by $51.0bn or 2.6% and the Non-Central Government
Debt (Net Public Bodies Debt), which stood at $13.3bn, increased by $2.8bn or 27.1% over the
end-March 2018 quarter. The total Central Government Debt constituted Domestic Debt of
$774.6bn and External Debt of $1,218.0bn.
Marketable securities accounted for the greater portion of the Central Government Domestic
Debt Stock, with Benchmark Investment Notes (BINs) and T-bills making up 98.6% and 1.1% of
the total, respectively. Loans from commercial banks and to other public sector bodies (Non-
Marketable securities) contributed 0.3% to the domestic portfolio. Overall, there was a $17.8bn
or 2.3% increase in the Central Government Domestic Debt Stock over the first quarter. This
increase reflected the government’s efforts to maintain market presence and satisfy investor
demand with issuances across the yield curve7. Additionally, the recapitalization of the Bank of
Jamaica’s losses through the issuance of domestic securities has contributed to the increased
domestic debt level.
7 The issuance calendar can be found in the Medium-Term Debt Strategy (MTDS) published in February 2018

Ministry of Finance and the Public Service Fiscal Policy Paper Interim Report September 2018 Page 32
The stock of Central Government External Debt continues to outweigh its Domestic counterpart
with a 61.1 to 38.9 share, respectively, as at the end of the first quarter of the fiscal year.
Marketable securities (BINs) made up 60.7% of the total Central Government External Debt
Stock, while bilateral, multilateral and commercial bank loans (Non-Marketable securities)
accounted for the remaining 39.3%. During the first three months of the fiscal year there were
no external bond issuances as external financing came from official (bilateral and multilateral)
sources. The increase of $33.2bn in the external debt portfolio is maximally attributable to
valuation changes, as the accelerated depreciation of the Jamaican dollar explains the increase in
the Jamaica dollar stock of debt. This is evidenced by the decline in the stock of external debt in
US dollar terms over the review period compared to an increase in the stock of external debt in
Jamaican dollar terms.
Public Debt includes the Net or Consolidated Debt of Public Bodies (Non-Central Government
Debt). The Net Public Bodies Debt which currently represents 0.7% of the Public Debt stock,
stood at $13.3bn at end-June 2018, an increase of $2.8bn over the $10.4bn recorded at end-
March 2018. This nominal increase in the Net Public Bodies Debt is due to the refinancing of
intra-Public Sector loans through private sector loans.
Self-Financing Public Bodies
Overview
The group of Self-financing Public Bodies recorded an overall balance surplus of $9,974.1mn,
compared with the budgeted surplus of $1,498.8mn. Contributing to this outturn was an
improvement in operating balance8 of $8,876.0mn and an overall reduction of $2,648.5mn on
capital expenditure. The increased build-up of $3,506.0mn in inventories served to partially
offset the impact of the aforementioned.
SFPBs’ Performance-Quarter 1 (April-June 2018)
The improved operating balance was primarily due to Petrojam Limited, the National Insurance
Fund (NIF), Port Authority of Jamaica (PAJ) and the Airports Authority of Jamaica (AAJ). The
group’s planned capital expenditure was $2,648.0mn lower than the budget of $15,531.0mn.
The public bodies which contributed significantly to the lower than budgeted expenditure were:
a. Petrojam Limited - ($1,800.0mn) due to the delays in completing the project negotiations
with the selected contractor for the Refinery Upgrade Project. Accordingly, the works
did not commence during the period and is expected to continue to lag during the year.
b. PAJ – ($1,294.0mn) due mainly to delays in Montego Bay Berth 1& 2 project;
8 A representation of cash flows from operating activities

Ministry of Finance and the Public Service Fiscal Policy Paper Interim Report September 2018 Page 33
c. NWC – ($682.0mn) delay in the planned issuance of the $15.0bn bond to partially fund
the capital programme was delayed, hence the commencement of several projects was
adversely impacted.
d. AAJ – ($602.0mn) delays in several projects mainly due to slow progress in the
procurement process.
The above under performances were also offset by the NHT, which exceeded its budgeted spend
by $3,439.0mn. A number of projects that were delayed in the last quarter of FY 2017/18 were
brought forward to FY 2018/19. Additionally, there were increased disbursements consistent
with Government’s policy to make housing more accessible.
Ministry of Finance and the Public Service Fiscal Policy Paper Interim Report September 2018 Page 34
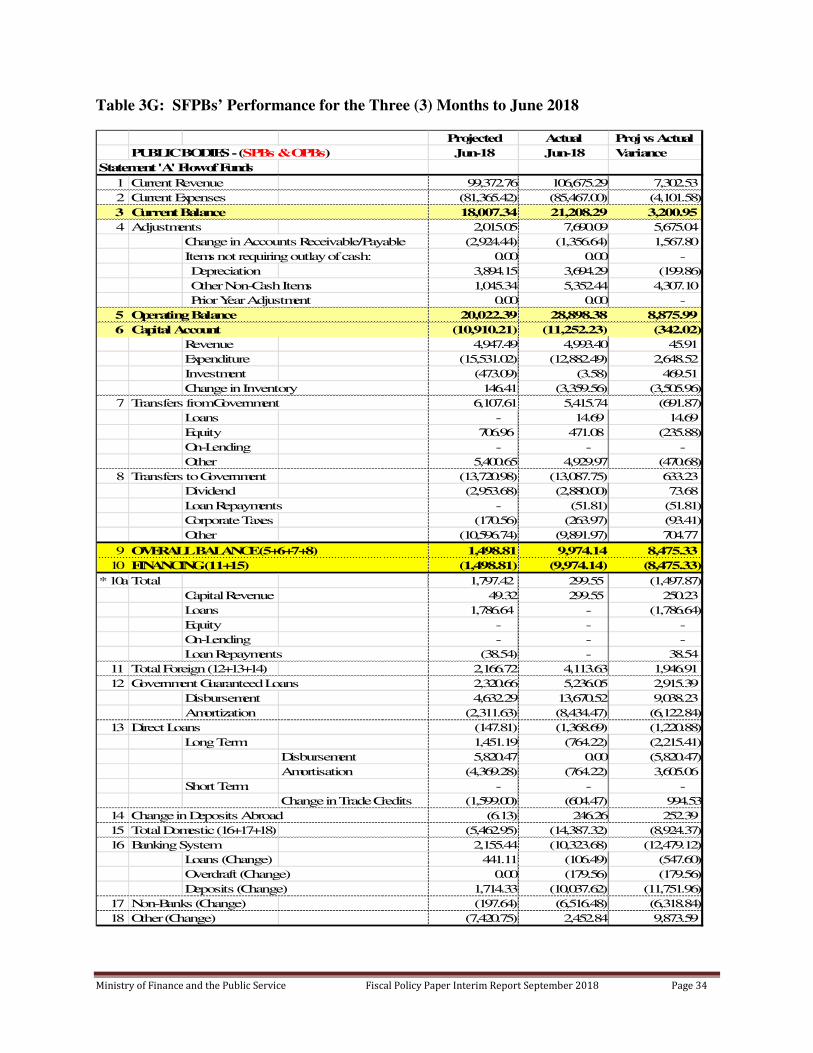
Table 3G: SFPBs’ Performance for the Three (3) Months to June 2018
Projected Actual Proj vs Actual
PUBLIC BODIES - (SPBs & OPBs) Jun-18 Jun-18 Variance
Statement 'A' Flow of Funds
1 Current Revenue 99,372.76 106,675.29 7,302.53
2 Current Expenses (81,365.42) (85,467.00) (4,101.58)
3 Current Balance 18,007.34 21,208.29 3,200.95
4 Adjustments 2,015.05 7,690.09 5,675.04
Change in Accounts Receivable/Payable (2,924.44) (1,356.64) 1,567.80
Items not requiring outlay of cash: 0.00 0.00 -
Depreciation 3,894.15 3,694.29 (199.86)
Other Non-Cash Items 1,045.34 5,352.44 4,307.10
Prior Year Adjustment 0.00 0.00 -
5 Operating Balance 20,022.39 28,898.38 8,875.99
6 Capital Account (10,910.21) (11,252.23) (342.02)
Revenue 4,947.49 4,993.40 45.91
Expenditure (15,531.02) (12,882.49) 2,648.52
Investment (473.09) (3.58) 469.51
Change in Inventory 146.41 (3,359.56) (3,505.96)
7 Transfers from Government 6,107.61 5,415.74 (691.87)
Loans - 14.69 14.69
Equity 706.96 471.08 (235.88)
On-Lending - - -
Other 5,400.65 4,929.97 (470.68)
8 Transfers to Government (13,720.98) (13,087.75) 633.23
Dividend (2,953.68) (2,880.00) 73.68
Loan Repayments - (51.81) (51.81)
Corporate Taxes (170.56) (263.97) (93.41)
Other (10,596.74) (9,891.97) 704.77
9 OVERALL BALANCE (5+6+7+8) 1,498.81 9,974.14 8,475.33
10 FINANCING (11+15) (1,498.81) (9,974.14) (8,475.33)
* 10a Total 1,797.42 299.55 (1,497.87)
Capital Revenue 49.32 299.55 250.23
Loans 1,786.64 - (1,786.64)
Equity - - -
On-Lending - - -
Loan Repayments (38.54) - 38.54
11 Total Foreign (12+13+14) 2,166.72 4,113.63 1,946.91
12 Government Guaranteed Loans 2,320.66 5,236.05 2,915.39
Disbursement 4,632.29 13,670.52 9,038.23
Amortization (2,311.63) (8,434.47) (6,122.84)
13 Direct Loans (147.81) (1,368.69) (1,220.88)
Long Term: 1,451.19 (764.22) (2,215.41)
Disbursement 5,820.47 0.00 (5,820.47)
Amortisation (4,369.28) (764.22) 3,605.06
Short Term: - - -
Change in Trade Credits (1,599.00) (604.47) 994.53
14 Change in Deposits Abroad (6.13) 246.26 252.39
15 Total Domestic (16+17+18) (5,462.95) (14,387.32) (8,924.37)
16 Banking System 2,155.44 (10,323.68) (12,479.12)
Loans (Change) 441.11 (106.49) (547.60)
Overdraft (Change) 0.00 (179.56) (179.56)
Deposits (Change) 1,714.33 (10,037.62) (11,751.96)
17 Non-Banks (Change) (197.64) (6,516.48) (6,318.84)
18 Other (Change) (7,420.75) 2,452.84 9,873.59

Ministry of Finance and the Public Service Fiscal Policy Paper Interim Report September 2018 Page 35
Fiscal Outlook
The fiscal discipline exhibited by the Government of Jamaica in the execution of the economic
reform programme has yielded significant gains. Over the last five fiscal years, the main
macroeconomic and fiscal indicators have exhibited successive annual improvements. The
Government is unrelenting in its commitment to the prudent fiscal governance that has
underpinned the economic progress, affirmed by the success of all reviews conducted to date
under the precautionary Stand-By Arrangement (PSBA) with the IMF. The Enhanced Fiscal
Rules, which are now in effect, will also serve to entrench responsible management of fiscal
resources, safeguard the advancements and anchor the public sector on the path to fiscal and debt
sustainability.
The positive fiscal performance continued across the first four months of FY2018/19, with both
the fiscal and primary balance recording better than budgeted outturns. Total Revenue and
Grants exceeded projection by 1.4%, whilst Expenditure (net of amortization) fell short of
budget by 3.8%. The over-performance of Revenue & Grants is attributable to the buoyancy of
Tax revenues, with the excess collections compared to budget from Production and Consumption
and International Trade contributing the most to the tax surplus for the period. The Expenditure
shortfall reflects lower than programmed Recurrent spending, as Capital Expenditure was above
projection. The below budget Recurrent Expenditure is indicative, primarily, of under-spending
for Recurrent Programmes and Interest payments. Interest payments to end-July 2018 are 10.9%
lower than projected, mainly resulting from lower than anticipated domestic interest rates as well
as a lower increase in LIBOR rates relative to expectation. Capital Expenditure was 4.8% more
than programmed, largely due to higher than planned spending associated with the major road
improvement works being undertaken within Kingston and St. Andrew, under the Major
Infrastructure Development Programme (MIDP).
Amortization payments to end-July 2018 are 6.4% below budget. The non-execution of any
liability management operation during the period is the main factor accounting for the shortfall.
First Supplementary Budget – FY 2018/19
Since the approval of the budget in March 2018, additional expenditure requirements that are
deemed essential have emerged. The First Supplementary Budget for FY 2018/19 is being tabled
(for the first time) simultaneously alongside the Interim Fiscal Policy Paper. In this First
Supplementary Budget, against the backdrop of the over performance on Tax Revenues to end-
July 2018, the positive revision to the Tax Revenue forecast to end-March 2019, the very robust
performance of capital expenditure and savings on the recurrent side of the original budget
(lower interest costs and programmes), the proposed additional expenditures will be on both the
recurrent and capital budgets. On the Recurrent budget, the additional expenditures amount to
$12.4bn while the capital budget is proposed to be increased by $5.3bn, for a total additional

Ministry of Finance and the Public Service Fiscal Policy Paper Interim Report September 2018 Page 36
expenditure of $17.8bn. These expenditures are to be covered by additional Tax Revenues of
$8.5bn and additional distributions and other revenue from public bodies amounting to $10.1bn.
The Primary surplus is now programmed to be $142.98bn which satisfies the 7.0% of GDP
requirement.
Project execution under the MIDP has been progressing ahead of schedule. Accordingly, further
capital expenditure is required to sustain the pace of implementation, and facilitate the full
drawdown of loan resources associated with the three major works that are simultaneously
underway in the Kingston Metropolitan Area.
Central Government Operations – FY 2018/19
Expenditure - FY 2018/19
The original Expenditure budget (excluding amortization) approved for FY 2018/19 was
$586,480.5mn. Pending approval of the additional spending afore-mentioned, the projection for
Total Expenditure has been revised upwards to $604,236.6mn. This reflects an increment of
$17,756.0mn or 3.0% over the original budget. Recurrent Programmes accounted for
$11,216.4mn and is projected to total $199,872.6mn for the fiscal year. Compensation of
Employees is projected to be in line with the original budget of $201,051.4mn, with Wages &
Salaries and Employers’ Contribution amounting to $185,274.7mn and $15,776.7mn,
respectively.
Interest payments of $138,151.7mn for the fiscal year are projected to turn out slightly higher
than the original budget, with the lower than budgeted Domestic Interest payments partially
offsetting the projected greater External Interest payments. Consistent with the proposed capital
programmes spending increase, Capital Expenditure of $65,160.9mn is projected to exceed the
original budget by $5,335.7mn or 8.9%.
Amortization payments for FY 2018/19 are projected to be $151,711.2mn, marginally lower than
the original budget, with the outturn for both Domestic and External payments expected to be
broadly in line with budget. Inflows from Loan Receipts are projected to be $7,043.1mn more
than the original budget of $103,198.4mn, primarily due to higher External loan receipts.
Revenue & Grants – FY 2018/19
The FY 2018/19 projection for Revenue & Grants is $609,069.4mn, representing an excess over
the original budget of $18,481.0mn or 3.1%. Tax Revenue is projected to account for the second
largest share of the surplus, with an over-performance of $8,508.7mn relative to the original
budget of $518,435.1mn. The main contributors to the positive performance in Tax Revenue are

Ministry of Finance and the Public Service Fiscal Policy Paper Interim Report September 2018 Page 37
expected to be Income and Profits and International Trade. Non-Tax Revenue is projected to
account for the highest share of the surplus above budget, with expected collections of
$71,002.7mn exceeding budget by $10,122.3mn or 16.6%. This is driven by additional
distributions from public bodies. Capital Revenue is projected to end the year with a shortfall of
$456.9mn while Grants are projected to be above budget by $306.9mn.
The Primary Surplus projection for the fiscal year is $142,984.5mn, which is 1.4% higher than
the original budget. Given the improved nominal GDP outlook for FY 2018/19, this higher level
of surplus preserves the 7.0% Primary Balance as a percentage of GDP targeted outturn. A fiscal
surplus of $4,832.8mn is now projected, reflecting a better outturn relative to the original budget
projection.
Public Debt
The public debt is projected to be $2,014,822.9mn or 98.9% of GDP at the end of FY 2018/19.
The projected Central Government debt of $1,992,495.5mn (97.8% of GDP), constitutes
Domestic debt of $743,109.5mn (share of 37.3%) and External debt of $1,249,386.0mn (share of
62.7%). Net Public Bodies Debt is projected to be $22,327.4mn (1.1% of GDP) at end-March
2019.
Public Bodies: Prospects for remainder of FY 2018/19
The Public Bodies were originally programmed to generate an overall balance of $10,400.0mn
for FY 2018/19. However, proposed adjustments to various portfolios indicate a likely deficit of
$19,782.0mn (See Appendix 1 - Table A6). The main contributors to this position are the
PetroCaribe Development Fund (PCDF), arising from an additional special distribution and the
National Housing Trust where the implementation of capital projects is proceeding ahead of
schedule.
FY 2018/19 and the Medium Term Fiscal Profile
A revised medium term fiscal profile was developed based on the updated medium term
macroeconomic profile (see Table 2C) and the fiscal policy priorities of the GOJ which include:
achievement of a primary surplus of 7.0% of GDP, attainment of a Wage-to-GDP ratio of 9.0%
in FY 2018/19 and reduction of the Debt-to-GDP ratio to 60.0% or lower by end FY 2025/26.
The revised medium term fiscal profile is presented in Appendix 1 (Tables A4 and A5).
The macroeconomic forecast for FY 2018/19 includes, inter alia:
• Real Growth of 1.7%
• Inflation rate of 4.4%
• Oil price (WTI) average of US$69.48 per barrel; and
• Core Imports increasing by 10.3% relative to FY 2017/18.

Ministry of Finance and the Public Service Fiscal Policy Paper Interim Report September 2018 Page 38
Revenue & Grants as a percent of GDP are projected to increase by 0.9% from 29.0% in
FY 2017/18 to 29.9% in FY 2018/19 and thereafter average 29.4% through to FY 2021/22. The
increase of 0.9 percent of GDP is largely driven by the additional special distributions from
public bodies which account for 0.7 percent of GDP. Tax Revenue and Non-Tax Revenue as a
percent of GDP are forecast to remain stable at about 26.0% and 3.0%, respectively, over the
medium term. One of the factors expected to contribute to the stable path for Non-Tax Revenue
collections over the medium term is additional receipts as a result of better compliance and
improved timeliness in the surrender of proceeds collected by MDAs to the Accountant
General’s Department (AGD) as well as continued revenue flows from de-earmarked or
reintegrated public bodies. The Tax Revenue forecast over the medium term reflects expectation
of continued expansion in private sector employment, as economic growth accelerates.
The commitment to fiscal discipline and the focus on improving economic growth are evident in
the medium term expenditure profile presented, as the GOJ continues to strategically shift from
recurrent expenditure while ensuring that growth-inducing capital spending is maintained. Total
Expenditure is projected to decline from 29.7% of GDP in FY 2018/19 to 27.8% of GDP in
FY 2021/22, with recurrent spending reduced from 26.5% to 24.5% of GDP over that period. In
keeping with the Financial Administration and Audit (Amendment) Act of 2016, necessary
policy actions will be pursued to lower the Wage-to-GDP ratio from the 9.1% currently reflected
in the medium term fiscal profile to 9.0% by end-March 2019, and maintained at the target ratio
thereafter. Interest payments are forecast to decline gradually from 6.8% of GDP in FY 2018/19
to 5.4% of GDP by FY 2021/22. Capital expenditure is projected to be maintained at an average
of 3.3% throughout the medium term.
This medium term profile presented assumes that any emerging fiscal gaps will be closed by
requisite fiscal measures.

Ministry of Finance and the Public Service Fiscal Policy Paper Interim Report September 2018 Page 39
APPENDIX I
Table A1: CENTRAL GOVERNMENT SUMMARY ACCOUNTS - Fiscal Monitoring Table
FY 2018/19
(in millions of Jamaica dollars)
Prov Budget FY 17/18
Item Apr - July Apr - July Diff Diff % Apr - July Diff Diff %
Revenue & Grants 185,511.1 182,865.4 2,645.7 1.4% 166,214.2 19,296.9 11.6%
Tax Revenue 168,407.1 162,658.2 5,748.8 3.5% 153,626.6 14,780.5 9.6%
Non-Tax Revenue 14,938.3 15,313.3 -375.0 -2.4% 10,363.6 4,574.7 44.1%
Bauxite Levy 0.0 0.0 0.0 0.0% 127.5 -127.5 -100.0%
Capital Revenue 562.7 269.0 293.6 109.1% 258.3 304.4 117.8%
Grants 1,603.0 4,624.8 -3,021.7 -65.3% 1,838.2 -235.2 -12.8%
Expenditure 188,535.8 195,960.8 -7,425.0 -3.8% 172,192.9 16,342.8 9.5%
Recurrent Expenditure 171,145.5 179,372.6 -8,227.1 -4.6% 162,891.9 8,253.7 5.1%
Programmes 62,610.0 64,953.8 -2,343.7 -3.6% 54,302.7 8,307.3 15.3%
Compensation of Employees 67,275.7 68,122.1 -846.4 -1.2% 64,045.3 3,230.5 5.0%
Wages & Salaries 61,251.3 61,510.1 -258.7 -0.4% 58,354.1 2,897.2 5.0%
Employers Contribution 6,024.4 6,612.0 -587.6 -8.9% 5,691.2 333.2 5.9%
Interest 41,259.8 46,296.8 -5,037.0 -10.9% 44,543.9 -3,284.1 -7.4%
Domestic 13,107.7 16,709.6 -3,601.9 -21.6% 19,108.4 -6,000.7 -31.4%
External 28,152.1 29,587.2 -1,435.1 -4.9% 25,435.5 2,716.6 10.7%
Capital Expenditure 17,390.2 16,588.2 802.0 4.8% 9,301.1 8,089.2 87.0%
Capital Programmes 17,390.2 16,588.2 802.0 4.8% 9,301.1 8,089.2 87.0%
Fiscal Balance (Surplus + / Deficit -) -3,024.7 -13,095.4 10,070.8 -76.9% -5,978.7 2,954.1 -49.4%
Loan Receipts 55,655.0 53,819.1 1,835.9 3.4% 55,974.7 -319.6 -0.6%
Domestic 41,941.6 41,673.3 268.2 0.6% 40,524.3 1,417.3 3.5%
External 13,713.4 12,145.8 1,567.7 12.9% 15,450.4 -1,736.9 -11.2%
Project Loans 6,762.5 5,131.9 1,630.7 31.8% 6,489.1 273.5 4.2%
Other 6,950.9 7,013.9 -63.0 -0.9% 8,961.3 -2,010.4 -22.4%
Other Inflows (inc'ds PCDF) 14,524.5 14,590.1 -65.6 -0.4% 11,400.1 3,124.4 27.4%
Other Outflows (incl'ds BOJ Recapitalization) 15,151.6 15,250.6 -98.9 -0.6% 0.0 15,151.6 0.0%
Amortization 89,235.2 95,287.9 -6,052.7 -6.4% 106,529.6 -17,294.4 -16.2%
Domestic 64,187.2 66,557.8 -2,370.7 -3.6% 68,939.4 -4,752.2 -6.9%
External 25,048.0 28,730.1 -3,682.1 -12.8% 37,590.2 -12,542.2 -33.4%
Overall Balance (Surplus + / Deficit -) -37,232.0 -55,224.7 17,992.7 -32.6% -45,133.6 7,901.6 -17.5%
Primary Balance (Surplus + / Deficit -) 38,235.1 33,201.3 5,033.8 15.2% 38,565.1 -330.1 -0.9%
Source: MoFPS
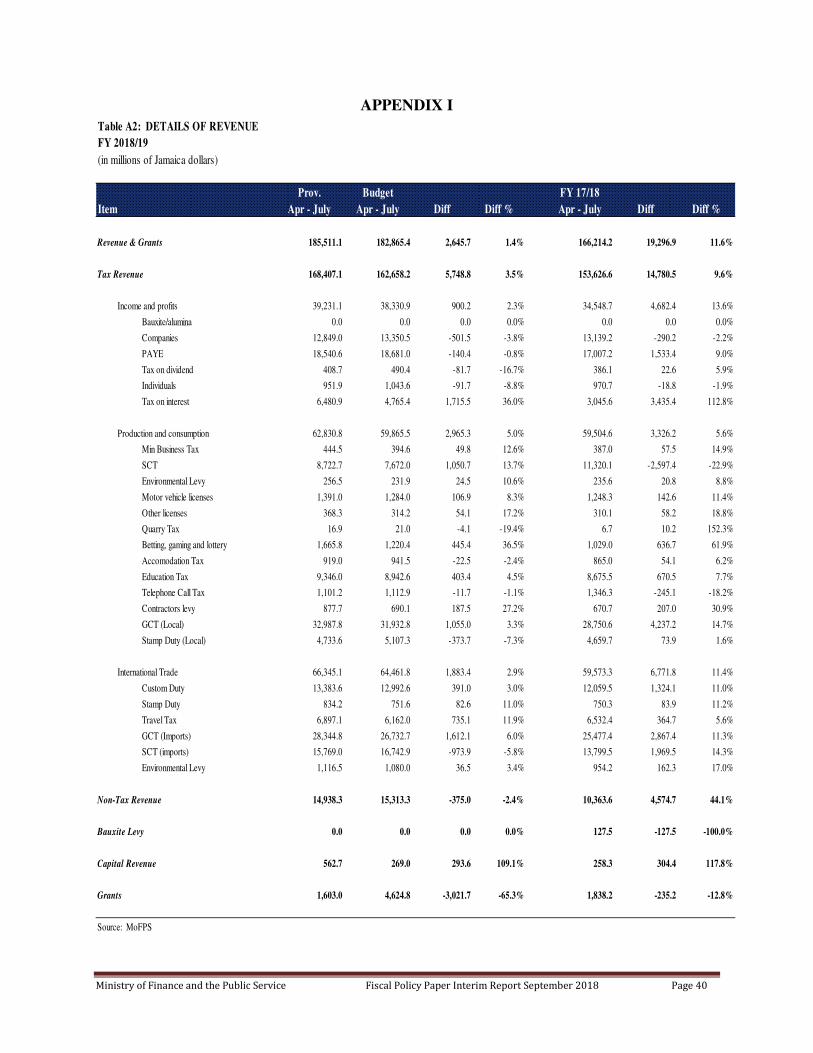
Ministry of Finance and the Public Service Fiscal Policy Paper Interim Report September 2018 Page 40
APPENDIX I
Table A2: DETAILS OF REVENUE
FY 2018/19
(in millions of Jamaica dollars)
Prov. Budget FY 17/18
Item Apr - July Apr - July Diff Diff % Apr - July Diff Diff %
Revenue & Grants 185,511.1 182,865.4 2,645.7 1.4% 166,214.2 19,296.9 11.6%
Tax Revenue 168,407.1 162,658.2 5,748.8 3.5% 153,626.6 14,780.5 9.6%
Income and profits 39,231.1 38,330.9 900.2 2.3% 34,548.7 4,682.4 13.6%
Bauxite/alumina 0.0 0.0 0.0 0.0% 0.0 0.0 0.0%
Companies 12,849.0 13,350.5 -501.5 -3.8% 13,139.2 -290.2 -2.2%
PAYE 18,540.6 18,681.0 -140.4 -0.8% 17,007.2 1,533.4 9.0%
Tax on dividend 408.7 490.4 -81.7 -16.7% 386.1 22.6 5.9%
Individuals 951.9 1,043.6 -91.7 -8.8% 970.7 -18.8 -1.9%
Tax on interest 6,480.9 4,765.4 1,715.5 36.0% 3,045.6 3,435.4 112.8%
Production and consumption 62,830.8 59,865.5 2,965.3 5.0% 59,504.6 3,326.2 5.6%
Min Business Tax 444.5 394.6 49.8 12.6% 387.0 57.5 14.9%
SCT 8,722.7 7,672.0 1,050.7 13.7% 11,320.1 -2,597.4 -22.9%
Environmental Levy 256.5 231.9 24.5 10.6% 235.6 20.8 8.8%
Motor vehicle licenses 1,391.0 1,284.0 106.9 8.3% 1,248.3 142.6 11.4%
Other licenses 368.3 314.2 54.1 17.2% 310.1 58.2 18.8%
Quarry Tax 16.9 21.0 -4.1 -19.4% 6.7 10.2 152.3%
Betting, gaming and lottery 1,665.8 1,220.4 445.4 36.5% 1,029.0 636.7 61.9%
Accomodation Tax 919.0 941.5 -22.5 -2.4% 865.0 54.1 6.2%
Education Tax 9,346.0 8,942.6 403.4 4.5% 8,675.5 670.5 7.7%
Telephone Call Tax 1,101.2 1,112.9 -11.7 -1.1% 1,346.3 -245.1 -18.2%
Contractors levy 877.7 690.1 187.5 27.2% 670.7 207.0 30.9%
GCT (Local) 32,987.8 31,932.8 1,055.0 3.3% 28,750.6 4,237.2 14.7%
Stamp Duty (Local) 4,733.6 5,107.3 -373.7 -7.3% 4,659.7 73.9 1.6%
International Trade 66,345.1 64,461.8 1,883.4 2.9% 59,573.3 6,771.8 11.4%
Custom Duty 13,383.6 12,992.6 391.0 3.0% 12,059.5 1,324.1 11.0%
Stamp Duty 834.2 751.6 82.6 11.0% 750.3 83.9 11.2%
Travel Tax 6,897.1 6,162.0 735.1 11.9% 6,532.4 364.7 5.6%
GCT (Imports) 28,344.8 26,732.7 1,612.1 6.0% 25,477.4 2,867.4 11.3%
SCT (imports) 15,769.0 16,742.9 -973.9 -5.8% 13,799.5 1,969.5 14.3%
Environmental Levy 1,116.5 1,080.0 36.5 3.4% 954.2 162.3 17.0%
Non-Tax Revenue 14,938.3 15,313.3 -375.0 -2.4% 10,363.6 4,574.7 44.1%
Bauxite Levy 0.0 0.0 0.0 0.0% 127.5 -127.5 -100.0%
Capital Revenue 562.7 269.0 293.6 109.1% 258.3 304.4 117.8%
Grants 1,603.0 4,624.8 -3,021.7 -65.3% 1,838.2 -235.2 -12.8%
Source: MoFPS

Ministry of Finance and the Public Service Fiscal Policy Paper Interim Report September 2018 Page 41
APPENDIX I
Table A3: CENTRAL GOVERNMENT SUMMARY ACCOUNTS - Fiscal Monitoring Table
FY 2018/19
(in millions of Jamaica dollars)
Prov Budget FY 2017/18
Item Apr - March Apr - March Diff Diff % Apr - March Diff Diff %
Revenue & Grants 609,069.4 590,588.4 18,481.0 3.1% 560,773.6 48,295.8 8.6%
Tax Revenue 526,943.9 518,435.2 8,508.7 1.6% 496,894.6 30,049.3 6.0%
Non-Tax Revenue 71,002.7 60,880.4 10,122.3 16.6% 53,249.9 17,752.7 33.3%
Bauxite Levy 126.0 126.0 0.0 0.0% 127.5 -1.5 -1.2%
Capital Revenue 1,631.2 2,088.1 -456.9 -21.9% 4,887.1 -3,255.9 -66.6%
Grants 9,365.6 9,058.7 306.9 3.4% 5,614.4 3,751.2 66.8%
Expenditure 604,236.6 586,480.6 17,756.0 3.0% 552,050.1 52,186.4 9.5%
Recurrent Expenditure 539,075.7 526,655.4 12,420.3 2.4% 505,244.0 33,831.6 6.7%
Programmes 199,872.6 188,656.1 11,216.4 5.9% 176,779.5 23,093.1 13.1%
Compensation of Employees 201,051.4 201,051.4 0.0 0.0% 193,283.5 7,767.9 4.0%
Wages & Salaries 185,274.7 185,274.7 0.0 0.0% 178,366.3 6,908.4 3.9%
Employers Contribution 15,776.7 15,776.7 0.0 0.0% 14,917.2 859.5 5.8%
Interest 138,151.7 136,947.9 1,203.8 0.9% 135,181.0 2,970.7 2.2%
Domestic 56,025.7 60,970.9 -4,945.1 -8.1% 63,783.5 -7,757.7 -12.2%
External 82,126.0 75,977.0 6,149.0 8.1% 71,397.5 10,728.5 15.0%
Capital Expenditure 65,160.9 59,825.1 5,335.7 8.9% 46,806.1 18,354.8 39.2%
Capital Programmes 65,160.9 59,825.1 5,335.7 8.9% 46,806.1 18,354.8 39.2%
Fiscal Balance (Surplus + / Deficit -) 4,832.8 4,107.9 725.0 17.6% 8,723.4 -3,890.6 -44.6%
Loan Receipts 110,241.4 103,198.3 7,043.1 6.8% 207,133.0 -96,891.6 -46.8%
Domestic 79,161.9 78,071.6 1,090.3 1.4% 72,894.2 6,267.7 8.6%
External 31,079.5 25,126.7 5,952.8 23.7% 134,238.8 -103,159.2 -76.8%
Other Inflows (inc'ds PCDF) 14,524.5 14,590.1 -65.6 -0.4% 11,400.1 3,124.4 27.4%
Other Outflows (incl'ds BOJ Recapitalization) 35,164.5 35,164.5 0.0 0.0% 14,260.6 20,903.9 146.6%
Amortization 151,711.2 152,044.3 -333.1 -0.2% 232,289.9 -80,578.8 -34.7%
Domestic 89,106.5 88,843.6 262.9 0.3% 168,627.6 -79,521.1 -47.2%
External 62,604.7 63,200.7 -596.0 -0.9% 63,662.3 -1,057.6 -1.7%
Overall Balance (Surplus + / Deficit -) -57,276.9 -65,312.5 8,035.6 -12.3% -19,294.1 -37,982.8 196.9%
Primary Balance (Surplus + / Deficit -) 142,984.5 141,055.7 1,928.8 1.4% 143,904.4 -919.9 -0.6%
Source: MoFPS

Ministry of Finance and the Public Service Fiscal Policy Paper Interim Report September 2018 Page 42
APPENDIX I
CENTRAL GOVERNMENT SUMMARY ACCOUNTS
(in millions of dollars)
Act Proj Proj Proj Proj Proj Proj
Item 2015/16 2016/17 2017/18 2018/19 2019/20 2020/21 2021/22
Revenue & Grants 455,835.8 499,879.9 560,773.6 609,069.4 642,987.8 685,766.2 732,400.5
Tax Revenue 411,854.0 458,323.4 496,894.6 526,943.9 569,075.4 607,346.8 647,893.7
Non-Tax Revenue 35,748.6 33,754.1 53,249.9 71,002.7 66,486.7 70,640.0 76,347.8
Bauxite Levy 2,116.9 1,940.9 127.5 126.0 138.8 143.7 146.6
Capital Revenue 652.7 568.6 4,887.1 1,631.2 2,241.9 2,392.1 2,562.4
Grants 5,463.6 5,292.8 5,614.4 9,365.6 5,045.0 5,243.6 5,450.0
Expenditure 460,719.4 503,356.0 552,050.1 604,236.6 627,118.0 656,882.9 694,106.9
Recurrent Expenditure 427,972.1 461,400.7 505,244.0 539,075.7 554,931.7 580,695.1 612,801.1
Programmes 133,505.2 142,976.4 176,779.5 199,872.6 205,056.9 222,082.5 236,236.6
Compensation of Employees 168,787.4 179,068.1 193,283.5 201,051.4 213,714.8 224,691.4 240,927.2
Wages & Salaries 163,517.8 166,484.7 178,366.3 185,274.7 197,251.3 210,059.4 225,016.3
Employers Contribution 5,269.6 12,583.4 14,917.2 15,776.7 16,463.4 14,632.0 15,910.9
Interest 125,679.5 139,356.2 135,181.0 138,151.7 136,160.0 133,921.2 135,637.4
Domestic 71,391.3 63,544.0 63,783.5 56,025.7 51,488.2 51,194.3 51,743.9
External 54,288.3 75,812.2 71,397.5 82,126.0 84,671.9 82,727.0 83,893.5
Capital Expenditure 32,747.3 41,955.3 46,806.1 65,160.9 72,186.3 76,187.8 81,305.8
Capital Programmes 32,747.3 41,955.3 46,806.1 65,160.9 72,186.3 76,187.8 81,305.8
Fiscal Balance (Surplus + / Deficit -) -4,883.7 -3,476.1 8,723.4 4,832.8 15,869.8 28,883.3 38,293.6
Loan Receipts 298,600.5 89,826.8 207,133.0 110,241.4 126,593.6 131,653.6 88,622.3
Domestic 29,004.3 55,544.1 72,894.2 79,161.9 89,649.3 83,191.0 55,217.1
External 269,596.2 34,282.8 134,238.8 31,079.5 36,944.3 48,462.6 33,405.2
Other Inflows (inc'ds PCDF) 6,071.2 14,604.7 11,400.1 14,524.5 19,265.9 20,285.8 21,482.3
Other Outflows (incl'ds BOJ Recapitalization) 14,260.6 35,164.5 25,000.0 25,000.0 0.0
Amortization 342,725.9 75,389.7 232,289.9 151,711.2 136,729.4 155,822.7 148,398.2
Domestic 77,718.9 29,709.8 168,627.6 89,106.5 76,785.0 107,360.1 59,993.0
External 265,007.1 45,679.9 63,662.3 62,604.7 59,944.3 48,462.6 88,405.2
Overall Balance (Surplus + / Deficit -) -42,937.9 25,565.8 -19,294.1 -57,276.9 0.0 0.0 0.0
Primary Balance (Surplus +/Deficit -) 120,795.9 135,880.1 143,904.5 142,984.5 152,029.8 162,804.5 173,931.0
GDP 1,688,399.7 1,788,818.4 1,932,998.0 2,037,362.4 2,187,463.9 2,333,993.9 2,500,181.0
TOTAL PAYMENTS 803,445.3 578,745.7 798,600.7 791,112.2 788,847.4 837,705.5 842,505.1
Soucre: MOFPS

Ministry of Finance and the Public Service Fiscal Policy Paper Interim Report September 2018 Page 43
APPENDIX I
Table A5: CENTRAL GOVERNMENT SUMMARY ACCOUNTS
(as percent of GDP)
Item 2015/16 2016/17 2017/18 2018/19 2019/20 2020/21 2021/.22
Revenue & Grants 27.0% 27.9% 29.0% 29.9% 29.4% 29.4% 29.3%
Tax Revenue 24.4% 25.6% 25.7% 25.9% 26.0% 26.0% 25.9%
Non-Tax Revenue 2.1% 1.9% 2.8% 3.5% 3.0% 3.0% 3.1%
Bauxite Levy 0.1% 0.1% 0.0% 0.0% 0.0% 0.0% 0.0%
Capital Revenue 0.0% 0.0% 0.3% 0.1% 0.1% 0.1% 0.1%
Grants 0.3% 0.3% 0.3% 0.5% 0.2% 0.2% 0.2%
Expenditure 27.3% 28.1% 28.6% 29.7% 28.7% 28.1% 27.8%
Recurrent Expenditure 25.3% 25.8% 26.1% 26.5% 25.4% 24.9% 24.5%Programmes 7.9% 8.0% 9.1% 9.8% 9.4% 9.5% 9.4%
Compensation of Employees 10.0% 10.0% 10.0% 9.9% 9.8% 9.6% 9.6%
Wages & Salaries 9.7% 9.3% 9.2% 9.1% 9.0% 9.0% 9.0%
Employers Contribution 0.3% 0.7% 0.8% 0.8% 0.8% 0.6% 0.6%
Interest 7.4% 7.8% 7.0% 6.8% 6.2% 5.7% 5.4%
Domestic 4.2% 3.6% 3.3% 2.7% 2.4% 2.2% 2.1%
Foreign 3.2% 4.2% 3.7% 4.0% 3.9% 3.5% 3.4%
Capital Expenditure 1.9% 2.3% 2.4% 3.2% 3.3% 3.3% 3.3%
Capital Programmes 1.9% 2.3% 2.4% 3.2% 3.3% 3.3% 3.3%
Fiscal Balance (Surplus + / Deficit -) -0.3% -0.2% 0.5% 0.2% 0.7% 1.2% 1.5%
Loan Receipts 17.7% 5.0% 10.7% 5.4% 5.8% 5.6% 3.5%
Domestic 1.7% 3.1% 3.8% 3.9% 4.1% 3.6% 2.2%
External 16.0% 1.9% 6.9% 1.5% 1.7% 2.1% 1.3%
Other Inflows (inc'ds PCDF) 0.4% 0.8% 0.6% 0.7% 0.9% 0.9% 0.9%
Other Outflows (incl'ds BOJ Recapitalization) 0.0% 0.0% 0.7% 1.7% 1.1% 1.1% 0.0%
Amortization 20.3% 4.2% 12.0% 7.4% 6.3% 6.7% 5.9%
Domestic 4.6% 1.7% 8.7% 4.4% 3.5% 4.6% 2.4%
External 15.7% 2.6% 3.3% 3.1% 2.7% 2.1% 3.5%
Overall Balance (Surplus + / Deficit -) -2.5% 1.4% -1.0% -2.8% 0.0% 0.0% 0.0%
Primary Balance 7.2% 7.6% 7.4% 7.0% 7.0% 7.0% 7.0%
GDP 1,688,399.7 1,788,818.4 1,932,998.0 2,037,362.4 2,187,463.9 2,333,993.9 2,500,181.0
TOTAL PAYMENTS 47.6% 32.4% 41.3% 38.8% 36.1% 35.9% 33.7%
Source: MoFPS

Ministry of Finance and the Public Service Fiscal Policy Paper Interim Report September 2018 Page 44
APPENDIX I
Table A6: Public Bodies Summary of Financial Forecasts
J$m
Approved Supplementary
2018/19 2018/19 Difference
Statement 'A' Flow of Funds
1 Current Revenue 404,292.07 404,292.07 0.00
2 Current Expenses (324,178.80) (324,178.80) 0.00
3 Current Balance 80,113.27 80,113.27 0.00
4 Adjustments 17,750.12 13,474.94 (4,275.18)
Change in Accounts 0.00 0.00 0.00
Receivable/Payable 2,184.99 (2,090.19) (4,275.18)
Items not requiring outlay of cash: 0.00
Depreciation 15,642.40 15,642.40 0.00
Other Non-Cash Items (77.27) (77.27) 0.00
Prior Year Adjustment 0.00 0.00 0.00
5 Operating Balance 97,863.39 93,588.21 (4,275.18)
6 Capital Account (50,948.78) (50,896.78) 52.00
Revenue 18,989.32 18,989.32 0.00
Expenditure (68,374.27) (68,322.27) 52.00
Investment (1,539.24) (1,539.24) 0.00
Change in Inventory (24.60) (24.60) 0.00
7 Transfers from Government 14,142.27 16,647.27 2,505.00
Loans 0.00 0.00 0.00
Equity 2,827.82 2,827.82 0.00
On-Lending 0.00 0.00 0.00
Other 11,314.45 13,819.45 2,505.00
8 Transfers to Government (71,420.89) (79,120.89) (7,700.00)
Dividend (25,962.51) (33,662.51) (7,700.00)
Loan Repayments 0.00 0.00 0.00
Corporate Taxes (2,314.69) (2,314.69) 0.00
Other (43,143.69) (43,143.69) 0.00
9 OVERALL BALANCE (5+6+7+8) (10,364.01) (19,782.19) (9,418.18)
10 FINANCING (11+15) 10,364.01 19,782.19 9,418.18
10a Total 11,006.22 11,006.22 0.00
Capital Revenue 5,943.37 5,943.37 0.00
Loans 5,101.39 5,101.39 0.00
Equity 0.00 0.00 0.00
On-Lending 0.00 0.00 0.00
Loan Repayments (38.54) (38.54) 0.00
11 Total Foreign (12+13+14) (18,823.72) (18,823.72) 0.00
12 Government Guaranteed Loans (5,022.27) (5,022.27) 0.00
Disbursement 3,658.84 3,658.84 0.00
Amortization (8,681.11) (8,681.11) 0.00
13 Direct Loans (13,776.63) (13,776.63) 0.00
Long Term: (11,964.43) (11,964.43) 0.00
Disbursement 8,156.88 8,156.88 0.00
Amortisation (20,121.31) (20,121.31) 0.00
Short Term: (1,812.20) (1,812.20) 0.00
Change in Trade Credits (1,812.20) (1,812.20) 0.00
14 Change in Deposits Abroad (24.82) (24.82) 0.00
15 Total Domestic (16+17+18) 18,181.51 27,599.69 9,418.18
16 Banking System 3,104.17 2,856.17 (248.00)
Loans (Change) 734.47 486.47 (248.00)
Overdraft (Change) 0.00 0.00 0.00
Deposits (Change) 2,369.69 2,369.69 0.00
17 Non-Banks (Change) (636.11) (636.11) 0.00
18 Other (Change) 15,713.45 25,379.64 9,666.18
Source: MoFPS

Ministry of Finance and the Public Service Fiscal Policy Paper Interim Report September 2018 Page 45
Appendix II
FISCAL RISK STATEMENT
The February 2018 publication of the annual Fiscal Policy Paper (FPP) included a Fiscal Risk
Statement which outlined the exposure of the Government of Jamaica (GOJ) to fiscal risks
originating from various sources. Risks identified include macroeconomic assumptions used in
preparing the FY 2018/19 budget and medium-term projections, public debt dynamics, the
operations of state owned enterprises as well as Public-Private Partnerships (PPPs) and
contingent liabilities. This report provides a brief update on some of the risks identified.
Jamaica’s macroeconomic conditions continue to improve. For the April to June quarter, growth
was recorded at 1.8 per cent, relative to the corresponding period in FY 2017/18, the highest
recorded since September 2016. This increase was supported by improved weather conditions
which facilitated growth in agriculture and mining; and higher levels of construction activities
associated with road rehabilitation and commercial and residential developments. The
unemployment rate continues to decline (see Part 2 - Macroeconomic Framework), and investor
confidence is at an all-time high, owing to the stability of the economy. This positive trend is
expected to continue throughout FY 2018/19. However, the GOJ is aware that this positive
domestic outlook can be reversed without the active monitoring and management of fiscal risks.
Commodity Prices
Oil Prices
The medium term macroeconomic profile outlined in the February publication of the FPP, and
used in formulating the budget, has oil prices projected at US$56.2/bbl on average for
FY 2018/19. At the beginning of the fiscal year, the price of oil was US$63.01/bbl. The price of
oil has continued to rise, and for the fiscal year to end-August, has averaged US$68.42/bbl. On
the revenue side, this could have a positive impact on the Government’s fiscal accounts through
an increase in revenue collection from the SCT on petroleum and petroleum products. The
expenditure impact, however, is negative as the operating costs of the Government and state
owned enterprises continue to rise. In light of this, the GOJ continues to seek energy solutions,
and promote energy efficiency through the Energy Management and Efficiency Project.
Exchange Rate
From the beginning of FY 2018/19 to end-August 2018, the Jamaica dollar has depreciated by 9
per cent against the US dollar. For that same period, the exchange rate has averaged J$130.36,
which is higher than the forecasted average for the fiscal year. If the exchange rate does not
Ministry of Finance and the Public Service Fiscal Policy Paper Interim Report September 2018 Page 46
stabilize over the remainder of the fiscal year, there could be negative impacts on the fiscal
accounts, particularly the foreign currency denominated portion of the debt portfolio. On the
other hand, the Government may see higher than expected revenues from international trade as a
result of the depreciation.
Inflation
The Bank of Jamaica’s inflation target for FY 2018/19 is a range of 4.0 per cent to 6.0 per cent.
In June 2018, the year over year inflation rate was 2.8 per cent. This lower than target inflation
was triggered mainly by a fall in agricultural prices due to good weather conditions in the first
quarter of the fiscal year. While lower than target inflation may be seen as a positive, with
consumers experiencing overall lower prices, there can be negative implications for tax revenues,
and nominal GDP, which is the base of the GOJs programme targets such as wage to GDP, or the
primary balance to GDP.
Natural Disasters
Jamaica’s geographical location puts it at risk of being impacted by a variety of natural disasters.
Events such as hurricanes, tropical storms, earthquakes, droughts, floods, and landslides not only
pose a threat to the country’s human capital and physical infrastructure, but can also derail the
fiscal programme through unplanned expenditure and lower tax revenues. Under section 37 of
the Disaster Risk Management Act (2015) and as part of ongoing mitigation measures against the
threat of natural disasters, the GOJ has a reserve of approximately J$550 million in the National
Disaster Fund (NDF) to finance post-disaster expenditures. The fund is managed by the Ministry
of Local Government and Community Development through the Office of Disaster Preparedness
and Emergency Management (ODPEM). Additional funding, to the tune of J$94 million for
disaster related events, may be provided for through the Contingency Fund established by the
Constitution and managed by the Accountant General’s Department (AGD).
The GOJ has maintained insurance coverage through the Caribbean Catastrophe Risk Insurance
Facility - Segregated Portfolio Company (CCRIF-SPC) for the 2018/19 fiscal year. The CCRIF-
SPC provides policy coverage in the event of a Tropical Cyclone (TC), Earthquake (EQ) and
Excess Rainfall (XSR). The GOJ continues to insure against natural disasters in light of the
increased activity of the Atlantic Hurricane Season, which runs from June to November. The
2018/19 season has to date seen nine named storms of which four have developed into tropical
cyclones with the potential to cause destruction. Additionally, the Caribbean region has
experienced several intense earthquakes with the most recent being off the east coast of Trinidad
on Wednesday September 19, 2018. Notwithstanding the current financing instruments available
to the GOJ to respond in the wake of a natural disaster, a comprehensive strategy geared toward
identifying the Government’s contingent liabilities and a wider suite of financing options are
needed to protect the fiscal programme. To that end; the GOJ will be taking steps to develop a

Ministry of Finance and the Public Service Fiscal Policy Paper Interim Report September 2018 Page 47
disaster risk refinancing policy, which will set out the GOJ’s approach to the allocation of
sufficient resources for disaster response and reconstruction, by optimizing cost effectiveness
through various financial products to address this risk.
Public Financial Management Policy for Natural Disaster Risk
At the beginning of the second quarter of FY 2018/19, the World Bank launched their report on
Advancing Disaster Risk Finance in Jamaica, dated February 2018. As the culmination of a
Disaster Risk Finance Technical Assistance (DRFTA) programme, the report outlines the basic
policy framework for the development of a Public Financial Management Policy for Natural
Disaster Risk. A draft policy document, which has been completed through the joint efforts of
the GOJ and the World Bank, is expected to be presented to Cabinet before year-end for
approval to facilitate the development of a formal policy. The policy seeks to mandate the
identification and recording of the Government’s potential contingent liabilities with a view to
introduce risk layering through the adoption of appropriate financing instruments. This
diversification will ensure sufficient mechanisms for the efficient relief, recovery and
reconstruction during the aftermath of a natural disaster related incident.
Wage Settlements
The GOJ has signed Heads of Agreement (HOA) with four of the major unions representing
public sector workers for a four year contract period, 2017-2021. However, a settlement has not
yet been reached with some smaller bargaining units, and the Police Federation.
Should the final wage settlement rates exceed the provisions made in the four year offer, this
would pose a risk to the expenditure budget and the overall fiscal programme. Higher than
planned wages could also compromise the achievement of the 9.0% wage to GDP target for
FY 2018/19. On the revenue side, until negotiations are completed, taxes on income (PAYE)
will be lower than budgeted.
State Owned Enterprises
Petrojam
The shutdown of the Petrojam Refinery during June and July is expected to affect the
composition of the Special Consumption Tax (SCT) across the revenue categories Production
and Consumption and International Trade. A decrease in the production of petroleum products
from imported crude oil generally tends to be matched by an increase in the import of finished
products. The shift in the composition across the revenue categories has affected the line items
SCT (Local) and SCT (Import) with the overall aggregate being relatively in line with budget.
Capital expenditure for FY 2018/19 has been lower than programmed due to delays in the

Ministry of Finance and the Public Service Fiscal Policy Paper Interim Report September 2018 Page 48
refinery upgrade and attendant projects. The delay may shift this expenditure into the next fiscal
year.
Montego Bay Metro Company
Workers of Montego Bay Metro Company (MBMC), the state-run bus company which serves
the western part of the island, took industrial action in September 2018. Among their demands
are an increase in salary and fringe benefits to that comparable to those of their counterparts at
the Jamaica Urban Transit Company (JUTC), and an increase in the subvention received from
the Government in order to address the issue of defective buses, as well as to increase their fleet.
The bus company is also dissatisfied with the fact that they are required to pay the SCT on fuel
from their resources.
If the GOJ is required to meet the demands of MBMC, which was not included in the budget for
FY 2018/19, there will be an additional expenditure requirement, which if not backed by
additional revenues, will create a negative impact on the fiscal outturn.
Public Bodies with Arrears
Clarendon Alumina Partners (CAP)
In the fourth quarter of FY 2016/17, the GOJ on-lent US$27.0mn to CAP to settle arrears to the
Jamalco Plant. To date, CAP has honoured all repayment obligations, with the next payment due
in October 2018. Despite challenges faced, such as increasing operation costs due to the rising
price of oil, and production output compromised by missed shipments and adverse weather
conditions, CAP is on target for the first quarter of the fiscal year, and is working towards
meeting the October payment deadline. Full repayment is expected by June 2019.
Public Private Partnerships (PPPs)
The Government is cognizant that PPP arrangements could create exposure to a wide array of
fiscal risks. These risks may arise in the design, development or transaction phases. PPPs are
therefore actively monitored throughout the life of the projects. The following provides an
update on the status of PPPs since the February publication of the FPP.
PPPs In progress
The following PPP transactions are currently in progress:
Norman Manley International Airport (NMIA) – A preferred bidder has been approved by
Cabinet for the NMIA PPP. Commercial close is expected by the end of the third quarter of
FY 2018/19 and financial closure anticipated by the end of FY 2018/19.

Ministry of Finance and the Public Service Fiscal Policy Paper Interim Report September 2018 Page 49
Schools Solar Energy - During FY 2018/19 there was a re-tender for the Schools Solar Energy
PPP with the issuance of a Request for Qualification. A total of five (5) firms have been
prequalified and will be invited to respond to a Request for Proposals in September 2018.
Commercial close is anticipated by the end of the fourth quarter of FY 2018/19.
Projects being assessed
Several projects are being assessed for possible PPP development. Most notable is the Rio
Cobre Water Treatment Plant. Negotiations are to be completed between the National Water
Commission and Vinci Construction for the implementation of a 15 MIGD9 Water Treatment
Plant in Content, St. Catherine.
9 MIGD - million gallons of water per day
Ministry of Finance and the Public Service Fiscal Policy Paper Interim Report September 2018 Page 50
Appendix III
TAX ADMINISTRATION JAMAICA
Tax Administration Jamaica (TAJ) is charged with the responsibility to administer the country’s
tax laws and collect Jamaica’s domestic taxes. In keeping with its mission to collect revenues
due in an equitable and efficient manner and foster voluntary compliance, TAJ contributes to a
competitive business environment that enables and enhances economic growth and development,
while progressing towards its vision of becoming a ‘World Class Tax Administration’.
Significant strides have been made toward offering convenient and adequate options for the
public to access information, and remit taxes, as we remain committed to service through
taxpayer education and the delivery of high customer service. Compliance and collection rates
have continued to improve, suggesting that taxpayers have become more aware of their rights,
duties and obligations under the law. TAJ remains committed to continue to explore new ways
to make it easier for persons to meet their tax obligations.
TAX PERFORMANCE FY 2018/19 (APRIL - JULY)
The performance of TAJ’s core deliverables as at end-July FY 2018/19 are presented below.
Collections
For the first quarter, collections performed 3.6% above target. July continued this trend with
collections performing 5.1% above target. This resulted in year-to-date (YTD) net collections at
$102,017.0mn, which is $3,820.8mn (3.9%) above the $98,196.2mn projected for the period
(Table 1). As TAJ continues to execute its compliance programmes, the over-performance of
collections is expected to continue (Figure 1).

Ministry of Finance and the Public Service Fiscal Policy Paper Interim Report September 2018 Page 51
Table 1: Performance against Projections
FY18/19 FY 17/18 FY 16/17 FY 15/16 FY 14/15 FY 13/14
Apr 102.3% 99.9% 101.1% 99.2% 99.0% 105.1%
May 100.4% 98.9% 111.2% 110.1% 111.5% 105.1%
June 106.9% 125.3% 112.2% 100.6% 89.2% 89.6%
Qtr. 1 103.6% 109.4% 109.3% 103.1% 98.3% 99.5%
July 105.1% 102.3% 100.3% 99.4% 104.6% 106.8%
Aug - 116.1% 104.4% 96.5% 75.3% 77.3%
Sept - 108.0% 98.5% 113.9% 92.2% 102.0%
Qtr. 2 - 107.1% 100.3% 103.5% 90.4% 95.1%
Oct - 88.9% 92.4% 103.5% 102.3% 94.5%
Nov - 106.2% 112.2% 97.8% 103.3% 92.3%
Dec - 105.6% 126.9% 102.2% 82.4% 92.4%
Qtr. 3 - 108.4% 111.4% 101.1% 94.2% 93.0%
YTD 103.9% 106.1% 107.0% 102.6% 94.1% 95.8%
Figure 1 - Comparative FY Monthly Collections
Compliance
For FY 2018/19, TAJ strengthened its compliance programmes across taxpayer segments (i.e.
large, medium, small and micro) based on reliable parameters. This has allowed for a better
understanding of compliance risks with a view to customize service options and enforcement
strategies for each segment. To that end, compliance risk programmes have been designed to
address taxpayer compliance risks across four tenets of compliance: registration, filing, payment
and reporting accuracy (audit). Targeted initiatives are being implemented to include taxpayer
education and assistance programmes to treat with identified tax issues, the carrying out of
outreach and communication programmes, as well as audit and enforcement programmes, which
are designed to improve voluntary compliance.
90%
100%
110%
120%
130%
Apr May June July
Pe
rce
nt
of
Ta
rge
t
Revenue Collections vs Target
FY18/19 FY 17/18 FY 16/17 FY 15/16

Ministry of Finance and the Public Service Fiscal Policy Paper Interim Report September 2018 Page 52
Registration Compliance
TAJ continued its treatment strategies to improve registration compliance with activities aimed at
identifying and registering persons currently operating outside the tax net. Such strategies
included, but are not limited to:
1. Identifying taxpayers under the Threshold Abuse Programme;
2. Use of third party information to identify persons engaged in business activities and
registering them to file and pay the appropriate tax returns; and
3. Focusing greater registration efforts on the informal economy.
During the period April to July 2018, these efforts led to the registration of 6,080 new taxpayers,
which translates to approximately 60% of the annual target. Registration activities also included
the identification of taxpayer accounts for deregistration, as well as updating of registration
information for active taxpayers. These resulted in deregistration of 312 taxpayers and 6,816
records updated during the period.
Filing & Payment Compliance
Programmes were designed to address filing and payment compliance rates with a major focus
on identifying and taking action against taxpayers identified as failing to file and/or pay on the
due dates. Payment compliance was complemented by taxpayer services and education activities
which were geared towards encouraging and facilitating the timely payment of tax obligations.
In keeping with the implementation of the mandatory eFiling requirement for GCT Returns, an
education initiative was developed to expand the use of online services. The uptake remains
very positive, with a constant increase in online filing for GCT month over month, which has
resulted in a 4% increase in the number of returns being filed.
Generally, the ‘on time filing’ rate has improved period on period for all of the monthly taxes,
with the exception of SCT which saw a decline for most of the taxpayer categories (Table 2).

Ministry of Finance and the Public Service Fiscal Policy Paper Interim Report September 2018 Page 53
Table 2: Comparative "On Time Filing” rates by segment and tax type for period Apr- July
2018
On Time Filing
FY 2018/19 FY 2017/18
PAYE GCT SCT GART PAYE GCT SCT GART
Large 78.7% 95.4% 80.0% 94.4% 74.2% 92.2% 84.1% 89.6%
Upper Medium 75.4% 91.1% 91.7% 88.5% 71.7% 90.9% 87.5% 89.6%
Medium 70.5% 85.1% 68.8% 79.1% 67.6% 83.7% 93.8% 76.8%
Small 61.6% 77.0% 69.4% 71.9% 58.2% 74.6% 91.7% 67.9%
Micro 29.2% 40.5% 35.7% 63.9% 27.5% 54.0% 56.0% 62.4%
Similarly, the ‘on time payment’ rate saw a slight improvement for most categories, with the
exception of GCT which recorded a marginal decline in the payment rate for some categories.
YTD, on time payment amounted to 98.5%, which is an increase on last fiscal year’s rate of
97.7% (Table 3).
Table 3: Comparative “On Time Payment” rates by segment and tax type for period Apr- July
2018
On Time Payment
FY 2018/19 FY 2017/18
PAYE GCT SCT GART PAYE GCT SCT GART
Large 97.7% 99.9% 100.0% 100.0% 96.8% 97.6% 100% 99.6%
Upper Medium 96.8% 99.5% 0.0% 100.0% 95.9% 99.9% 100% 99.0%
Medium 97.0% 99.4% 100.0% 100.0 % 96.2% 99.8% 100% 99.0%
Small 92.1% 97.7% 100.0% 99.9% 91.6% 98.1% 100% 97.4%
Micro 86.6% 98.4% 0.0% 100.0% 85.9% 95.1% 50.0% 82.8%
Accuracy of Reporting (Audit)
10% and 6% audit coverage for the year is targeted for large and medium taxpayers respectively.
As at the end of July 2018, 40% of the YTD target has been achieved for the large taxpayers and
43.5% of the YTD target for the medium taxpayers. Performance is expected to improve as
programme implementation gains more traction across all Tax Offices.
Arrears Management
Arrears collection for April to July 2018 amounted to $4.6bn, which represents 58% of the
YTD target of $8.3bn; with collections by enforcement action accounting for $3.9bn
(approximately 85%) of arrears collected. The stock of arrears as at end-July 2018 is $210.34bn,
representing a decrease of 25% when compared to the corresponding period last year.

Ministry of Finance and the Public Service Fiscal Policy Paper Interim Report September 2018 Page 54
An Arrears Management Project was implemented with the goal of reducing the stock of arrears
by 70% for government entities vis-a-vis the December 2017 stock by May 2019. As at end-July
2018, the stock of government debt was reduced by 12%, moving from $90.6bn to $80.1bn.
Customer Service
During the first quarter of FY 2018/19, TAJ launched three major public campaigns utilizing a
mix of traditional and social media channels:
• At the start of the fiscal year, phase two of a public awareness campaign was
implemented to promote the mandatory eFiling requirement for GCT Returns, which
became effective April 1, 2018. This provided critical support to the Taxpayer Education
Teams’ one-on-one eSessions. At the end of May 2018, a significant percentage of all
registered GCT taxpayers were filing online.
• The second campaign promoted the payment of Property Tax for FY 2018/19. Specific
messages were developed to address outstanding payments for FY 2017/18, strata
properties, applying for relief, and online query and payment options.
• The third campaign for promoting TAJ’s eServices used both traditional and social media
to inform and educate the public of the availability and benefits of using TAJ’s eServices.
To heighten awareness through exposure and impact, the campaign took advantage of the
four week World Cup Football season using a mix of radio, print, TV crawls and social
media posts. An evaluation of the impact of the campaign is being conducted.
During the period, TAJ had several stakeholder engagement opportunities, which allowed the
Authority to build and/or strengthen partnerships with several interest groups. These included
participating in the Jamaica Business Development Corporation (JBDC) Small Business Expo,
the bi-annual Institute of Chartered Accountants of Jamaica (ICAJ) Taxation Seminar and the
Jamaica Gasoline Retailers Association (JGRA) Conference. For the first time, TAJ engaged
directly with the Diaspora in partnership with Jamaica National (JN), with TAJ presenting at and
mounting an information booth in Toronto and Montreal, Canada - catering to hundreds of
clients requiring primarily property tax and TRN services. Such engagements serve to enhance
the positive visibility of TAJ, offering services to the public.
Communication activities also supported the continued promotion of the online payment option
for Certificate of Fitness Fees, Property Tax mobile bus unit, and advising key stakeholders of
Driver’s Licence signature change. As a result of the increased communications and outreach
efforts, TAJ was trending on social media, as the TAJ tweets/posts were actively viewed and
shared. Additionally, TAJ messages were in rotation in traditional media and popular online
media sites, allowing for a high visibility and positive outlook during the period. Internally, TAJ
continues to use various channels, such as WhatsApp, all users email, and intranet, to keep staff
informed about tax related matters, staffing issues and matters of national interest.

Ministry of Finance and the Public Service Fiscal Policy Paper Interim Report September 2018 Page 55
At the request of the Caribbean Technical Assistance Centre (CARTAC), TAJ facilitated a Study
Tour for representatives of several Caribbean tax administrations. During the 1st quarter, TAJ
accepted an invitation to share its experience with stakeholder engagement at the Inter-American
Centre of Tax Administrations (CIAT) General Assembly in Canada. The event was attended by
over 150 participants from 34 member countries.
The mission visits of two (2) separate teams from the OECD and the World Bank were also
coordinated. The OECD week-long visit was used to address upcoming requirements for
automatic exchange of information and country by country reporting. During the visit, meetings
were arranged with major stakeholder groups, to initiate the sensitization of these international
tax matters. During the World Bank’s fact finding mission on the Paying Taxes indices of the
Doing Business Report, field visits were conducted at the Spanish Town Tax Office and the
Stamp Office.
Structural Improvements
For FY 2018/19, three major upgrade/redesign projects were planned, to include completion of
the Donald Sangster Building, the Falmouth Tax Office, and the renovation of office space for
the Large Taxpayer Office (LTO).
As at end of July 2018, the Donald Sangster Building is 95% complete and is expected to be
completed by end Q2. The construction of the Falmouth Tax Office is complete and is to be
outfitted for occupancy. The renovation of the LTO office space is pending a review of total
space requirements for TAJ in the Air Jamaica Building.
Consultations have taken place for the construction of four new offices. Soil testing is being
conducted in Portmore, while awaiting the National Contractors Commission approval to engage
a consultant. Christiana’s bidding document is being adjusted for advertising, while the approval
of Cabinet was sought for the purchase of property for the construction of tax offices at Cross
Roads and Browns Town.
Human Capital
Building leadership capacity of the organization is being pursued as TAJ continues to strengthen
its human capital and reinforce guiding principles for positive staff engagement. This strategic
initiative is being supported by implementing the findings from the employee satisfaction survey,
along with strengthening the staff performance management system via workshops and sessions,
to advance the desired outcomes for improved staff and organizational performance.
TAJ continued its training programme, geared at strengthening staff capabilities. Specific focus
was placed on strengthening audit capabilities in the area of BEPS/Transfer Pricing.

Ministry of Finance and the Public Service Fiscal Policy Paper Interim Report September 2018 Page 56
Corporate Governance
The corporate governance framework is being enhanced with the institutionalization of the
Enterprise Risk Management (ERM) framework, aimed at providing risk treatment strategies to
strengthen strategic objective efforts for TAJ. Specifically, work was advanced on TAJ’s risk
appetite, Annual ERM Plan, Enterprise Risk Register, and in coordinating business continuity
tests to assess TAJ’s responsiveness to critical unforeseen events such as hurricanes. Internal
audit recommendations for internal controls to be strengthened continued to reinforce the lines of
defence. The establishment of a corporate policy framework to guide the development and
review of new and existing policies across the organization is also being advanced.

Ministry of Finance and the Public Service Fiscal Policy Paper Interim Report September 2018 Page 57
Jamaica Customs Agency
Introduction
The Jamaica Customs Agency (JCA) is an essential arm of the GOJ, contributing thirty five
percent (35.0%) of national tax revenue annually. The Agency carries out its core functions of:
border protection; trade promotion and facilitation; and travel; in an efficient and effective
manner. The Agency has a collaborative approach with other key stakeholders, which allows
effective border management of persons and goods, while managing and mitigating related risks.
Operating Environment
The JCA operates in a dynamic environment where opportunities and risks have to be
continually monitored and managed in a systematic way. During the April-August period of
FY 2018/19, the Agency emphasized the engagement of stakeholders, the interception of illegal
international activities and illicit trade, and the promotion of public health and safety.
Achievements: April 2018 to August 2018
Revenue Collection
Revenue collection within the JCA continues to record steady growth. As at August 31, 2018,
tax revenue collections of $84.6bn was $3.2bn or 4.0% above the 5-month target of $81.4bn. In
comparison to the FY to August 31, 2017, tax revenue grew by $7.7bn or 10.1% from $76.9bn
collected in 2017. Total net revenue collected was $91.1bn which represented 104.0% of the 5-
month target of $87.7bn. In comparison to the FY to August 31, 2017, revenue grew by
approximately $7.9bn or 10.0% from $83.2bn collected in 2017.
Trade Facilitation
Thirty-four thousand nine hundred and thirty one (34,931) commercial declarations were
submitted during the first five months of the fiscal year, of which twenty-seven thousand eight
hundred and fifty three (27,853) or 79.1% were processed within 24 hours of submission.
The average passenger processing time was 3 minutes and 12 seconds for the red channel and
19.9 seconds for the green channel.
Border Protection
The JCA seized one (1) firearm, two (2) magazines and forty-three (43) rounds of ammunition.
A total of 188,739 cigarette sticks have been seized. Drug seizures include a total of sixteen (16)
cocaine seizures and one hundred and fourteen (114) marijuana seizures totalling 774.90

Ministry of Finance and the Public Service Fiscal Policy Paper Interim Report September 2018 Page 58
kilograms. Cash seizures made by the Agency include the following:
• US$191,568.89
• £11,250.00
• Cdn$160.00
• Bds$349.13
• €4,240.00
Legislative Amendments
The Agency intends to prepare a Bill to repeal and replace the Customs Act for tabling in the
Houses of Parliament by March 2019. The JCA has obtained technical assistance from
international partners (The World Bank and the International Monetary Fund) and consultations
with stakeholders are on-going.
In addition, further drafting instructions have been issued to the Office of Parliamentary Counsel
and a second draft of the reviewed Bill is expected.
Human Resource Management and Development
As at August 2018, the current staff complement is one thousand, two hundred and eighty-two
(1,282), of which, one thousand one hundred and thirty-eight (1,138) or 88.0% are on the
Executive Agency structure. There are one hundred and six (106) temporary/contracted staff.
Thirty-eight employees remain on the Jamaica Customs Department structure.
Stakeholder Engagement
The Agency hosted a Customs Business Partnership Forum in August 2018. A ‘Customs Meet
the Community’ mobile engagement was held in Savanna-la-Mar, Westmoreland on July 12,
2018. In addition, five (5) Quality Assurance stakeholder engagements have been held with
various parties.

Ministry of Finance and the Public Service Fiscal Policy Paper Interim Report September 2018 Page 59
APPENDIX IV
Developments in the Financial Sector
Introduction
The Ministry of Finance and the Public Service (MOFPS) has continued its commitment to
maintaining stability in the financial sector, intensifying its efforts to improve the legislative
framework and strengthen the institutional capacity to supervise financial institutions. The
Financial Investigations Division (FID) continues to actively pursue its mandate of dealing with
matters relating to financial crimes, including money laundering; while the Financial Sector
Adjustment Company (FINSAC) Limited continues winding down operations. Key
achievements for the fiscal year thus far are as follows:
Bank of Jamaica (Amendment) Act
The detailed Cabinet Submission with proposal to amend the BOJ Act to enhance the BOJ’s
governance and autonomy was approved by the Minister, and subsequently submitted to the
Cabinet for approval on May 17, 2018. The Cabinet’s approval was received on May 21, 2018
and drafting instructions were prepared and issued by the MOFPS to the Chief Parliamentary
Counsel (CPC) in June 2018. The MOFPS received the first draft of the Bill from the CPC on
June 29, 2018, which was circulated to the BOJ for their comments. Further instructions were
issued to the CPC in August 2018, taking into account the comments received from the BOJ.
The Bill went through two more iterations, with the third draft being sent to the Attorney
General’s Chambers (AGC) for their comments on August 24, 2018. Comments were received
from the AGC on September 6, 2018 and are currently under review by the Ministry and the
BOJ.
Banking Services Act (BSA)
The MOFPS issued further drafting instructions on the Banking Services (Capital Adequacy)
Regulations and Banking Services (Financial Holding Companies) (Licence Application) Rules
on March 8, 2018; second drafts were received from the CPC on May 4, 2018 and May 24, 2018
respectively. Both were forwarded to the BOJ and comments on the Rules were received on
August 3, 2018. Further drafting instructions were issued to the CPC on August 16, 2018 to
revise the Rules. The Ministry is awaiting feedback from the BOJ on the Capital Adequacy
Regulations.

Ministry of Finance and the Public Service Fiscal Policy Paper Interim Report September 2018 Page 60
Private Sector Pensions Reform
The MOFPS received comments on the Pensions (Superannuation Funds & Retirement
Schemes) Bill from the Financial Services Commission (FSC) on January 4, 2018. The
comments were reviewed and clarification sought from the FSC regarding certain items. Further
instructions were issued to the CPC to revise the Bill on February 13, 2018 and a second draft of
the Bill was received on May 22, 2018. This was circulated to the FSC and Tax Administration
Jamaica (TAJ). The Ministry has since received comments from the FSC in September 2018.
Insurance (Amendment) Act
Since January 2018, there have been several iterations of the Bill to amend the Insurance Act in
order to facilitate the creation of a micro-insurance legislative framework. The draft Bill that
was received in March 2018 was sent to the AGC for comments and was subsequently
withdrawn as a consequence of the FSC submitting additional proposals in April 2018. Further
drafting instructions were sent to the CPC to revise the draft Bill on May 24, 2018. The MOFPS
received the revised draft of the Bill from the CPC on June 6, 2018, which was forwarded to the
FSC. The Ministry is awaiting the feedback of the FSC.
Proposed Microcredit Act
During 2018, there have been several iterations of the Bill to enact legislation for the licensing
and regulation of microcredit institutions. The latest draft of the Bill was received from the CPC
on June 8, 2018 and subsequently circulated to the AGC and other key stakeholders for review
and feedback. The MOFPS received comments from the AGC on July 10, 2018 requesting
clarification on some issues. Once these issues were settled, the MOFPS issued further drafting
instructions to the CPC on September 3, 2018. The instructions took into account the comments
of the AGC and the other stakeholders.
Proposed Credit Union (Special Provisions) Act
During 2018, there have been several iterations of the BOJ (Credit Union) Bill for the enactment
of legislation to facilitate the supervision of credit unions by the BOJ. The MOFPS received the
third draft of the Credit Union Bill from the CPC on May 17, 2018, which was circulated to the
key stakeholders for review and feedback. Comments from the BOJ were received on
July 2, 2018 and further instructions were sent to the CPC on July 12, 2018 to revise the Bill.
The Ministry received a fourth draft of the Credit Union Bill from the CPC on July 31, 2018,
Ministry of Finance and the Public Service Fiscal Policy Paper Interim Report September 2018 Page 61
which was circulated to the key stakeholders for comments. The BOJ submitted comments on
the draft Bill on September 10, 2018.
Proposed Amendment to the Financial Services Commission Act
On July 30, 2018, the MOFPS sought Cabinet’s approval of the proposals for legislative
amendments to the Financial Services Commission Act for the establishment of group-wide
supervision of non-deposit taking financial groups. Cabinet approved the Submission on
August 7, 2018 and drafting instructions were prepared and issued by the MOFPS to the CPC on
August 31, 2018.
Proposal for the enhancement of the Resolution Framework for Financial Institutions The process of preparing the legislation for the Special Resolution Regime (SRR) for financial
institutions (FIs) comprises three (3) work streams, which are currently at various stages of
progress. With respect to the administrative component (ARR), which addresses systemically
important financial institutions (SIFIs), drafting instructions were sent to the CPC in April 2018,
and in August 2018 a working/preliminary draft of the Bill was submitted to the MOFPS. The
draft has been circulated to the stakeholders for review and feedback.
Work has progressed on the other components of the SRR, such as the funding of the SRR
activities component and the insolvency for financial institutions (SIF) component. Both
components are critical elements of the SRR and will merge with the ARR component once
Cabinet’s approval is received for each policy.
National Financial Inclusion Strategy (NFIS)
Since establishment of the National Financial Inclusion Council (NFIC) and the subsequent
launch of the National Financial Inclusion Strategy (NFIS) in 2017, the working groups under
the Financial Inclusion Steering Committee (FISC) have been working towards the
implementation of the action plans contained in the NFIS. The working groups cover the areas
of Medium, Small and Micro Enterprises (MSME) and agriculture finance, housing finance,
consumer protection and financial capability, and retail payment systems. On July 27, 2018, the
BOJ and the Financial Inclusion Technical Secretariat (FITS) hosted the NFIC Meeting, in which
the Annual Report was tabled. An animated piece and play were staged to promote greater
understanding of financial inclusion and the NFIS Brand Ambassadors were introduced. The
Ministry of Finance and the Public Service Fiscal Policy Paper Interim Report September 2018 Page 62
Minister of Finance and the Public Service has begun circulating the animated piece on social
media.
Financial Investigations Division (FID)
During the review period, the FID continued to pursue its mandates under the Financial
Investigations Division Act (FIDA) and the Proceeds of Crimes Act (POCA). Some notable
achievements of the FID are outlined below:
• In April 2018, FID obtained two orders from the Corporate Parish Court pursuant to section 50 of the POCA for the Victoria Mutual Building Society and the Jamaica National Bank to pay over the sums of £84,897.81, and approximately J$14,473.54 to the Agency in respect of accounts held by defendants who were convicted in the UK, and in response to a request for assistance by the UK in enforcing the outstanding sums relating to the confiscation order that the defendants failed to satisfy in full. The sums that have been transferred to the FID pursuant to the court order will eventually be shared with the UK.
• In May 2018, FID obtained a criminal restraint order from the Supreme Court restraining the assets of a defendant who committed credit card fraud and has been charged for money laundering and other offences. The assets restrained include bank accounts with currently known balance of J$780,000.00.
• FID obtained two cash forfeiture orders in relation to a total of US$485,700.00 and J$123,505.00 in May 2018 and a cash forfeiture order in relation to US$11,500.00 and J$266,000.00 in June 2018 from the Corporate Area Parish Court pursuant to section 79 of the POCA. The orders, which have since been forfeited to the Crown, will also be remitted to the Consolidated Fund.
• In July 2018, FID obtained two civil restraint orders restraining J$24,809,257.00 held in the bank account of the defendants in one matter and a total of J$71,210.65 held in the bank account of the defendant in another matter. In the first matter, one of the defendants has been convicted on various fraud and money laundering offences in the Turks and Caicos and the United States of America.
• In August 2018, FID successfully defended an application brought by a defendant to set aside a default judgment that had been granted in favour of the Agency ordering the civil recovery of 5 real properties and 11 motor vehicles. The defendant’s application to set

Ministry of Finance and the Public Service Fiscal Policy Paper Interim Report September 2018 Page 63
aside the judgment was dismissed. The civil recovery order that was obtained therefore still stands.
• In September 2018, FID obtained a criminal restraint order from the Supreme Court restraining the assets of a defendant who the Agency is investigating for possible money laundering offences. The restraint order covers several bank accounts which contain over J$2mn and US$5,999.03, four motor vehicles and cash transfers made to third parties totalling approximately J$32mn.
The value of the various cash seizures and forfeitures for the period April to August 2018 is
outlined below:
For the period February - August 2018, the following reports were submitted to the FID by the
regulated sector and Jamaica Customs Agency10: -
Month Threshold Transaction
Reports TTR
Suspicious Transaction
Report
Listed Entity Report (Terrorism Prevention Act)11
Authorised Disclosures
Cross Border Reports
Entities/Individuals
February 2,720 8,125 - - 37/3
March 164 6,186 - - 42/15
April 21,156 8,065 142 8 36/13
May 20,989 1,052 - 3 43/17
June 7,009 13,746 3 50/13
July 25,942 4,575 - - 34/17
August 8,454 4,603 - /20
10 JCA submits on monthly basis reports filed by individuals leaving or entering our ports with cash of US$10,000 or more or its
equivalent in any other currency. 11 Reports pursuant to the TPA are made every four months to be filed on or before the last day of the 5th month.

Ministry of Finance and the Public Service Fiscal Policy Paper Interim Report September 2018 Page 64
The FID on September 1, 2018, implemented a new online reporting system goAML12, which is
an integrated database and intelligent analysis system intended for use by Financial Intelligence
Units. The acquisition of goAML will significantly enhance the work of the Financial
Intelligence Unit (FIU) of the FID because of its analytical features, which will enable the FIU to
analyse reports received to determine new trends and typologies in money laundering and
terrorist financing for the benefit of all stakeholders.
Financial Sector Adjustment Company Ltd and Financial Institutions Services Ltd
During the review period, a decision was made to significantly scale down operations, and
consequently, contracts for six (6) staff were not renewed during the calendar year and as at
August 1, 2018, there were two (2) staff members remaining to manage the legacy operations
pending final closure.
• FINSAC continued efforts to sell remaining properties under its control. Completion of
the sale of several properties was achieved as follows: -
- Mutual Life owned warehouse complex on Osbourne Road, Kingston 10 was concluded
in November 2017 and netted J$73M.
- 17-acre beachfront property at Culloden, Westmoreland owned by Ciboney Group
Limited was concluded in December 2017 and netted US$1.8M. From this amount,
FINSAC received loan payment and capital distribution totalling J$152M.
- The sale of three ½-acre lots at Drax Hall, St. Ann and Sterling Castle Property, St.
Andrew concluded during the financial year, from which FIS netted J$30M.
• In addition to the real estate mentioned above, there were a number of FINSAC-related
entities with shares in various listed companies. During the year, a total of J$24M was
collected by Mutual Life from share sales. Efforts will continue to be made to dispose of
listed shares owned by dissolved companies. The value of these shares is in excess of
J$40M.
• There are some litigation matters being pursued in the Courts by or against FINSAC and
its affiliated entities. The main issues are as follows:
- A case inherited by FINSAC against the former Eagle Commercial Bank for allegedly
withholding J$15M from its customer’s account and the claim for resultant loss of
business/profit. Judgment was handed down in favour of the claimant in 2014 requiring
12 GoAML is a United Nations Office on Drugs and Crime response to financial crime including money laundering and terrorist
financing.

Ministry of Finance and the Public Service Fiscal Policy Paper Interim Report September 2018 Page 65
FINSAC to pay $15M plus interest compounded monthly since October 1992, and costs.
On appeal, this decision was reversed, primarily requiring FINSAC to pay a smaller sum
of J$9M on simple interest basis instead of compound, with FINSAC paying costs to the
Claimant in the court below and the Claimant paying costs to FINSAC in the Court of
Appeal. The Claimant has indicated his intention to appeal to the Privy Council, for
which, a date is to be set locally to hear and give approval for the matter to proceed to the
Privy Council.
- The Privy Council handed down a judgment of about J$3 Billion plus interest in favour
of FIS in 2005 in the Century litigation. Since this time, various properties owned by the
former chairman or related entities have been sold to reduce the debt, including the Drax
Hall and Sterling Castle properties mentioned above. There are three (3) properties
[½-acre Drax Hall lot, ¼-acre residential lot in Black River and 16-acre farm land in
Hanover] remaining to be sold with estimated value of J$18M.
- A judgment of J$1B was handed down in May 2006 against the Claimant in favour of
FINSAC in the Eagle litigation. This decision was appealed and the appeal was heard in
late 2013. Due to the delay in handing down judgment as all three judges had proceeded
on retirement, a motion was filed in October 2017 primarily for a new hearing of the
appeal to be scheduled before new judges, for costs in the court below and the original
appeal to be paid by FINSAC and for FINSAC to continue to pay legal fees/living
expenses of US$5,000 pm to the Claimant from the 50% net sale proceeds of Grenada
Crescent property being held by FINSAC. The retired judges handed down a judgment
on December 1, 2017.
The application filed in October was heard on December 18 & 19, 2017 and the decision handed
down in July 2018, declaring as a nullity the previous Court of Appeal hearing and the decision
handed down on December 1, 2017 ruling instead that a date should be set for a fresh appeal. No
order was made for costs in either matter and FINSAC was not required to resume the monthly
payments. The Claimant has indicated that he will appeal to the Privy Council.
In addition, in February 2017, the Claimant brought an action in the Miami-Dade County Court
claiming US$3 million for wrongful injunction resulting from actions commenced by FINSAC in
April 2007 in attempts to collect under the judgment it received in the local court. This matter
appears to be on hold pending final outcome in the local courts.
• FINSAC continued to interface with the administrators, Guardian Life Limited (GLL),
the Actuaries (Eckler) and Financial Services Commission (FSC) with a view to
resolving the following outstanding pension-related matters: -

Ministry of Finance and the Public Service Fiscal Policy Paper Interim Report September 2018 Page 66
� Jamaica Mutual Life Staff Superannuation Fund: -
- Two of the three schemes have no surplus, while the third has a surplus. In line with
the Trust Deeds and Rules, no part of this surplus is to be paid to the employer. The
actuary has done the requisite calculations to determine the amounts payable to each
beneficiary. In line with regulations, the FSC’s approval has been sought regarding
the distribution of the surplus and FINSAC awaits its response.
- Effort continues to be made to locate beneficiaries across the three schemes as they
have not contacted the administrators. The first of the five (5) annual mandatory
advertisements was done by GLL in February 2018 which resulted in just over 150
beneficiaries coming forward - another 270 remain to be located. Where the benefits
remain unclaimed after the 5 years, the moneys should be remitted to the Supreme
Court.
� Scheme for the Jamaica Mutual Properties Limited - Distribution of surplus to the
beneficiaries commenced in June 2015. Efforts continue to locate remaining
beneficiaries to facilitate completion of the pay-out.
• Resolution of matters regarding a property in St. Lucia which was owned by Mutual Life
et al compulsorily acquired by the Government of St. Lucia (GOSL) in April 2008: - The
final payment under the agreement with the GOSL was made in March 2018. Over the
period, a total of US$4.665M was received, comprising principal of US$4M and $665K
in interest.

Ministry of Finance and the Public Service Fiscal Policy Paper Interim Report September 2018 Page 67
Ministry of Finance and the Public Service 30 National Heroes Circle, Kingston 4, Jamaica W.I. Tel (876) 922-8600, website: www.mof.gov.jm
Printed by the Ministry of Finance and the Public Service