government of india ministry of earth sciences india ...agricoop.nic.in/sites/default/files/cwwg...
TRANSCRIPT

ALL INDIA WEEKLY WEATHER REPORT
25-31 JANUARY 2018
Table-1(A) Table-1(B) Table-1(C) Table-2 Table-3 Fig-1 Fig-2 Annexure-1
SIGNIFICANT WEATHER FEATURES
Fog: o Dense to very dense fog observed at many places over Punjab, Haryana, Chandigarh & Delhi, Uttar
Pradesh and Bihar on a few days; at a few places over northwest Rajasthan and Sub Himalayan West Bengal and at isolated places over Assam & Meghalaya and Nagaland, Manipur, Mizoram & Tripura on one or two days during the week.
Cold Day: o Cold day to severe cold day conditions observed at isolated places over Punjab, Haryana & Delhi, Uttar
Pradesh and Bihar on many days and over Sub Himalayan West Bengal & Sikkim and North Rajasthan on one or two days during the week. The lowest maximum temperature of 11.4º C was recorded at Najibabad (West Uttar Pradesh) in the plains of the country on 26th January 2018 during the week.
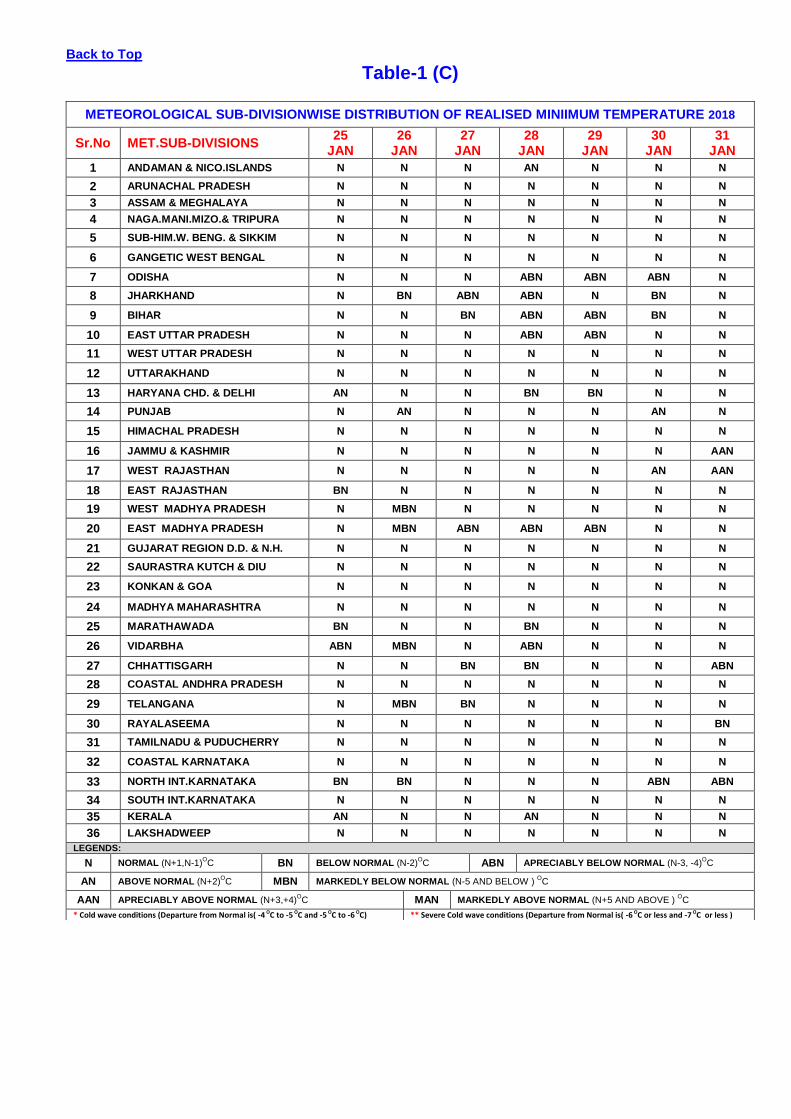
Cold Wave: o Cold wave conditions observed at isolated places over Vidarbha, southern parts of East Madhya
Pradesh and northern parts of Rajasthan, Punjab, Haryana and Odisha on a few days and over East Uttar Pradesh, Bihar, West Madhya Pradesh, Himachal Pradesh, Uttarakhand, Marathwada and Sub Himalayan West Bengal on one to two days in the week. The lowest minimum temperature of 2.0 ºC was recorded at Bhilwara (Rajasthan) in the plains of the country on 25th January 2018 during the week.
LEGEND: Few days-(3 days), Many days-4 to 5 days and Most days-6 to 7 days during the week.
METEOROLOGICAL ANALYSIS
Last week’s the cyclonic circulation at 1.5 km above mean sea level over South East Arabian Sea off Kerala coast persisted on 25th; it lay as a trough over the same region at 1.5 km above mean sea level on 26th and became less marked on 27th January 2018.
Last week’s the trough of low at mean sea level over South East Bay of Bengal and neighbourhood lay extending from South East Bay of Bengal to north Andaman Sea with an embedded cyclonic circulation extending up to 3.1 km above mean sea level over southeast Bay of Bengal & neighbourhood on 25th & 26th January. It lay over central parts of South Bay of Bengal and adjoining Equatorial Indian Ocean with the embedded cyclonic circulation extending up to 2.1 km above mean sea level on 27th. The trough persisted over the same region with the embedded cyclonic circulation extending up to 3.1 km above mean sea level on 28th. It lay over Equatorial Indian Ocean and adjoining South West Bay of Bengal with the embedded cyclonic circulation extending up to 1.5 km above sea level on 29th. It lay over Equatorial Indian Ocean and adjoining southwest Bay of Bengal off south Sri Lanka coast with the embedded cyclonic circulation extending up to 0.9 km above mean sea level on 30th & 31st January 2018.
Last week’s the trough of low at mean sea level from Lakshadweep area to South East Arabian Sea off Kerala Coast has moved away westwards on 25th January 2018.
Last week’s remnant western disturbance as a trough in mid & upper level westerlies has moved away east-northeastwards on 25th January 2018.
A cyclonic circulation at 3.1 km above mean sea level lay over Sikkim & neighbourhood on 25th and it lay as a north-south trough over the Sub-Himalayan West Bengal & Sikkim between 2.1 km & 3.1 km above mean sea level on 26th .It lay over the same area at 2.1 km above mean sea level on 27th January. It lay as a cyclonic circulation over Meghalaya & neighbourhood extending up to 2.1 km above mean sea level on 28th and became less marked on 29th January 2018.
A cyclonic circulation extending upto 0.9 km above mean sea level lay over South Interior Karnataka & neighbourhood on 25th; It lay over Coastal Karnataka & neighbourhood at 0.9 km above sea level on 26th; over North Interior Karnataka and adjoining south Maharashtra on 27th & 28th and has become less marked on 29th January 2018.
A feeble Western Disturbance as an upper air cyclonic circulation at 3.1 km above mean sea level lay over north Pakistan & neighbourhood on 27th; It lay over northeast Jammu & Kashmir & neighbourhood on 28th morning and moved away east-north eastwards in the evening of the same day.
A Western Disturbance as an upper air cyclonic circulation extending upto 9.5 km above mean sea level lay over Iraq & neighbourhood on 27th; It lay over western parts of Iran & neighbourhood on 28th .It lay over
Government of India Ministry of Earth Sciences
India Meteorological Department National Weather Forecasting Centre

eastern parts of Iran and neighbourhood as a cyclonic circulation extending up to 3.1 km above sea level with a trough aloft at 5.8 km above sea level with its axis roughly along Longitude 56 º E to the north of Latitude 30 º N on 29th. It lay as a trough at 3.1 km above mean sea level with its axis roughly along longitude 67.0°E to the north of Latitude 32.0°N on 30th and has moved away north eastwards on 31st January 2018.
A cyclonic circulation at 1.5 km above mean sea level lay over Lakshadweep area & neighbourhood on 27th and it has moved away westwards on 28th January 2018.
Another cyclonic circulation at 0.9 km above mean sea level lay over South West Bay of Bengal off Tamilnadu coast on 27th and became less marked on 28th January 2018.
A cyclonic circulation between 1.5 & 3.1 km above mean sea level lay over Malay Peninsula & adjoining Andaman Sea on 28th; it persisted over the same region and extended up to 3.1 km above mean sea level on 29th and up to 1.5 km above mean sea level on 30th. It has become less marked on 31st January 2018.
A cyclonic circulation lay over east Bihar & neighbourhood extending upto 0.9 km above mean sea level on 29th and it became less marked on 30th January 2018.
The feeble trough of low at mean sea level lay over Lakshadweep & neighbourhood on 30th and it became less marked on 31st January 2018.
An induced cyclonic circulation at 0.9 km above sea level associated with WD lay over northwest Rajasthan and neighbourhood on 30th and it has become less marked on 31st as the WD moved away northeastwards.
A Western Disturbance lay as a trough in mid & upper tropospheric westerlies with its axis at 5.8 km above mean sea level roughly along longitude 56°E to the north of Latitude 28°N on 31st January 2018.
A upper air cyclonic circulation lay over east Bihar and adjoining Sub-Himalayan West Bengal extending upto 1.5 km above mean sea level on 31stJanuary 2018.
A feeble trough of low at mean sea level lay over Maldives & neighbourhood 31st January 2018.
RAINFALL SUMMARY
Rainfall During The Week (25-31 Jaunary 2018)
Rainfall was normal in 2, deficient/large-deficient in 7 and no rain in 27 out of 36 meteorological sub-divisions. (All India Actual: 0.6 mm, Normal: 5.4 mm and Departure: -89%).
Cumulative Seasonal Rainfall (01-31 Jaunary 2018)
Rainfall was large-excess in 1, deficient/large-deficient in 19 and no rain in 16 out of 36 meteorological sub-divisions. (All India Actual: 2.9 mm, Normal: 19.2 mm and Departure: -85%).
Sub-division wise weekly and seasonal rainfall distribution is presented in Fig-1 and Fig-2.
Sub-divisionwise daily distribution of realised rainfall is shown in Table-1(A).
Sub-divisionwise daily distribution of realised minimum temperature is shown in Table-1(C)
Statewise distribution of number of districts with Large-Excesse, Excess, Normal, Deficient, Large-deficient and no rainfall is shown in Table-2.
A comparative data of cumulative seasonal rainfall during the corresponding period in the last five years is given in Table-3.
Sub-divisionwise realised weekly rainfall (in cm) is shown in Annexure-1.
METEOROLOGICAL ANALYSIS AS ON 01 FEBRUARY 2018
The Western Disturbance as a trough in mid & upper tropospheric westerlies with its axis at 3.1 km above mean sea level roughly along longitude 71°E and north of Latitude 28°N persists.
The upper air cyclonic circulation over east Bangladesh & neighbourhood and extending upto 1.5 km above mean sea level persists.
The trough of low at mean sea level over Maldives area to Lakshadweep area with the embedded cyclonic circulation over Maldives & neighbourhood extending upto 0.9 km above mean sea level persists.
An induced cyclonic circulation over north West Rajasthan & neighbourhood and extending upto 0.9 km above mean sea level persists.
The fresh Western Disturbance as a trough in midlevel westerlies roughly along longitude 52°E and north of Latitude 28°N persists.
A fresh Western Disturbance likely to affect western Himalayan region from 5th February onwards.
FORECAST & WARNING FOR THE NEXT WEEK 01 FEBRUARY TO 07 FEBRUARY 2018
Detailed seven days Sub-division wise rainfall-forecast & weather-warning is given in Table-1(B).

Table-1 (A)
METEOROLOGICAL SUB-DIVISIONWISE DISTRIBUTION OF REALISED RAINFALL -2018
S.No. MET.SUB-DIVISIONS 25
JAN 26
JAN 27
JAN 28
JAN 29
JAN 30
JAN 31
JAN
1 ANDAMAN & NICO.ISLANDS SCT ISOL SCT SCT SCT ISOL ISOL
2 ARUNACHAL PRADESH WS SCT WS ISOL ISOL ISOL D
3 ASSAM & MEGHALAYA ISOL ISOL ISOL ISOL ISOL D D
4 NAGA.MANI.MIZO.& TRIPURA D D D D D D D
5 SUB-HIM.W. BENG. & SIKKIM ISOL D ISOL ISOL ISOL D ISOL
6 GANGETIC WEST BENGAL D D D D D D D
7 ODISHA D D D D D D D
8 JHARKHAND D D D D D D D
9 BIHAR D D D D D D D
10 EAST UTTAR PRADESH D D D D D D D
11 WEST UTTAR PRADESH ISOL D D D D D D
12 UTTARAKHAND D D D D D D D
13 HARYANA CHD. & DELHI D D D D D D D
14 PUNJAB D D D D D D D
15 HIMACHAL PRADESH D D D D D D D
16 JAMMU & KASHMIR D D D D D ISOL SCT
17 WEST RAJASTHAN D D D D D D D
18 EAST RAJASTHAN D D D D D D D
19 WEST MADHYA PRADESH D D D D D D D
20 EAST MADHYA PRADESH D D D D D D D
21 GUJARAT REGION D.D. & N.H. D D D D D D D
22 SAURASTRA KUTCH & DIU D D D D D D D
23 KONKAN & GOA D D D D D D D
24 MADHYA MAHARASHTRA D D D D D D D
25 MARATHAWADA D D D D D D D
26 VIDARBHA D D D D D D D
27 CHHATTISGARH D D D D D D D
28 COASTAL ANDHRA PRADESH D D D D D D D
29 TELANGANA D D D D D D D
30 RAYALASEEMA D D D D D D D
31 TAMILNADU & PUDUCHERRY ISOL D D D D ISOL D
32 COASTAL KARNATAKA D D D D D D D
33 NORTH INT.KARNATAKA D D D D D D D
34 SOUTH INT.KARNATAKA D D D D D D D
35 KERALA ISOL ISOL D ISOL ISOL D D
36 LAKSHADWEEP SCT D D SCT SCT D D
LEGENDS:
WS WIDE SPREAD / MOST PLACES (76-100%) FWS FAIRLY WIDE SPREAD / MANY PLACES (51% to 75%)
SCT SCATTERED / FEW PLACES (26% to 50%) ISOL ISOLATED (up to 25%) D/DRY NO STATION REPORTED RAINFALL
* ACTIVE (R/F 11/
2- 4 times the normal with WS/FWS, at least 2 stations should be 5 cm. along west coast & 3 cm. elsewhere )
** VIGOROUS (R/F More than 4 times the normal with WS/FWS, at least 2 stations should be 8 cm. along west coast & 5 cm. elsewhere)

Back to Top
Table-1 (B)
METEOROLOGICAL SUB-DIVISIONWISE WEEKLY RAINFALL FORECAST & Wx. WARNINGS-2018
Sr. No MET.SUB-DIVISIONS 01
FEB 02
FEB 03
FEB 04
FEB 05
FEB 06
FEB 07
FEB
1 ANDAMAN & NICO.ISLANDS ISOL ISOL SCT SCT ISOL ISOL D
2 ARUNACHAL PRADESH ISOL ISOL SCT SCT ISOL ISOL ISOL
3 ASSAM & MEGHALAYA D ISOL ISOL ISOL D D D
4 NAGA.MANI.MIZO.& TRIPURA D D ISOL D D D D
5 SUB-HIM.W. BENG. & SIKKIM D ISOL ISOL D D D D
6 GANGETIC WEST BENGAL D D D D D D D
7 ODISHA D D D D D D D
8 JHARKHAND D D D D D D D
9 BIHAR D D D D D D D
10 EAST UTTAR PRADESH D D D D D D D
11 WEST UTTAR PRADESH D D D D D D D
12 UTTARAKHAND D D D D ISOL ISOL D
13 HARYANA CHD. & DELHI D D D D D D D
14 PUNJAB D D D D D D D
15 HIMACHAL PRADESH D D ISOL D ISOL D D
16 JAMMU & KASHMIR ISOL ISOL SCT ISOL ISOL D ISOL
17 WEST RAJASTHAN D D D D D D D
18 EAST RAJASTHAN D D D D D D D
19 WEST MADHYA PRADESH D D D D D D D
20 EAST MADHYA PRADESH D D D D D D D
21 GUJARAT REGION D.D. & N.H. D D D D D D D
22 SAURASTRA KUTCH & DIU D D D D D D D
23 KONKAN & GOA D D D D D D ISOL
24 MADHYA MAHARASHTRA D D D D D D ISOL
25 MARATHAWADA D D D D D D D
26 VIDARBHA D D D D D D D
27 CHHATTISGARH D D D D D D D
28 COASTAL ANDHRA PRADESH D D D D D D D
29 TELANGANA D D D D D D D
30 RAYALASEEMA D D D D D D D
31 TAMILNADU & PUDUCHERRY D D D D ISOL ISOL SCT
32 COASTAL KARNATAKA D D D D D D D
33 NORTH INT.KARNATAKA D D D D D D ISOL
34 SOUTH INT.KARNATAKA D D D D D ISOL ISOL
35 KERALA D D D D D ISOL SCT
36 LAKSHADWEEP D D D D D ISOL ISOL
LEGENDS:
WS WIDE SPREAD / MOST PLACES (76-100%) FWS FAIRLY WIDE SPREAD / MANY PLACES (51% to 75%)
SCT SCATTERED / FEW PLACES (26% to 50%) ISOL ISOLATED (up to 25%) D/DRY NIL RAINFALL
● Heavy Rainfall (64.5-115.5 mm)
●● Heavy to Very Heavy Rainfall (115.6-204.4 mm)
●●● Extremely Heavy Rainfall (204.5 mm or more)
FOG * SNOWFALL # HAILSTORM HEAT WAVE + SEVERE HEAT WAVE
$ THUNDER SQUALL DS/TS DUST/THUNDERSTORM COLD WAVE - SEVERE COLD WAVE
Back to Top
Table-1 (C)
METEOROLOGICAL SUB-DIVISIONWISE DISTRIBUTION OF REALISED MINIIMUM TEMPERATURE 2018
Sr.No MET.SUB-DIVISIONS 25
JAN 26
JAN 27
JAN 28
JAN 29
JAN 30
JAN 31
JAN
1 ANDAMAN & NICO.ISLANDS N N N AN N N N
2 ARUNACHAL PRADESH N N N N N N N
3 ASSAM & MEGHALAYA N N N N N N N
4 NAGA.MANI.MIZO.& TRIPURA N N N N N N N
5 SUB-HIM.W. BENG. & SIKKIM N N N N N N N
6 GANGETIC WEST BENGAL N N N N N N N
7 ODISHA N N N ABN ABN ABN N
8 JHARKHAND N BN ABN ABN N BN N
9 BIHAR N N BN ABN ABN BN N
10 EAST UTTAR PRADESH N N N ABN ABN N N
11 WEST UTTAR PRADESH N N N N N N N
12 UTTARAKHAND N N N N N N N
13 HARYANA CHD. & DELHI AN N N BN BN N N
14 PUNJAB N AN N N N AN N
15 HIMACHAL PRADESH N N N N N N N
16 JAMMU & KASHMIR N N N N N N AAN
17 WEST RAJASTHAN N N N N N AN AAN
18 EAST RAJASTHAN BN N N N N N N
19 WEST MADHYA PRADESH N MBN N N N N N
20 EAST MADHYA PRADESH N MBN ABN ABN ABN N N
21 GUJARAT REGION D.D. & N.H. N N N N N N N
22 SAURASTRA KUTCH & DIU N N N N N N N
23 KONKAN & GOA N N N N N N N
24 MADHYA MAHARASHTRA N N N N N N N
25 MARATHAWADA BN N N BN N N N
26 VIDARBHA ABN MBN N ABN N N N
27 CHHATTISGARH N N BN BN N N ABN
28 COASTAL ANDHRA PRADESH N N N N N N N
29 TELANGANA N MBN BN N N N N
30 RAYALASEEMA N N N N N N BN
31 TAMILNADU & PUDUCHERRY N N N N N N N
32 COASTAL KARNATAKA N N N N N N N
33 NORTH INT.KARNATAKA BN BN N N N ABN ABN
34 SOUTH INT.KARNATAKA N N N N N N N
35 KERALA AN N N AN N N N
36 LAKSHADWEEP N N N N N N N
LEGENDS:
N NORMAL (N+1,N-1)OC BN BELOW NORMAL (N-2)
OC ABN APRECIABLY BELOW NORMAL (N-3, -4)
OC
AN ABOVE NORMAL (N+2)OC MBN MARKEDLY BELOW NORMAL (N-5 AND BELOW )
OC
AAN APRECIABLY ABOVE NORMAL (N+3,+4)OC MAN MARKEDLY ABOVE NORMAL (N+5 AND ABOVE )
OC
* Cold wave conditions (Departure from Normal is( -4 OC to -5 OC and -5 OC to -6 OC) ** Severe Cold wave conditions (Departure from Normal is( -6 OC or less and -7 OC or less )

3
Back to Top
Table-2
STATEWISE DISTRIBUTION OF NO. OF DISTRICTS WITH EXCESS, NORMAL,DEFICIENT,SCANTY AND NO RAINFALL
S. STATES
PERIOD FROM : 01.01.2018 TO 31.01.2018
NO. LE E N D LD NR ND TOTAL
1 A & N ISLAND (UT) 3 0 0 0 0 0 0 3
2. ARUNACHAL PRADESH 0 1 2 6 2 2 3 16
3. ASSAM 0 0 2 6 9 10 0 27
4. MEGHALAYA 0 0 0 0 2 2 3 7
5. NAGALAND 0 1 1 1 2 0 6 11
6. MANIPUR 0 0 0 0 2 2 5 9
7. MIZORAM 0 0 0 2 1 1 5 9
8. TRIPURA 0 0 1 0 2 1 0 4
9. SIKKIM 0 0 0 0 4 0 0 4
10. WEST BENGAL 0 0 0 0 2 17 0 19
11. ODISHA 0 0 0 0 2 28 0 30
12. JHARKHAND 0 0 0 0 0 22 2 24
13. BIHAR 0 0 0 0 0 38 0 38
14. UTTAR PRADESH 0 0 0 0 35 37 0 72
15. UTTARAKHAND 0 0 0 2 11 0 0 13
16. HARYANA 0 0 1 4 14 2 0 21
17. CHANDIGARH (UT) 0 0 0 0 1 0 0 1
18. DELHI 0 0 0 1 6 0 2 9
19. PUNJAB 0 1 1 8 9 1 0 20
20. HIMACHAL PRADESH 0 0 0 0 12 0 0 12
21. JAMMU & KASHMIR 0 0 0 0 16 4 2 22
22. RAJASTHAN 0 0 0 1 6 26 0 33
23. MADHYA PRADESH 0 0 0 0 1 50 0 51
24. GUJARAT 0 0 0 0 0 33 0 33
25. DADRA & NAGAR HAVELI (UT) 0 0 0 0 0 0 1 1
26. DAMAN & DIU (UT) 0 0 0 0 0 1 1 2
27. GOA 0 0 0 0 0 2 0 2
28. MAHARASHTRA 0 0 0 0 0 36 0 36
29. CHHATISGARH 0 0 0 0 0 27 0 27
30. ANDHRA PRADESH 0 0 0 0 1 12 0 13
31. TELANGANA 0 0 0 0 0 10 0 10
32. TAMILNADU 1 2 2 2 20 5 0 32
33. PUDUCHERRY (UT) 1 0 0 0 1 0 2 4
34. KARNATAKA 0 0 0 0 0 30 0 30
35. KERALA 1 0 0 2 6 5 0 14
36. LAKSHADWEEP (UT) 0 0 0 1 0 0 0 1
TOTAL 6 5 10 36 167 404 32 660
CATEGORYWISE DISTRIBUTION
OF DISTRICTS OUT OF THE 1% 1% 1% 6% 27% 64%
628 WHOSE DATA RECEIVED
PERCENT DISTRIBUTION OF DISTRICTS IN EARLIER YEARS SINCE 1st JANUARY
DATE LE E N D LD NR
01.02.2017 19% 5% 7% 9% 23% 37%
03.02.2016 0% 10% 6% 16% 37% 31%
28.01.2015 0% 44% 13% 15% 19% 9%
29.01.2014 0% 32% 9% 6% 19% 34%
30.01.2013 0% 14% 8% 11% 26% 41%

4
Back to Top
Table-3
RAINFALL DURING WINTER SEASON
S. No.
Meteorological Sub-Divisions
For the period from 1st January to
30 JAN
2013 29 JAN
2014 28 JAN
2015 03 FEB
2016 02 FEB
2017 31 JAN
2018
1. Andaman & Nicobar Islands
A N D
67 53
+27
42 51 -18
127 49
+161
72 57
+26
229 55
+315
167 54
+212
2. Arunachal Pradesh
A N D
22 47 -53
19 43 -56
10 39 -74
30 59 -49
15 54 -73
31 50 -38
3 Assam & Meghalaya
A N D
1 15 -93
1 15 -90
12 14 -16
18 20 -10
2 18 -91
6 16 -65
4. Naga., Mani., Mizo. & Tripura
A N D
* 13 -98
1 13 -90
11 12 -5
8 16 -49
1 14 -95
6 14 -54
5. Sub-Himalayan West Bengal & Sikkim
A N D
3 25 -86
1 24 -98
12 22 -46
21 30 -30
3 28 -91
3 27 -90
6. Gangetic West Bengal
A N D
2 13 -84
1 12 -93
12 12 +4
10 17 -41
2 15 -86
0 13
-100
7. Odisha A N D
3 11 -68
0 10 -99
15 10
+47
2 13 -82
2 11 -85
0 11 -99
8. Jharkhand A N D
1 16 -93
10 15 -33
8 14 -43
14 19 -23
5 17 -69
0 16
-100
9. Bihar A N D
5 13 -58
17 12
+38
11 11 +0
9 14 -34
* 14 -97
0 13
-100
10. East Uttar Pradesh
A N D
5 16 -66
47 16
+201
28 14
+101
5 18 -70
10 17 -43
1 17 -96
11. West Uttar Pradesh
A N D
21 18
+21
48 17
+181
29 16
+84
2 19 -89
22 19
+16
2 18 -89
12. Uttarakhand A N D
73 49
+48
46 47 -3
56 45
+26
5 57 -91
37 54 -31
17 52 -66
13. Haryana, Chandigarh & Delhi
A N D
21 17
+24
13 16 -18
12 15 -16
0 19 -99
34 18
+86
5 18 -72
14. Punjab A N D
9 24 -60
21 22 -3
18 20 -12
7 27 -76
42 26
+61
9 25 -63

5
S. No.
Meteorological Sub-Divisions
For the period from 1st January to
30 JAN
2013 29 JAN
2014 28 JAN
2015 03 FEB
2016 02 FEB
2017 31 JAN
2018
15. Himachal Pradesh
A N D
76 93 -19
65 88 -26
65 84 -23
19 108 -82
159 101 +58
9 97 -91
16. Jammu & Kashmir
A N D
72 92 -22
102 89
+14
25 86 -71
35 106 -67
255 99
+157
4 96 -95
17. West Rajasthan
A N D
7 3
+165
1 3
-70
1 2
-49
* 3
-97
6 3
+93
* 3
-92
18. East Rajasthan
A N D
1 5
-75
28 5
+465
9 5
+103
1 6
-90
8 6
+47
* 6
-99
19. West Madhya Pradesh
A N D
2 8
-79
27 8
+231
39 8
+418
5 9
-43
5 9
-46
0 9
-99
20. East Madhya Pradesh
A N D
2 19 -89
33 19
+72
33 18
+81
20 21 -5
5 20 -77
0 20
-100
21. Gujarat Region
A N D
0 1
-100
7 1
+832
2 1
+142
0 1
-100
0 1
-100
0 1
-100
22. Saurashtra, Kutch & Diu
A N D
2 *
+367
* *
+10
1 *
+287
0 *
-100
* *
-47
0 *
-100
23. Konkan & Goa
A N D
0 *
-100
* *
-14
2 *
+1754
0 *
-100
0 *
-100
0 *
-100
24. Madhya Maharashtra
A N D
* 1
-94
3 1
+169
1 1
+25
0 1
-100
0 1
-100
0 1
-100
25. Marathawada A N D
3 4
-31
1 3
-63
10 3
+198
0 4
-100
0 4
-100
0 4
-100
26. Vidarbha
A N D
7 10 -32
1 9
-88
26 9
+193
1 11 -94
* 11 -98
0 10
-100
27. Chhattisgarh A N D
2 10 -84
2 10 -79
12 10
+26
6 12 -51
1 11 -92
0 11
-100
28. Coastal Andhra Pradesh
A N D
1 8
-85
1 8
-91
2 8
-78
2 9
-80
1 9
-88
* 8
-99
29. Telangana
A N D
4 6
-32
* 6
-97
12 6
+118
1 6
-81
0 6
-100
0 6
-100

6
S. No.
Meteorological Sub-Divisions
For the period from 1st January to
30 JAN
2013 29 JAN
2014 28 JAN
2015 03 FEB
2016 02 FEB
2017 31 JAN
2018
30. Rayalaseema
A N D
1 3
-76
* 3
-96
1 3
-49
8 3
+160
4 3
+30
0 3
-100
31. Tamil Nadu & Puducherry
A N D
4 17 -77
7 17 -56
8 17 -50
3 19 -87
37 18
+111
6 17 -64
32. Coastal Karnataka
A N D
3 1
+480
0 1
-100
1 1
+144
1 1
-32
1 1
+55
0 1
-100
33. North Interior Karnataka
A N D
1 2
-45
0 2
-100
2 2
+29
* 2
-87
0 2
-100
0 2
-100
34. South Interior Karnataka
A N D
1 1
-63
* 1
-66
2 1
+51
4 1
+156
5 1
+269
0 1
-100
35. Kerala
A N D
4 8
-54
5 8
-42
3 8
-66
3 9
-69
13 9
+45
2 9
-76
36. Lakshadweep A N D
26 20
+32
53 19
+173
2 19 -89
60 22
+167
21 21 +1
11 21 -48
Country as a whole
A N D
10.9 12.9 -16
19.1 17.4 +10
15.6 16.5 -6
7.8 21.2 -63
27.1 19.9 +36
2.9 19.2 -85
SUMMARY
No. of Sub-Divisions with rainfall
For the period from 1st January to
30 JAN 2013
29 JAN 2014
28 JAN 2015
03 FEB 2016
02 FEB 2017
31 JAN 2018
Large Excess Excess Normal Total
- 08 01 09
- 09 07 16
- 19 06 25
- 04 02 06
07 05 02 14
01 00 00 01
Deficient Large Deficient Scanty No rain Total
08 -
17 02 27
05 -
13 02 20
06 -
05 00 11
09 -
16 05 20
04 12 -
06 22
03 16 -
16 35
Data Inadequate 00 00 00 00 00 00
TOTAL 36 36 36 36 36 36
* Data is rounded off to nearest full figure according to Meteorological convention.
SEASONS: WINTER SEASON (January-February) PRE-MONSOON SEASON (March-May) MONSOON SEASON (June-September) POST-MONSOON SEASON (October-December)
LEGEND: Large Excess: +60% or more A : Actual Rainfall (mm) Excess : +20% to +59% N : Normal Rainfall (mm) Normal: +19% to -19% D : Departure from normal (%) Deficient: -20% to -59% Scanty: -20% to -99% Large Deficient: -60% to -99% No Rain: -100% Data Inadequate: ** Rainfall upto 0.4 mm : *

Back to Top
Fig-1

3
Back to Top
Fig-2

4
Back to Top
ANNEXURE-1
RAINFALL DURING THE WEEK (in cm.)
(25 JANUARY 2018 TO 31 JANUARY 2018)
25 JANUARY 2018 ARUNACHAL PRADESH:- TUTING-2, NAMSAI-1, TEZU-1, MIAO-1, ANINI AWS-1, ASSAM & MEGHALAYA:-
CHAULDHOWAGHAT-2, DHOLLA BAZAR-2, BADATIGHAT-2, DHEMAJI AWS-2, MORANHAT-2, D/MOHANBARI AERO-1, KHOWANG-1, TINSUKIA-1, MOHANBARI AWS-1, SIVASAGAR-1, SUB-HIMALAYAN WEST BENGAL & SIKKIM:-
MANGAN-1, DAMTHANG-1, TAMILNADU & PUDUCHERRY:- MYLAUDY-1, KERALA:- NEDUMANGAD-3.
26 JANUARY 2018 ARUNACHAL PRADESH:- BASAR-1.
27 JANUARY 2018 ANDAMAN & NICOBAR ISLANDS:- IAF CARNICOBAR-1, ARUNACHAL PRADESH:- NAHARLAGUN-2, DAPARIJO-2, TUTING-1, MIAO-1, ANINI AWS-1, ASSAM & MEGHALAYA:- SIVASAGAR-1.
28 JANUARY 2018. No significant amount of rainfall.
29 JANUARY 2018 No significant amount of rainfall.
30 JANUARY 2018 No significant amount of rainfall.
31 JANUARY 2018 No significant amount of rainfall.

31.01.2018
(1) Area Weighted Rainfall (mm) for the country as a whole :
Rainfall
Actual
Normal
% Dep.
(2) Categorywise No. of Subdivisions & % Area of the Country :
L. Excess
Excess
Normal
Deficient
L. Deficient
No Rain
(3) Categorywise comparative distribution of Sub-divisions ( cumulative rainfall ) and All India % Rainfall Departure for last five years since January 1st
Category
L. Excess
Excess
Normal
Deficient
L. Deficient
No Rain
All India
% Dep.
(4) Categorywise comparative % distribution of districts ( cumulative rainfall )
for last five years since January 1st
Category 01.02.2017 03.02.2016 28.01.2015 29.01.2014 30.01.2013
L. Excess 1% 19% 0% 0% 0% 0%
Excess 1% 5% 10% 44% 32% 14%
Normal 1% 7% 6% 13% 9% 8%
Deficient 6% 9% 16% 15% 6% 11%
L. Deficient 27% 23% 37% 19% 19% 26%
No Rain 64% 37% 31% 9% 34% 41%
SHWB & SIKKIM NR(-100)---->LD(-90) UTTARAKHAND D(-51)---->LD(-66)
WEST MADHYA PRADESH NR(-100)---->LD(-99) HAR. CHD & DELHI D(-58)---->LD(-72)
LAKSHADWEEP LD(-60)---->D(-48) PUNJAB D(-41)---->LD(-63)
Improvements (Change in Category) Deteriorations (Change in Category)
-85% 36% -63% -6% 10% -38%
31.01.2018
(3%)
51%6 5 16(53%) 12(42%)
27 23 16(42%) 18(49%)
2 1 0(0%) 0(0%)
1 3 3(5%)58%
5(9%)
0 2 1(0%)
0%
1(0%)
0%0 2 0(0%) 0(0%)
-89% -73% -85% -84%
31.01.2018 24.01.2018 31.01.2018 24.01.2018
0.6 1.0 2.9 2.2
5.4 3.7 19.2 13.8
(37%)
(16%) (57%) (41%)
(33%) (32%) (53%) (34%) (25%)
(22%)(31%)
13 17
16 6 5 0 2 2
16 12 16 5
6
28.01.2015
4
0
31.01.2018 01.02.2017
0 2
29.01.2014
1
0 5
7
30.01.2013
8
0
1
9
03.02.2016
19
0
WINTER SEASON-2018
Performance since 1st January up to
CategoryWeek Ending on Cumulative upto
Week Ending on
31.01.2018 24.01.2018 31.01.2018 24.01.2018
3 94
2
Cumulative upto
85
6
0
7
(ii)

S. METEOROLOGICAL WEEK : 25.01.2018 TO 31.01.2018 PERIOD: 01.01.2018 TO 31.01.2018
NO. SUBDIVISIONS ACTUAL NORMAL % DEP. CAT. ACTUAL NORMAL % DEP. CAT.
EAST & NORTH EAST INDIA 3.1 6.1 7.1 21.1
1 ARUNACHAL PRADESH 15.5 17.5 -11% N 31.1 50.1 -38% D
2 ASSAM & MEGHALAYA 2.7 3.3 -19% N 5.8 16.4 -65% LD
3 N M M T 0.0 3.1 -100% NR 6.2 13.7 -54% D
4 SHWB & SIKKIM 2.6 7.7 -67% LD 2.6 26.6 -90% LD
5 GANGETIC WEST BENGAL 0.0 3.0 -100% NR 0.0 13.5 -100% NR
6 JHARKHAND 0.0 4.7 -100% NR 0.0 16.1 -100% NR
7 BIHAR 0.0 3.7 -100% NR 0.0 13.3 -100% NR
NORTH WEST INDIA 0.3 11.8 3.4 36.9
1 EAST U.P. 0.0 5.7 -100% NR 0.7 16.8 -96% LD
2 WEST U.P. 0.0 5.5 -99% LD 1.9 18.2 -89% LD
3 UTTARAKHAND 0.0 16.7 -100% NR 17.5 52.1 -66% LD
4 HAR. CHD & DELHI 0.0 5.9 -100% NR 5.0 17.8 -72% LD
5 PUNJAB 0.0 9.9 -100% NR 9.4 25.2 -63% LD
6 HIMACHAL PRADESH 0.0 32.4 -100% NR 9.2 97.5 -91% LD
7 JAMMU & KASHMIR 1.2 30.4 -96% LD 4.4 95.7 -95% LD
8 WEST RAJASTHAN 0.0 0.8 -100% NR 0.2 2.9 -92% LD
9 EAST RAJASTHAN 0.0 1.3 -100% NR 0.1 5.6 -99% LD
CENTRAL INDIA 0.0 1.8 0.0 8.0
1 ODISHA 0.0 1.5 -100% NR 0.0 10.8 -99% LD
2 WEST MADHYA PRADESH 0.0 2.0 -100% NR 0.0 8.5 -99% LD
3 EAST MADHYA PRADESH 0.0 5.3 -100% NR 0.0 20.0 -100% NR
4 GUJARAT REGION 0.0 0.0 -100% NR 0.0 0.8 -100% NR
5 SAURASHTRA & KUTCH 0.0 0.0 -100% NR 0.0 0.1 -100% NR
6 KONKAN & GOA 0.0 0.0 -100% NR 0.0 0.1 -100% NR
7 MADHYA MAHARASHTRA 0.0 0.1 -100% NR 0.0 1.1 -100% NR
8 MARATHWADA 0.0 0.6 -100% NR 0.0 3.8 -100% NR
9 VIDARBHA 0.0 2.2 -100% NR 0.0 10.2 -100% NR
10 CHHATTISGARH 0.0 2.7 -100% NR 0.0 10.5 -100% NR
SOUTH PENINSULA 0.1 0.9 3.6 7.8
1 A & N ISLAND 5.5 12.8 -57% D 167.3 53.7 212% LE
2 COASTAL ANDHRA PRADESH 0.0 0.8 -100% NR 0.1 8.3 -99% LD
3 TELANGANA 0.0 0.5 -100% NR 0.0 5.8 -100% NR
4 RAYALASEEMA 0.0 0.3 -100% NR 0.0 3.0 -100% NR
5 TAMILNADU & PUDUCHERRY 0.1 1.4 -94% LD 6.3 17.5 -64% LD
6 COASTAL KARNATAKA 0.0 0.1 -100% NR 0.0 0.7 -100% NR
7 N. I. KARNATAKA 0.0 0.3 -100% NR 0.0 2.2 -100% NR
8 S. I. KARNATAKA 0.0 0.2 -100% NR 0.0 1.4 -100% NR
9 KERALA 0.8 2.1 -61% LD 2.0 8.7 -76% LD
10 LAKSHADWEEP 0.2 2.2 -89% LD 10.7 20.8 -48% D
COUNTRY AS A WHOLE 0.6 5.4 2.9 19.2
CATEGORYWISE NO. OF SUBDIVISIONS & % AREA (SUBDIVISIONAL) OF THE COUNTRY
WEEK : 25.01.2018 TO 31.01.2018 PERIOD: 01.01.2018 TO 31.01.2018
CATEGORY
LARGE EXCESS
EXCESS
NORMAL
DEFICIENT
LARGE DEFICIENT
NO RAIN 27 78% 16 42%
-54%
-89% -85%
-85%
NO. OF SUBDIVISIONAL NO. OF SUBDIVISIONAL
SUBDIVISION-WISE RAINFALL (MM) DISTRIBUTION
-49% -67%
-98% -91%
-100% -99%
6%
0%
0 0%
0 0%
SUBDIVISIONS % AREA OF COUNTRY SUBDIVISIONS % AREA OF COUNTRY
0 0% 1 0%
2
6 16% 16 53%
0
1 0% 3 5%

S. WEEK : 25.01.2018 TO 31.01.2018 PERIOD: 01.01.2018 TO 31.01.2018
NO. ACTUAL NORMAL % DEP. CAT. ACTUAL NORMAL % DEP. CAT.
1 ARUNACHAL PRADESH 15.5 17.5 -11% N 31.1 50.1 -38% D
2 ASSAM 3.0 3.5 -13% N 6.4 16.2 -60% LD
3 MEGHALAYA 0.0 2.4 -100% NR 1.6 16.3 -90% LD
4 NAGALAND 0.0 4.6 -100% NR 10.3 18.7 -45% D
5 MANIPUR 0.0 3.7 -100% NR 3.5 14.0 -75% LD
6 MIZORAM 0.0 1.8 -100% NR 5.1 11.3 -55% D
7 TRIPURA 0.0 3.0 -100% NR 5.2 11.1 -53% D
8 SIKKIM 9.9 17.9 -45% D 9.9 54.8 -82% LD
9 WEST BENGAL 0.0 3.5 -99% LD 0.0 14.4 -99% LD
10 JHARKHAND 0.0 4.7 -100% NR 0.0 16.1 -100% NR
11 BIHAR 0.0 3.7 -100% NR 0.0 13.3 -100% NR
1 UTTAR PRADESH 0.0 5.7 -99% LD 1.2 17.4 -93% LD
2 UTTARAKHAND 0.0 16.7 -100% NR 17.5 52.1 -66% LD
3 HARYANA 0.0 5.9 -100% NR 5.0 17.6 -71% LD
4 CHANDIGARH (UT) 0.0 18.0 -100% NR 8.1 44.3 -82% LD
5 DELHI 0.0 5.3 -100% NR 4.8 16.4 -71% LD
6 PUNJAB 0.0 9.9 -100% NR 9.4 25.2 -63% LD
7 HIMACHAL PRADESH 0.0 32.4 -100% NR 9.2 97.5 -91% LD
8 JAMMU & KASHMIR 1.2 30.4 -96% LD 4.4 95.7 -95% LD
9 RAJASTHAN 0.0 1.1 -100% NR 0.2 4.5 -96% LD
CENTRAL INDIA
1 ODISHA 0.0 1.5 -100% NR 0.0 10.8 -99% LD
2 MADHYA PRADESH 0.0 3.4 -100% NR 0.0 13.7 -99% LD
3 GUJARAT 0.0 0.0 -100% NR 0.0 0.5 -100% NR
4 DADRA & NAGAR HAVELI (UT) 0.0 * 0.0 *
5 DAMAN & DIU (UT) 0.0 0.0 -100% NR 0.0 0.1 -100% NR
6 GOA 0.0 0.0 -100% NR 0.0 0.5 -100% NR
7 MAHARASHTRA 0.0 1.0 -100% NR 0.0 4.8 -100% NR
8 CHHATISGARH 0.0 2.7 -100% NR 0.0 10.5 -100% NR
SOUTH PENINSULA
1 A & N ISLAND (UT) 5.5 12.8 -57% D 167.3 53.7 212% LE
2 ANDHRA PRADESH 0.0 0.4 -100% NR 0.1 5.7 -99% LD
3 TELANGANA 0.0 0.5 -100% NR 0.0 5.8 -100% NR
4 TAMILNADU 0.1 1.4 -94% LD 6.2 17.4 -65% LD
5 PUDUCHERRY (UT) 0.0 1.8 -100% NR 38.8 29.5 32% E
6 KARNATAKA 0.0 0.2 -100% NR 0.0 1.8 -100% NR
7 KERALA 0.8 2.1 -61% LD 2.0 8.7 -76% LD
8 LAKSHADWEEP (UT) 0.2 2.2 -89% LD 10.7 20.8 -48% D
COUNTRY AS A WHOLE 0.6 5.4 2.9 19.2
CATEGORYWISE DISTRIBUTION OF NO. OF STATES
WEEK : 25.01.2018 TO 31.01.2018 PERIOD: 01.01.2018 TO 31.01.2018
NO. OF STATES
NO RAIN 25 9
2
DEFICIENT
0
2 5
NO DATA 1 1
-89%
NORMAL
CATEGORYNO. OF STATES
-85%
STATE-WISE RAINFALL (MM) DISTRIBUTION
EAST & NORTH EAST INDIA
STATES
NORTH WEST INDIA
LARGE DEFICIENT 6 19
LARGE EXCESS 0 1
EXCESS 0 1

S. TO
NO. LE E N D LD NR ND TOTAL
1 A & N ISLAND (UT) 3 0 0 0 0 0 0 3
2. ARUNACHAL PRADESH 0 1 2 6 2 2 3 16
3. ASSAM 0 0 2 6 9 10 0 27
4. MEGHALAYA 0 0 0 0 2 2 3 7
5. NAGALAND 0 1 1 1 2 0 6 11
6. MANIPUR 0 0 0 0 2 2 5 9
7. MIZORAM 0 0 0 2 1 1 5 9
8. TRIPURA 0 0 1 0 2 1 0 4
9. SIKKIM 0 0 0 0 4 0 0 4
10. WEST BENGAL 0 0 0 0 2 17 0 19
11. ODISHA 0 0 0 0 2 28 0 30
12. JHARKHAND 0 0 0 0 0 22 2 24
13. BIHAR 0 0 0 0 0 38 0 38
14. UTTAR PRADESH 0 0 0 0 35 37 0 72
15. UTTARAKHAND 0 0 0 2 11 0 0 13
16. HARYANA 0 0 1 4 14 2 0 21
17. CHANDIGARH (UT) 0 0 0 0 1 0 0 1
18. DELHI 0 0 0 1 6 0 2 9
19. PUNJAB 0 1 1 8 9 1 0 20
20. HIMACHAL PRADESH 0 0 0 0 12 0 0 12
21. JAMMU & KASHMIR 0 0 0 0 16 4 2 22
22. RAJASTHAN 0 0 0 1 6 26 0 33
23. MADHYA PRADESH 0 0 0 0 1 50 0 51
24. GUJARAT 0 0 0 0 0 33 0 33
25. DADRA & NAGAR HAVELI (UT) 0 0 0 0 0 0 1 1
26. DAMAN & DIU (UT) 0 0 0 0 0 1 1 2
27. GOA 0 0 0 0 0 2 0 2
28. MAHARASHTRA 0 0 0 0 0 36 0 36
29. CHHATISGARH 0 0 0 0 0 27 0 27
30. ANDHRA PRADESH 0 0 0 0 1 12 0 13
31. TELANGANA 0 0 0 0 0 10 0 10
32. TAMILNADU 1 2 2 2 20 5 0 32
33. PUDUCHERRY (UT) 1 0 0 0 1 0 2 4
34. KARNATAKA 0 0 0 0 0 30 0 30
35. KERALA 1 0 0 2 6 5 0 14
36. LAKSHADWEEP (UT) 0 0 0 1 0 0 0 1
TOTAL 6 5 10 36 167 404 32 660
1% 1% 1% 6% 27% 64%
628 WHOSE DATA RECEIVED
LE E N D LD NR
19% 5% 7% 9% 23% 37%
03.02.2016 0% 10% 6% 16% 37% 31%
28.01.2015 0% 44% 13% 15% 19% 9%
29.01.2014 0% 32% 9% 6% 19% 34%
0% 14% 8% 11% 26% 41%
PERCENT DISTRIBUTION OF DISTRICTS IN EARLIER YEARS SINCE 1st JANUARY
OF DISTRICTS OUT OF THE
CATEGORYWISE DISTRIBUTION
DATE
01.02.2017
30.01.2013
STATES
STATEWISE DISTRIBUTION OF NO. OF DISTRICTS
WITH EXCESS, NORMAL,DEFICIENT,SCANTY AND NO RAINFALL
PERIOD FROM : 01.01.2018 31.01.2018

BRIEF NOTE ON LIVE STORAGE STATUS OF 91 RESERVOIRS IN THE COUNTRY (WITH REFERENCE TO RESERVOIR STORAGE BULLETIN OF 01.02.2018)
1. ALL INDIA STATUSCentral Water Commission is monitoring live storage status of 91 reservoirs of thecountry on weekly basis and is issuing weekly bulletin on every Thursday. Out of thesereservoirs, 37 reservoirs have hydropower benefit with installed capacity of more than 60MW. The total live storage capacity of these 91 reservoirs is 161.993 BCM which isabout 63% of the live storage capacity of 257.812 BCM which is estimated to have beencreated in the country. As per reservoir storage bulletin dated 01.02.2018, live storageavailable in these reservoirs is 69.887 BCM, which is 43% of total live storage capacityof these reservoirs. However, last year the live storage available in these reservoirs forthe corresponding period was 77.969 BCM and the average of last 10 years live storagewas 76.640 BCM. Thus, the live storage available in 91 reservoirs as per 01.02.2018Bulletin is 90% of the live storage of corresponding period of last year and 91% ofstorage of average of last ten years.
As per Table-01, the overall storage position is less than the corresponding period of last year in the country as a whole and is also less than the average storage of last ten years during the corresponding period.
2. REGION WISE STORAGE STATUS:a) NORTHERN REGION
The northern region includes States of Himachal Pradesh, Punjab and Rajasthan.There are 6 reservoirs under CWC monitoring having total live storage capacity of18.01 BCM. As per Reservoir Storage Bulletin dated 01.02.2018, the total livestorage available in these reservoirs is 7.47 BCM which is 41% of total livestorage capacity of these reservoirs. The storage during corresponding period oflast year was 37% and average storage of last ten years during correspondingperiod was 42% of live storage capacity of these reservoirs. Thus, storage duringcurrent year is better than the corresponding period of last year but is less than theaverage storage of last ten years during the corresponding period.
b) EASTERN REGIONThe Eastern region includes States of Jharkhand, Odisha, West Bengal andTripura. There are 15 reservoirsunder CWC monitoring having total live storagecapacity of 18.83 BCM. As per Reservoir Storage Bulletin dated 01.02.2018, thetotal live storage available in these reservoirs is 12.23 BCM which is 65% of totallive storage capacity of these reservoirs. The storage during corresponding periodof last year was 71% and average storage of last ten years during correspondingperiod was 60% of live storage capacity of these reservoirs. Thus, storage duringcurrent year is less than the corresponding period of last year but is better than theaverage storage of last ten years during the corresponding period.
c) WESTERN REGIONThe Western region includes States of Gujarat and Maharashtra. There are 27reservoirs under CWC monitoring having total live storage capacity of 31.26BCM. As per Reservoir Storage Bulletin dated 01.02.2018, the total live storageavailable in these reservoirs is 14.20 BCM which is 45% of total live storagecapacity of these reservoirs. The storage during corresponding period of last yearwas 54% and average storage of last ten years during corresponding period was49% of live storage capacity of these reservoirs. Thus, storage during current yearis less than the storage of last year and is also less than the average storage of lastten years during the corresponding period.
Pg 1

d) CENTRAL REGIONThe Central region includes States of Uttar Pradesh, Uttarakhand, Madhya Pradesh and Chhattisgarh. There are 12 reservoirs under CWC monitoring having total live storage capacity of 42.30 BCM. As per Reservoir Storage Bulletin dated 01.02.2018, the total live storage available in these reservoirs is 17.59 BCM which is 42% of total live storage capacity of these reservoirs. The storage during corresponding period of last year was 63% and average storage of last ten years during corresponding period was 47% of live storage capacity of these reservoirs. Thus, storage during current year is less than the storage of last year and is also less than the average storage of last ten years during the corresponding period.
e) SOUTHERN REGIONThe Southern region includes States of Andhra Pradesh, Telangana, AP&TG (2combined projects in both states), Karnataka, Kerala and Tamil Nadu.There are 31 reservoirs under CWC monitoring having total live storage capacity of 51.59 BCM. As per Reservoir Storage Bulletin dated 01.02.2018, the total live storage available in these reservoirs is 18.40 BCM which is 36% of total live storage capacity of these reservoirs. The storage during corresponding period of last year was 28% and average storage of last ten years during corresponding period was 44% of live storage capacity of these reservoirs. Thus, storage during current year is better than the corresponding period of last year but is less than the average storage of last ten years during the corresponding period.
•
***************************
Disclaimer: The Data contained in this Bulletin is as received from the State Government/Project Authorities.
Pg 2

The total live storage in 91 important reservoirs in different parts of the country, monitored by CWC on weekending 01.02.2018 was 69.887 Billion Cubic Meter (BCM) ( 43 percent of the storagecapacity at Full Reservoirs Level (FRL) against 77.969 (BCM) ( 48 percent of the storage capacityat FRL) during corresponding date of pervious year and 76.64 (BCM)( 47 percent of the storage capacity at FRL) which is the average storage of the last 10 years. The storage was more than the lastyear's position by -8.082 BCM and more than the average of last ten years storage position by
-6.753 BCM.
The current year's storage is nearly 90 percent of the last year's storage and 91percent of the average of last ten years. There are 56 reservoirs having storage more than 80percent, 23 reservoirs having storage 51% to 80%, 6 reservoirs having storage 31% to 50%. The reservoirs reporting storage upto 30% of normal storage is 6
Out of 91 reservoirs 1 nos. having no live storage as on 01.02.2018 and there were 1reservoirs reporting no live storage on the corresponding period of last year.
Government of India Central Water Commission
Water Management Directorate
RESERVOIRS STORAGE STATUS
CROP WEATHER WATCH GROUP 01.02.2018
Pg 3

CURRENT STATUS OF HYDROLOGIC CONDITION IN INDIARESERVOIRS STOTAGE STATUS
The total live storage in 91 important reservoirs in different parts of the country, monitored byCWC on week ending 01.02.2018 is 69.887 Billion Cubic Meter (BCM). It is more than the average of last 10 yeras storage by -6.753 BCM and more than the last year's storage by-8.082 BCM.
SL. No. Description As on 01.02.2018 As on 25.01.2018Current Last Average Current Last Average
Year Year of last 10 Year Year of last 10Years Years
Total Live1 Storage 69.887 77.969 76.64 73.029 80.588 79.986
(BCM)
A comparison of details of storage position on 01.02.2018 is given below Status of 91 reservoirs 01.02.2018
Sl. No. Description of 7601.02.2018 25.01.2018 01.02.2017 Reservoirs
with Irrigation1 Storage as % of live capacity 43 46 48 43
at FRL (%) (%) (%) (%)2 Storage as % of last year's 90 91 127 87
storage (%) (%) (%) (%)3 Storage as % of 91 91 102 91
Normal storage (%) (%) (%) (%)4 Reservoirs having storage more than 80% of 56 56 58 46
Normal storage (Nos.) (Nos.) (Nos.) (Nos.)5 Reservoirs having storage more than 50% & 23 23 17 20
upto 80% of Normal storage (Nos.) (Nos.) (Nos.) (Nos.)6 Reservoirs having storage more than 30% & 6 6 3 5
upto 50% of Normal storage (Nos.) (Nos.) Nos (Nos.)7 Reservoirs having storage upto 30% 6 6 12 5
of Normal* storage (Nos.) (Nos.) (Nos.) (Nos)Nos. of reservoirs having no live storage (i.e. water level 1 1 1 0< MDDL) out of 91 reservoirs (Nos.) (Nos.) (Nos) (Nos.)
STATUS AS ON 30.01.2014 29.01.2015 01.02.2016 01.02.2017 01.02.2018
(91 Rers.) (91 Rers.) (91 Rers.) (91 Rers.) (91 Rers.)
TOTAL LIVE STORAGE
(BCM) 92.436 77.360 61.54 77.969 69.887
PERCENTAGE TO LIVE 60 50 38 48 43
CAPACITY AT FRL (%) (%) (%) (%) (%)
Pg 4

01.02.2018
1 A.P.&TG 15.13 3.80 25% 2.44 5.46 4.20 28% 2.75 5.80 -0.40 -0.31 -0.34 0 0 1 1 22 A.P. 1.99 0.83 42% 0.85 1.25 0.92 46% 0.90 1.31 -0.09 -0.05 -0.06 0 0 1 0 13 TELNGANA 2.92 1.24 42% 2.06 1.25 1.38 47% 2.15 1.32 -0.14 -0.09 -0.07 0 1 1 0 24 JHARKHAND 1.79 1.18 66% 1.30 1.09 1.20 67% 1.33 1.12 -0.02 -0.02 -0.02 2 1 1 1 55 GUJARAT 17.19 5.39 31% 8.79 7.83 5.66 33% 8.89 8.03 -0.27 -0.10 -0.20 0 5 4 1 106 H.P. 12.39 5.42 44% 4.22 5.35 5.75 46% 4.47 5.76 -0.33 -0.25 -0.41 0 0 2 0 27 KARNATAKA 23.49 9.43 40% 6.97 10.60 9.77 42% 7.15 11.23 -0.34 -0.18 -0.63 1 4 4 5 148 KERALA 3.83 2.43 64% 1.55 2.22 2.51 66% 1.56 2.29 -0.08 -0.01 -0.07 2 2 0 2 69 M.P. 27.32 10.83 40% 18.32 12.37 11.30 41% 19.01 13.05 -0.47 -0.68 -0.68 0 2 1 3 610 CHHATISGARH 3.81 2.27 60% 2.75 2.39 2.29 60% 2.78 2.45 -0.02 -0.03 -0.06 0 2 0 0 211 MAH. 14.07 8.81 63% 8.05 7.62 9.04 64% 8.35 7.87 -0.23 -0.30 -0.25 3 10 1 3 1712 ODISHA 15.33 9.68 63% 11.38 9.54 9.98 65% 11.60 9.75 -0.30 -0.23 -0.21 2 3 1 1 713 PUNJAB 2.34 0.49 21% 0.79 0.77 0.55 23% 0.74 0.81 -0.06 0.04 -0.04 0 0 0 1 114 RAJASTHAN 3.28 1.56 48% 1.70 1.47 1.62 49% 1.78 1.53 -0.05 -0.08 -0.07 0 2 0 1 315 T.N. 4.23 0.67 16% 0.40 1.73 0.74 18% 0.41 1.79 -0.07 -0.01 -0.06 0 0 0 6 616 TRIPURA 0.31 0.24 77% 0.19 0.09 0.24 78% 0.19 0.10 0.00 -0.01 -0.01 0 1 0 0 117 U.P. 6.36 2.25 35% 3.58 2.30 2.35 37% 3.64 2.43 -0.10 -0.07 -0.13 0 0 1 1 218 UTTARAKHAND 4.81 2.23 46% 2.06 2.79 2.40 50% 2.20 2.81 -0.17 -0.14 -0.02 0 1 1 0 219 W. BENGAL 1.39 1.13 81% 0.58 0.52 1.13 81% 0.67 0.53 0.00 -0.09 -0.01 1 1 0 0 2
161.99 69.89 43.1% 77.97 76.64 73.03 45% 80.59 79.99 -3.14 -2.62 -3.35 11 35 19 26 91
Total live storage at FRL (in BCM.) 161.99
Total live storage this season (in BCM.) 69.89
Total live storage last season (in BCM) 77.97
Avg. live storage of last 10 years (in BCM) 76.64
This season's live storage as % of FRL capacity 43
This season's live storage as % of last season's 90
This season's live storage as % of avg. of last 10 years 91
CENTRAL WATER COMMISSIONWATER MANAGEMENT DIRECTORATE
WEEKLY STORAGE STATUS : "STATEWISE " WEEK ENDING
S. NO.
STATE
TOTAL LIVE
CAPACITY AT FRL IN
BCM.
LIVE STORAGE IN BCMDeparture w.r.t. Storage of last
week inProjects having storage
01.02.2018
Total No. of
projects
THIS WEEK LAST WEEK
Current Year's
position
Last Year's storage position
Average of Last 10
Years position
more than
80% of design Storage
more than
50% and upto
80% of design storage
more than 30% and upto 50% of design storage
upto 30% of design storage
Average of Last 10 Years
TOTAL
As % of FRL capacity
01.02.2017Average of
Last 10 Years
25.01.2018As % of
FRL capacity
25.01.2017
Pg 5

01.02.2018
1 GANGA 28.096 12.86 46% 17.36 12.68 13.38 48% 17.95 13.07 -0.52 -0.59 -0.39
2 INDUS 14.730 5.91 40% 5.01 6.12 6.29 43% 5.22 6.57 -0.39 -0.21 -0.44
3 NARMADA 21.608 5.96 28% 10.61 8.56 6.32 29% 11.04 9.07 -0.36 -0.43 -0.51
4 TAPI 7.394 2.89 39% 5.52 4.44 2.96 40% 5.60 4.58 -0.07 -0.08 -0.14
5 MAHI 4.012 2.43 60% 2.61 2.18 2.52 63% 2.69 2.26 -0.09 -0.08 -0.08
6 SABARMATI 0.735 0.27 37% 0.42 0.31 0.28 39% 0.44 0.33 -0.01 -0.02 -0.02
7 RIVER OF KUTCH 0.887 0.41 46% 0.17 0.28 0.44 50% 0.17 0.30 -0.04 -0.01 -0.02
8 GODAVARI 15.394 7.02 46% 9.49 7.51 7.37 48% 9.74 7.79 -0.34 -0.26 -0.28
9 KRISHNA 32.831 12.68 39% 8.53 13.82 13.45 41% 9.07 14.70 -0.77 -0.54 -0.89
10 MAHANADI & NEIGHBOURING E.F.R 13.181 9.22 70% 9.90 8.49 9.38 71% 10.07 8.64 -0.15 -0.17 -0.15
11 CAUVERY & NEIGHBOURING E.F.R. 8.359 2.41 29% 1.61 3.79 2.58 31% 1.69 3.92 -0.17 -0.07 -0.14
12 WEST FLOWING RIVERS OF SOUTH 14.766 7.84 53% 6.76 8.45 8.07 55% 6.92 8.76 -0.22 -0.16 -0.30161.99 69.89 43.1% 77.97 76.64 73.03 45.1% 80.59 79.99 -3.14 -2.62 -3.35
BASINTenughat Maithon Panchet Konar Tiliya G. Sagar R.P. Sagar Matatila Rihand Ramganga Mayurakshi Kangsabati BansagarTehri
2 INDUS (North India) Bhakra Pong Thein
3 MAHI (North India) Kadana M.B. Sagar Jhakham Panam4 SABARMATI (North India) Sabarmati5 RIVER OF KUTCH (North India) Shetrunji Bhadar Dantiwada
6 NARMADA (Pennin. India) Tawa Bargi Indira Sagar Sardar Sarover Karjan Barna
7 TAPI (Pennin. India) Ukai Girna Upper Tapi8 GODAVARI (Pennin. India) Sriram Sagar L. Manair Jayakwadi Isapur Mula Yeldari Balimela Machkund U. Kolab U.Indravati Pench Upper Wardha Bhandardara
Srisailam N.J. Sagar Tungabhadra Ghataprabha Bhadra Narayanpur Malaprabha V. V.Sagar Almatti Koyana Bhima Khadakvasla DhomDudhganga Manikdoh
10 MAHANADI & NEIGHBOURING E.F.R (Pennin. India) M. Bango Mahanadi Hirakud Salanadi Rengali
11 CAUVERY & NEIGHBOURING E.F.R.(Pennin. India) Somasila K. R Sagra Kabini Hemavathy Harangi L. Bhawani Mettur Vaigai
12 WEST FLOWING RIVERS OF SOUTH(Pennin. India) Damanganga Linganamakki Supa Kallada Idamalayar Idukki U. Vaiterna Parambikulam Aliyar Sholayar Kakki Periyar Gerusoppa
Malampuzha Bhatsa
(BCM) (BCM) (BCM)
North India 21.869 45% 25.560 53% 21.581 45%
Penninsular India 48.018 42% 52.409 46% 55.059 48%
Departure w.r.t. Storage of last week in
THIS WEEK
As % of FRL capacity
01.02.2018As % of
FRL capacity
01.02.2017Average of Last
10 Years
CENTRAL WATER COMMISSION
WATER MANAGEMENT DIRECTORATE
WEEKLY STORAGE STATUS : "BASINWISE "WEEK ENDING
S. NO.
BASIN (REGION)
25.01.2017
LAST WEEK TOTAL LIVE CAPACITY AT FRL IN
BCM.Average
of Last 10 Years
LIVE STORAGE IN BCM
TOTAL
RESERVOIRS
1 GANGA (North India)
Current Year's
position
Last Year's storage position
Average of Last 10 Years position25.01.2018
113.533
Live Storage As % of FRL
Capacity
Live Storage
Total Live Capacity at FRL
(BCM)
This year Last Year
KRISHNA (Pennin. India)9
48.460
As % of FRL
Capacity
Live Storage As % of FRL
Capacity
Average
Region
Pg 6

WEEKLY REPORT - BASINWISEGOVERNMENT OF INDIA CENTRAL WATER COMMISSION
WEEK ENDING :- 01.02.2018
GANGA 12.859 45.77% 17.358 61.78% 12.678 45.12% 1.43INDUS 5.906 40.10% 5.007 33.99% 6.123 41.57% -3.54NARMADA 5.955 27.56% 10.611 49.11% 8.556 39.60% -30.40TAPI 2.889 39.07% 5.517 74.61% 4.444 60.10% -34.99MAHI 2.426 60.47% 2.607 64.98% 2.184 54.44% 11.08SABARMATI 0.269 36.60% 0.422 57.41% 0.312 42.45% -13.78RIVERS OF KUTCH 0.409 46.11% 0.166 18.71% 0.284 32.02% 44.01GODAVARI 7.021 45.61% 9.485 61.61% 7.510 48.79% -6.51KRISHNA 12.678 38.62% 8.525 25.97% 13.815 42.08% -8.23MAHANADI & NEIGHBOURING EFRS 9.223 69.97% 9.900 75.11% 8.494 64.44% 8.58CAUVERY& NEIGHBOURING EFRS 2.409 28.82% 1.614 19.31% 3.786 45.29% -36.37WEST FLOWING RIVERS OF SOUTH 7.843 53.12% 6.757 45.76% 8.454 57.25% -7.23TOTAL 69.887 77.969 76.640
PERCENTAGE -8.81
THIS YEAR'S STORAGE
NAME OF BASINLIVE CAP. AT
FRL
0.887
28.096
4.012
21.60814.730
7.394
% DEPARTURE W.R.T. AVE. OF
10 YEARS'
14.766161.993
15.394
13.18132.831
8.359
LAST YEAR'S STORAGE
0.735
LAST 10 YEARS' AVG. STORAGE
Pg 7

WEEK ENDING
01.02.2018
1 3A 3B 4 5 6 7 8 9 10 11 12 13 14 15 16 17
*1 SRISAILAM (AP/TG) 0 770 269.75 8.288 01-02-2018 261.95 2.845 34 259.42 2.236 27 3.839 46 127 74 *1
*2 NAGARJUNA SAGAR (AP/TG) 895 810 179.83 6.841 01-02-2018 161.12 0.956 14 156.73 0.205 3 1.622 24 466 59 *2
3 SOMASILA (A.P) 168 0 100.58 1.994 01-02-2018 91.43 0.833 42 91.55 0.845 42 1.248 63 99 67 3
4 SRIRAMSAGAR (TG) 411 27 332.54 2.3 01-02-2018 326.62 0.914 40 329.55 1.580 69 0.895 39 58 102 4
5 LOWER MANAIR (TG) 199 60 280.42 0.621 01-02-2018 274.93 0.321 52 277.67 0.480 77 0.352 57 67 91 5
6 TENUGHAT (JHAR) - - 269.14 0.821 01-02-2018 259.45 0.395 48 260.06 0.420 51 0.365 44 94 108 6
7 MAITHON (JHAR) 342 - 146.30 0.471 01-02-2018 148.34 0.471 100 147.92 0.471 100 0.383 81 100 123 7
*8 PANCHET HILL (JHAR) $ 80 124.97 0.184 01-02-2018 127.38 0.184 100 126.94 0.184 100 0.149 81 100 123 *8
9 KONAR (JHAR) $ - 425.81 0.176 01-02-2018 420.69 0.092 52 423.31 0.132 75 0.123 70 70 75 9
10 TILAIYA (JHAR) $ 4 368.81 0.142 01-02-2018 365.59 0.042 30 367.45 0.096 68 0.070 49 44 60 10
*11 UKAI (GUJ) 348 300 105.16 6.615 01-02-2018 96.17 2.523 38 102.08 5.019 76 4.084 62 50 62 *11
12 SABARMATI(DHAROI) (GUJ) 95 1 189.59 0.735 01-02-2018 183.86 0.269 37 186.08 0.422 57 0.312 42 64 86 12
*13 KADANA (GUJ) 200 120 127.70 1.472 01-02-2018 123.75 0.815 55 125.33 0.954 65 0.872 59 85 93 *13
14 SHETRUNJI (GUJ) 36 - 55.53 0.300 01-02-2018 52.37 0.114 38 53.22 0.150 50 0.162 54 76 70 14
15 BHADAR (GUJ) 27 - 107.89 0.188 01-02-2018 104.29 0.069 37 100.43 0.012 6 0.067 36 575 103 15
16 DAMANAGANGA (GUJ) 51 1 79.86 0.502 01-02-2018 77.65 0.379 75 76.55 0.334 67 0.363 72 113 104 16
17 DANTIWADA (GUJ) 45 - 184.10 0.399 01-02-2018 178.92 0.226 57 163.27 0.004 1 0.055 14 5650 411 17
18 PANAM (GUJ) 36 2 127.41 0.697 01-02-2018 125.45 0.427 61 124.70 0.385 55 0.391 56 111 109 18
*19 SARDAR SAROVAR (GUJ) 2120 1450 138.68 5.760 01-02-2018 112.50 0.200 3 120.05 1.227 21 1.158 20 16 17 *19
20 KARJAN (GUJ) 51 3 115.25 0.523 01-02-2018 109.77 0.366 70 106.23 0.285 54 0.366 70 128 100 20
*21 GOBIND SAGAR(BHAKRA) (H.P) 676 1200 512.06 6.229 01-02-2018 491.78 3.113 50 481.98 2.074 33 3.021 48 150 103 *21
*22 PONG DAM (H.P) - 360 423.67 6.157 01-02-2018 405.91 2.305 37 404.92 2.145 35 2.332 38 107 99 *22
23 KRISHNARAJA SAGRA (KAR) 79 - 752.50 1.163 31-01-2018 744.23 0.471 40 738.57 0.170 15 0.675 58 277 70 23
*24 TUNGABHADRA (KAR) 529 72 497.74 3.276 01-02-2018 488.64 0.675 21 482.41 0.153 5 0.989 30 441 68 *24
25 GHATAPRABHA (KAR) 317 - 662.95 1.391 01-02-2018 652.08 0.698 50 649.68 0.582 42 0.435 31 120 160 25
26 BHADRA (KAR) 106 39 657.76 1.785 01-02-2018 649.95 0.985 55 643.52 0.507 28 1.303 73 194 76 26
27 LINGANAMAKKI (KAR) - 55 554.43 4.294 01-02-2018 544.19 1.818 42 543.82 1.755 41 2.443 57 104 74 27
28 NARAYANPUR (KAR) 425 - 492.25 0.863 01-02-2018 490.23 0.501 58 490.61 0.542 63 0.670 78 92 75 28
29 MALAPRABHA(RENUKA) (KAR) 215 - 633.83 0.972 01-02-2018 624.40 0.163 17 624.08 0.149 15 0.222 23 109 73 29
30 KABINI(Sancherla Tank) (KAR) 85 - 696.16 0.444 31-01-2018 692.77 0.263 59 688.12 0.074 17 0.167 38 355 157 30
31 HEMAVATHY (KAR) 265 - 890.63 0.927 31-01-2018 876.54 0.190 20 873.12 0.102 11 0.232 25 186 82 31
32 HARANGI (KAR) 53 - 871.42 0.220 31-01-2018 859.54 0.064 29 859.63 0.064 29 0.033 15 100 194 32
33 SUPA (KAR) - - 564.00 4.120 01-02-2018 544.40 2.097 51 543.70 2.040 50 2.160 52 103 97 33
34 VANIVILAS SAGAR (KAR) 123 - 652.28 0.802 01-02-2018 632.17 0.016 2 633.19 0.029 4 0.136 17 55 12 34
*35 ALMATTI (KAR) @ 290 519.60 3.105 01-02-2018 514.73 1.372 44 511.29 0.692 22 1.030 33 198 133 *35
*36 GERUSOPPA (KAR) 83 240 55.00 0.130 31-01-2018 52.91 0.118 91 51.61 0.111 85 0.104 80 106 113 *36
37 KALLADA(PARAPPAR) (KRL) 62 - 115.82 0.507 31-01-2018 115.47 0.478 94 100.79 0.201 40 0.364 72 238 131 37
*38 IDAMALAYAR (KRL) 33 75 169.00 1.018 31-01-2018 154.96 0.631 62 150.80 0.534 52 0.600 59 118 105 *38
*39 IDUKKI (KRL) - 780 732.43 1.460 31-01-2018 721.13 0.876 60 712.80 0.534 37 0.813 56 164 108 *39
*40 KAKKI (KRL) 23 300 981.46 0.447 31-01-2018 976.45 0.364 81 965.19 0.228 51 0.315 70 160 116 *40
*41 PERIYAR (KRL) 84 140 867.41 0.173 31-01-2018 860.59 0.034 20 859.43 0.017 10 0.056 32 200 61 *4142 MALAMPUZHA (KRL) 21 3 115.06 0.224 01-02-2018 104.70 0.050 22 103.65 0.040 18 0.072 32 125 69 42
*43 GANDHI SAGAR (M.P.) 220 115 399.90 6.827 01-02-2018 391.72 2.569 38 397.50 5.199 76 2.792 41 49 92 *43
44 TAWA (M.P.) 247 - 355.40 1.944 01-02-2018 340.13 0.274 14 347.78 0.894 46 0.848 44 31 32 44
*45 BARGI (M.P.) 157 90 422.76 3.180 01-02-2018 419.10 2.198 69 417.80 1.908 60 1.878 59 115 117 *45
*46 BANSAGAR (M.P.) 488 425 341.64 5.166 01-02-2018 336.08 2.876 56 339.08 4.025 78 2.545 49 71 113 *46
*47 INDIRA SAGAR (M.P.) 2380 1000 262.13 9.745 01-02-2018 252.14 2.819 29 257.40 6.040 62 4.128 42 47 68 *47
48 BARNA (M.P.) 546 - 348.55 0.456 01-02-2018 341.78 0.098 21 345.40 0.257 56 0.178 39 38 55 48
*49 MINIMATA BANGOI (CHH.) - 120 359.66 3.046 01-02-2018 353.08 1.854 61 354.64 2.079 68 1.857 61 89 100 *49
WEEKLY REPORT OF 91 IMPORTANT RESERVOIRS OF INDIA
% OF THIS YR
STORAGE TO AVG. OF LAST 10 YRS.
STORAGE.
LAST YEAR STORAGE AS % OF LIVE CAP AT FRL
AVG. OF LAST 10 YEARS LIVE
CAP (BCM).
FRL (MTS.)
LIVE CAP. AT FRL
(BCM)
LATEST DATE AVAILABLE
THIS YEAR STORAGE AS
% OF LIVE CAP AT FRL
LIVE STORAGE
(BCM)
S.NO
2
HYDEL IN MW LEVEL
( MTS)
THIS SEASON
NAME OF RESERVOIR(STATE) IRR.
(CCA)IN TH. HA
BENEFITS
S.NoLEVEL
(MTS)
LIVE STORAGE
(BCM)
AVG. OF LAST 10 YRS LIVE
CAP AS % OF LIVE CAP AT
FRL
% OF THIS YR STORAGE TO LAST YEARS
STORAGE.
LAST SEASON
Pg 8

WEEK ENDING
01.02.2018
1 3A 3B 4 5 6 7 8 9 10 11 12 13 14 15 16 17
WEEKLY REPORT OF 91 IMPORTANT RESERVOIRS OF INDIA
% OF THIS YR
STORAGE TO AVG. OF LAST 10 YRS.
STORAGE.
LAST YEAR STORAGE AS % OF LIVE CAP AT FRL
AVG. OF LAST 10 YEARS LIVE
CAP (BCM).
FRL (MTS.)
LIVE CAP. AT FRL
(BCM)
LATEST DATE AVAILABLE
THIS YEAR STORAGE AS
% OF LIVE CAP AT FRL
LIVE STORAGE
(BCM)
S.NO
2
HYDEL IN MW LEVEL
( MTS)
THIS SEASON
NAME OF RESERVOIR(STATE) IRR.
(CCA)IN TH. HA
BENEFITS
S.NoLEVEL
(MTS)
LIVE STORAGE
(BCM)
AVG. OF LAST 10 YRS LIVE
CAP AS % OF LIVE CAP AT
FRL
% OF THIS YR STORAGE TO LAST YEARS
STORAGE.
LAST SEASON
50 MAHANADI (CHH.) 319 10 348.70 0.767 31-01-2018 344.56 0.419 55 347.68 0.669 87 0.532 69 63 79 50
51 JAYAKWADI(PAITHON) (MAH) 227 - 463.91 2.171 24-01-2018 462.59 1.690 78 461.60 1.359 63 0.797 37 124 212 51
*52 KOYANA (MAH) - 1920 657.90 2.652 31-01-2018 654.51 2.277 86 648.31 1.619 61 1.925 73 141 118 *52
53 BHIMA(UJJANI) (MAH) 125 12 496.83 1.517 01-02-2018 495.96 1.236 81 495.23 1.015 67 0.880 58 122 140 53
54 ISAPUR (MAH) 104 - 441.00 0.965 31-01-2018 427.21 0.059 6 433.19 0.349 36 0.450 47 17 13 54
55 MULA (MAH) 139 - 552.30 0.609 30-01-2018 549.32 0.459 75 549.15 0.452 74 0.337 55 102 136 55
56 YELDARI (MAH) 78 - 461.77 0.809 31-01-2018 449.23 0.042 5 452.49 0.152 19 0.247 31 28 17 56
57 GIRNA (MAH) 79 - 398.07 0.524 31-01-2018 390.11 0.198 38 393.54 0.311 59 0.166 32 64 119 57
58 KHADAKVASLA (MAH) 78 8 582.47 0.056 31-01-2018 580.71 0.033 59 580.98 0.037 66 0.028 50 89 118 58
*59 UPPER VAITARNA (MAH.) - 61 603.50 0.331 31-01-2018 601.10 0.253 76 601.17 0.256 77 0.245 74 99 103 *59
60 UPPER TAPI (MAH.) 45 - 214.00 0.255 31-01-2018 212.42 0.168 66 212.84 0.187 73 0.194 76 90 87 60
*61 PENCH (TOTALADOH) (MAH.) 127 160 490.00 1.091 31-01-2018 473.57 0.182 17 476.50 0.274 25 0.477 44 66 38 *61
62 UPPER WARDHA (MAH.) 70 - 342.50 0.564 01-02-2018 339.78 0.346 61 339.78 0.346 61 0.312 55 100 111 62
63 BHATSA (MAH.) 29.378 15 142.07 0.942 31-01-2018 130.95 0.665 71 130.92 0.665 71 0.620 66 100 107 63
64 DHOM (MAH.) 36.2 2 747.7 0.331 31-01-2018 742.81 0.227 69 741.20 0.148 45 0.175 53 153 130 64
65 DUDHGANGA (MAH.) 2.441 24 646 0.664 31-01-2018 641.09 0.520 78 640.37 0.498 75 0.474 71 104 110 65
66 MANIKDOH (KUKADI) (MAH.) 2.2 6 711.25 0.288 31-01-2018 704.18 0.174 60 699.31 0.113 39 0.087 30 154 200 66
67 BHANDARDARA (MAH.) 63.74 46 744.91 0.304 31-01-2018 743.63 0.279 92 742.92 0.268 88 0.210 69 104 133 67
*68 HIRAKUD (ODI) 153 307 192.02 5.378 30-01-2018 190.22 3.697 69 190.72 3.990 74 3.943 73 93 94 *68
*69 BALIMELA (ODI) - 360 462.08 2.676 01-02-2018 447.39 0.679 25 457.47 1.894 71 1.387 52 36 49 *69
70 SALANADI (ODI) 42 - 82.30 0.558 01-02-2018 70.84 0.234 42 68.08 0.177 32 0.185 33 132 126 70
*71 RENGALI (ODI) 3 200 123.50 3.432 01-02-2018 122.25 3.019 88 122.16 2.985 87 1.977 58 101 153 *71
*72 MACHKUND(JALPUT) (ODI) - 115 838.16 0.893 01-02-2018 836.97 0.780 87 833.64 0.543 61 0.635 71 144 123 *72
*73 UPPER KOLAB (ODI) 89 320 858.00 0.935 01-02-2018 853.05 0.505 54 855.82 0.729 78 0.509 54 69 99 *73
*74 UPPER INDRAVATI (ODI) 128 600 642.00 1.456 01-02-2018 635.20 0.765 53 638.21 1.059 73 0.902 62 72 85 *74
*75 THEIN (PUN) 348 600 527.91 2.344 01-02-2018 496.58 0.488 21 503.48 0.788 34 0.770 33 62 63 *75
*76 MAHI BAJAJ SAGAR (RAJ) 63 140 280.75 1.711 01-02-2018 275.70 1.117 65 276.55 1.197 70 0.872 51 93 128 *76
77 JHAKAM (RAJ) 28 - 359.50 0.132 01-02-2018 351.80 0.067 51 352.35 0.071 54 0.049 37 94 137 77
*78 RANA PRATAP SAGAR (RAJ) 229 172 352.81 1.436 01-02-2018 346.59 0.380 26 346.93 0.429 30 0.544 38 89 70 *78
79 LOWER BHAWANI (TN) 105 8 278.89 0.792 31-01-2018 264.84 0.154 19 261.67 0.087 11 0.353 45 177 44 79
*80 METTUR(STANLEY) (TN) 122 360 240.79 2.647 31-01-2018 217.63 0.403 15 214.71 0.266 10 1.021 39 152 39 *80
81 VAIGAI (TN) 61 6 279.20 0.172 31-01-2018 270.60 0.031 18 265.25 0.006 3 0.057 33 517 54 81
82 PARAMBIKULAM (TN) 101 - 556.26 0.380 31-01-2018 540.01 0.079 21 537.48 0.041 11 0.230 61 193 34 82
83 ALIYAR (TN) # 60 320.04 0.095 31-01-2018 301.33 0.001 1 301.36 0.001 1 0.048 51 100 2 83
*84 SHOLAYAR (TN) - 95 1002.79 0.143 31-01-2018 958.25 0.000 0 955.06 0.000 0 0.021 15 100 0 *84
85 GUMTI (TRP) - 15 93.55 0.312 30-01-2018 92.00 0.240 77 90.65 0.185 59 0.088 28 130 273 85
86 MATATILA (UP) - 30 308.46 0.707 31-01-2018 303.73 0.207 29 305.53 0.346 49 0.333 47 60 62 86
*87 RIHAND (UP) - 300 268.22 5.649 01-02-2018 259.48 2.039 36 262.53 3.232 57 1.970 35 63 104 *87
*88 RAMGANGA (UTT) 1897 198 365.30 2.196 01-02-2018 344.42 0.899 41 340.72 0.741 34 1.367 62 121 66 *88
*89 TEHRI (UTT) 2351 1000 830.00 2.615 01-02-2018 795.20 1.334 51 794.80 1.322 51 1.427 55 101 93 *89
90 MAYURAKSHI (WB) 227 - 121.31 0.480 01-02-2018 120.35 0.452 94 114.93 0.205 43 0.198 41 220 228 90
91 KANGSABATI (WB) 341 - 134.14 0.914 01-02-2018 131.25 0.679 74 126.92 0.371 41 0.324 35 183 210 91TOTAL FOR 91 RESERVOIRS 20054 16082 161.993 69.887 77.969 76.640
PERCENTAGE 43 48 47 90 91
Sd/-
* HYDEL POWER CAPACITY HAVING CAPACITY MORE THAN 60MW Director
$ TOTAL CCA 342 TH. HA OF DVC SYSTEM W. M. , CWC
# TOTAL CCA 101 TH. HA OF PARAMBIKULAM & ALIYAR@' TOTAL CCA 425 TH. HA. OF NARAYANPUR AND ALMATT† SABARMATI RESERVOIR IS SUPPLEMENTED WITH NARMADA WATER THROUGH PIPELINE.
Pg 9

01.02.2018Storage status of 91 reservoirs as compare to normal storage
SHOLAYAR (TN) SHOLAYAR (TN) ALIYAR (TN) VANIVILAS SAGAR (KAR) ISAPUR (MAH) YELDARI (MAH) SARDAR SAROVAR (GUJ) TAWA (M.P.) PARAMBIKULAM (TN) PENCH (TOTALADOH) (MAH.) METTUR(STANLEY) (TN) LOWER BHAWANI (TN) BALIMELA (ODI) VAIGAI (TN) BARNA (M.P.) NAGARJUNA SAGAR AP/TG TILAIYA (JHAR) PERIYAR (KRL) UKAI (GUJ) MATATILA (UP) THEIN (PUN) RAMGANGA (UTT) SOMASILA AP TUNGABHADRA (KAR) INDIRA SAGAR (M.P.) MALAMPUZHA (KRL) KRISHNARAJA SAGRA (KAR) RANA PRATAP SAGAR (RAJ) SHETRUNJI (GUJ) MALAPRABHA(RENUKA) (KAR) SRISAILAM AP/TG LINGANAMAKKI (KAR) NARAYANPUR (KAR) KONAR (JHAR) BHADRA (KAR) MAHANADI (CHH.) HEMAVATHY (KAR) UPPER INDRAVATI (ODI) SABARMATI(DHAROI) (GUJ) UPPER TAPI (MAH.) LOWER MANAIR TG GANDHI SAGAR (M.P.) KADANA (GUJ) TEHRI (UTT) HIRAKUD (ODI) SUPA (KAR) PONG DAM (H.P) UPPER KOLAB (ODI) MINIMATA BANGOI (CHH.) KARJAN (GUJ) SRIRAMSAGAR TG BHADAR (GUJ) GOBIND SAGAR(BHAKRA) (H.P) UPPER VAITARNA (MAH.) RIHAND (UP) DAMANAGANGA (GUJ) IDAMALAYAR (KRL) BHATSA (MAH.) IDUKKI (KRL) TENUGHAT (JHAR) PANAM (GUJ) DUDHGANGA (MAH.) UPPER WARDHA (MAH.) BANSAGAR (M.P.) GERUSOPPA (KAR) KAKKI (KRL) BARGI (M.P.) KHADAKVASLA (MAH) KOYANA (MAH) GIRNA (MAH) MACHKUND(JALPUT) (ODI) MAITHON (JHAR) PANCHET HILL (JHAR) SALANADI (ODI) MAHI BAJAJ SAGAR (RAJ) DHOM (MAH.) KALLADA(PARAPPAR) (KRL) BHANDARDARA (MAH.) ALMATTI (KAR) MULA (MAH) JHAKAM (RAJ) BHIMA(UJJANI) (MAH) RENGALI (ODI) KABINI (KAR) GHATAPRABHA (KAR) HARANGI (KAR) MANIKDOH (MAH.) KANGSABATI (WB) JAYAKWADI(PAITHON) (MAH) MAYURAKSHI (WB) GUMTI (TRP) DANTIWADA (GUJ)
Reservoir having no live storage out of 91
reservoirs
Week ending
Projects having more than 80% of Normal storage
Projects having more than 50% & upto 80% of Normal storage.
Projects having more than 30% & upto 50% of Normal storage.
Projects having storage upto 30% of Normal storage.
Pg 10

1 Srisailam (AP&TG) 8.288 2.845 3.088 -0.243 -3 -2 -22 Nagarjuna Sagra (AP&TG) 6.841 0.956 1.116 -0.160 -2 -2 -23 Somasila (AP) 1.994 0.833 0.924 -0.091 -5 -3 -34 Sriramsagar (TG) 2.300 0.914 1.04 -0.126 -5 -5 -35 Lower Manair (TG) 0.621 0.321 0.336 -0.015 -2 4 -16 Tenughat (JHAR) 0.821 0.395 0.399 -0.004 0 0 07 Maithon (JHAR) 0.471 0.471 0.471 0.000 0 0 -28 Panchet Hill (JHAR) 0.184 0.184 0.184 0.000 0 0 -19 Konar (JHAR) 0.176 0.092 0.098 -0.006 -3 -6 -210 Tilaiya (JHAR) 0.142 0.042 0.05 -0.008 -6 -10 -511 Ukai (GUJ) 6.615 2.523 2.554 -0.031 0 -1 -212 Sabarmati(Dharoi) (GUJ) 0.735 0.269 0.283 -0.014 -2 -2 -213 Kadana (GUJ) 1.472 0.815 0.842 -0.027 -2 -2 -114 Shetrunji (GUJ) 0.300 0.114 0.133 -0.019 -6 -2 -315 Bhadar (GUJ) 0.188 0.069 0.077 -0.008 -4 0 -216 Damanganga (GUJ) 0.502 0.379 0.396 -0.017 -3 -2 -217 Dantiwada (GUJ) 0.399 0.226 0.234 -0.008 -2 0 -218 Panam (GUJ) 0.697 0.427 0.433 -0.006 -1 -2 -119 Sardar Sarover (GUJ) 5.760 0.2 0.328 -0.128 -2 1 020 Karjan (GUJ) 0.523 0.366 0.376 -0.010 -2 -1 -121 Gobind Sagar(Bhakra) (H.P) 6.229 3.113 3.276 -0.163 -3 -3 -422 Pong Dam (H.P) 6.157 2.305 2.473 -0.168 -3 -1 -323 Krishnaraja Sagra (KAR) 1.163 0.471 0.476 -0.005 0 0 -224 Tungabhadra (KAR) 3.276 0.675 0.76 -0.085 -3 -1 -325 Ghataprabha (KAR) 1.391 0.698 0.704 -0.006 0 0 -526 Bhadra (KAR) 1.785 0.985 1.074 -0.089 -5 0 -327 Linganamakki (KAR) 4.294 1.818 1.89 -0.072 -2 -2 -328 Narayanpur (KAR) 0.863 0.501 0.501 0.000 0 3 029 Malaprabha(Renuka) (KAR) 0.972 0.163 0.168 -0.005 -1 -1 -430 Kabini (KAR) 0.444 0.263 0.268 -0.005 -1 -2 031 Hemavathy (KAR) 0.927 0.19 0.197 -0.007 -1 0 -132 Harangi (KAR) 0.220 0.064 0.063 0.001 0 0 -133 Supa (KAR) 4.120 2.097 2.113 -0.016 0 0 -134 Vanivilas Sagar (KAR) 0.802 0.016 0.016 0.000 0 0 -135 Almatti (KAR) 3.105 1.372 1.424 -0.052 -2 -2 -536 Gerusoppa (KAR) 0.130 0.118 0.118 0.000 0 1 -337 Kallada(Parappar) (KRL) 0.507 0.478 0.482 -0.004 -1 0 -238 Idamalayar (KRL) 1.018 0.631 0.657 -0.026 -3 -2 -239 Idukki (KRL) 1.460 0.876 0.896 -0.020 -1 1 -240 Kakki (KRL) 0.447 0.364 0.369 -0.005 -1 0 -141 Periyar (KRL) 0.173 0.034 0.042 -0.008 -5 3 -342 Malampuzha (KRL) 0.224 0.05 0.063 -0.008 -6 0 -543 Gandhi Sagar (M.P.) 6.827 2.569 2.751 -0.182 -3 -2 -244 Tawa (M.P.) 1.944 0.274 0.39 -0.116 -6 -5 -545 Bargi (M.P.) 3.180 2.198 2.254 -0.056 -2 -3 -246 Bansagar (M.P) 5.166 2.876 2.934 -0.058 -1 -1 -147 Indira Sagar (M.P) 9.745 2.819 2.862 -0.043 0 -3 -348 Barna (M.P) 0.456 0.098 0.109 -0.011 -2 -3 -349 Minimata Bango (CHHT) 3.046 1.854 1.867 -0.013 0 0 -150 Mahanadi (CHHT) 0.767 0.419 0.423 -0.004 -1 -4 -351 Jayakwadi(Paithon) (MAH) 2.171 1.69 1.69 0.000 0 0 052 Koyana (MAH) 2.652 2.277 2.317 -0.040 -2 -3 -253 Bhima(Ujjani) (MAH) 1.517 1.236 1.311 -0.075 -5 -2 -254 Isapur (MAH) 0.965 0.059 0.063 -0.004 0 -3 -255 Mula (MAH) 0.609 0.459 0.461 -0.002 0 -1 -256 Yeldari (MAH) 0.809 0.042 0.042 0.000 0 0 -157 Girna (MAH) 0.524 0.198 0.221 -0.023 -4 -5 -258 Khadakvasla (MAH) 0.056 0.033 0.041 -0.008 -14 0 -459 Upper Vaiterna (MAH) 0.331 0.253 0.265 -0.012 -4 -4 -260 Upper Tapi (MAH) 0.255 0.168 0.181 -0.013 -5 -2 -361 Pench (Totladoh) (MAH) 1.091 0.182 0.189 -0.007 -1 -1 -262 Upper Wardha (MAH) 0.564 0.346 0.352 -0.006 -1 -5 -363 Bhatsa (MAH) 0.942 0.665 0.683 -0.018 -2 -2 -264 Dhom (MAH) 0.331 0.227 0.227 0.000 0 -18 -465 Dudhganga (MAH) 0.664 0.52 0.528 -0.008 -1 -1 -266 Manikdho (MAH) 0.288 0.174 0.175 -0.001 0 0 -267 Bhandardara (MAH) 0.304 0.279 0.295 -0.016 -5 0 -168 Hirakud (ODI) 5.378 3.697 3.793 -0.096 -2 -2 169 Balimela (ODI) 2.676 0.679 0.796 -0.117 -4 -1 -270 Salanadi (ODI) 0.558 0.234 0.235 -0.001 0 0 -371 Rengali (ODI) 3.432 3.019 3.057 -0.038 -1 -1 -472 Machkund(Jalput) (ODI) 0.893 0.78 0.788 -0.008 -1 -3 -273 Upper Kolab (ODI) 0.935 0.505 0.522 -0.017 -2 -2 -174 Upper Indravati (ODI) 1.456 0.765 0.791 -0.026 -2 -2 -375 Thein (PUN) 2.344 0.488 0.545 -0.057 -2 2 -176 Mahi Bajaj Sagar (RAJ) 1.711 1.117 1.167 -0.050 -3 -2 -377 Jhakam (RAJ) 0.132 0.067 0.075 -0.008 -6 -5 -578 Rana Pratap Sagar (RAJ) 1.436 0.38 0.374 0.006 0 -3 -179 Lower Bhawani (TN) 0.792 0.154 0.196 -0.042 -5 0 080 Mettur (Stanley) (TN) 2.647 0.403 0.422 -0.019 -1 0 -181 Vaigai (TN) 0.172 0.031 0.03 0.001 1 -1 -382 Parambikulam (TN) 0.380 0.079 0.089 -0.010 -3 -1 -283 Aliyar (TN) 0.095 0.001 0.004 -0.003 -3 1 -484 Sholayar (TN) 0.143 0 0 0.000 0 0 -485 Gumti (TRP) 0.312 0.24 0.244 -0.004 -1 -2 -386 Matatila (UP) 0.707 0.207 0.168 0.039 6 0 -287 Rihand (UP) 5.649 2.039 2.179 -0.140 -2 -1 -288 Ramganga (UKH) 2.196 0.899 0.973 -0.074 -3 -2 489 Tehri (UKH) 2.615 1.334 1.426 -0.092 -4 -4 -490 Mayurakshi (WB) 0.480 0.452 0.453 -0.001 0 -1 091 Kangsabati (WB) 0.914 0.679 0.679 0.000 0 -9 -1
NAME OF RESERVOIR (STATE)
Percentage change in storage
during last week last yr
Percentage change in storage
during last week(10 yrs
avg)01.02.2018 25.01.2018
LIVE CAP. AT FRL IN (BCM)
Live Storage(BCM)
on
Change in the Live storage during the
week (BCM)
Percentage change in
storage during last week
Pg 11

As on 01.02.2018
1 Number of Reservoirs having Irrigation benefits 76Nos.
2 Total live Capacity at FRL. 120.444(BCM)
3 Total live storage As on 01.02.2018 51.222(BCM)
4 Percentage of this year's storage at FRL 43(%)
5 Total live storage As on 01.02.2017 58.685(BCM)
6 Percentage of last year's storage at FRL 49(%)
7 Average Live storage for last 10 years 56.227(BCM)
8 Percentage of 10 years storage at FRL 47(%)
Details of Reservoirs having Irrigation Benefits
Pg 12

TABLE-01
01.02.2018
1 H.P. 2 12.39 5.42 4.22 5.35 44 34 43 12 PUNJAB 1 2.34 0.49 0.79 0.77 21 34 33 -373 RAJASTHAN 3 3.28 1.56 1.70 1.47 48 52 45 7
6 18.01 7.47 6.70 7.59 41 37 42 -2
1 JHARKHAND 5 1.79 1.18 1.30 1.09 66 73 61 92 ODISHA 7 15.33 9.68 11.38 9.54 63 74 62 13 W. BENGAL 2 1.39 1.13 0.58 0.52 81 41 37 1174 TRIPURA 1 0.31 0.24 0.19 0.09 77 59 28 173
15 18.83 12.23 13.44 11.24 65 71 60 9
1 GUJARAT 10 17.19 5.39 8.79 7.83 31 51 46 -312 MAH. 17 14.07 8.81 8.05 7.62 63 57 54 16
27 31.26 14.20 16.84 15.45 45 54 49 -8
1 U.P. 2 6.36 2.25 3.58 2.30 35 56 36 -22 UTTARAKHAND 2 4.81 2.23 2.06 2.79 46 43 58 -203 M.P. 6 27.32 10.83 18.32 12.37 40 67 45 -124 CHHATISGARH 2 3.81 2.27 2.75 2.39 60 72 63 -5
12 42.30 17.59 26.71 19.86 42 63 47 -11
1 AP&TG 2 15.13 3.80 2.44 5.46 25 16 36 -302 A.P 1 1.99 0.83 0.85 1.25 42 42 63 -333 TELANGANA 2 2.92 1.24 2.06 1.25 42 71 43 -14 KARNATAKA 14 23.49 9.43 6.97 10.60 40 30 45 -115 KERALA 6 3.83 2.43 1.55 2.22 64 41 58 106 T.N. 6 4.23 0.67 0.40 1.73 16 9 41 -61
31 51.59 18.40 14.27 22.51 36 28 44 -1891 161.99 69.89 77.97 76.64 43 48 47 -9
SUB-TOTAL
CENTRAL REGION
WESTERN REGION
COUNTRY AS A WHOLE
S. NO.
REGION/STATE
LIVE CAPACITY
AT FRL (BCM)
STATUS OF CURRENT STORAGE
STORAGE AS PERCENTAGE OF LIVE CAPACITY AT FRL
LAST YEAR
LIVE STORAGE(BCM)
LAST 10 YRS.
AVERAGE
NO. OF RESERVOIRS MONITORED
% departure from
10 yrs
CURRENT YEAR
LAST 10 YRS. AVG.
EASTERN REGION
LAST YEAR
CURRENT YEAR
NORTHERN REGION
SUB-TOTAL
SUB-TOTAL
SUB-TOTAL
SUB-TOTAL
SOUTHERN REGION
Pg 13


