government fleet fact book 2011
DESCRIPTION
Magazine for the professional fleet manager managing public sector vehicles and equipment.TRANSCRIPT

GF09_Coverindd C1GF09_Coverindd C1 82911 14650 PM82911 14650 PM
x 6HFXUH$XWRPDWHGH6WRUDJHR[
DWWKH0RWRU3RRORFDWLRQ
x 6PDUWampDUG7HFKQRORJIRU
(DVHRI8VHDQG6HFXULW
x 2QOLQH0RWRU3RRO5HVHUYDWLRQV
x $XWRPDWHG$YDLODELOLW0DQDJHPHQW
ampRQILUPDWLRQDQGampXVWRPHU1RWLILFDWLRQV
x 5HDOWLPHLUHOHVV2GRPHWHU5HDGLQJV
DQG7ULSDWD7UDQVIHUWR)OHHW)RFXV
x QWHJUDWHGLOOLQJ
x XVLQHVVQWHOOLJHQFHZLWK5HSRUWLQJ
DQGDVKERDUGV
x 2SWLRQDO36QWHJUDWLRQ
x 6LQJOHDWDEDVHIRU0DLQWHQDQFH
DQG)XHOLQJ0DQDJHPHQW
x )XHO)OXLGVQYHQWRUampRQVXPSWLRQ
0DQDJHPHQW
x 5HDO7LPH9DOLGDWLRQRI0HWHU
5HDGLQJV7DQNampDSDFLWLHVDQG
9HKLFOH$XWKRUL]DWLRQ
x 6XSSRUWIRU6PDUWampDUGV3UR[LPLW
ampDUGVHV0DJQHWLF6WULSHampDUGV
DQG5DGLR)UHTXHQFGHQWLILFDWLRQ
5)2SWLRQ
x 6XSSRUWIRUDVLHVHOamp11
+GURJHQ$OWHUQDWH)XHOVDQG)OXLGV
x ampUDGOHWRUDYH(TXLSPHQW
DQG9HKLFOH7UDFNLQJ
x RUN2UGHU0DQDJHPHQW
x DUUDQW0DQDJHPHQW
x 3UHYHQWLYH0DLQWHQDQFH6FKHGXOLQJ
x 3DUWVQYHQWRU0DQDJHPHQW
x )XOOQWHJUDWHG5HDO7LPH
)XHO0DQDJHPHQW6VWHP
x H3HUIRUPDQFHQGLFDWRU
3DVKERDUGV
x LUHOHVVDWDampROOHFWLRQ)XQFWLRQDOLW
x DWHVWHEDVHG7HFKQRORJ
$VVHWRUNV2IIHUVWKH21lt)XOOQW
$XWRPDWHG)XHOLQJ6VWHPDQG0RWRU3
GF09_C2-1indd 992GF09_C2-1indd 992 82911 13713 PM82911 13713 PM
ZZZDVVHWZRUNVFRP_
QWHJUDWHG)OHHW0DQDJHPHQW6RIWZDUH
3RRO0DQDJHPHQW6ROXWLRQRQWKH0DUNHW
HRUNIRURYHUQPHQW)OHHWV
$VVHWRUNVNQRZVWKDWXQGHUVWDQGLQJDQGPDQDJLQJWKH
FRVWV RI IOHHW YHKLFOHV DQG VWDWLRQDU DVVHWV LV FULWLFDO
WRWKHERWWRPOLQH7KH$VVHWRUNVVXLWHRISURGXFWVz
)OHHW)RFXV)XHO)RFXVDQGH9DOHWzVWDQGVFRPPLWWHG
WR VHUYLQJ WKH FKDOOHQJLQJ DQG FKDQJLQJ QHHGV RI
JRYHUQPHQW IOHHWV 2XU LQWHJUDWHG SURGXFWV OHYHUDJH
WKH ODWHVW WHFKQRORJ LQ VRIWZDUH DQG ZLUHOHVV PRELOH
FRPSXWLQJWRKHOSRXUFXVWRPHUVEHWWHUXWLOL]HUHVRXUFHV
LPSURYH VHUYLFH GHOLYHU DQG DFKLHYH VXEVWDQWLDO DQG
PHDVXUDEOHFRVWVDYLQJVHDUHSURXGWREHWKHWUXVWHG
VROXWLRQWRRYHUIOHHWVLQ1RUWK$PHULFD
2XUFXVWRPHUVLQFOXGH
x RIWKH0RVW3RSXODWHG86ampLWLHV
x RIWKH0RVW3RSXODWHG
86ampRXQWLHV
x RXWRIWKH866WDWHV
x )HGHUDO$JHQFLHVLQFOXGLQJWKH86
HSDUWPHQWRI+RPHODQG6HFXULW1DYDO
6SHFLDODUIDUHDQGWKH860DULQHampRUSV
GF09_C2-1indd 1GF09_C2-1indd 1 82911 13719 PM82911 13719 PM
2 Government Fleet Fact Book 2011
ON THE COVER
Government Fleetrsquos fi rst Fact Book includes information about salaries management tools inventory vehicle re-placement cycles customers and more
GOVERNMENT FLEETFACT BOOK 2011 bull A BOBIT PUBLICATION bull VOLUME 9 - ISSUE 6 WWWGFLEETCOM
6 DEVELOPING AN INDUSTRY TOOL FOR PUBLIC SECTOR FLEETSGovernment Fleet created its fi rst ever Fact Book as a benchmarking tool for fl eet managers to compare their statistics with averages nationwide
10 INDUSTRY PROFILEThe average public sector fl eet department controls a median budget of $3 million annually not including capital and maintains a median rolling stock size of nearly 400 units Explore other characteristics of the average fl eet broken down across region agency type and other segments
14 FLEET MANAGER SALARIESTight budgets have frozen many fl eet manager salaries Data shows only a 1 percent increase in average salary in the past two years to $75510 Find out how fl eet managers are compensated based on region education fl eet size and more
22 SUPPORT STAFF SALARIESFleet support staff salaries have not seen increases in a few years GF presents average salaries for key titles as well as the number of fi lled positions in a fl eet
24 FLEET AND FUEL MANAGEMENT SYSTEMSFleet and fuel management systems prove to be essential technologies used by more than 80 percent of public fl eets Find out which providers are most used how much the systems cost and system satisfac-tion level
30 VEHICLE AND EQUIPMENT INVENTORY In a time of rightsized vehicle inventory and extended replacement cycles what does the average fl eet con-sist of and how long is it keeping its vehicles and equipment This section examines the unit breakdown of the average fl eet age of each fl eet unit replacement cycles and federal and state unit totals
34 CUSTOMER DEPARTMENTSFleets report servicing between one to 22 different customer departments with Public Works being the most reported fl eet customer GF explores and analyzes fl eetrsquos most common clients
36 FUEL LUBE AND PARTS INVENTORYAbout 85 percent of fl eets store diesel and gasoline inventory Find out more inventory statistics about alternative fuel lube parts and tires
4 ON THE WEB
40 PUBLIC FORUM
O
G
Batpa
INDUSTRY DATA
DEPARTMENTS
Government Fleet (USPS 740) is published bi-monthly with additional issues in June and October by Bobit Business Media 3520 Challenger Street Torrance California 90503-1640 Periodicals Postage Paid at Torrance CA 90503-9998 and Additional Mailing Offi ces POSTMASTER Send address changes to Government Fleet PO Box 1068 Skokie IL 60076-8068 Please allow six to eight weeks for address changes to take effect Please allow six to eight weeks to receive your fi rst issue Bobit Business Media reserves the right to refuse nonqualifi ed subscriptions Please address editorial and advertising correspondence to the executive offi ces at 3520 Challenger Street Torrance California 90503-1640 The contents of this publication may not be reproduced either in whole or in part without the consent of Bobit Business Media All statements made although based on information believed to be reliable and accurate cannot be guaranteed and no fault or liability can be accepted for error or omission
VP and Group PublisherSherb Brown
(310) 533-2451 bull SherbBrownbobitcom
PublisherEric Bearly
(310) 533-2579 bull EricBearlybobitcom
Editorial Director and Associate PublisherMike Antich
(310) 533-2467 bull MikeAntichbobitcom
Senior EditorThi Dao
(310) 533-2544 bull ThiDaobobitcom
Web EditorGreg Basich
(310) 533-2572 bull GregBasichbobitcom
Advisory BoardPaul Condran Culver City Calif
Richard Weston Thurston County WashPaul Starling City of Gainesville FlaPete Scarafi otti City of Mesa Ariz
Steve Weir New York CityBarb Bonansinga State of Illinois
JDarryl Syler City of Little Rock ArkMark Crawford Sandia National Laboratories
Chris Hoffman Oklahoma State UniversityMike Powell Skookum GSA
Carey Picklesimer AssetWorksCheryl Graham ARI
Jett Kuntz NAPA Integrated Business SolutionsScott Brockelmeyer Ferrellgas
Tony Gratson Ford Motor CompanyElliott Benson General Motors
Mary Jaye Chrysler Group
Production DirectorManagerKelly Bracken
(310) 533-2574
Brian Peach(310) 533-2548
Art DirectorVince Taroc
Editorial ConsultantHoward Rauch
DISTRICT ADVERTISING MANAGERS
PublisherSales ManagerEric Bearly
(310) 533-2579 bull EricBearlybobitcom
Great LakesRobert Brown Jr
(248) 601-2005 bull RobertBrownbobitcom
Sales amp Marketing CoordinatorTracey Tremblay(310) 533-2518
Chairman Edward J Bobit
President amp Chief Executive Offi cerTy F Bobit
Chief Financial Offi cerRichard E Johnson
Business and Editorial Offi ceBobit Business Media 3520 Challenger Street
Torrance CA 90503-1640FAX (310) 533-2503
Change Service Requested Return AddressGovernment Fleet
PO Box 1068Skokie IL 60076-8068
Printed in USA
GF09_TOCindd 2GF09_TOCindd 2 82911 13753 PM82911 13753 PM
For a free demo visit wwwgpsinsightcomgov
Take Full Control Of Your Fleet
Nationwide coverage Regional offices in Phoenix Chicago Los Angeles and Oklahoma City
Robert Donat Founder amp CEO will be presenting on
(877) 377-3036
CALL GPS INSIGHT
EĞǁ
ĂƐŚďŽĂƌĚ
ŶƚĞƌĨĂĐĞ
Reduce Fuel Costsup to 25 with from
GF09_TOCindd 3GF09_TOCindd 3 82911 13755 PM82911 13755 PM
4 Government Fleet Fact Book 2011
What Youre Reading
wwwgovernment-fl eetcomw
AF0111roushindd 1 121310 125816 PM
NYC SANITATION DEPT TRUCK CRASHES THROUGH THIRD FLOOR WALL OF REPAIR SHOPRemember Gas on the right brake on the left
MICHIGAN STATE POLICE TO TEST 19 VEHICLES FOR 2012Ten sedans three special service vehicles and six motorcycles will be tested
CHEROKEE COUNTY CUTS FLEET TO COMBAT FUEL COSTSThe county currently has 599 vehicles in its fl eet down from 639 in its last fi scal year
SACRAMENTO TO PURCHASE 53 LNG REFUSE TRUCKS FOR $158MThe California city estimates it will save more than $3 million in potential on-going maintenance and fuel costs by eliminating 53 older refuse trucks
WEB XCLUSIVE UC DAVISrsquo WEB-BASED DRIVER TRAINING INCREASES COURSE ENROLLMENTEnrollment numbers have more than doubled compared with classroom instruction
THE 51
2
3
4
5
Government-fl eetcomrsquos Top 5 most popular stories as of August 26 2010
THE FLEET CHANNELS
Use the navigator on the government-fl eetcom home page to browse the latest articles from the channels Enter a channel to view in-depth news articles tools calculators and more related to that specifi c topic
Septemberrsquos Web Channel Fuel ManagementAs fuel costs continue to fl uctuate fi nd ways to best keep your expenses under control With constant new fuel technology and methods emerging fi nd out what is best for your fl eet and what should be avoided Below fi nds news and information regarding oil and gasoline trends fuel strategies resale channels and vehicle residuals
bull Seattle Maximizes Technology to Improve Operations
bull Oil Initiatives Government Fleets Should Consider
bull Fueling Public Sector Fleets
bull Solutions to the Top Challenges Facing Public Sector Fleets
bull Incentivizing Drivers to Conserve Fuel
bull Bright Ideas Safety
Industry Trends Telematics Safety Remarketing Fuel
RECEIVE BREAKING NEWS WHEN IT HAPPENSSign up for Government Fleetrsquos bi-weekly eNewsletter for timely updates on the latest industry news in public sector fl eet management as well as research and trends industry events and current Government Fleet magazine articles and features Subscribe at wwwgovernment-fl eetcom
1
MARKET TRENDSBy Mike Antichwwwgovernment-fl eetcomBlogGF-Market-Trendsaspx
August 24 Everything Fleet Does Revolves Around Money The Problem is the Lack of it
June 27 Message to Manage-ment Listen to Your Fleet Manager
WHAT WErsquoRE BLOGGING ABOUT
WWBBBBBLO
ANTICH
FLEET BLOGS
The Voice of the Fleet Community (wwwfl eetblogscom)
August 25 Interview with Jamie Lynn Crandall ndash Miss Utah USA ndash Working to Stop Texting While Drivingby Michael Bragg
August 24 DonlenHertz A New Fleet Management Modelby Wayne Smolda
August 19 Execute from the Deviationsby Aaron Alvarado
August 8 ROI or BS (Part 1)by Anonymous Public Fleet Manager
Interested in starting your own blog Go to wwwfl eetblogscom for more information
Fleet Toolbox is like having a fl eet consultant in your offi ce whenever you need it most We offer online tools allowing you to benchmark your operation connect with peer experts share your accomplishments fi nd crucial document templates ensure your competitiveness and develop solutions to your challenges Itrsquos truly a complete fl eet tool right at your fi ngertips Visit fl eettoolboxcom
PHO
TO C
OU
RTE
SY N
EW
YO
RK
FI
RE
DEP
AR
TMEN
T
GF09_WebTOCindd 4GF09_WebTOCindd 4 82911 113314 AM82911 113314 AM
The Choice Is Clear mdash And CleanYour fleet can get the same horsepower and torque performance as gasoline for 30 less in fuel costs ndash
and with 60 fewer emissions mdash thanks to ROUSH CleanTech Liquid Propane Injection fuel systems
Propane autogas fuel systems by ROUSH CleanTech let you operate on a price-stable North American-
sourced fuel with no engine modifications required That means yoursquoll get all the benefits of propane
autogas with no compromises in your vehiclersquos factory warranty protection
PERFORMANCE IDENTICAL
VEHICLE WARRANTY IDENTICAL
FUEL COSTS 30 LESS
EMISSIONS 60 LESS
PROPANE AUTOGAS VS GASOLINE
80059ROUSH ROUSHcleantechcom
20075 ndash 2008 2009 ndash 2010 2009 ndash Newer 2009 ndash Newer 2009 ndash NewerFord F-150 Ford F-250 F-350 Ford E-150 E-250 E-350 Ford E-350 DRW Cutaway Ford E-450 DRW Cutaway(54L V8) (54L V8) (54L V8) (54L V8) (68L V10)
UPFITS AVAILABLE
THE ZERO COMPROMISE ALTERNATIVE FUEL SOLUTION
AF0111roushindd 1 121310 125816 PMGF09_WebTOCindd 5GF09_WebTOCindd 5 82911 113319 AM82911 113319 AM
6 Government Fleet Fact Book 2011
GF0911wexindd 1 82411 34256 PM
Through industry meetings confer-
ences publications and friends in
the industry one can gather ideas
of what is common among public sector
fl eets Further statistics from a nation-
wide database can provide essential data
in determining what the average vehicle
replacement cycle is for example or
which is the most commonly used fl eet
management tool mdash and whether other
fl eets are happy with their systems This
is where an industry book created solely
for the public sector is useful
Government Fleet magazinersquos fi rst
ever Fact Book is designed as a bench-
marking tool for public sector fl eet pro-
fessionals to compare their statistics
with industry averages nationwide We
gathered information from more than
300 professionals for fl eet manager sal-
ary statistics and used a separate sample
of information from more than 300 fl eet
agencies for the rest of the data in this is-
sue It includes statistics about average
salaries for both management and sup-
port staff total fl eet size and breakdown
of fl eet units management systems used
to support operations types of customers
and fuel and parts inventory Each section
is additionally broken down by location
agency type population size fl eet size
and other relevant subsections
Most of the information found in this
Fact Book was gathered from the Fleet
Toolbox a new suite of online tools spe-
cifi cally designed for public sector fl eet
professionals In this publication wersquove
broken out data based on the most signifi -
cant subsections for each category such
as by fl eet size or agency type to allow
fl eet professionals to compare their spe-
cifi c statistics with those averages We
havenrsquot covered every subset and this is
where Fleet Toolboxrsquos fl eetCOMPARE
comes in The easy-to-use tool allows
fl eet professionals to break out data into
even smaller or specifi c subsections such
as by state region or residential popula-
tion This allows for a more tailored com-
parison of stats and inventory with fl eets
in specifi c areas or similar fl eets across
the country
Toolboxrsquos other features are fl eet-
SHARE a free closed social network
to share with and learn from public fl eet
manager peers fl eetDOCS a free database
of more than 700 usable documents such
as request for proposal (RFP) templates
job specs and manuals fl eetANALYZE
eight calculators for analyzing fl eet data
planning budget and performing competi-
tive analysis against industry standards
and fl eetPLAN a library of more than
1200 pages of detailed plans outlining
step-by-step solutions for common fl eet
challenges Public sector fl eet profession-
als can register for a free Lite subscription
or one that allows access to more features
online at wwwfl eettoolboxcom
Whether information is acquired here
or through the Fleet Toolbox our goal is
to spread knowledge about the industry
Use the facts as a benchmarking tool for
your current fl eet as a source for justify-
ing purchases and plans as a comparison
tool when coming up with new policies or
changes or to educate staff and elected
offi cials By being more knowledgeable
we can help the industry gain both respect
and credibility
DEVELOPING AN INDUSTRY TOOL FOR PUBLIC SECTOR FLEETS
Government Fleet created its fi rst ever Fact Book as a benchmarking tool for fl eet managers to compare their statistics with averages nationwide This information can also be found at the Fleet Toolbox online
GF09_Toolboxindd 6GF09_Toolboxindd 6 82911 113405 AM82911 113405 AM
Solutions you can trust acceptance you can depend on
For more information visit
wwwwrightexpresscomgov2011 or call Janet Hunnewell at 18665278870
The Wright Express Government Fuel Card Program is designed to meet the needs of any Federal State and Municipal organization We give our public sector customers the tools to save as much as 15 on overall fuel management expenses
HighlightsSpecialized tax exemption and reporting for government
Customized purchase controls for cost containment
Timely alerts to help you enforce purchasing policies
Point-of-sale 998 Level III data capture
Acceptance at over 90 of US retail fuel locations
Manage your fleet program with ease and confidence
We currently serve over 265000 state and local vehicles an additional 260000 federal government agency vehicles and participate in the GSA SmartPay2 Program Contact us to learn how we can help you with your fleet program needs
GF0911wexindd 1 82411 34256 PMGF09_Toolboxindd 7GF09_Toolboxindd 7 82911 113406 AM82911 113406 AM
GET ON BOARD WITH CHEVIN FLEET SOLUTIONS THE BIGGEST NAME IN FLEET MANAGEMENT SOFTWAREWhether yoursquore a State Municipal or Federal agency our fleet management software helps you manage and effectively maintain your equipment from initial specification through disposal regardless of size complexity or geographical spread
If yoursquore a Municipal agency you may face pressures to extend vehicle replacement cycles relentless mandates for staff reductions and cost cutting as well as political pressure to implement green fleet initiatives
We can give you real-time visibility over complete fleet running costs and utilization queries reports and key performance indicators can be used to accurately predict the right time for vehicle replacement Our fleet management software enables you to increase the value and operating life of equipment by ensuring proper maintenance schedules are adhered to while improving workshop productivity and inventory turns Yoursquoll be able to manage sustainability initiatives and monitor alternative fuel usage and emissions outputs
GF0311chevinindd 2-3 22211 94859 AMGF09_Toolboxindd 8GF09_Toolboxindd 8 82911 113406 AM82911 113406 AM
If yoursquore a State agency the trend towards centralization and consolidating of fleet functions may be a challenge You may face increased scrutiny by your customers concerning escalating charge back rates while trying to achieve fleet downsizing goals
Our enterprise fleet management system FleetWave provides a comprehensive suite of flexible General Service fleet tools to support your tactical requirements while providing a holistic view of all fleet related information This allows you to aggregate accurate operational and maintenance costs and automatically generate precise transparent and timely billing for vehicle usage based upon any organization hierarchy With the ability to benchmark fleet utilization based upon the agency department or driver you can use these statistics to make fact based right-sizing decisions
If yoursquore a Federal agency you may be under pressure to reduce greenhouse gas emissions and shrink your dependency on petroleum all while right-sizing your fleet without impacting mission readiness You probably spend countless hours gathering
data to meet regulatory reporting requirements such as DOE and FAST reporting
FleetWave offers unparalleled flexibility and can automatically process and track complete fuel details from any p-card or fuel card provider and seamlessly present your achievements based on benchmarks or scorecards FleetWave can aggregate unlimited data from GSA commercial lessors national accounts and internal workshops then share these details with internal finance and property management systems Yoursquoll achieve organization-wide visibility over utilization and running costs while supporting field level needs for maintenance operator and fuel management functionality
To get on board with Chevin please contact us to arrange a free system review Call (781) 793-0788email saleschevinfleetcomor visit wwwchevinfleetcom
GF0311chevinindd 2-3 22211 94859 AMGF09_Toolboxindd 9GF09_Toolboxindd 9 82911 113407 AM82911 113407 AM
10 Government Fleet Fact Book 2011
376 UNITS MEDIAN ROLLING STOCK FLEET SIZE
83 OF FLEETS HAVE A FORMAL REPLACEMENT PROGRAM 55
OF FLEETS REQUIRE TECHNICIANS TO PROVIDE THEIR OWN TOOLS
No two fl eets are alike fl eet sizes
budgets and makeup vary wide-
ly However knowing average
fl eet statistics can give a better view of
how big the public sector fl eet industry is
and provides a useful benchmarking tool
for fl eet professionals
Nearly half of all public sector fl eet
departments reporting their information
are city fl eets They have a median fl eet
budget of $3 million annually not in-
cluding capital and maintain a median
rolling stock of nearly 400 units The
majority are internal service funds and
have replacement programs
From tool allowances to fl eet manage-
ment system use GF compiled a profi le
of the average fl eet operation and broke
down public sector fl eet departments
based on population size agency type
and fl eet size
INDUSTRY PROFILEWhat does an average fl eet consist of How many vehicles does it maintain and how much in annual budget does it control Explore these and other statistics of the average fl eet broken down across region agency type and other segments
F L E E T O V E R V I E W
AVERAGE AGENCY PROFILE
4949 OF FLEET DEPARTMENTS ARE CITY FLEETSOF FLEET DEPARTMENTS ARE CITY FLEETS
18REPORT TO THE PUBLIC WORKS DIRECTOR
E
29SERVE A POPULATION SIZE OF LESS
THAN 50000 PEOPLE
$3 MILLION MEDIAN FLEET BUDGET
(LESS CAPITAL)
GF09_Generalindd 10GF09_Generalindd 10 82911 113426 AM82911 113426 AM
LOWER FUEL COSTS
MORE RANGE LONGER ENGINE LIFE
CLEANER THAN GASOLINE
Propane autogas powers more than 15 million vehicles worldwide The reason why is clear
UEcircOtildeIgravegtAtildeEcircAtildeEcircViAgraveIgravewEcirci`EcircVigtEcircLOtildeAgraveEcircLTHORNEcircIgraveiEcirc13
UEcircxmacrEcircvEcircgtOtildeIgravegtAtildeEcircAtildeEcirc`iAtildeIgraveVgtTHORNEcirclaquoAgrave`OtildeVi`
UEcirc-wEcircVgtIgraveTHORNEcircUumliAgraveEcirclaquoiAgravegtIgraveEcircgt`EcircvAgravegtAtildeIgraveAgraveOtildeVIgraveOtildeAgraveiEcircVAtildeIgraveAtilde
UEcircOtilde`Agravei`AtildeEcircvEcirc`i`VgtIgravei`Ecircgt`EcircVUcirciAgraveAtildeAgraveigt`THORNEcircUcirciViAtildeEcircgtUcircgtgtLiEcirc
UEcircAtildelaquoiAtildeiAgraveAtildeEcircgtAgraveiEcirciYacutelaquoiAtildeUcirciEcircIgraveEcircAtildeIgravegt]EcircAtildelaquoiEcircIgraveEcirclaquoiAgravegtIgravei
UEcircAgraveAtildeEcircAtildeiAgraveUcircViEcircviEcircvEcircIgraveiEcircgtUcirciAgravegtiEcircUcirciViEcircLTHORNEcircOacuteEcircIgraveEcircIcircEcircTHORNigtAgraveAtilde
AgravelaquogtiEcirclaquoAgraveUcirc`iAtildeEcircyEcirciiIgraveAtildeEcircUumlIgraveEcircgtEcircVAtildeIgraveivviVIgraveUcirci]EcircVigtLOtildeAgrave]EcircAtildegtvi]Ecircgt`EcircAgraveigtLiEcirc
gtIgraveiAgravegtIgraveUcirciEcircvOtildeidegEcircigtAgraveEcircAgraveiEcircgtIgraveEcircwwwferrellautogascomForYourFleet
Why choose autogas
Call us today to learn how easy it is to incorporate propane-autogas powered vehicles into your fl eet
Propane autogas is the best alternative fuel for fl eets
855-4-AUTOGAS
GF09_Generalindd 11GF09_Generalindd 11 82911 113433 AM82911 113433 AM
12 Government Fleet Fact Book 2011
F L E E T O V E R V I E W
MEDIAN ANNUAL BUDGET (LESS CAPITAL) BY FLEET SIZE
Fleet Units Budget
250 and less $1000000
251 - 500 $1600000
501 - 750 $3925000
751 - 1000 $6039300
1001 - 2000 $6750000
2001 - 3000 $15000000
More than 3000 $24000000
Budgets increase proportionately to the number of units managed Agencies with more than 3000 units report the largest budget of $24 million
MEDIAN ANNUAL BUDGET (LESS CAPITAL) BY AGENCY TYPE
CITY $2725000COUNTY $3416900STATE AGENCY $8000000FEDERAL $6000000City fl eets have the smallest budget while state agencies are reported to have the largest budgets nearly triple the size of the median city budget
Population Size Percentage
Less than 50000 29
50000 - 99999 12
100000 - 199999 14
200000 - 299999 9
300000 - 399999 3
Population Size Percentage
400000 - 499999 2
500000 - 999999 9
1000000 - 4999999 16
5000000 - 10000000 2
More than 10000000 4
FLEETS BY AGENCY TYPE FLEET SIZE BREAKDOWN
Rolling Stock Units Percentage
Less than 100 17
100 - 250 13
251 - 500 22
501 - 750 13
751 - 1000 7
1001 - 1500 9
1501 - 2000 4
2001 - 3000 4
3001 - 4000 3
4001 - 5000 3
5001 - 7000 2
7001 - 10000 2
More than 10000 1
Fleets with 1000 units or less are more com-mon than larger fl eets Those with more than 10000 units make up only 12 percent of all fl eets
Nearly half of all fl eet agen-cies reporting their informa-tion are city agencies while universities at 2 percent are the least common fl eets analyzed Each state agency that manages its own fl eet reported separate num-bers
Data was collected from GF readership and does not reflect entire industry totals
FLEETS BY AGENCY TYPE
of n-g
a-
hile at 2222222 theeee
on zed
owned m-
d from does
CityCity4949
CountyCounty2222 State State
AgenciesAgencies99
FederalFederal88
UtilityUtility77
UniversityUniversity22
School School DistrictDistrict
33
The most common population size of the area for which a fl eet agency is responsible is less than 50000 Fleets reporting serving a population size of more than 10 million were mostly state and federal agencies
POPULATION SIZEPOPULATION SIZE
GF09_Generalindd 12GF09_Generalindd 12 82911 113433 AM82911 113433 AM
Government Fleet Fact Book 2011 13
TO WHOM DOES FLEET MANAGEMENT REPORTTO WHOM DOES FLEET MANAGEMENT REPORTTitle Percentage
Director of Public Works 18
Director of Finance 5
City Manager 4
Superintendent 4
Assistant Director of Public Works 2
Director of Operations 2
Director of Transportation 2
Director of General Services 2
Mayor 2
Chief of Police 1
Deputy City Manager 1
Director of Administrative Services 1
General Manager 1
Other 55
The most common agency overseeing fl eet services is Public Works with 20 percent of fl eet managers reporting to its director or assistant director This data is calculated from actual titles reported by fl eet managers Variances in titles are calculated separately
ARE TECHNICIANS REQUIRED TO PROVIDE THEIR OWN TOOLS
YES 55NO 45
DOES THE AGENCY HAVE A FORMAL REPLACEMENT PROGRAM
YES 83NO 17
IS THE FLEET AN INTERNAL SERVICE FUND
YES 73NO 27
REPLACEMENT PROGRAM BREAKDOWN BY AGENCY TYPE
CITY YES 80 NO 20
COUNTY YES 79 NO 21
FEDERAL AGENCY YES 93 NO 7
STATE AGENCY YES 90 NO 10
GASUTILITY YES 91 NO 9
About 80 percent of cities and counties have a replacement program while for state agencies utilities and federal agencies this number jumps to the low-90 percentile
INTERNAL SERVICE FUND BREAKDOWN BY AGENCY TYPE
CITY YES 78 NO 22
COUNTY YES 77 NO 23
FEDERAL AGENCY YES 60 NO 40
STATE AGENCY YES 57 NO 43
GASUTILITY YES 57 NO 43
City and county fl eets are more likely to be inter-nal service funds than state federal and utility fl eets
TECHNICIANS PROVIDING THEIR OWN TOOLS BREAKDOWN BY FLEET SIZE
250 and less YES 34 NO 66
251 - 500 YES 58 NO 42
501 - 750 YES 66 NO 34
751 - 1000 YES 64 NO 36
1001 - 2000 YES 71 NO 29
More than 2000 YES 65 NO 35
Data shows that larger fl eets are more likely to require that technicians provide their own tools Only 34 percent of the smallest fl eets (250 units and less) require it of their technicians
POPULATION SIZE
AVERAGE ANNUAL TOOL ALLOWANCE AMOUNT FOR AGENCIES THAT OFFER IT
$447
$66 AVERAGE FULLY
BURDENED LABOR RATE
Average is derived from those reported by respondents Methods of calculating labor rate vary making it difficult to determine an accurate fully burdened labor rate
GF09_Generalindd 13GF09_Generalindd 13 82911 113434 AM82911 113434 AM
14 Government Fleet Fact Book 2011
FLEET MANAGER SALARIESTight budgets have frozen many fl eet manager salaries across the board Data shows only a 1 percent increase in average salary in the past two years to $75510 Find out how fl eet managers are compensated based on region education fl eet size and more
S A L A R Y
How does your salary stack up
against other public sector
fl eet managers and how has
the economy contributed to overall pay
With a sample size of more than 300 fl eet
professionals GF looks into what factors
impact salaries including education age
gender experience number of employees
managed and more
The average fl eet manager is a male
between 51 and 60 years old with more
than 20 years of experience responsible
for many facets of vehicle management
including acquisition disposal mainte-
nance and repair budgeting and fl eet
data systems operation and mainte-
nance
Some notable trends in 2010 in com-
parison with 2008 data is that average
salary for female fl eet professionals has
increased by more than $3000 while
salaries for males stayed the same This
largely contributed to the slight increase
in overall salaries Salaries for males
were still 18 percent higher than salaries
for female fl eet professionals in 2010 An-
other change is the signifi cant decrease in
reported performance-based compensa-
tion initiatives as well as cost-of-living
adjustments for 2010
WHAT IS YOUR GENDER IN 2010 DID YOUR SALARY INCREASE OR DECREASE FROM 2009 AND WHAT WAS THE SALARY CHANGE OVERALL
MALE92
FEMALE8
Male Average Salary $76344Female Average Salary $64701Overall Average Salary $75510
Average fl eet salaries for females increased from a re-ported $61477 in 2008 while male fl eet salaries stayed largely the same Average overall fl eet salary in 2008 was $74693
The average salary increase in 2010 was 25 percent and the average decrease was 34 percent 2008 data showed an 82 percent increase in salary 4 percent decrease and 14 percent with no change in comparison to salaries in 2007
DECREASE15
NO CHANGE54INCREASE
31
OF THOSE WITH INCREASED SALARIES
OF THOSE WITH DECREASED SALARIES
INCREASE 0-3
76DECREASE 0-3
58INCREASE
4-617
DECREASE 4-622
INCREASE 7 OR MORE
7DECREASE 7
OR MORE20
GF09_Salaryindd 14GF09_Salaryindd 14 82911 113504 AM82911 113504 AM
Government Fleet Fact Book 2011 15
$0
$20000
$40000
$60000
$80000
100000
City
County
Federal
Public S
chool
Distric
t
Public Tra
nsit
Utility
State
Univers
ityC
ollege
Special D
istric
t
$0
$20000
$40000
$60000
$80000
$100000
General S
ervice
s
Law E
nforc
ement
Public S
afety
Agency
MayorM
anager
Admin
istra
tor
Public W
orks
Regulato
ry B
oard
Oth
er
$0
$20000
$40000
$60000
$80000
100000
Lessthan 4
4-5 6-10 11-20 Morethan 20
WHAT IS YOUR AGE WHAT TYPE OF FLEET DO YOU MANAGEAT IS YOUR AGE YPE OF FLEET DO YOU MANAGE
25-291
OLDER THAN 653
30-343
35-406 41-50
29CITY
49
COUNTY22
FEDERAL 4
PUBLIC SCHOOL DISTRICT 2
PUBLIC TRANSIT 1
STATE 11
SPECIAL DISTRICT 1
UTILITY 5
UNIVERSITYCOLLEGE 5
51-6048
61-6510
$0
$20000
$40000
$60000
$80000
$100000
25-34 35-40 41-50 51-60 61-65 65+
SALA
RY
SALA
RY
SALA
RYSA
LARY
AGE IN YEARSAGENCY TYPE
Average may be skewed due to insufficient data
DEPARTMENTAverage may be skewed due to insufficient data
FLEET EXPERIENCE IN YEARS
$61
251
$78
453
$76
120
$57
501
$83
351
$63
955
$63
182
$73
056
$75
574
$67
778
$74
424
$70
814
$69
167
$76
763
$81
243
$84
501
$87
084
$70
379
$69
424
$74
001
$66
251
$64
643 $77
393
$78
007
$78
360
$85
251
The largest base of fl eet managers those ages 51-60 reported earning an average of $78007 more than $1000 less than reported 2008 salaries for those in the same age range
On average city fl eet managers have had the largest income increase since 2008 (45 percent)
TO WHICH DEPARTMENT DO YOU REPORT
HOW MANY YEARS OF FLEET EXPERIENCE DO YOU HAVE
WHICH DEPARTMENT DO YOU
GENERAL SERVICES16
LAW ENFORCEMENTPUBLIC SAFETY
AGENCY8
LESS THAN 4 YEARS3
4 TO 5 YEARS3
6 TO 10 YEARS12
11 TO 20 YEARS28
MORE THAN 20 YEARS54
MAYORMANAGER
ADMINISTRATOR20
PUBLIC WORKS34
REGULATORY BOARD2 OTHER
20
Data shows the largest percentage of fl eet managers report to Public Works earning an average annual salary of $74424 Fleet managers reporting to the General Services Department earned the highest reported 2010 average annual salary in this comparison ($83351)
Fifty-four percent of fl eet managers reported having more than 20 years of fl eet experience and earned the highest salary $81243
GF09_Salaryindd 15GF09_Salaryindd 15 82911 113505 AM82911 113505 AM
16 Government Fleet Fact Book 2011
S A L A R Y
HOW MANY EMPLOYEES DO YOU MANAGE
HOW MANY ON-THE-ROAD LICENSED VEHICLES DO YOU MANAGE
HOW MANY TOTAL VEHICLES DO YOU MANAGE
LESS THAN 1040
LESS THAN 10019
101 - 25017
251 - 50021
501 - 100018
1001 - 200011
2001 - 500012
MORE THAN 50002
LESS THAN 100
13
11 - 2529
251 - 50019
501 - 100018
26 - 5017
1001 - 200016
51 - 1008
2001 - 500018
101 - 2505
5001 - 100003
MORE THAN 2501
MORE THAN 100003
101 - 25010
$0
$20000
$40000
$60000
$80000
$100000
Lessthan 10
11-25 26-50 51-100 101-250
$0
$20000
$40000
$60000
$80000
$100000
Less th
an 100
101-250
251-500
501-10
00
1001-2
000
2001-5
000
More
than 5
001
$0
$20000
$40000
$60000
$80000
$100000
Less th
an 100
101-250
251-500
501-10
00
1001-2
000
2001-5
000
5001-1
0000
More
than 1
0000
Fleet managersrsquo average salaries are shown to increase proportionate to the total number of employees managed
Broken down by type of vehicles managed data shows that fl eet professionals who manage 2001-5000 on-the-road licensed units earned the most ($92059) relatively equivalent to 2008 salary data
Nineteen percent of fl eet managers manage 251-500 units and earn an average annual salary of $70776Total includes all on-road and off-road licensed units
SALA
RYSA
LARY
SALA
RY
NUMBER OF EMPLOYEES250 and more Insufficient data to calculate average
NUMBER OF VEHICLES
NUMBER OF EMPLOYEES
$64
958
$64
733
$69
101
$75
469
$77
768
$88
162
$92
059
$88
333
$61
112
$78
650
$60
834
$84
804
$70
776
$92
935
$73
393
$97
501
$84
636
$88
546
$85
358
$87
501
63PERCENT OF FLEET MANAGERS RESPONSIBLE FOR IN-HOUSE
FUEL OPERATIONS
Yes Average Salary$80572
No Average Salary$65245
54PERCENT OF FLEET MANAGERS WHO MANAGE BARGAINING
UNIT EMPLOYEES
Yes Average Salary$82346
No Average Salary$69197
75PERCENT OF FLEET MANAGERS RESPONSIBLE FOR MANAGING
A MAINTENANCE FACILITY
Yes Average Salary$79430
No Average Salary$65845
GF09_Salaryindd 16GF09_Salaryindd 16 82911 113508 AM82911 113508 AM
GF0911nextraqindd 1 82611 92642 AM
LEASED OR OWNED
Wersquove got the tools for your fl eet
Every fl eet manager knows that
no matter the fl eetmdashleased or
owned big or smallmdashtherersquos a
unique set of tools needed to run
it right Thatrsquos what Fleet Solutions
ismdasha single source of fl eet
management tools and services
that help you manage your fl eet
with unmatched fl exibility
wwwfleetsolutionscom1-866-6LEASES
GF0111merchantsindd 1 12710 13720 PM
GF09_Salaryindd 17GF09_Salaryindd 17 82911 113510 AM82911 113510 AM
18 Government Fleet Fact Book 2011
S A L A R Y
COMPENSATION BY REGION
HOW MANY PEOPLE LIVE IN YOUR JURISDICTION
FOR WHICH DUTIES ARE YOU RESPONSIBLE
$0
$20000
$40000
$60000
$80000
$100000
Northw
est
West
Southw
est
Plain
s Sta
tes
Great L
akes
New E
ngland
Mid
dle A
tlantic
Southeast
SALA
RY
SALA
RYREGION
POPULATION
$84
908
$91
539
$70
686
$74
001
$72
084
$62
501
$75
987
$68
565
AVERAGE COMPENSATIONBY REGION
Broken down by region fl eet managers in the West earned the most averaging $91539 a less than 1 percent increase from 2008 salary data
Fleet managers working in larger jurisdictions are shown to be paid more annually with those working in entities governing more than 1 million people earning $87603
EOPLE LIVE IN YOUR JURISDICTION
Fleet managers working in larger juh ll
LESS THAN 10000041
100001 - 25000018
250001 - 50000015
500001 - 10000009
MORE THAN 100000017
$0
$20000
$40000
$60000
$80000
$100000
Less th
an 1000
00
100001-2
50000
250001-5
00000
500001-1
0000
00
More
than 1
0000
00
$69
878
$74
260
$78
389
$85
186
$87
603
88 Vehicle Acquisition
88 Vehicle Disposal
82 Internal Maintenance and Repair
82 Budgeting
81 Fleet Data Systems Operation and Maintenance
79 Fleet Policy Setting
76 Fleet Regulatory Compliance Oversight
75 Policy Enforcement
70 Warranty Work or Recovery
69 External Maintenance and Repair
64 Motor Pool Operations
63 Alternative Fuel Programs
56 Internal Fuel Program
54 Rate Setting
45 External Fuel Program Administration
42 Fleet Funding Mechanisms Development
34 Vendor Rental Agreements Administration
30 Risk Management
30 Driver Certifi cation and Safety Programs
GF09_Salaryindd 18GF09_Salaryindd 18 82911 113511 AM82911 113511 AM
ZZZQMSDFRRSRUJJRYAacuteHHW
ampRPSHWLWLYHOLGampRQWUDFW3XUFKDVLQJ6ROXWLRQV1-3$LVRIAgraveFLDOOHQGRUVHGE
RXUQHZamp2175$amp7OLQHXS
QWURGXFLQJ1-3$middotVQHZ+($9lt(4830(17DQG)((75($7(6287216
1-3$ampRQWUDFWVKDYHXQGHUJRQHDQDWLRQDOFRPSHWLWLYHELGSURFHVVRQRXUEHKDOI$QRFRVWQRREOLJDWLRQRUOLDELOLW0HPEHUVKLSLVDOORXQHHGWRKDYHDFFHVVWRQDWLRQDOOOHYHUDJHGSULFLQJIURPRYHULQGXVWUOHDGLQJYHQGRUV2YHU0HPEHUVDOUHDGXWLOL]HWKHYDOXHRIRXUacuteAacuteHHWμ
A L i q u i d i t y S e r v i c e s M a r ke t p l a c e
TM
-2172$ltRU(7721286LQ227+DW13
GF09_Salaryindd 19GF09_Salaryindd 19 82911 113513 AM82911 113513 AM
20 Government Fleet Fact Book 2011
S A L A R Y
0
10
20
30
40
50
60
70
80
NAFAC
AFM
APWAC
PFP
AEMP-C
EMO
ther
COMPENSATION BREAKDOWN BY EDUCATION COMPENSATION BY CERTIFICATIONBreakdown of certifi cation types for those who earned certifi cationsHIGH SCHOOL
11
LIBERAL ART DEGREE7
BUSINESS DEGREE18
TECHNICAL DEGREE20
27
19
62
4
SOME POST-GRADUATE
STUDY4
POST-GRADUATE
DEGREE7
MBA5
SOME COLLEGE28
$0
$20000
$40000
$60000
$80000
$100000
High S
chool
Some C
ollege
Libera
l Art
Degre
e
Business
Degre
e
Tech
nical D
egree
Some P
ost-G
raduate
Degre
e
Post-G
raduate
Degre
eM
BA
$0
$20000
$40000
$60000
$80000
$100000
NAFAC
AFM
APWAC
PFP
AEMP-C
EMO
ther
Fleet manager salaries increased with grater educa-tion those holding a Master of Busi-ness Administration (MBA) degree earned the highest annual salary followed by fl eet managers who earned other post-graduate degrees
Fleet managers with the NAFA Fleet Management Association Certifi ed Automotive Fleet Manager (CAFM) certifi cation earned the highest annual salary ($93751)
SALA
RY
SALA
RY
PERC
ENTA
GE
EDUCATION
INDUSTRYCERTIFICATION
INDUSTRYCERTIFICATION
$58
530
$93
751
$86
347
$80
834
$68
342
$73
316
$72
977
$77
113
$73
334
$82
955
$92
066
$95
938
Incentives and adjustments have reduced signifi cantly since 2008 Data of salaries in 2008 showed that 77 percent of fl eet managers received performance-based compensation initiatives and 52 percent received cost-of-living adjustments The percentage of those receiving fl eet ve-hicles only decreased by 1 percent since 2008
13PERCENT OF FLEET
MANAGERS WHO RECEIVED PERFORMANCE-BASED
COMPENSATION INITIATIVES IN 2010
Yes Average Salary$82675
No Average Salary$75612
30PERCENT OF FLEET MANAGERS
WHO RECEIVED COST-OF-LIVING ADJUSTMENTS IN 2010
Yes Average Salary$80568
No Average Salary$73289
27PERCENT OF FLEET MANAGERS
WHO RECEIVE A FLEET CAR WITH THEIR POSITION
Yes Average Salary$75854
No Average Salary$76166
GF09_Salaryindd 20GF09_Salaryindd 20 82911 113513 AM82911 113513 AM
GF0911rmfmaindd 1 82611 95448 AM
GF0911agileindd 1 82411 33355 PM
GF09_Salaryindd 21GF09_Salaryindd 21 82911 113514 AM82911 113514 AM
22 Government Fleet Fact Book 2011
SUPPORT STAFFFleet support staff salaries have not seen increases in a few years Below GF presents average salaries for key titles as well as the number of fi lled positions in a fl eet
S A L A R Y
Budget restrictions continued to
challenge public sector fl eets pre-
venting pay increases and even
leading to pay decreases for fl eet sup-
port staff Many fl eet managers reported
no pay increases for support staff for the
past few years and anticipate no or very
low adjustments for the near future One
fl eet manager said ldquoI think wersquove been
pretty fortunate that we havenrsquot had to lay
staff off or had furlough daysrdquo He also
reported current negotiations for a cost-of-
living salary increase for bargaining unit
employees although this was not yet ap-
proved as of press time
Some fl eets are seeing small salary
increases after some years without One
fl eet manager reported that fl eet support
staff received a 5 percent across-the-
board salary increase the fi rst in three
years He also stated that the agency was
able to allow for smaller incentive in-
creases for certifi cation programs such as
ASE certifi cation
AVERAGE SUPPORT STAFF SALARIES Title Average Minimum MaximumAssistant Fleet Manager $65372 $30000 $100200
Body Shop Technician $49467 $30000 $75000
Data Analyst $52647 $24000 $85500
Fuel System Clerk $40419 $20000 $70000
General Technician $42550 $20800 $73000
IT Person $64508 $25000 $130000
Master Technician $49748 $30000 $67100
Offi ce Clerk $35584 $13000 $60000
Offi ce Manager $47371 $32000 $77000
Offi ce Supervisor $53309 $29100 $80000
Parts Clerk $37318 $14500 $75000
Parts Pickup and Delivery $25913 $10000 $48200
Parts Supervisor $49604 $32000 $75000
PM Technician $33823 $18000 $50000
Rebuild Technician $46536 $32000 $61000
Service Technician $43216 $21500 $78000
Shop Foreman $57866 $32700 $87000
Shop Lead Person $53663 $30500 $85500
Shop Supervisor $60214 $27000 $85000
Technician Assistant $34643 $16000 $61600
Technician-Heavy $50983 $28000 $78000
Technician-Light $44899 $22000 $77000
Technician-Light-2 $40225 $28500 $60000
Technician-Service Truck $39966 $20000 $55000
Technicianrsquos Helper $33484 $13500 $58000
Tire Repair Person $34413 $18000 $70000
Welder $45212 $28500 $85000
Support staff salaries for common titles were calculated with data from cities counties state and federal agencies utilities and university fl eets
GF09_Supportindd 22GF09_Supportindd 22 82911 113534 AM82911 113534 AM
Government Fleet Fact Book 2011 23
Look no further than your drivers They have a huge impact on the cost of operating your fleet With DriveCam you will reduce collision claims costs by up to 80 fuel by up to 12 and fleet maintenance costs as well
Save lives reduce costs exonerate your drivers and keep your organization off the front page of the news
Call today
8664195861 wwwdrivecamcom
Living in a world of zero-growth budgets Looking to reduce costs to your budget
GF0911drivecamindd 1 82411 33837 PM
Assistant Fleet Manager 1
Body Shop Technician 2
Body Shop Technician 2 1
Data Analyst 1
Fuel System Clerk 1
General Technician 4
IT Person 1
Master Technician 3
Offi ce Clerk 1
Offi ce Manager 1
Offi ce Supervisor 1
Parts Clerk 2
Parts Pickup and Delivery 1
Parts Supervisor 1
PM Technician 2
Rebuild Technician 2
Service Technician 3
Shop Foreman 2
Shop Lead Person 2
Shop Supervisor 2
Technician Assistant 2
Technician-Heavy 4
Technician-Light 4
Technician-Light 2 2
Technician-Service Truck 2
Technicianrsquos Helper 1
Tire Repair Person 1
Welder 1
AVERAGE SUPPORT SALARIES BY FLEET SIZEFleet Assistant Fleet Shop Light Heavy MasterSize Manager Supervisor Technician Technician Technician
500 and less $52136 $59910 $44766 $51736 $47936
501 - 1000 $64800 $60504 $41874 $48964 $55574
1001 - 1500 $71093 $65772 $50873 $51991 $50000
1501 - 2000 $74667 $52505 $51447 $52207 $49809
2001 - 4000 $76250 $61750 $50250 $52750 $55000
More than 4000 $78667 $54250 $35000 $55000 $43667
For detailed salary information broken out in different segments check out the Fleet Toolbox website (fleettoolboxcom)
MEDIAN NUMBER OF FILLED POSITIONS IN A FLEET
With lack of pay increases for staff fl eet managers said they were happy to be able to maintain a stable number of support staff
Data of key fl eet positions suggests that while a management position such as assistant fl eet manager is paid more based on a larger sized fl eet salaries of more technical fl eet positions do not correlate with fl eet sizeAverage may be skewed due to insufficient data
GF09_Supportindd 23GF09_Supportindd 23 82911 113534 AM82911 113534 AM
24 Government Fleet Fact Book 2011
FPAR00360_D209891_VINad_R03indd 1 6911 255 PM
WT0711fordpartsindd 1 61011 43215 PM
Nearly 90 percent of public fl eet or-
ganizations reported using some
form of fl eet management system
ranging from those developed in-house to
systems provided by major industry sup-
pliers While initial cost varies widely de-
pending on fl eet size and system chosen
the median amount paid was $50000 and
more than 80 percent of users say they are
satisfi ed with their software provider
Twenty-three percent of fl eet manag-
ers reported they would consider replac-
ing their system soon and one fl eet man-
ager stated his reasoning for an upcoming
switch from a smaller supplier to a larger
one was automation and reduction in labor
time with the new system Other advan-
tages cited by fl eet managers were man-
agement aspects of their system having
considerable information readily avail-
able and functionality One complaint was
about lack of support services
Fuel management system use is also
widespread in the public sector with 83
percent of fl eet professionals reporting
their fl eets do use some form of fuel man-
agement (including fuel cards and systems
developed in-house) Median initial cost
of the systems is $40000 Despite a trend
toward acquisition of more alternative-fuel
vehicles only 39 percent of fl eets stated
their agencies use alternative fuels with
their fuel management system
FLEET AND FUEL MANAGEMENT SYSTEMSFind out which fl eet and fuel management companies are most used by public sector fl eets how much they cost and fl eet manager satisfaction level with the systems purchased
DO YOU USE A FLEET MANAGEMENT SYSTEM YES 89NO 11
MANAGEMENT SYSTEM Y
$$$
M A N A G E M E N T T O O L S
$50000MEDIAN INITIAL COST OF A
FLEET MANAGEMENT SYSTEMAverage cost $95608 System price varies by
supplier and features included
8 YEARSMEDIAN AGE OF ALL FLEET
MANAGEMENT SYSTEMS USED BY GOVERNMENT FLEETS
PERCENTAGE OF FLEET SYSTEM USE BY REGION
GREAT LAKES71
PLAINS STATES86
NEW ENGLAND90
MIDDLE ATLANTIC93
SOUTHEAST93
SOUTHWEST93
WEST93
NORTHWEST94
GF09_Computersindd 24GF09_Computersindd 24 82911 113616 AM82911 113616 AM
With 24-hour access FordPartscom allows you to fi nd everything you need anytime you want The VIN search feature is a simple solution to fi nding the exact part you need to get the job done right Therersquos no better way to order parts than FordPartscom
ANY FORD PARTANY TIME
Let VIN search do the work
And you can order any time mdash so therersquos less downtime
FPAR00360_D209891_VINad_R03indd 1 6911 255 PM
WT0711fordpartsindd 1 61011 43215 PMGF09_Computersindd 25GF09_Computersindd 25 82911 113618 AM82911 113618 AM
26 Government Fleet Fact Book 2011
M A N A G E M E N T T O O L S
GF05-20fcs_fpindd 1 51811 32202 PM
FLEET MANAGEMENT SYSTEM USE BY AGENCY TYPE
CITIES 99
COUNTIES 87Nearly all cities reported using some form of fl eet management system State feder-al educational and utility fl eets reported a lower usage rate 71 percent combined
YES NO
Would you recommend this fl eet system to another agency 74 26
Will you be considering a fl eet system replacement soon 23 77
Are you satisfi ed with the service from your fl eet system provider 82 18
FLEET SYSTEM USE BY COMPANY
Assetworks is the most common fl eet systems used by government fl eets with 21 percent of the market share among fl eets that do use a fl eet management system Other denotes companies with less than 1 percent of the market share
0
5
10
15
20
25
21
18
21
12
8
54
2 21 1 1 1 1 1 1
A B C D E F G H I J K L M N O P
A Assetworks
B CCG Faster
C Developed in-house
D Ron Turley Associates
E CFAWinn
F Sungard HTE
G Dossier Fleet Maintenance Software
H Collective Fleet
I Chevin FleetWave
J Fleetmate
K ManagerPlus
L Maximo
M First Source
N Cartegraph
O Fleet Controller
P Other
GF09_Computersindd 26GF09_Computersindd 26 82911 113618 AM82911 113618 AM
Gain SomePerspective
Your Fleet Consulting Experts
Fleet Consulting Fleet Sof tware Fleet Management Services
Take a Fresh Look at Your Fleet OperationAt Fleet Counselor Services we have spent more than 20 years developing the expertise analytics and software you need to optimize your eet operationWersquore on your side
To learn more call (800) 824-0842 or visit www eetcounselorcom today
Fleet Counselor Services is an o cial partner of Government Fleet magazine
GF05-2011
GF05-20fcs_fpindd 1 51811 32202 PM
GF09_Computersindd 27GF09_Computersindd 27 82911 113619 AM82911 113619 AM
28 Government Fleet Fact Book 2011
M A N A G E M E N T T O O L S
8 YEARSMEDIAN AGE OF FUEL
MANAGEMENT SYSTEMS USED BY GOVERNMENT
FLEETS
DO YOU USE A FUEL MANAGEMENT SYSTEM YES 83NO 17
FUEL SYSTEM USE BY COMPANY
Gasboy is reported to be the most common fuel management system used (17 percent) by public sector fl eets Other denotes companies with less than 1 percent of the market share and fuel cards
0
5
10
15
20
25
17
14
10
7 7 76 6
2
24
A B C D E F G H I J A Gasboy B Petro Vend C FuelMaster D Developed in-house
E Assetworks FuelFocus F Trak G EJ Ward H FuelForce
I Orpak USA J Other
PERCENTAGE OF FUEL SYSTEM USE BY REGION
GREAT LAKES76
PLAINS STATES89
NEW ENGLAND90
MIDDLE ATLANTIC93
SOUTHEAST88SOUTHWEST
91
WEST79
NORTHWEST77
GF09_Computersindd 28GF09_Computersindd 28 82911 113619 AM82911 113619 AM
Government Fleet Fact Book 2011 29
INVERS Mobility Solutions bull 6047421145 bull 8663080091
FF0909inversindd 1 9909 21000 PM
FUEL MANAGEMENT SYSTEM USE BY AGENCY TYPE
CITIES 87
COUNTIES 80Cities reported a slightly higher percent-age of fuel management system use than counties State federal educational and utility fl eets reported a lower usage per-centage 79 percent combined
$37500MEDIAN INITIAL COST OF
A FUEL MANAGEMENT SYSTEM
Average cost $105577 System price varies by supplier and features included
YES NO
Would you recommend this fuel system to another agency
76 24
Will you be considering a fuel system replacement soon
23 77
Are you satisfi ed with the service from your fuel system provider
80 20
Does your fuel system integrate with your fl eet management software
74 26
Does your agency require accurate meter entry for a fuel transaction
86 14
Does your agency use alternative fuels with this system
39 61
GF09_Computersindd 29GF09_Computersindd 29 82911 113620 AM82911 113620 AM
30 Government Fleet Fact Book 2011
MEDIAN ROLLING STOCK FLEET SIZE
(UNITS)
376 625 1250Cities Counties State
Agencies
From passenger sedans to street
sweepers to alternative-fueled
units GF breaks down the average
fl eet frac12 -ton pickup trucks are the most
common type of units reported averag-
ing 18 percent of fl eet totals Off-road
equipment are the oldest units (97 years)
and have the longest replacement cycle
(136 years)
More than 6 percent of units are report-
ed to run on alternative fuels nearly one-
third of which are administrative vehicles
Data shows that not only are most small
alt-fuel vehicles older than conventional
small fl eet vehicles but their replacement
cycles are also longer
Data from this section may be from previous yearsrsquo statistics Information will be updated in the Fleet Toolbox as received
VEHICLE amp EQUIPMENT
INVENTORYIn a time of rightsized vehicle inventory and extended replacement cycles what does the average fl eet consist of and how long is it keeping its vehicles and equipment Here we examine fl eet unit breakdown unit age replacement cycles and federal and state unit totals
V E H I C L E S amp E Q U I P M E N T
63Percent of Alt-Fuel Units in Fleets
dministrative vehicles p
BREAKDOWN BY UNIT TYPE
frac12 -TON PICKUP18
OTHER SMALL POWERED ON-
ROAD UNIT10
MEDIUM TRUCK OR VAN
9ADMINISTRATIVE SEDAN
8
LIGHT TRUCK OR VAN4
ADMINISTRATIVE SUV4
HEAVY TRUCK TANDEM AXLE
2OTHER16
POLICE14
TRAILER5
frac34 - AND 1-TON PICKUP10
Pickup trucks make up the largest percentage of average fl eet totals 28 percent altogether Police units follow averaging 14 percent of fl eet totalsPolice vehicle totals may not be representative as some law enforcement agencies maintain their own fleets
AGE AND REPLACEMENT YEARS BY VEHICLE CATEGORY
Category Current Age (Years)
Replacement Age (Years)
First Responders 6 95
Heavy Vehicles amp Equipment 78 108
Light- amp Medium-Duty Vehicles 61 96
Off-Road Equipment 97 136
First responder vehicles are the newest units on the road (6 years) and have a replacement cycle of 95 years While police vehicles are replaced with more frequency fi re truck replacement cycles increased the average replacement cycle
PERCENT OF ALT-FUEL UNITS BY CATEGORYCategory Percent Running on Alt-Fuel
First Responders 6
Heavy Vehicles amp Equipment 4
Light-Duty Vehicles 7
Administrative vehicles make up 30 percent of alternative-fuel ve-hicles in the light-duty category Nearly half of all alt-fuel heavy units are refuse trucks
ALT-FUEL UNIT AGE amp REPLACEMENT CYCLECategory Current Age
(Years)Replacement Age (Years)
First Responders 7 108
Heavy Vehicles amp Equipment 69 116
Light- and Medium-Duty Vehicles 71 101
Light- and medium-duty alt-fuel vehicles are older and to have a lon-ger replacement cycle than those that run on gasoline or diesel Average may be skewed due to insufficient data
GF09_Vehiclesindd 30GF09_Vehiclesindd 30 82911 113647 AM82911 113647 AM
Government Fleet Fact Book 2011 31
Unit Type Current Age
Replacement Age
frac12 -Ton Pickup 5 9
frac34 - and 1-Ton Pickup 6 9
Administrative Sedan 6 9
Administrative SUV 5 9
Ambulance 5 9
Culvert Cleaner 5 10
Cutaway Van 5 10
Distributor Truck 9 13
Dozer 13 15
Excavator 6 11
Fire Ladder Truck 9 16
Fire Pumper 11 16
Fire Rescue 6 13
Grader 10 13
Heavy Truck Single Axle 9 12
Heavy Truck Tandem Axle 8 12
Light Truck or Van 7 9
Line Stripers 8 11
Loader 11 13
LoaderBackhoe 9 13
Medium Truck or Van 6 10
Other Off-road 11 16
Other Small Powered On-road 8 11
Plow 10 14
Police Administrative 5 7
Police Marked 3 6
Police Motorcycle 3 6
Police Other 6 10
Police SUV 3 6
Police Truck or Van 7 10
Police Unmarked 5 7
Refuse Truck 6 8
Refuse Truck Commercial 6 8
Refuse Truck Mechanical Side Loader 4 7
Refuse Truck Rear Loader 8 8
Roller 9 13
School Bus 9 13
Skid Steer Loader 7 12
Snow Blower 13 16
Sweeper Air 6 10
Sweeper Mechanical 5 10
Tractor (Agriculture) 9 14
Trailer 11 15
Transit Bus 6 9
Trash Compactor 12 13
Water Truck 10 14
AGE AND REPLACEMENT YEARS BY VEHICLE TYPE STATE-OPERATED VEHICLE TOTALS
Police vehicles are reported to be the newest vehicles on the road Snow blowers and dozers are the oldest units averaging 13 years in age and with replacement cycles of 16 and 15 years respectively
StateTotal
Vehicles
Alabama 3100
Alaska 6893
Arizona 11139
Arkansas 7738
California 38326
Colorado 5832
Connecticut 3500
Delaware 7022
District of Columbia
6956
Florida 26089
Georgia 19773
Hawaii 5000
Idaho 6163
Illinois 12100
Indiana 10028
Iowa 6807
Kansas 5671
Kentucky 11374
Louisiana 11818
Maine 3403
Maryland 8800
Massachusetts 10072
Michigan 12552
Minnesota 7600
Mississippi 7528
Missouri 10849
StateTotal
Vehicles
Montana 7409
Nebraska 4250
Nevada 6000
New Hampshire 2023
New Jersey 13000
New Mexico 6500
New York 18708
North Carolina 8328
North Dakota 3438
Ohio 11812
Oklahoma 8028
Oregon 12000
Pennsylvania 16186
Rhode Island 2026
South Carolina 16506
South Dakota 3423
Tennessee 7592
Texas 28000
Utah 7301
Vermont 2030
Virginia 15823
Washington 11645
West Virginia 9500
Wisconsin 5737
Wyoming 8440
Total Vehicles 501426
Vehicle counts are collected from 2010 and 2011 dataEstimated
For detailed vehicle and equipment information broken out in different segments check out the Fleet Toolbox website (fleettoolboxcom)
Source Automotive Fleet
GF09_Vehiclesindd 31GF09_Vehiclesindd 31 82911 113648 AM82911 113648 AM
32 Government Fleet Fact Book 2011
V E H I C L E S amp E Q U I P M E N T
GF0911toolboxindd 1 81911 84633 AM
US FEDERAL FLEET - FY-2010 CENSUSPASSENGER CARS TRUCKS OTHER
Department or Agency Owned GSAComm Leased
Pass Subtotal Owned GSA
Comm Lease
Truck Subtotal Owned GSA
Comm Leased
Other Subtotal Total
American Battle Monuments Commission 23 ndash ndash 23 17 ndash ndash 17 ndash ndash ndash ndash 40
Broadcasting Board of Governors 68 5 7 80 88 2 1 91 10 ndash ndash 10 181
Consumer Product Safety Commission ndash 89 2 91 2 4 ndash 6 ndash ndash ndash ndash 97
Court Svcs and Offender Supervision Agcy ndash 25 48 73 ndash 1 ndash 1 ndash ndash ndash ndash 74
Department of Agriculture 10538 5083 23 15644 27206 2128 58 29392 54 20 ndash 74 45110
Department of Commerce 530 969 77 1576 273 549 4 826 1 7 1 9 2411
Department of Education ndash 96 2 98 ndash ndash ndash ndash ndash 1 ndash 1 99
Department of Energy 742 4134 83 4959 3034 6611 262 9907 152 58 32 242 15108
Department of Health and Human Services 300 2996 2 3298 312 622 1 935 8 56 ndash 64 4297
Department of Homeland Security 34828 5601 35 40464 12114 1873 11 13998 486 24 ndash 510 54972
Department of Housing and Urban Dev ndash 469 4 473 ndash 3 ndash 3 ndash ndash ndash ndash 476
Department of Justice 33716 1127 142 34985 5716 63 ndash 5779 225 13 ndash 238 41002
Department of Labor 82 3018 22 3122 4 493 6 503 ndash 279 ndash 279 3904
Department of State 6414 863 173 7450 4076 135 3 4214 120 15 ndash 135 11799
Department of the Interior 7763 4045 138 11946 15853 5599 67 21519 256 280 6 542 34007
Department of Transportation 90 4171 ndash 4261 193 1705 ndash 1898 ndash 4 ndash 4 6163
Department of Treasury 3212 453 32 3697 48 32 107 187 ndash 1 ndash 1 3885
Department of Veterans Affairs 2251 8638 80 10969 1035 1970 22 3027 349 344 15 708 14704
Environmental Protection Agency 24 820 47 891 75 124 15 214 5 ndash 2 7 1112
Equal Employment Opportunity Comm ndash 75 1 76 ndash ndash ndash ndash ndash ndash ndash ndash 76
Federal Communications Commission 99 2 11 112 3 1 ndash 4 ndash ndash ndash ndash 116
Federal Housing Finance Agency ndash ndash 5 5 ndash ndash ndash ndash ndash ndash ndash ndash 5
Federal Trade Commission ndash ndash 3 3 ndash ndash 1 1 ndash ndash ndash ndash 4
General Services Administration ndash 1138 1138 ndash 133 ndash 133 ndash 2 ndash 2 1273
Government Printing Offi ce 5 2 4 11 35 ndash 1 36 ndash ndash ndash ndash 47
Library of Congress ndash 14 1 15 1 5 1 7 ndash 2 ndash 2 24
National Aeronautics and Space Admin 343 1298 2 1643 660 1334 4 1998 71 52 ndash 123 3764
National Archives amp Records Admin ndash 53 ndash 53 ndash 22 ndash 22 ndash ndash ndash ndash 75
National Gallery of Art ndash 2 2 4 2 3 ndash 5 ndash ndash ndash ndash 9
National Labor Relations Board ndash 41 ndash 41 ndash ndash ndash ndash ndash ndash ndash ndash 41
National Science Foundation 70 60 2 132 197 34 ndash 231 12 ndash ndash 12 375
Nuclear Regulatory Commission 1 25 6 32 ndash 2 3 5 ndash ndash ndash ndash 37
Offi ce of Personnel Management 1 1649 4 1654 ndash 4 ndash 4 ndash ndash ndash ndash 1658
Peace Corps 561 23 1 585 59 ndash ndash 59 16 ndash ndash 16 660
Small Business Administration 35 203 20 258 ndash 9 1 10 ndash ndash ndash ndash 268
Smithsonian Institution 214 14 1 229 244 8 ndash 252 4 3 2 9 490
Social Security Administration 3 479 2 484 2 42 ndash 44 ndash 7 ndash 7 535
Tennessee Valley Authority 1333 ndash ndash 1333 1563 ndash ndash 1563 ndash ndash ndash ndash 2896
US Agency for International Development 680 183 4 867 126 5 ndash 131 14 ndash ndash 14 1012
Total Civilian Agencies 103926 47863 986 152775 72938 23516 568 97022 1783 1168 58 3009 252806
Corps of Engineers Civil Works 47 3505 1 3553 675 4290 ndash 4965 ndash ndash ndash ndash 8518
Defense Agencies 761 2570 194 3525 646 885 43 1574 19 97 225 341 5440
Department of Air Force 3298 8142 592 12032 27142 8016 1484 36642 1616 411 76 2103 50777
Department of Army 3286 38903 543 42732 8294 26210 687 35191 217 2407 123 2747 80670
Department of Navy 3140 12880 1630 17650 12648 6510 130 19288 369 507 47 923 37861
United States Marine Corps 1369 6344 37 7750 2780 3141 2 5923 256 273 9 538 14211
Total Military Agencies 11901 72344 2997 87242 52185 49052 2346 103583 2477 3695 480 6652 197477
US Postal Service 8829 513 ndash 9342 202308 216 ndash 202524 2 3 ndash 5 211871
Total All Agencies 124656 120720 3983 249359 327431 72784 2914 403129 4262 4866 538 9666 662154
Source US General Services Administration
GF09_Vehiclesindd 32GF09_Vehiclesindd 32 82911 113649 AM82911 113649 AM
Public Fleet Social Network
700+ Document Templates
Robust Benchmarking Tool
Advanced Fleet Calculators
In-depth Fleet Solution Guide
Join a community of professionals with challenges similar to your own at www eettoolboxcom
FLEET TOOLBOX ISP
7
R
A
I
DEVELOPED BY
GF08
-5411
FREE
FREE
GF0911toolboxindd 1 81911 84633 AMGF09_Vehiclesindd 33GF09_Vehiclesindd 33 82911 113649 AM82911 113649 AM
34 Government Fleet Fact Book 2011
Just as any private company fl eets
have customers to which they pro-
vide services and the amount and
variety of customer departments will
determine the mix of vehicles and equip-
ment technicians must be knowledgeable
about While specialized fl eets may only
service its own department vehicles gen-
eral fl eet management divisions report
up to 22 different customer departments
Public Works is the most commonly re-
ported customer 65 percent and the En-
gineering and Parks departments tied for
second place 58 percent City fl eets have
the widest customer base reporting on
average 11 customer departments Coun-
ty fl eets service nine on average
Analysis of top customers by agency
type shows many of the same customers
except for utility fl eets which report top
customers such as the Water Distribu-
tion and Electric departments Larger
fl eets report more customer departments
than smaller fl eets
CUSTOMER DEPARTMENTSFleets report servicing between one to 22 different customer departments with Public Works being the most reported fl eet customer GF explores and analyzes fl eetrsquos most common clients
C U S T O M E R S
FLEET CUSTOMER DEPARTMENTSCustomer Agency Percent
Agency Administration 55
Airport 12
Assessors Department 20
Building Permits 44
Community Development 44
Construction Department 40
Distribution Department 19
Elected Offi cials 27
Electric Department 17
Emergency Services (ambulance) 34
Engineering Department 58
Fire Department 46
Gas Department 4
General Public 9
Mountain Rescue 5
Parks Department 58
Police Department 57
Public Works 65
Sheriffrsquos Department 19
Solid Waste 34
Streets Maintenance 56
Transmission Department 7
Transportation Department 36
Waste Water Department 39
Water Department 44
The department most often reported as a customer is Public Works with 65 percent of fl eets claiming it as a client The Gas Depart-ment is the least common customer mdash 4 per-cent of fl eets report it as a customer half of which are City fl eets
TOP 5 CUSTOMERS BY AGENCY TYPECITY
Department Percent
Public Works 86
Police Department 84
Streets Maintenance 80
Engineering Department 69
Fire Department 69
COUNTY
Department Percent
Public Works 66
Sheriffrsquos Department 63
Parks Department 60
Engineering Department 60
Agency Administration 55
FEDERAL
Department Percent
Agency Administration 48
Engineering Department 33
Police Department 33
Fire Department 22
Parks Department 22
STATE
Department Percent
Agency Administration 67
Police Department 37
Transportation Department 33
Engineering Department 33
Public Works 27
UTILITY
Department Percent
Engineering Department 52
Water Department 52
Distribution Department 39
Agency Administration 39
Electric Department 35
City and county fl eets report Public Works and Police as their top customers while Agency Administration is the top customer for both federal and state fl eets
UNCOMMON CUSTOMERS
Percentages shown are highest by agency type
14OF COUNTY FLEETS
REPORT MOUNTAIN RESCUE AS A
CUSTOMER
9OF UTILITY FLEETS REPORT THE GAS DEPARTMENT AS
A CUSTOMER
26OF UTILITY FLEETS REPORT THE
TRANSMISSION DEPARTMENT AS A CUSTOMER
GF09_Customersindd 34GF09_Customersindd 34 82911 113709 AM82911 113709 AM
Government Fleet Fact Book 2011 35
Wish fi nding the right employee was always this obvious
It can be
Search qualifi ed resumes and post your job today
wwwfl eetjobfi ndercom
BF1110jobfinder_hpindd 1 11210 31154 PM
TOP 5 CUSTOMERS OF LARGE FLEETS
Engineering Department 68
Parks Department 65
Public Works 65
Agency Administration 64
Police Department 62
More than 1000 units
TOP 5 CUSTOMERS OF SMALL FLEETS
Public Works 41
Police Department 38
Parks Department 30
Streets Maintenance 29
Water Department 29
Less than 100 units
The largest fl eets (1000+ units) report servicing more than twice the number of user departments that small fl eets (less than 100 units) service A comparison shows that Police Parks and Public Works are overlapping customers
FAST FACTS
PUBLIC WORKS
MOST COMMON CUSTOMER
DEPARTMENT
CITY FLEETSREPORT
THE WIDEST CUSTOMER BASE
0 10 20 30 40 50 60 70
0 10 20 30 40 50 60 70
GF09_Customersindd 35GF09_Customersindd 35 82911 113709 AM82911 113709 AM
36 Government Fleet Fact Book 2011
wwwfleetcertificationcom
Certify Your Fleet Operation
GF0911certificationindd 1 81911 85240 AM
The variety of inventory kept by
fl eets is large covering the many
types of vehicles and equipment
as well as brands operated by the public
sector The average value of repair parts
inventory kept by fl eets is almost a quar-
ter million dollars with values reaching
around a half-million for larger federal
and state fl eets While there are compa-
nies offering parts services for fl eets 99
percent of fl eets report operating their own
parts rooms
On the fuel side diesel and gasoline
fuel inventory kept at fueling sites averages
about $28000 and $103000 respectively
About 85 percent of fl eets reported having
some inventory of traditional fuels and
about 80 percent not storing these fuels
were smaller fl eets The percent of fl eets
that report storing alt-fuel inventory is 10
or less depending on the type of alterna-
tive fuel
Data from this section may be from previous yearsrsquo statistics Information will be updated in the Fleet Toolbox as received
FUEL LUBE AND PARTS INVENTORYAbout 85 percent of fl eets store diesel and gasoline inventory Find out more inventory statistics about alternative fuel lube parts and tires
I N V E N T O R Y
$10721AVERAGE LUBE INVENTORY
FUEL INVENTORY
Fuel Average ValueDiesel $27993
Gasoline $102753By dollar value fl eet departments store nearly four times as much gasoline as they do diesel supplies
FAST FACTS
86Percent of fl eets storing
gasoline inventory
84Percent of fl eets storing
diesel inventory
80of fl eets not storing
gasoline inventory had a fl eet size of less than 1000
units
82of fl eets not storing diesel inventory had a fl eet size of less than 1000 units
All fl eets with gasoline inventory reported also storing diesel inventory and 2 percent of fl eets stored gasoline but no diesel
PERCENT OF FLEETS STORING ALT-FUEL INVENTORY
Fuel Percent of Fleets with Inventory
E-85 Ethanol 10
B-20 Biodiesel 8
Compressed Natural Gas 5
Propane Autogas 3
B-10 Biodiesel1E-85 and B-20 fuels are more often stored in fl eet inventory than any other alternative fuel
FUEL amp LUBE
GF09_Inventoryindd 36GF09_Inventoryindd 36 82911 113741 AM82911 113741 AM
wwwfleetcertificationcomwwwfleetcertificationcom
in alliance with
GF08
-5511
Certify Your Fleet Operation
Government Fleet Management Alliance isa group of associations and organizations dedicated to excellence in fl eet management
The mission of GFMA is to bring fl eet groups together in order to educate public fl eet professionals promote the fi eld of fl eet management and elevate the awareness of fl eet operations
that are performing at competitive levels GFMA also administers the Certifi ed Fleet Management Operation (CFMO) certifi cation program which has become
the standard for ensuring peak fl eet operation performance
GF0911certificationindd 1 81911 85240 AMGF09_Inventoryindd 37GF09_Inventoryindd 37 82911 113743 AM82911 113743 AM
For detailed inventory statistics broken out in different segments check out the Fleet Toolbox website (fleettoolboxcom)
38 Government Fleet Fact Book 2011
I N V E N T O R Y
PROTECT YOUR FLEET
GF0711auditindd 1 7111 92820 AM
PARTS
99 OF FLEETS MANAGE
THEIR OWN PARTS ROOMS
PARTS INVENTORY AVERAGE VALUEParts Average ValueRepair Parts $245802PM Parts $13283Tires $9408Average value of repair parts kept in inventory for numerous models of vehicles and equipment totals almost one quarter-million dollars
AVERAGE PARTS INVENTORY VALUE BY FLEET SIZE
FLEET SIZE REPAIR PARTS PM PARTS TIRES
Less than 100 $25000 $1000 $2500
100 - 250 $25000 $2000 $3000
251 - 500 $65192 $5067 $5706
501 - 750 $199125 $12463 $6363
751 - 1000 $271429 $14714 $10714
1001 - 2000 $397143 $10071 $8343
2001 - 3000 $740000 $16250 $5100
3001 - 4000 $650000 $10000 $12500
4001 - 5000 $650000 $10000 $12500
5001 - 7000 $930000 $48400 $68700
More than 7000 $1800000 $245600 $107500 With some exceptions fl eet size correlates with value of parts and tires stored in inventoryAverage may be skewed due to insufficient data
MEDIAN PARTS INVENTORY VALUE BY AGENCY TYPE
AGENCY TYPE REPAIR PARTS PM PARTS TIRES
City $65000 $5000 $6000
County $200000 $10000 $6000
Federal $200000 $12500 $6000
State Agency $650000 $10000 $6000
Utility $65000 $5000 $6000State fl eet agencies report the highest amount of repair parts inventory while federal agencies have the highest PM parts inventory Median tire inventory was the same across all agency types
GF09_Inventoryindd 38GF09_Inventoryindd 38 82911 113744 AM82911 113744 AM
This comprehensive guide contains information on how to
- prevent auditing
- standardize your administrative and maintenance tasks
- increase effi ciency and workfl ow processes
- build and improve written and maintenance tasks
- gain analytical skills to evaluate other fl eet operations
- increase accountability
Buy today and receive free updates and changes via e-mail
Keep your fl eet operations secure today
Learn more at wwwgfl eetcomaudit GF10-0210
presents
Limited time offer$199$149
PROTECT PROTECT YOUR FLEETYOUR FLEET
Prevent an audit of your fl eet operations with the
Public Fleet Audit ndash A Self Assessment Checklist
GF0711auditindd 1 7111 92820 AMGF09_Inventoryindd 39GF09_Inventoryindd 39 82911 113747 AM82911 113747 AM
40 Government Fleet Fact Book 2011
PUBLIC FORUM By Mike Antich
Welcome to our fi rst-
ever Fact Book
Congratulations to
Thi Dao GFrsquos senior editor
who single-handedly developed
the statistics portion of this pub-
lication All this data however
can be boiled down to a single
truism that every function of a
fl eet operation is centered on
money acquisition of vehicles
equipment fuel maintenance
facilities salaries parts inven-
tory shop supplies tools etc As
we all know the No 1 problem
today (and for the foreseeable
future) is the lack of money due
to depressed sales and property
tax revenues
Realistically fl eet managers
must operate under the assump-
tion that tax revenues will contin-
ue to remain depressed as most
tax bases are forecast to remain
stagnant In todayrsquos weak fi scal
environment all capital expen-
ditures are intensely scrutinized
by management politicians
and taxpayer groups In general
public sector fl eet inventory has
gone from stability during the
pre-recession years to inventory
declines (and asset deteriora-
tion through extended service)
during the post-recession years
In addition tight budgets
have caused vacant positions
to remain unfi lled wages to
be frozen and employee con-
tributions to health care costs
to increase This has resulted
in increased employee apathy
(cynicism) and burnout con-
cerns as remaining employees
pick up the additional workload
from vacant positions
The economic downturn has
caused major reorganizations
and downsizing within many
political subdivisions for the past
two to three budget cycles The
management at many political
subdivisions have balanced bud-
gets by consolidating services
reducing staffi ng levels and de-
ferring equipment replacement
Consequently fl eet operations
are scrutinized for every dollar
spent For some fl eet managers
budget reduction is not a once-a-
year issue some have faced up
to three reductions within one
budget cycle The challenge for
fl eet managers is to adjust core
services to correspond to the
new budget realities The ever-
tightening budgets have unfairly
caused some user departments
to become hyper-critical and ex-
tremely vocal when they do not
receive the same level of service
they were accustomed to during
the pre-recession period On the
fl ip side some fl eet managers
grumble that user departments
have not made sacrifi ces pro-
portionate to the sacrifi ces made
by fl eet operations User depart-
ments expect fl eet to provide the
same level of service with less
funding but are unwilling to
make any quid pro quo adjust-
ments on their part
One shortsighted tactic used
by some fi nancially strapped
government agencies has been
to ldquoraidrdquo the vehicle replacement
fund As fi nance departments
struggle to balance competing
needs of different departments
for limited funds oftentimes
the fl eet replacement fund be-
comes an attractive source of
revenue to solve budget prob-
lems elsewhere Replacement
reserves built up for vehicle
equipment replacements are a
quick fi x to help reduce defi cits
within the general fund
Public misperception is
another intangible factor that
discourages scheduled vehicle
replacements As public aware-
ness intensifi es especially
among taxpayer watchdog
groups even entities that have
cash-rich vehicle replacement
programs are fi nding it hard to
justify new-vehicle purchases
in the wake of staff layoffs and
decreased public services
The decrease in capital ex-
penditures by deferring pro-
curement of vehicles scheduled
for replacement complicates
fl eet management Operating
older assets especially units
such as aging refuse trucks sig-
nifi cantly increases operating
costs and adds additional pres-
sure on the maintenance staff
UNINTENDED RESULTS There are a number of unin-
tended consequences of efforts
to stem budgetary shortfalls
One unintended consequence
of contracted budgets and hir-
ing freezes is that it jeopardizes
disaster preparedness Reduced
staffi ng will make it diffi cult to
provide continuity of operations
services during emergencies
Another unintended con-
sequence is that the reduction
in capital replacement funding
runs contrary to government
sustainability initiatives Ag-
ing vehicles are an obstacle
to achieving carbon emission
reduction goals An additional
consequence is the decrease in
vehicle residual values caused
by age and higher milesengine
hours It is diffi cult to recoup
the same percentage of funds at
resale as in the past One anec-
dotal silver lining is that several
fl eets have noticed that drivers
operators seem to be taking bet-
ter care of equipment because
they know it will not be replaced
as scheduled in the past
In the fi nal analysis until
there is an increase in tax rev-
enues the fl eet managerrsquos job
will remain incredibly hard
The prognosis is that this dismal
fi scal situation will worsen next
year or in a best case scenario
will remain at todayrsquos level In
fact tax bases could decline
further if the threat of a double-
dip recession proves true
The psyche of public sector
employees has been shaken by
this recession There once was
the perception that economic
recessions only affect jobs in
the private sector However this
perception has been shattered
by the layoffs resulting from
this recession and extremely
sluggish recovery For some
long-time fl eet managers the
idea of early retirement is be-
coming an attractive option
However fl eet managers
are a tough breed Most have
worked their way up through
the ranks and know their opera-
tions from top to bottom They
are resilient and are at their best
when the times are tough Un-
fortunately management and
politicians are often oblivious
to this To all the public sec-
tor fl eet managers reading this
publication I would like to say
that you deserve utmost respect
and admiration for being able to
accomplish all that you do un-
der the worst of circumstances
Let me know what you
think
mikeantichbobitcom
EVERYTHING FLEET DOES REVOLVES AROUND MONEY
THE PROBLEM IS THE LACK OF IT
GF09_forumindd 40GF09_forumindd 40 82911 113912 AM82911 113912 AM
reliability
When your contract requires high performance Fleet Management services rely on AbilityOneAbilityOne helps fulfill your federal contract needs while enabling you to create employment opportunities for people who are blind or have other significant disabilities Our competitive Fleet Management services include
AbilityOneorg
GF0511nishindd 1 41411 43912 PMGF09_C3-C4indd 993GF09_C3-C4indd 993 82911 113846 AM82911 113846 AM
THE CHALLENGE SAVING MONEY OVER THE LONG RUN
OUR SOLUTION AWARD-WINNING LIFECYCLE COSTS
Nine GM models have been awarded Vincentricrsquos 2011 Best Fleet Value
in Americatrade with Chevrolet sweeping the full-size pickup and full-size
van categories The awards honor vehicles with the lowest lifecycle
costs in their segment determined by measuring eight cost factors For
outstanding savings over time put our award-winning vehicles to work
For more solutions visit gmfleetcom
Vincentric awards based on 2011 model year analysis
copy2011 General Motors LLC
| 2011 CHEVROLET SILVERADO 3500HD
| 2011 CHEVROLET EXPRESS
OUR VINCENTRIC 2011 BEST FLEET VALUE IN AMERICAtrade WINNERS Cadillac SRX Base FWD ndash Premium Mid Size Crossover
bull Chevrolet Tahoe Commercial 2WD ndash Large SUV bull Cadillac Escalade ESV Platinum 2WD ndash Prestige bull Chevrolet
Avalanche LS 2WD ndash Sport Utility Truck bull Chevrolet Silverado 1500 Work Truck Regular Cab 2WD 119 ndash 12 Ton Full
Size Pickup bull Chevrolet Silverado 2500HD LT Regular Cab 2WD ndash Heavy Duty 34 Ton Full Size Pickup bull Chevrolet
Silverado 3500HD LT Regular Cab 2WD SRW ndash Heavy Duty 1 Ton Full Size Pickup bull Chevrolet Express Cargo G1500
SWB ndash Full Size Cargo Van bull Chevrolet Express Passenger G1500 SWB ndash Full Size Passenger Van
GF09_C3-C4indd 994GF09_C3-C4indd 994 82911 113851 AM82911 113851 AM
- GOVF_991_NO_BOX
- GOVF_992
- GOVF_1
- GOVF_2-3
- GOVF_4-5
- GOVF_6-9
- GOVF_10-13
- GOVF_14-21
- GOVF_22-23
- GOVF_24-29
- GOVF_30-33
- GOVF_34-35
- GOVF_36-39
- GOVF_40
- GOVF_993
- GOVF_994
-
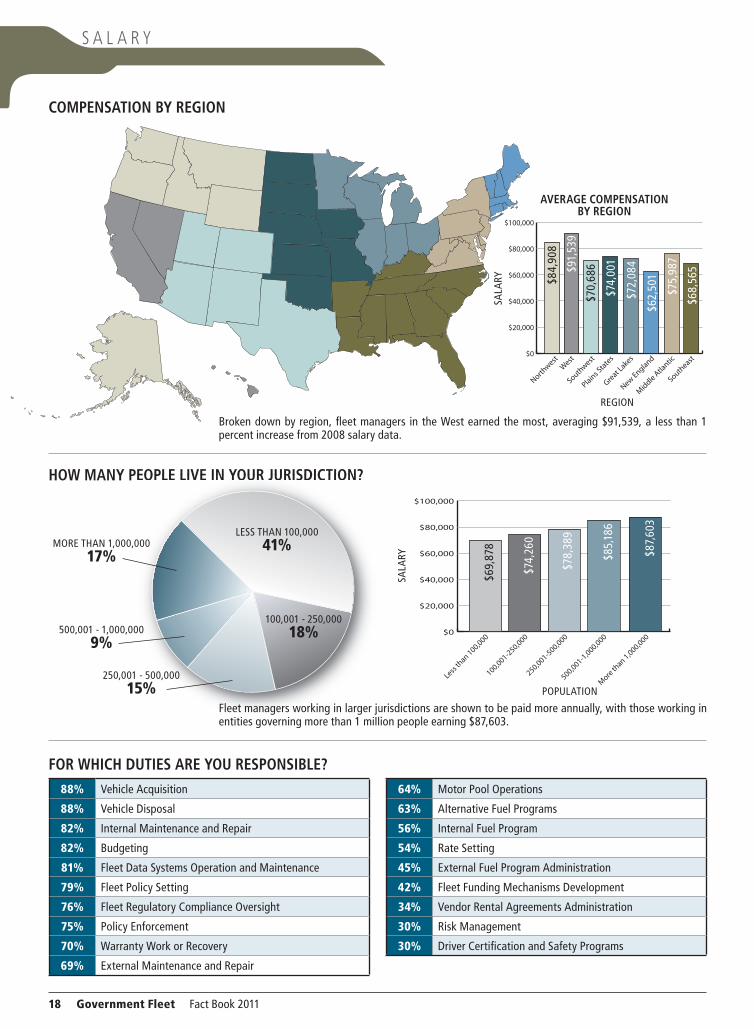
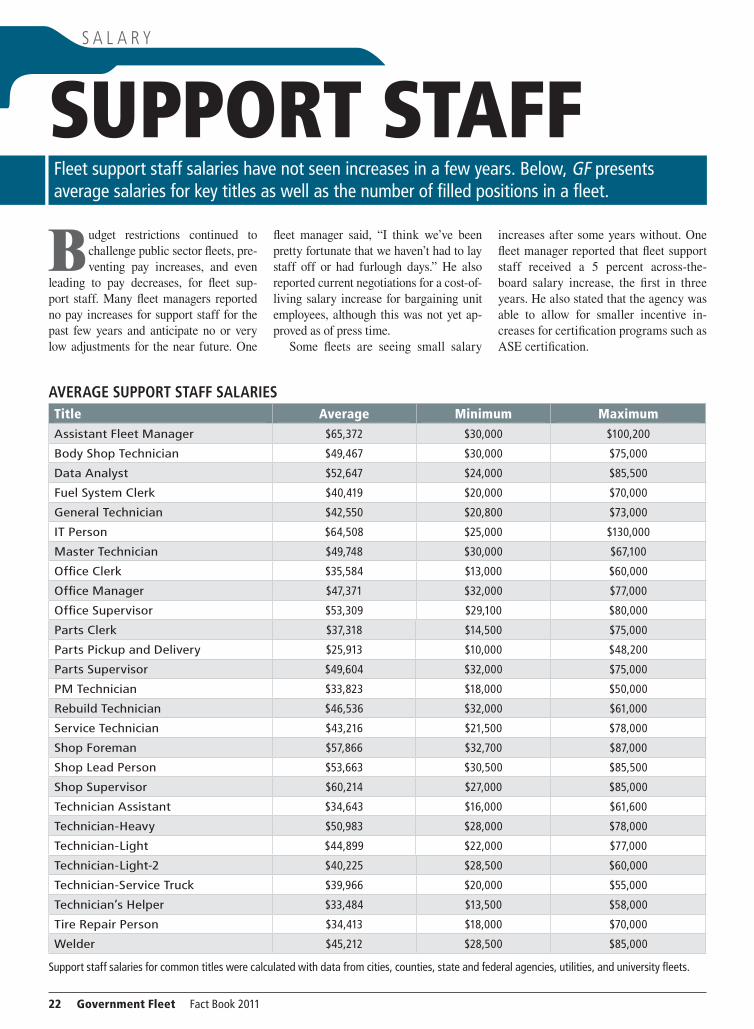
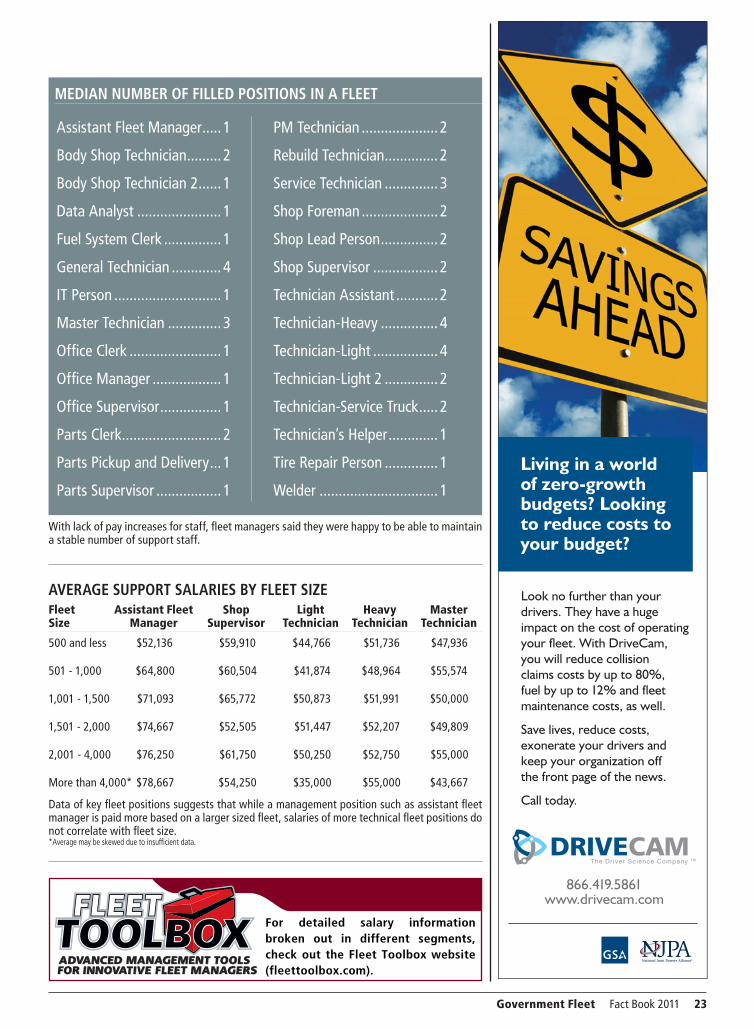