government efficiency - deloitte us · pdf filegovernment efficiency innovate. scale. measure....
TRANSCRIPT

Government EfficiencyInnovate. Scale. Measure. Incent.
The Government SummitThought Leadership Series
In collaboration with

02 The Government Summit Thought Leadership Series

Efficiency is an increasingly core component of gov-ernment reform. However, reviews of government production costs and productivity in OECD countries indicate that governments may be getting less effi-cient over time. Governments are actively addressing the topic of efficiency through the introduction of new practices in various areas of public service. Our research shows that opportunities for improvement exist to create meaningful and sustainable efficiency gains.
In order to continue to improve efficiency in the pub-lic sector, governments should focus on four key ar-eas: pursuing innovative practices linked to efficiency; scaling the use of efficient practices; improving the use of established measurement and analytical tools to generate actionable insights; and strengthening management incentives to become more efficient.
Executive Summary
The Government Summit Thought Leadership Series 03

Introduction
Methodology
ContextUAE Government Efficiency in International PerspectiveThe Public Sector’s Commitment and Experience with Efficiency ProgramsThe State of Government EfficiencyThe Characteristics of Inefficiency
Four Key Drivers of Government EfficiencyInnovateScaleMeasureIncent
06
07
08
13
Contents
04 The Government Summit Thought Leadership Series

Conclusion:Achieving SystematicGovernment Efficiency
References
Annex
28
29
33
The Government Summit Thought Leadership Series 05

Introduction Efficiency is about doing more for less. It involves maximizing outputs such as the volume of services provided, minimizing inputs such as the amount of resources or capital required to produce those services and maintaining or improving quality. Efficiency can be measured by how much it costs to deliver a program compared to previous years or compared to peers, or the relative outcomes that governments obtain from a certainlevel of expenditure. Rising citizen expectations, ageing popula-tions and global economic volatility have put pressure on gov-
ernments to increase the value for money of public services. Against this backdrop, the UAE public service is tasked withdelivering policy and programs to meet the Government’s ambi-
tious Vision 2021 agenda to improve healthcare and education, strengthen social programs, grow the economy, enhance public safety, promote environmental sustainability and improve itsglobal standing. According to the IMF World Economic Out- look, government expenditures are projected to hold steady at approximately 22 percent of GDP. As such, the government needs to ensure that existing programs are efficient and effective.and future investments represent good value for money
This study is an independent review of government efficiency. Although the focus is on efficiency in the Government of the UAE, the content is developed for the High Level Government Forum bringing together senior government officials fromaround the world. Unless otherwise stated, when the study re-
fers to “government” it is referring to governments around the.world rather than any specific government entity
This paper is divided into several sections:
• Section two describes themethodology which involved aseries of interviews with senior UAE Government officials, analysis of data on public sector expenditure and perfor-mance, meetings with subject matter experts in Deloitte’s Global Public Sector practice and reviews of leading initia-tives in several countries.
• SectionthreedescribestheUAEGovernment’sefficiencyininternational perspective. It highlights that the UAE Govern-ment spends less than many other high income countries, but doesn’t get a high score on an international assessment of government effectiveness. It reviews the increasing im-portance of “efficiency” in public sector organizations and looks at governments’ track record on efficiency using avail-able international evidence and concludes that efficiency is declining over time. It also describes the characteristics of government inefficiency.
• Section four identifies the key drivers of government effi-ciency and develops a framework for improving government efficiency.
• Thefinalsectionconcludeswithasummary.
06 The Government Summit Thought Leadership Series

MethodologyDeveloping robust evidence on what drives efficiency is chal-lenging because of the absence of readily comparable data on government inputs, outputs and quality. Drawing the links be-tween specific initiatives and overall efficiency is confounded by time lags and other factors that influence efficiency but are outside of government’s control. As such, this study has pur-sued a pragmatic approach. We have undertaken a brief review of leading practices in Australia, Canada, Singapore, and the United Kingdom. These countries were selected based on their reputations as leaders in public sector management policy and practice. The review involved selecting a set of key areas of gov-ernment activity which provide significant potential for efficien-cy gains and developing a set of assessment frameworks to guide the investigation. The study is informed by a variety of sources:
• InterviewswithseniorgovernmentofficialsintheUAEandhigh level reviews of UAE Government programs to improve efficiency
• InterviewswithDeloittepublicsectorsubjectmatterexperts
• Selected literature and publicly available information onpublic sector reforms designed to improve efficiency
• Publiclyavailabledataongovernment spendingandeffec-tiveness
• Lessons learned fromrecentDeloitteexperiencewithgov-ernment efficiency improvement projects
The comparator countries vary in size, system of governmentand level of spending. This diversity helped to clarify the com-.mon trends in best practices used to generate efficiency gains
Country
United Arab Emirates
Australia
Canada
Singapore
United Kingdom
Source: IMF World Economic Outlook (data shown here is for 2011)
7.9
22.6
34.5
5.2
62.6
Federal
Federal
Federal
Unitary
Unitary
22
36
43
18
46
Population (millions)
System of GovernmentGovernment expenditure
(% of GDP)
The Government Summit Thought Leadership Series 07

ContextUAE Government Efficiencyin International Perspective
The UAE is viewed by business leaders as one of the most efficient governments in the world. According to a recent international survey by the World Economic Forum that asked business lead-ers to rank the efficiency of the composition of public spending, UAE business leaders were more likely to rank their government as efficient than business leaders in any other country except Singapore. Over the previous five years, business leaders in the UAE have been consistently more positive about the efficiency of public spending than those in the OECD (see figure 1 below).
This is likely to reflect in part the low levels of spending in the UAE, with government expenditure at 22 percent of GDP com-pared to the OECD average of 44 percent of GDP.1
However, the UAE is ranked 48th in the world in global com-parisons of government effectiveness. Taking into account both spending and effectiveness2, the UAE performs at a level that is well within the “efficiency frontier” set by leading countries such as Finland and Singapore. Like all governments, the priority is to ensure that any additional investment made by government has a high degree of value for money.
Figure 1Perceptions of government efficiency
How would you rate the composition of public spending in your country?1= highly wasteful 7= highly efficient
Source: World Economic Forum Executive Opinion SurveyApproximately 100 business leaders were surveyed in each country and asked to rate the composition of public spending. The OECD Average is reported here.
20081
2
3
4
5
6
7
2012201120102009
UAE OECD Countries
08 The Government Summit Thought Leadership Series
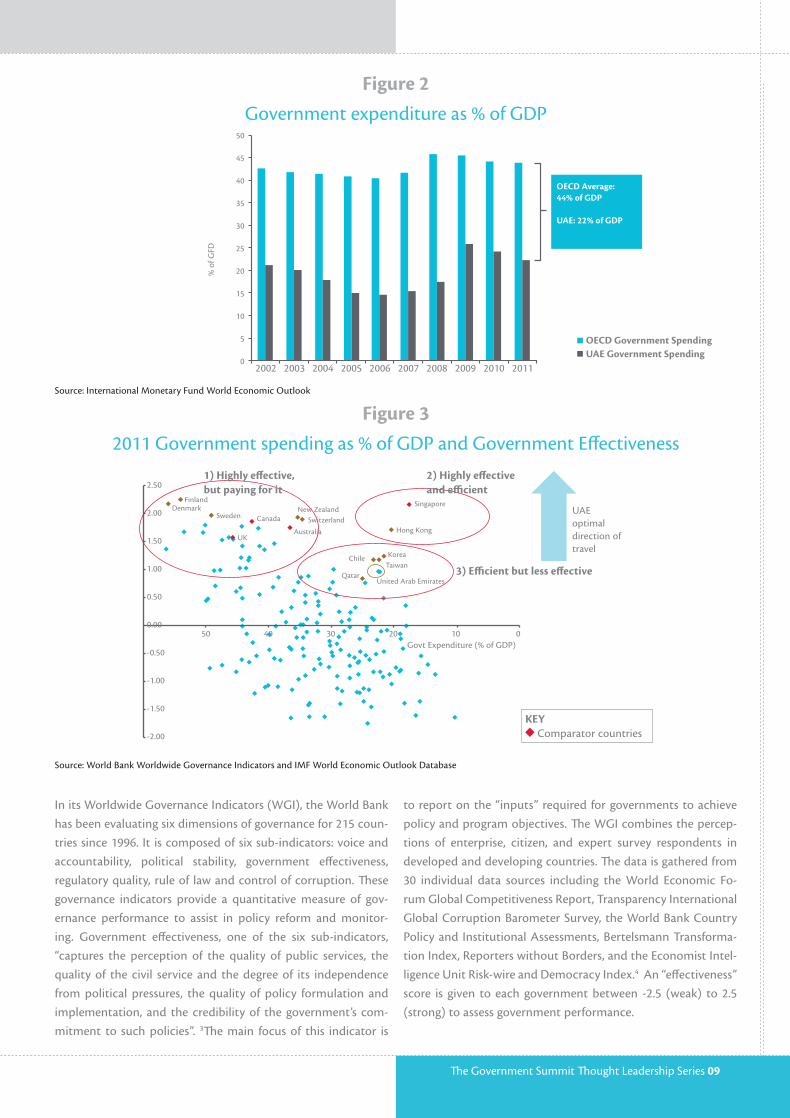
In its Worldwide Governance Indicators (WGI), the World Bank has been evaluating six dimensions of governance for 215 coun-tries since 1996. It is composed of six sub-indicators: voice and accountability, political stability, government effectiveness, regulatory quality, rule of law and control of corruption. These governance indicators provide a quantitative measure of gov-ernance performance to assist in policy reform and monitor-ing. Government effectiveness, one of the six sub-indicators, “captures the perception of the quality of public services, the quality of the civil service and the degree of its independence from political pressures, the quality of policy formulation and implementation, and the credibility of the government’s com-mitment to such policies”. 3The main focus of this indicator is
to report on the “inputs” required for governments to achieve policy and program objectives. The WGI combines the percep-tions of enterprise, citizen, and expert survey respondents in developed and developing countries. The data is gathered from 30 individual data sources including the World Economic Fo-rum Global Competitiveness Report, Transparency International Global Corruption Barometer Survey, the World Bank Country Policy and Institutional Assessments, Bertelsmann Transforma-tion Index, Reporters without Borders, and the Economist Intel-ligence Unit Risk-wire and Democracy Index.4 An “effectiveness” score is given to each government between -2.5 (weak) to 2.5 (strong) to assess government performance.
Figure 2Government expenditure as % of GDP
Source: International Monetary Fund World Economic Outlook
UAE Government SpendingOECD Government Spending
20020
5
10
15
20
25
% o
f GFD
30
35
40
45
50
2003 2004 2005 2006 2007 2008 2009 2010 2011
OECD Average:44% of GDP
UAE: 22% of GDP
Figure 32011 Government spending as % of GDP and Government Effectiveness
Source: World Bank Worldwide Governance Indicators and IMF World Economic Outlook Database
2.50
2.00
1.50
1.00
0.50
0.00
-0.50
-1.00
-1.50
-2.00
50 40 30 20 10Govt Expenditure (% of GDP)
0
United Arab EmiratesQatar
ChileTaiwanKorea
Singapore
Hong Kong
New ZealandSwitzerlandSweden
FinlandDenmark
Australia
Canada
UK
1) Highly effective, but paying for it
2) Highly effective and efficient
3) Efficient but less effective
UAE optimal direction of travel
KEY Comparator countries
The Government Summit Thought Leadership Series 09

The Public Sector’s Commitment and Experience with Efficiency Programs
Governments around the world are continually searching for ways to deliver services that reduce cost and improve quality. Public expenditure is subject to scrutiny from audit bodies, central agencies, expenditure review programs, political deci-sion makers, media, think tanks, academia, and even “arm-chair auditors” through transparency initiatives. Some governments have set up efficiency and reform units to drive efficiency sav-ings from the center of government while others have under-taken large scale spending review programs. It is therefore unsurprising that efficiency is increasingly identified as a core public service value alongside more traditional values such as impartiality and legality (see figure 4 below).
In a recent study, the International Monetary Fund has identified 71 cases of consolidation programs in the last 30 years aimed at reducing budgets by more than 5 percent of GDP.5 These cases include both high income and emerging economies and cover a variety of different political systems. The message from these episodes is that large scale fiscal consolidations are pain-ful. Public servants who have looked back on these processes have explained that they are extremely challenging and point to the difficulty of innovating while under extreme cost pressure. As such, it is considered good practice for governments to be proactive and improve the efficiency of operations during less constrained times.
Figure 4Frequently stated core public service values (OECD) (2000 and 2009)
% of countries indicating a core value
0%
Professionalism
Efficiency
Integrity/Honesty
Transparency
Legality
Impartiality
% change
14%
17%
41%
24%
24%
34%
10% 20% 30% 40% 50% 60% 70% 80% 90% 100%
20092000
Source: OECD Government at a Glance, 2009
10 The Government Summit Thought Leadership Series
The State of Government Efficiency
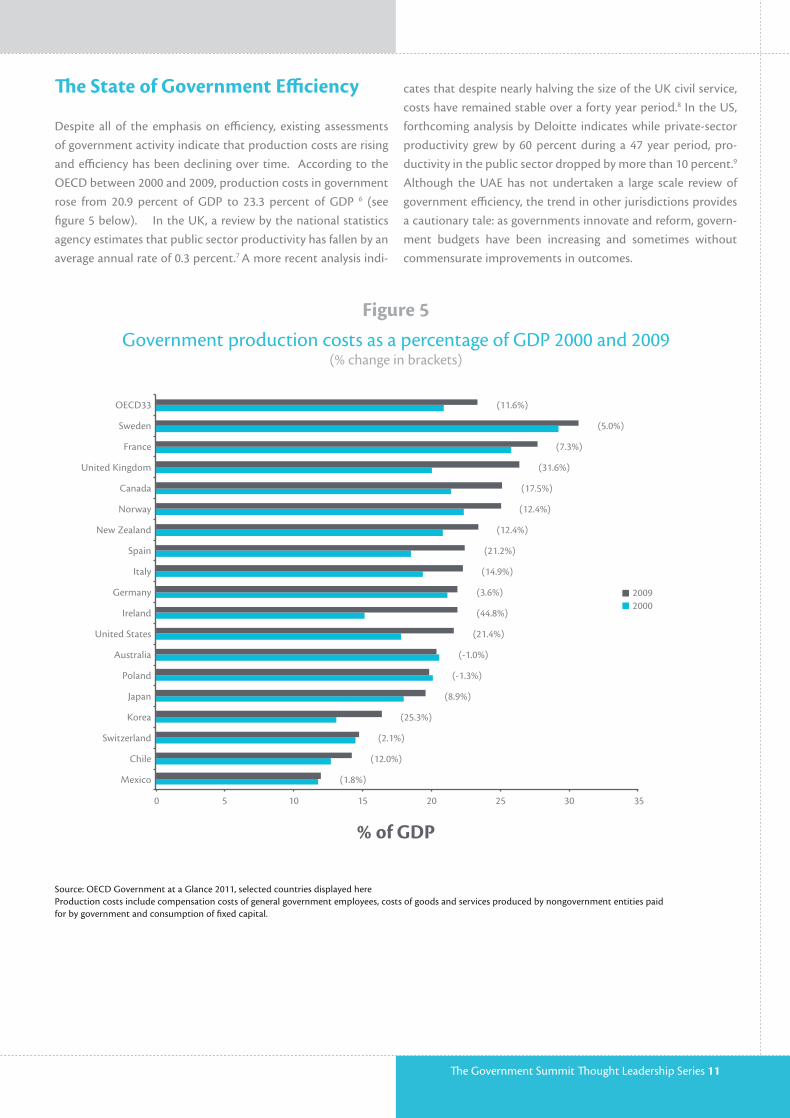
Despite all of the emphasis on efficiency, existing assessments of government activity indicate that production costs are rising and efficiency has been declining over time. According to the OECD between 2000 and 2009, production costs in government rose from 20.9 percent of GDP to 23.3 percent of GDP 6 (see figure 5 below). In the UK, a review by the national statistics agency estimates that public sector productivity has fallen by an average annual rate of 0.3 percent.7 A more recent analysis indi-
cates that despite nearly halving the size of the UK civil service, costs have remained stable over a forty year period.8 In the US, forthcoming analysis by Deloitte indicates while private-sector productivity grew by 60 percent during a 47 year period, pro-ductivity in the public sector dropped by more than 10 percent.9 Although the UAE has not undertaken a large scale review of government efficiency, the trend in other jurisdictions provides a cautionary tale: as governments innovate and reform, govern-ment budgets have been increasing and sometimes without commensurate improvements in outcomes.
Figure 5Government production costs as a percentage of GDP 2000 and 2009
(% change in brackets)
% of GDP
20092000
0 5 10 15 20 25 30 35
OECD33
Sweden
France
United Kingdom
Canada
Norway
New Zealand
Spain
Italy
Germany
Ireland
United States
Australia
Poland
Japan
Korea
Switzerland
Chile
Mexico
(11.6%)
(5.0%)
(7.3%)
(31.6%)
(17.5%)
(12.4%)
(12.4%)
(21.2%)
(14.9%)
(3.6%)
(44.8%)
(21.4%)
(-1.0%)
(-1.3%)
(8.9%)
(25.3%)
(2.1%)
(12.0%)
(1.8%)
Source: OECD Government at a Glance 2011, selected countries displayed hereProduction costs include compensation costs of general government employees, costs of goods and services produced by nongovernment entities paid for by government and consumption of fixed capital.
The Government Summit Thought Leadership Series 11

The Characteristics of Inefficiency
Recent efficiency reviews in Australia10 , Canada11 and the UK12 point to significant opportunities for efficiency gains in govern-ment. One example is the wide variation in prices for common goods and services purchased by the UK Government. The UK’s Green Review found that a box of paper ranged from a high of £73 to a low of £8 while printer cartridges ranged in price from £398 to £86.13 Higher than necessary costs had been incurred as a result of a failure to obtain a more standardized approach to purchasing and contracting. An absence of an integrated approach to both front office and back office services also cre-ates costly overlap and duplication across government. Multiple points of entry and overlapping services lead to administrative redundancies and critical information not being shared between agencies.
Recent efficiency advisory experience suggests a number of inef-ficient practices commonplace in government:
• Seniormanagers are sometimes responsible for tasks thatcould be handled by more junior personnel
• Managers have narrow spans of control or 1:1 reportingrelationships
• Therearealargenumberofreportinglayers
• Managershaveoverlappingresponsibilities
• Personnel are engaging in unnecessary or inefficient plan-ning activities
• Fragmenteddeliverymodelsexistcausingredundancyacrossdepartments
• Inefficient and overly complex business processes that donot add value
• OverlycomplexbusinessapplicationsandITinfrastructure
• Activitiesdeliveredin-housethatwouldbelesscostlyand/or more effective if outsourced
• Redundantfacilities/offices(acrossgeographiesanddepart-ments)
• Manualprocessesthatcouldbeautomated
A more comprehensive list of inefficient practices is listed in Annex.
While this state of affairs can not only crowd out efficient prac-tices, it can also undermine the efficacy of the public service. The next section presents a four step model for systematically improving the efficiency of government.
12 The Government Summit Thought Leadership Series

Four Key Drivers of Government Efficiency Efficiency reviews are not just about cost reduction. They also represent an opportunity to examine programs and services to ensure they meet government objectives, become more effec-tive and deliver higher quality service. In some cases like the UAE Unique Identity Authority, investment is required to de-liver efficiency savings over time. In other cases, cost reduction programs that involve adjustments of mandate and scope can deliver rapid efficiency gains. For example, some governments have reduced the breadth and depth of coverage for social enti-tlement programs. Efficiency can go hand in hand with greater citizen satisfaction while at other times there is a tradeoff be-tween cost and quality. With different paths to efficiency, there are four key drivers to systematic efficiency in government:
• Innovate: There needs to be a constant process of innova-tion. Leading practices need to be identified, adapted and implemented.
• Scale: There needs to be an ability to mandate or provide clear direction for scaling up innovations. Without a govern-ance structure that is responsive to innovative and leading practices, good ideas fail to make an impact.
• Measure: There needs to be a clear focus on measurement and analysis. Without an analytical capability, inefficient practices tend to persist and efficient practices are less likely to be scaled appropriately.
• Incent: Governments need tighter sanctions and clearer in-centives to drive efficiency at the highest levels.
This model can be applied both to programs introduced as well as to the government as a whole. For example, stronger incen-tives should apply to specific initiatives as well as to leaders re-sponsible for ensuring value for money in government.
The Government Summit Thought Leadership Series 13

Innovate
In order to improve efficiency in government a process of inno-vation is critical. As productivity does not rise at the same rate in all areas of the public sector it is important to recognize that the characteristics of different functions means that each will be different in terms of extracting efficiency gains. For example, functions that can be automated and outsourced may be more likely to generate efficiency gains than those that are necessarily labor intensive. Innovation is enabled by a combination of tech-nology, process and operations as well as a better evidence base and effective process of risk management. Yet, there are differ-ent categories of innovation. Incremental innovation involves implementing changes to existing practices and includes the adoption of leading practices in government. Innovation can be of the “disruptive” variety when it provides a way to make public programs radically cheaper without slashing services. While this type of innovation has historically been less commonplace in government it should be introduced to form part of an overall innovation program.
To drive and sustain innovation, a culture of measured risk-tak-ing is critical. One interviewee likened the role of a government official to a business person constantly seeking to increase (pub-lic) value. In the same way that the private sector focuses on the bottom line, more entrepreneurialism is required to drive government forward. The interviewee pointed to the role that Research and Development plays in a private sector organiza-tion and argued that more sustained research and analysis in government could help to build better government services.
We have reviewed dozens of leading practices that governments are pursuing in the UAE, Australia, Canada, the UK and Singa-pore. We list several of the most promising innovations that address key issues in government efficiency such as fragmenta-tion of delivery, overlapping responsibilities, and duplication and multiple points of entry for citizen services. The paper also describes the more radical approach of disruptive innovation to break the tradeoff between performance and cost.
Citizen Service Delivery
Many governments around the world are actively assessing their capabilities for delivery of citizen and business services across channels and many have launched major service transformation efforts. Citizens are increasingly looking for simple, timely, se-cure, and self-service ways to interact with government across internet, phone and in-person channels. Governments are striv-ing to lower the costs of service delivery and seeking better ways to interact with citizens and businesses. To address these trends, government service delivery organizations around the world are
aiming to become more efficient while improving service effec-tiveness.
Examples of recent public sector initiatives include:
• Proactivelymigratingserviceinteractionswithbothcitizensand businesses to single point of entry service centers, call centers and lower cost internet channels.
• Taking more of an enterprise-wide approach to servicedelivery by building a new cross-department organization with accountability and governance for service delivery.
• Driving common identity management initiatives acrosslevels of government, including collaboration with private sector leaders such as financial institutions.
• Taking advantage of rapidly evolving technologies (indeveloping countries in particular) to consider a direct move to internet-based service rather than building legacy channels such as in-person or call center.
• Workingwithabroadsetofthirdpartiestoconsidernewandinnovative means of service delivery including outsourcing and various public-private partnerships.
• Exploring new channels of service delivery such asmobile service and social media for proactive two way communication.
With this clear trend to “multi-channel access and service de-livery,” several interviewees pointed to the role that technology can play and in particular, automating self-service. For common service transactions cost estimates vary widely depending on the channel used. Deloitte experience suggests that in a country like Canada, costs for in person transactions are approximately $25 per transaction, live voice phone calls are $10, automatic phone calls are $5 and web based self-service is $0.25. In other words, an in person transaction is regularly seen to be up to 100 times more costly than a web based self-service transaction. For high volume transactions such as registrations, certificates and licenses innovation in automation can provide very significant efficiency savings.
International reviews of the cost of service delivery also point to the very significant savings that can be achieved through chan-nel shifting. A recent Deloitte review of transaction costs re-ported in a local council in England, civil service department in Northern Ireland and US state government indicate that the cost of online transactions can range between two and ten percent of the cost of an in-person transaction. In a recently released
14 The Government Summit Thought Leadership Series

report on digital efficiency, the UK Cabinet Office found that the government could save at least £1.7bn per year by shifting the transactional services currently offered by central government departments from offline to digital channels.14 These savings would be generated through reductions in staff, property, ma-terials and office equipment costs. In addition, the report found that if half an hour were saved by digitizing every transaction currently completed offline the overall savings to the economy could be up to £1.8 billion.
In the 2012 United Nations E-Government Index, the UAE im-proved its overall position from 49th in 2010 to 28th, to become ranked first amongst Arab countries, second amongst peers in Western Asia, and fifth in Asia.15 The UAE’s position in the e-service index moved from 99th to 7th and in the e-participa-tion index, its position improved from 86th to 6th.16 This was achieved by conducting an in-depth review of whole of govern-ment service delivery to provide a more detailed understand-ing of the factors for improvement in e-government and incor-porating a strategic plan into the “UAE Vision for 2021”. The government conducted a review of best practices, introduced a program to standardize websites and improved its capability for online transactions. The UN lists the UAE as one of the few countries in the world that comes closest to a “one-stop shop” of government information and offerings. A “platform” approach is used to provide an interface with common tools and function-alities for local service delivery actors that can be customized to meet the needs of their clients. Additionally, the government has incorporated instant messaging, audio-overlay for the hear-ing impaired, multi-channel service delivery, and adjusts service
offerings and delivery methods based on citizen feedback in a citizen-centered approach to e-government services. Based on its rapid progress in developing e-government solutions, the UN named the UAE as a global “new leader”. Below are several lead-ing practices in service delivery being adopted by governments in the UAE, Australia, Canada and Singapore.
UAE Unique Identity ProgramThe UAE has implemented a number of leading practices designed to radically improve the ef-ficiency of government through better service
delivery. The UAE National Identity Program aims to improve identification and authentication mechanisms to provide bet-ter service to citizens as well as reduce crime, eliminate identity theft, control immigration and reduce benefit fraud. The center-piece of the project is an integrated population register that will become the central reference point for the whole of government population identification and service delivery. The demographic information in the register will support strategic decision mak-ing on resource allocation and long term planning. By having a clear idea of how local population needs change over time the data will inform requirements for building schools, hospitals and infrastructure. The rapid identity verification has enabled the government to reduce the time it takes to verify identity in court services from 7 minutes down to 7 seconds – a reduction of 600 percent. In high volume services, the time savings can translate into major efficiency gains by radically lowering labor costs. To date, the government has enrolled 98 percent of the population and projects the entire population to be enrolled by the end of the year. As part of this process, the agency respon-
The Government Summit Thought Leadership Series 15

sible for this program will interact with fifteen other agencies as well as the ministries of education, labor, justice and health.
Canada’s Integrated Case Management Across the OECD, social services account for roughly $1 in every $4 of government spend-ing.17 In the Canadian province of British Colum-
bia (BC) over $3.8 billion a year is spent on key social programs such as employment benefits and childcare subsidies in the min-istries of Children and Family Development and Social Develop-ment.18 Yet, these services are often delivered in a fragmented way that impedes information sharing on at-risk clients and is not organized around client needs. In addition, determining ser-vice eligibility involves complex calculations based on frequently evolving legislation and government policy. To resolve some of these challenges, the BC government is reforming the delivery of key social services by using innovative technology in a program known as Integrated Case Management (ICM). The ICM system will replace 50 outdated, fragmented, and inflexible computer systems that deliver services in 20 programs across two minis-tries.19 The technology allows real time calculation of benefits and provides greater visibility of client interactions. This initia-tive also has a “no-wrong-door” approach to delivery through the use of online self-service, call center or cross-program service centers to increase convenience and availability. This program will reduce technology costs and enhance service delivery while improving the quality and timeliness of the customer experience to over 200,000 social service clients each year.20
Singapore’s Public Sector InfrastructureInternet is universally available in Singapore with a connectivity rate of 99 percent of the total population.21 This creates a significant po-
tential for the government to utilize online channels to increase efficiency of service delivery via its Public Service Infrastructure (PSi) program. PSI is a complete end-to-end platform for govern-ment agencies to develop, initiate and operate e-services as a part of their online e-Government programs. PSi has been creat-ed using “build-once, reuse-always” features such as securely col-lecting payment, customer authentication, and data exchange across government departments and agencies. As PSi is a cen-tralized program that is utilized across departments and agen-cies, the Singapore Government is able to leverage economies of scale because individual ‘end-user’ departments do not need to develop their own, incompatible e-service infrastructure. Unique development, testing, quality assurance, and produc-tion environments have been developed to ensure excellence in quality and operations of this e-service delivery program.22 The PSi initiative won the Intelligent 20 Award, the Explorer Award at E-GOV 2002, and the CIO Award in 2001 for its innovation in efficient online government service delivery.23
Australia’s EZyRegEighty-nine percent of Australians own a mobile phone, with the market dominated by internet-enabled devices.24 When internet was an option,
47 percent of Australians used it in their most recent contact with the government.25 Additionally, 46 percent of Australians stated that they prefer the internet over other forms of contact with the government such as telephone or in person.26 To re-spond to this trend, Service South Australia developed EZyReg, a mobile application that provides easy access to regularly used vehicle registration services through purpose-built mobile tech-nology. EZyReg increases the availability of government and in-formation services in South Australia using a delivery method that is preferred by citizens. This online service was able to re-duce the cost of high-volume services such as renewal of vehi-cle registration by enabling real time, and secure online credit card payments.27 In addition, EZyReg is designed to have a us-er-friendly interface that is easy to navigate and offers features such as an interactive list of payment history, tools for setting reminders, and barcode scanning which enables the mobile de-vice’s camera to scan registration notices.28 This mobile applica-tion drives government service delivery innovation to align with current technological capability and customer preference.
Shared Services
Government administrative and support processes are often fragmented across multiple agencies. The resulting lack of standardized processing and duplication of effort cause inef-ficiencies that ultimately drive up administrative expenditure. Shared services focus on delivering non-core processes through a central entity that interacts with each division or agency. The UAE Telecommunications Regulator Authority has introduced shared services for IT colocation, e-hosting, infrastructure and hardware and software. IT services include email, intranet and a corporate portal. While a chargeback model is not currently in place, it has undertaken a benchmarking study to identify best practices.
Alberta Canada’s Shared ServicesThe Canadian provincial Government of Alberta spends around $96 million on information com-munications technology (ICT) each year.29 A re-
cent review found wide divergence in the costs of common high volume services across the government. The variance in cost resulted from significant duplication in service provision among the more than 30,000 employees across eighteen semi-auton-omous departments.30 ICT support infrastructure consisted of 22 service providers, 17 service desks, 3 mainframe providers, and 10 desktop support services.31 To reduce this duplication and increase economies of scale, the Service Coordination Initia-
16 The Government Summit Thought Leadership Series

tive, an innovative ICT Shared Services project, was developed to design and advise on effective organization and structural pro-curement. The project made key changes to the delivery of ICT services through an enterprise model of service delivery. These changes included introducing a reformed governing body with clear standards, common tools and processes across ministries, service level management, and increased competition of service providers by pooling corporate core funding for ICT infrastruc-ture.32 The Service Coordination Initiative was expected to have an average cost savings of $23.5 million per year. This project received the Alberta “Premier Award of Excellence” in 2008 and 2010 in recognition of the project’s excellence in execution and positive impact on Albertans.
British Columbia Canada’s HealthShared Services The Provincial Health Services Authority of Brit-ish Columbia had been trying to limit the rising
cost of care for years.33 Their efforts yielded little impact until the launch of Health Shared Services BC (HSSBC) in 2008—a shared services model that delivers non-clinical operations across the entirety of BC’s six health authorities (HAs). Moving to this model, however, proved challenging: health authorities had to hand over control of operations equal to $1.9 billion in spending annually to an outside organization. To build confi-dence in the initiative, HSSBC initially focused on supply chain management, with the HAs combining purchasing power to ne-gotiate lower costs. HSSBC used this phase to establish a repli-cable model, employing a rigorous, multi-phased process. Steps included building a business case that clearly demonstrated sav-ings, meeting with HA leaders to create a clear scope of work, and publishing a regular newsletter to keep employees apprised of progress. The HSSBC also created several entities that allowed leaders to collaborate, including a management board, with rep-resentation from all HAs; provincial and pan-Canadian alliances; and roundtable meetings that included vendors.The results that HSSBC achieved in the supply chain phase were significant. By February 2012, they had realized more than $200 million in projected savings. The HSSBC’s central governance structure also enables the HAs to rapidly respond to crises, as it did with a recent drug shortage. Based on this success, the shared services model has now been extended to include tech-nology, payroll, accounts receivables, and employee records and benefits.
Singapore’s Shared ServicesIn an effort to bring down costs, achieve greater efficiency for customers, and deliver better ser-vices, the Singapore government established
Vital, its cross-government center for shared services. Vital was designed to take core processes that were spread out across
the government and pool them to leverage economies of scale via automation, technology solutions, and targeted consulting. The new center is staffed by relocated employees from various departments with related skills and worked to become a cohe-sive workplace with one culture through strong leadership and communication. The center garnered 15 percent in whole-of-government net savings in its first five years, mostly through process standardization, systems automation, and moving to an employee self-service framework. With a staff of 480, Vital now serves over 80,000 people across more than 100 agencies and departments, offering assistance in such areas as credit man-agement, finance, human resources, learning and development, payroll and claims, and travel management. Most recently, its travel management efforts have saved US$40 million dollars by negotiating corporate rates and collecting and analyzing travel data to identify cost-savings opportunities. 34
Consolidated Procurement
Procurement by public sector organizations in the OECD aver-ages 17 percent of GDP.35 Numerous reviews of government ef-ficiency point to the huge opportunity governments have to leverage their size, scale and credit rating to achieve efficiency gains.
Singapore’s GeBiZThe Singapore Government spends more than $1 billion annually on Information Technol-ogy alone, awarding contracts to both local
and multinational companies. To improve efficiency, standard-ize processes, and increase transparency in the procurement process, the Government of Singapore introduced GeBiZ, an online “one-stop” government procurement portal. All pub-lic sector invitations for quotations and tenders are posted on GeBiZ. Suppliers can search for government procurement op-portunities, download tender documents, and submit their bids online. GeBiZ also allows businesses to apply to become a government trading partner, search for procurement oppor-tunities from other governments, and sign up to be listed on the site’s government-registered supplier list. The site supports a number of procurement methods, including small-value pur-chases (up to S$3,000), quotations (up to S$70, 000) and tenders (over S$70,000). The site also serves as an intranet (GeBiZ Enter-prise) for government agencies and departments to use for all their procurement and supplier needs.36 Government agencies are mandated to post all procurement opportunities via GeBiZ and use the site to browse for government-registered suppliers.37 Additionally, GeBiZ has been interfaced with the government’s financial systems38 and supports all financial interactions across the procurement chain, including both electronic invoicing and payment.39 It is also continually updated to reflect changes to
The Government Summit Thought Leadership Series 17
Singapore’s procurement regime,40 such as the recent relaxation of procurement requirements to encourage greater government procurement participation overall and by new businesses in par-ticular. The site now has more than 12,000 government users and almost 15,000 GeBiZ supplier accounts.41 The system has real-ized upwards of 20 percent in procurement value depending on the category due better procurement visibility and control and increased market competition.42 And by aggregating demand across 18 procurement categories via the bulk ordering GeBiZ enables, a total annual savings of S$15 million for the public sec-tor was achieved in 2004.43 The system has also reduced staffing requirements for supply heads by more than 30 percent.44
Lean Continuous Improvement Methodology
Lean is the continuous pursuit of improvement with the objec-tive of ensuring that processes create value from the perspective of the customer. It involves reducing the number of resources that do not add value from a customer perspective and is widely used in healthcare settings to improve value to patients.
Saskatchewan Ministry of Health’s LeanApproach to Putting Patients FirstLooking to combat spiraling costs and improve customer service, the Saskatchewan Ministry
of Health and health care system embarked on a full-scale im-plementation of Lean principles in 2008.45 Lean is an enterprise-wide approach to create value from the perspective of the cus-tomer (or patient) via the continuous pursuit of improvement. An ambitious initiative, the process involved developing value streams, that is, a complete mapping of all end-to-end processes that support the range of services the Ministry and the health care system provide. These streams helped identify all value-add and non-value-add activities, allowing the Ministry to pinpoint and eliminate waste. Systems measurements to ensure account-ability were also put in place and leadership roles were redefined in line with Lean principles. The Ministry then worked to em-power employees to take ownership of Lean and apply it to their everyday activities by establishing a variety of Lean teams. These teams were encouraged to find ways to innovate and improve processes to best serve the patient. The implementation produced some significant results across the healthcare system, including:
• Reduceddiscardrateforunitsofredbloodcells,a$10mil-lion annual savings
• An81percentimprovementinaverageprocessingtimeforpayment
• Bettervaccinemanagement,withanannualsavingofmorethan $1 million
• Improved inventorymanagement, yielding a $500,000 peryear savings
Lean is now being expanded to capital projects, with improve-ments built into the design of new hospitals. A Lean manage-ment system is also now in development that will integrate the principles into the Ministry and healthcare system’s manage-ment approach.
Human Capital
According to the OECD, on average compensation costs ac-count for about half of the cost of producing public goods and services and government employees represent about 15 percent of the total labor force in these countries.46 As such, HR initia-tives designed to attract, develop and motivate better human resources is critical.
As the OECD points out, “…human resource management prac-tices matter a great deal. The soft aspects of human resource management such as employee satisfaction and morale are the most important drivers of performance. While wages are still important for staff, non-monetary incentives, such as recogni-tion, interesting work and autonomy are essential…where there are skill-shortages, wages are especially important for attract-ing and retaining qualified staff”.47 By strengthening the profes-sionalism and skill sets of public servants, governments are able improve the quality and efficiency of programs.
UAE Human Capital ProgramsThe UAE Government has a comprehensive training and development system. The system has set out clear roles and responsibilities for the
Federal Authority for Government Human Resources, HR de-partments within organizations, leaders, line managers and em-ployees. Core and leadership competency skills are well defined and a robust performance management system is in place. Core skills include strategic, people, financial, operational and pro-gram, knowledge and communication management. The train-ing and development system has a clear framework for defining organizational and individual development needs and activities. The Government Leadership Programme aims to develop a pool of talent for the UAE Government from which future visionary government leaders who have the required ability, knowledge, skills and experience can be drawn. The customized program has a stream for each of three levels of leadership: Directors General and CEOs; Executive Director / Department Director; and Sec-
18 The Government Summit Thought Leadership Series

tion Managers. The program involves a combination of train-ing courses, seminars and workshops, case study scenarios, study visits, networking events, mentoring/coaching, personal devel-opment planning, public sector expert speakers, job develop-ment assignments and online development.
Singapore High Potential Programme and Administrative Service SchemesThe Singapore Government Public Service High Potential (HiPo) Programme is designed to iden-
tify, develop, and recognize promising employees with the po-tential to assume leadership positions. Ministries identify and assess nominees, who typically need to have at least two years of service for the program based on stringent selection criteria. The Administrative Service Programme (Admin Service) is a group of selected high potential talent who are funded to attend Ivy League universities and supported throughout their career. This group is expected to take up senior leadership positions such as the CEO of a statutory board or a deputy secretary or perma-nent secretary of a department. A recently graduated scholar typically works for about five years prior to admission into the Admin Service based on their performance.
Canada’s Recruitment of Policy LeadersAs part of its talent development strategy, the Canadian Federal Government has focused on attracting and building future leaders through
a program called the Recruitment of Policy Leaders (RPL). The program targets and recruits exceptional candidates to serve in mid to senior-level policy positions with the public service. No-table for the fact that it is explicitly not recruiting for entry-level positions, the program is designed to attract top-level profes-sionals and graduates from an array of disciplines, seeking to develop leaders that can help shape Canada’s public policy land-scape. The program receives more than 1,200 applications each year with only 40 to 50 candidates selected via a rigorous multi-stage process aimed at identifying applicants ready to take on significant responsibilities. The program ensures a good match between candidates and managers by personalizing the recruit-ment process, including pairing each candidate with an experi-enced previous RPL recruit. In a report evaluating the program in 2008, it was found that most “senior government managers and policy groups within the federal departments and agencies believe that the RPL Program is a very successful mechanism for recruiting highly-qualified policy specialists.” The report also noted that the program was an effective recruiting tool, with half of all RPL recruits stating they would not have applied to the public service without the program. The program is also effec-tive at integrating recruits into the public service, with 93 per-cent of recruits stating they were able to fit in well with policy
colleagues and 83 percent of departmental liaisons agreeing that recruits have quickly integrated with other staff members. 48
UK Fast Streamers ProgrammeLike Canada’s RPL, the UK’s Fast Streamers pro-gram focuses on building future leaders. Fast Stream offers participants an opportunity to
impact policy-making via rotating long-term assignments in a variety of government agencies. The program offers a combina-tion of formal training courses and on-the-job learning as well as regular feedback, performance reviews, and mentorship to support participants. Although the application process is exten-sive—using a combination of assessment tests and interviews—the program is popular due to its management-track potential and challenging work. Positions are highly sought after, with 22,000 applicants for 400 to 500 places in 2010. Fast Stream has been recognized for its Summer Diversity Internship program, winning the “Best Diversity” Award in the National Placement & Internship Awards in 2012 and is regularly ranked in the top ten of the “Times Top 100 Graduate Employers.”
Performance Management
Several governments have adopted initiatives aimed to assess and improve the capability of organizational performance. These programs are typically managed by a central agency and are used to improve the efficiency and effectiveness of govern-ment.
UAE’s Sheikh Khalifa GovernmentExcellence ProgramThe Sheikh Khalifa Government Excellence Pro-gram is an adaptation of the European Founda-
tion for Quality Management model, customized for the public sector. This Excellence Program is led by the Prime Minister’s Office and applies to all Federal Ministries and entities which are fully funded by the Ministry of Finance. The four pillars of this program are:
• InstillingacultureofExcellenceingovernment–particularlyamong the leadership
• Sharingbestpracticesbetweenthedifferentgovernmenten-tities
• Developing competencies among Excellence practitioners,and
• Measuring improvements achievedbygovernmentorgani-zations
The Government Summit Thought Leadership Series 19

The PMO collects data every two years on a set of enablers for good performance as well as a set of results based on key perfor-mance indicators. Enablers include leadership, strategy, people, partnerships and resources, processes, products and services. Results are focused on several areas including customer, people, society and key performance. The results are reported directly to the Prime Minister and the best performers are awarded the Sheikh Khalifa Excellence Award across twenty-three categories including e-government, knowledge management and innova-tion. The PMO is able to encourage knowledge sharing of lead-ing practices from the high to low performers. Key character-istics of the highest performers include a strong commitment to leadership and performance oriented organizational culture.
UAE’s Star Rating SystemThe Star Rating System supports the vision of the “Emirates Government Service Excellence Program” – an initiative within the UAE cabinet
which aims to enhance the federal government’s service delivery. The program covers all federal services delivery centers across the UAE, and applies to transactional and informational servic-es. The star rating system evaluates the customer service centers on eight dimensions including strategic integration, customers, services, delivery channels, customer experience, efficiency and innovation, human resources, and information technology.
The evaluation provides detailed feedback on the maturity of the center and the degree of its compliance with required ser-vice standards. The system awards a number of stars (similar to the star rating system used by hotels), based on the overall score it achieves. A score of 80% is required to obtain the full five stars. Federal service delivery centers are assessed under the Star Rating System’s criteria once every three years. After the assessment, the center is provided with a formal certificate, score achieved, and a report describing the assessment results.
In addition, centers are assessed regularly using methods such as the mystery shopper and customer services studies. If a center’s performance deviates significantly from the most recent assess-ment, the center is reviewed and its score could be changed if required.
Canada’s Management AccountabilityFramework The Management Accountability Framework (MAF) is a performance management tool that
the Canadian federal government uses to support the account-ability of deputy heads and improve management practices across departments and agencies.49 The Treasury Board Secretar-iat (TBS) leads the process to assess departmental performance in several areas of management including results, governance and planning, citizen focused service, financial management, procurement, information technology and asset management. Several previous rounds of assessments have been published on the department’s website (although some sensitive information has been removed in accordance with privacy and access to in-formation rules). According to the TBS, there are several factors that influence the improvement of management practices in-cluding departmental leadership, the exchange of best practices through workshops and events, and the recognition that pro-gress takes time and sustained focus.
Disruptive Innovation
The examples put forward in the sections above represent lead-ing and innovative practices being introduced around the world to drive enhanced efficiency in government. However, typical efficiency measures and cost reduction exercises often involve a difficult trade-off between price and performance. Overcom-ing this trade-off will require leaders to look at the public sec-tor in entirely new ways. In a recent research study50, Deloitte’s GovLab identifies that the key to radically reducing costs, while maintaining or enhancing services, is disruptive innovation.
Creating the conditions for disruptive innovation requires poli-cymakers and administrators to view government through a dif-ferent lens. Instead of seeing endless programs and bureaucra-cies, the myriad responsibilities and customers of government can be seen as a series of markets that can be shaped in ways to find and cultivate very different and ultimately more effective, less expensive ways of supplying public services.
Examples of disruptive innovation in government can be seen in a number of key policy areas including:
• Criminal justice: Electronic monitoring of low-level offend-ers enables government to dramatically reduce their spend-
20 The Government Summit Thought Leadership Series

ing on incarceration ($5-25 per day compared to $80 for prison).
• Defense: Unmanned Aerial Vehicles (UAVs) cost significant-ly less than manned aircraft and satellites, and can provide several key performance capabilities that exceed even those of manned aircraft.
• Education: Online learning, or a blended learning environ-ment of digital learning and traditional instruction, can break the trade-off between standardized teaching and the more personalized instruction a student might receive from a tutor or at an elite prep school. Online learning can also al-low for more customizable and affordable content for higher education programs.
Deloitte’s GovLab has researched numerous examples of oppor-tunities to implement disruptive innovation and has developed a framework to introduce it in the public sector—proposing an alternative path to significantly reduce costs without sacrificing the quality of services. This framework includes:
• Focus: Government can identify disruptive opportunities by focusing on three issues:
•Whatisthejobtobedone? •Whatarethecurrenttrade-offs? •Howcanthesetrade-offsbebroken?
• Shape: The best place to start a disruptive innovation tends to be in a market segment either overserved or not served at all by the current, dominant model of delivery. Success also typically requires the disruptor to have autonomy from the parent organization, as well as from the incumbents who dominate the market.
• Grow: Government has an array of tools and channels that can be used to foster and nurture the growth of disruptive technologies. These include legislation, budget maneuvers and other special funding tools.
Scale
Once effective innovations and leading practices are identified, they need to be adopted across government as building scale behind good ideas will drive the majority of benefits. Scaling also includes ramping down or eliminating programs and ser-vices that are not effective. The use of ‘sunset’ clauses in which programs, agencies, regulations or other initiatives expire auto-matically unless action is taken to renew them is increasing in popularity as countries seek to enhance competitiveness, free up
resources used to comply with burdensome regulation, and trim bureaucracy. The capability and flexibility to rapidly scale up ef-ficient practices and eliminate inefficient practices is critical for achieving sustainable benefits.
Strategic initiatives are often undermined by an inability to scale due to unresponsive organizational systems. What might make sense for government as a whole often inflicts costs on individual departments that deputy heads (as accounting offic-ers) are unwilling to bear. Although this problem is not unique to government, where ministries have vertical accountability models this tends to act against the economies of scale that can be generated through an enterprise service delivery model. A stronger approach to management involves mandating the use of standardized methods and providing clear direction across government. As one interviewee pointed out “there is a need to look beyond departmental borders.”
Some of the most effective initiatives designed to improve ef-ficiency involve strong authorities and clear accountabilities. Several prominent examples of clarity of direction in govern-ment occur when a crisis point has been reached and depart-ments need to execute large scale fiscal consolidations. Canada’s Program Review in which the government achieved a 10 per-cent reduction in federal government program spending and a reduction in the size of the public service by over 55,000 em-ployees was partly attributed to the government’s clear com-mitment to eliminate the deficit.51 A more recent expenditure review exercise in Canada was enabled by the leadership of a cabinet committee tasked with overseeing a program to identify 5 to10 percent of cuts in government program spending across 67 departments and agencies. The Prime Minister of Canada es-tablished the Strategic and Operating Review Committee led by a senior cabinet minister to assess cost reduction proposals put forward by ministers and their departments. In the end, reduc-tions in spending amounted to $5.2 billion or 7 percent of the total amount reviewed.
A common starting point to understand whether greater man-dating will result in higher efficiency gains is through the meas-urement of activities using established approaches such as frag-mentation or activity analysis, described in more detail in the next section.
The key is to obtain an effective balance between a highly de-centralized model that produces higher costs and a central-ized model that is more cost efficient but unresponsive to lo-cal needs. A governance approach that balances both of these requirements is necessary to achieve efficiency in government. It involves having a clear understanding of functional require-
The Government Summit Thought Leadership Series 21

ments of different business units as well as the ability to man-date the use of innovative practices that generate cost savings for the government as a whole (see figure 6 below).
As part of the overall governance and control of efficiency many jurisdictions are introducing “sunset clauses” which direct agen-cies, programs or initiatives to close down after a set period of time, once they have fulfilled their purpose. Under this arrange-ment, the establishment of an initiative is typically accompanied by an evaluation exercise that allows for periodic reviews of regulation and legislation.52 Within the U.S. state governments, sunset clauses and their reviews have now been credited with the repeal, on average of 20 to 30 percent of existing state regula-tions and the modification of another 40 percent.53
As part of a recent effort by the UK Government to reduce regu-lation, all domestic legislation that imposes a regulatory burden on businesses or civil society organizations must now include a review and a sunset clause. The goal is to ensure that the impact of regulation is reviewed on a regular basis, and that regulation is removed when it is no longer needed, is ineffective, or imposes disproportionate burdens. Departments within the UK govern-ment are now asked to make clear their plans to the Reducing Regulation Committee for the inclusion of sunset clauses or re-view in any new regulatory proposals. The government states
that the first statutory review should be no later than five years after the legislation first takes effect, with “sunsetting” typically set at seven years.54
The Australian central government has used sunset clauses since 2005, passed as part of its Legislative Instruments Act (LIA). The LIA introduced a mandatory ten-year sunsetting provision for a wide range of legislation as well as a requirement that explanato-ry statements be registered on the Federal Register of Legislative Instruments and submitted to parliamentary scrutiny. Depart-ments must conduct evaluations in preparation for sunsetting and prepare regulatory impact statements (RIS) before deciding on how to proceed with expiring regulations as well as when developing new regulations. All laws and regulations that do not contain evaluation or sunset clauses must be reviewed by de-partments every five years and departments are required to pub-lish an annual regulatory plan that includes upcoming reviews of legislation and the evaluation strategy for each law.55
Figure 6Building an effective governance model
Decentralized Shared Centralized
Less responsive
No business unit control of central overhead costs
Inflexible to business unit needs
Disconnect from business units
Higher costs
Variable standards
Different control environments
Duplication of efforts
Lean, flat organization
Independent of businesses
Identification of efficiencies between
business units
Understanding of group mandate and
functions
Dissemination of best practices
Business units retain control
Recognition of local priorities
Common systems & support
Efficient knowledge transfer, standards &
tools
Economies of scale
22 The Government Summit Thought Leadership Series

Measure
To make informed choices on value for money, decision mak-ers need accurate and timely information and analysis. Like the proverb, “if you can’t measure it you can’t manage it,” there may also be an element of truth in the statement “if you can’t meas-ure it, you can’t minimize or maximize it.” Reducing inefficient programs and scaling up more efficient practices requires an on-going measurement capability.
Yet, too often, public servants responsible for oversight of major programs have limited actionable information and data on op-erational performance. What’s more there are sometimes multi-ple “sources of truth” or differing perspectives on their value for money. In some cases, more time can be devoted to searching for information than actually using it in decision making. Lord Browne, the UK Government’s Lead Non-Executive Director and former CEO of BP explains the situation in government: “What is lacking is the much deeper understanding of how you can use numbers and information to understand where you really are. It is to do with efficiency. For example: how well are you doing against all the other departments or commercial organi-zations?Wheremightyoubeonaproject,beyondthebudgetperiod?Whatareyoudoingintermsofusingtherightskillsforaproject?”56 The growing availability of data coupled with the increasing sophistication of data analysis tools provides an op-portunity for better measurement in government.
Zero Based Budgeting, Benchmarking, and Ad-vanced Efficiency Measurement Methodologies
The UAE has introduced several leading practices in the meas-urement of costs. Its zero based budgeting (ZBB) exercise in-volves a triennial review process where departments start from a blank sheet of paper and build a budget from the bottom-up. Budgeting teams are then tasked to define activities contribut-ing to agreed objectives that will exist over a budgeting time horizon of three years, and justify activities and their associated costs by providing a detailed cost analysis. Teams prioritize the activities based on a cost-benefit analysis and rank them relative to their contribution to strategic objectives.
Although existing surveys of ZBB indicate that a more “pure” form ZBB is relatively uncommon due to the level of perceived effort associated with its use, elements of ZBB have been ap-plied across a range of government organizations and are more common in two key areas.57 The first is to use line items from previous years and then fill in the costs for each item (rather than simply using the previous year’s expenditure). This helps decision makers determine whether the requested inputs are
reasonable given the expected output through greater transpar-ency of the cost of individual line items. The second is to assess different service levels based on the level of budget and involves ranking the priorities for each item of funding requested. This method helps to answer the question of what level of service should be funded within a program. In its survey on zero-based budgeting in government, the Government Finance Officers As-sociation found that budget offices using ZBB concepts were firmly satisfied with the results on average. It also found that both the level of interest and actual use of ZBB are increasing as government financial resources are becoming more constrained. There are several key advantages associated with using ZBB in-cluding helping to improve the confidence in decisions where cutbacks are required and making the trade-offs between inputs and outputs more transparent. In order to maximize the impact of a ZBB exercise, some governments have adopted a program review which involves evaluating how programs are provided and considering the overall need, service levels, efficiency and alternative approaches to delivery. This approach is described in more detail below.
The Ministry of Finance is also benchmarking the cost of provid-ing both core and support functions using international bench-marks. Core services include frontline delivery and benchmarks include metrics such as patient turnover and clinician salaries. Support services include human resources, IT and finance.
Although there are pockets of benchmarking in governments, our global review indicated that the UK is one of the only gov-ernments that has undertaken and published a comprehensive benchmarking process of key support functions. Its review on operational efficiency found that about 20 percent of the cost of back office functions could be reduced through greater operational efficiency. It found that the mean cost of the HR function is about 1.9 percent of operating expenditure, while finance is 1.3%, and procurement between 0.6 percent and 1.3 percent, although the costs varied widely depending on the size of the organization.58 Such data is used to compare the perfor-mance of various organizations within the public sector, and for comparing the public sector to private sector experience. This benchmarking data can be used to inform potential savings in key functions such as HR, finance, IT, and procurement.
Interviewees were generally positive about benchmarking and zero based budget initiatives but acknowledged some key limi-tations. These approaches can be siloed and may not take a gov-ernment-wide view to efficiency or alignment with broad stra-tegic objectives. Outcomes are often difficult to measure and can involve significant time lags. As one interviewee pointed out, some outcomes can take generations to achieve. Similarly,
The Government Summit Thought Leadership Series 23
obtaining relevant benchmark data can be challenging as the unique functions and needs of departments are difficult to ob-tain direct comparisons. Despite some of these shortcomings, benchmarking can enable increased innovation and collabora-tion in the public sector to release resources to be used more effectively.
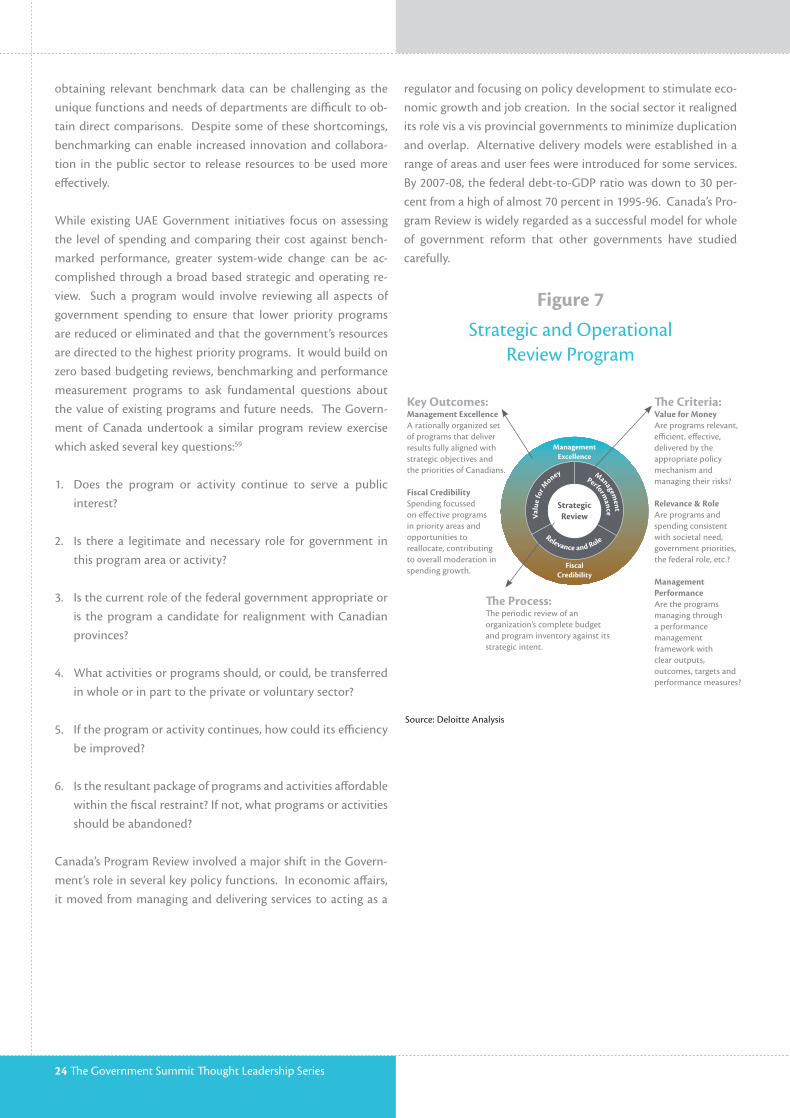
While existing UAE Government initiatives focus on assessing the level of spending and comparing their cost against bench-marked performance, greater system-wide change can be ac-complished through a broad based strategic and operating re-view. Such a program would involve reviewing all aspects of government spending to ensure that lower priority programs are reduced or eliminated and that the government’s resources are directed to the highest priority programs. It would build on zero based budgeting reviews, benchmarking and performance measurement programs to ask fundamental questions about the value of existing programs and future needs. The Govern-ment of Canada undertook a similar program review exercise which asked several key questions:59
1. Does the program or activity continue to serve a public interest?
2. Is there a legitimate and necessary role for government in thisprogramareaoractivity?
3. Is the current role of the federal government appropriate or is the program a candidate for realignment with Canadian provinces?
4. What activities or programs should, or could, be transferred inwholeorinparttotheprivateorvoluntarysector?
5. If the program or activity continues, how could its efficiency beimproved?
6. Is the resultant package of programs and activities affordable withinthefiscalrestraint?Ifnot,whatprogramsoractivitiesshouldbeabandoned?
Canada’s Program Review involved a major shift in the Govern-ment’s role in several key policy functions. In economic affairs, it moved from managing and delivering services to acting as a
regulator and focusing on policy development to stimulate eco-nomic growth and job creation. In the social sector it realigned its role vis a vis provincial governments to minimize duplication and overlap. Alternative delivery models were established in a range of areas and user fees were introduced for some services. By 2007-08, the federal debt-to-GDP ratio was down to 30 per-cent from a high of almost 70 percent in 1995-96. Canada’s Pro-gram Review is widely regarded as a successful model for whole of government reform that other governments have studied carefully.
Figure 7Strategic and Operational
Review Program
Source: Deloitte Analysis
Key Outcomes:Management ExcellenceA rationally organized set of programs that deliver results fully aligned with strategic objectives and the priorities of Canadians.
Fiscal Credibility Spending focussed on effective programs in priority areas and opportunities to reallocate, contributing to overall moderation in spending growth.
The Process: The periodic review of an organization’s complete budget and program inventory against its strategic intent.
The Criteria:Value for Money Are programs relevant, efficient, effective, delivered by the appropriate policy mechanism and managingtheirrisks?
Relevance & Role Are programs and spending consistent with societal need, government priorities, thefederalrole,etc.?
Management PerformanceAre the programs managing through a performance management framework with clear outputs, outcomes, targets and performancemeasures?
ManagementExcellence
FiscalCredibility
Management
Valu
e fo
r M
oney
Relevance and Role
PerformanceStrategic
Review
24 The Government Summit Thought Leadership Series

A strategic and operational review program should include the use of advanced efficiency measurement methodologies. Advanced approaches to measuring workforce efficiency in-clude spans of control, layers, fragmentation, program delivery, activity, value add analysis and capability assessments. These approaches are briefly described below. Spans of control meas-ures the number of employees directly reporting to supervisors across an organization or function while layer analysis identifies the number of management layers in an organization or func-tion and their relation to employee titles, grades and compensa-tion. Where spans of control are low or layers are high there is often a need to simplify processes and consolidate operations to reduce unnecessary management oversight and organization structures. Other examples include:
• Fragmentationisananalysisofactivitiesthatareperformedby many individuals or groups who are spread geographical-ly, or across departments / functions. It identifies inefficien-cies due to sub-optimal allocation of activity (small scale, redundancy, lack of standardization) and allows comparison among operating units to identify low cost performers and disseminate best-practices.
• Program and delivery analysis identifies savings opportu-nities in front or middle office activities such as counter operations, call centers, transaction processing facilities. It involves a process of calculating the cost to serve (FTE time/overall) per transaction for all functions, benchmark-ing functions to identify negative outliers, and interviewing functional leaders to understand drivers of variation and determine improvement opportunities using internal and external best practices.
• Activityanalysisisadiagnostictoolusedtomeasureorgani-zational effectiveness and the degree to which an organiza-tion’s resources are deployed in support of its strategy. It is the measurement of the time and human resources allocat-ed to processes, sub-processes, and activities. The analysis focuses on business processes to identify opportunities for process improvement. It enables an examination of the costs associated with business processes and activities as opposed to solely the cost of departments or functions.
• Valueaddanalysisdeterminesandcategorizesthetotalre-source cost of an organization by activities that are consid-ered high, medium, or low value added. The analysis focuses on business processes to identify opportunities for process improvement. It assesses the degree to which activities re-late to providing customer value and identifies the amount of resources devoted to non-value activities.
• Capability assessments usingmaturitymodels help an or-ganization determine the level of maturity of different func-tions in their organization. A move up the maturity scale may result in cost savings for the organization.
These types of analyses have been utilized to free up resourcesand generate significant efficiency gains in a wide range of gov-ernment departments and agencies. Actionable recommenda- tions typically include simplifying processes and consolidatingoperations to reduce the need for management oversight, bet- ter resource allocation through enhanced demand management.and reducing costly service levels
Analytics
Governments in Australia, Canada, Singapore and the UK have been increasing the use of analytics to generate new insights for decision making. Analytics leverages advanced statistical modeling and visualization tools, business strategy, operational planning capabilities and deep data management and transfor-mation expertise to solve key business issues. Analytics helps to bolster key reforms to the way public sector organizations manage and allocate resources, control risk (both internal and external) and understand workforce and customers. Analytics delivers solutions to these problems by enabling evidence-based business decisions which improve both the efficiency and qual-ity of services delivered, but also incorporates an enterprise wide view of the business, rather than the traditional siloed approach of some public sector organizations.
Singapore Deloitte AnalyticsInstitute AsiaIn 2011, Deloitte with the support of the Sin-gapore Government’s Economic Development
Board launched The Deloitte Analytics Institute Asia – a data analytics think tank dedicated to developing cutting edge strat-egies and tools to help business leaders unlock the significant value of their organization’s data. The Institute comprises a mul-ti-disciplinary team of data scientists tasked with guiding and accelerating analytics projects through research on industry-leading practices. Using expert-led strategy, the team facilitates and develops roadmaps to establish analytics as a mission-crit-ical function within organizations. The Institute also provides capability for data assets inventory development and discovery of actionable insights that can be rapidly operationalized, de-livering executive education and continuing education for ana-lyst teams and building optimization of analytics platforms and models.
The Government Summit Thought Leadership Series 25

Canada Workers Compensation BoardIn Canada, a Workers Compensation Board faced a $12B unfunded liability due to a per-sistent annual funding shortfall relative to the
cost of claims. Deloitte was engaged to assist as a Business Ana-lytics Partner to leverage the organization’s data assets and pro-vide analytical insights critical to defining and confirming new corporate strategies for reducing the impact of the unfunded liability. In considering a single view of a claim, the project found that key data about individual claims was scattered across mul-tiple systems and that key performance indicator (KPI) report-ing was facilitated through data extracts and manually main-tained spreadsheet reports. The project aggregated and refined 278 data sets to create 4,646 attributes for the 2,880,000 records relating to claims in one environment for analysis. It created a single view of a claim by developing an executive KPI dashboard with the ability to drill down to the transaction level. Through the application of advanced analytics it identified trends and patterns in the business operations. For example, the analysis demonstrated high variation in the cost of claims due to specific practices employed at field offices. By standardizing processes in the offices responsible for high claims, significant cost savings opportunities were identified. The client is now actively working through how to embed these new insights into decision-making and build internal analytics capability.
UK NHS Workforce AnalyticsLike many public institutions around the world, the UK National Health Service (NHS) is facing severe financial pressures—and with
staff costs comprising roughly 40 percent of its budget, work-force had to be considered as part of any efforts to increase effi-ciency and reduce costs. A key challenge was to ensure that staff-ing levels remained appropriate to deliver services despite any reductions deemed necessary. To achieve this, the NHS looked to use its existing wealth of data to inform workforce decisions and maintain quality controls. They developed an intuitive and comprehensive set of tools that can model, analyze, understand and predict performance within the entire workforce system—and target resources appropriately. The interactive tools have the capability to use specific values, such as numbers and types of staff, and build models in ways defined by the users, allowing them to create scenarios to be analyzed and generate reports. With an easily understood interface, even users with no formal statistical expertise can drill down into data and understand the details within each model and the implications of different plans as well as access peer-group benchmarking and trends and trajectories in risk. The tools are highly configurable—system changes can be made by an administrator rather than requir-
ing re-programming—and dynamic in their ability to respond to ever-changing health system data. The NHS now has the ability to project and plan for their complex and shifting workforce. As cost reduction efforts move forward, the NHS can more effec-tively monitor workforce risk across the entire system, identify areas of risk early, and take appropriate action to improve overall service quality and safety.
Incent
Even where innovations associated with greater efficiency gains are introduced—and these innovations are rolled out using strong mandates with their value being measured—achieving systematic efficiency can be elusive. Emerging best practice in-volves strengthening formal mechanisms of control, sometimes referred to as ‘high powered incentives’. Alongside higher pow-ered incentives, an efficiency program should share a portion of the proceeds of efficiency savings with those finding the effi-ciencies. This provides a direct incentive to encourage credible efficiency improvements.
While most interviewees felt that formal higher powered incen-tives may not be necessary at this stage, there is a global trend towards using more formal incentive mechanisms to improve the individual motivation and accountability of departments and individuals. There are three main types of formal incentives used to motivate efficiency gains including performance related pay, stronger oversight and greater transparency of performance.
Performance related pay or at risk pay is intended to link com-pensation more directly to achievements of key priorities. This incentive is widely used in the public sector in a number of countries including Canada, the UK, Sweden and Chile.60 In a recent study on how management information is used in deci-sion making, the Institute for Government concluded that de-partment heads performance assessments should systematically cover how well departments are equipped to and succeed in raising value for money.61 As part of the Government of Can-ada’s recent expenditure review program, performance related pay was used as an incentive to motivate efficiency gains. The Government declared that 40 percent of the at-risk pay budget would be directed towards the departmental achievement of supporting “…initiatives to improve the productivity, efficiency and effectiveness of operations and service delivery”.63 UAE in-terviewees for this study felt that the use of performance related pay could be a longer term objective for the Government of the UAE as its performance review system is in the early stages of being established.
26 The Government Summit Thought Leadership Series

A second approach is to introduce greater external input, chal-lenge and oversight of departmental performance. The Gov-ernment of Canada has introduced a policy on internal audit in which the deputy minister is responsible for establishing and maintaining an independent departmental audit committee that includes a majority of external members. The departmen-tal audit committees exist to provide objective advice and rec-ommendations to the deputy minister regarding the sufficiency, quality and results of assurance on the department’s risk man-agement, control and governance frameworks and processes (including accountability and auditing systems).
In an effort to introduce private sector discipline, the UK Gov-ernment has formalized the use of board decision making that includes non-executive directors to provide outside challenge. These Boards have a set of non-executive directors (NEDs) with terms of reference “…to provide outside challenge. They will ex-ercise their role through influence and advice, supporting as well as challenging the executive. They will advise on performance (including agreeing key performance indicators), operational is-sues (including the operational/delivery implications of policy proposals), and on the effective management of the Depart-ment. They will also provide support, guidance and challenge on the progress and implementation of the operational busi-ness plan, and in relation to recruiting, appraising and ensuring appropriate succession planning of senior executives. They will form committees responsible for Audit and Risk, and Nomina-tions and Governance. To share best practice and to ensure De-partments learn from the successes and failures of comparable organizations”.64 The use of boards in government appears to work best when they are given a clear role to contribute to deci-sion making.65 As the UAE utilizes boards in some of its public sector organizations, it could explore rolling out the use of ex-ternal challenge more fully such as by introducing departmental audit committees where a majority of members are external, or having a number of members of the organization’s board as non-executive directors.
A third approach to strengthening incentives for government efficiency uses transparency and reputation as a formal mecha-nism. In the UK, a performance management regime which pub-lished information on hospital performance led to significant improvements in waiting times. Assessments indicated that managers were encouraged to reform based on a reputational incentive to avoid “reputational damage” of those shown to be performing poorly.66 The UK Government’s approach has been to focus more directly on increasing the transparency of informa-tion on everything from performance data to compensation of government decision makers. The Open Public Services White-paper describes the approach: “Improvements will be driven by putting the needs of citizens before producer interest, by using data transparency to put real information in people’s hands, and by decentralizing power to ensure that public service providers are accountable to the people that use them rather than to cen-tralized bureaucracies.” There are four key characteristics for an effective transparency incentive regime.67 It needs to be a rank-ing system with clear distinction between those performing well and those performing poorly, it should be published and widely disseminated, easily understood by the public, and followed up by future reports.
Any additional higher powered incentives need to take account of the UAE Government’s sequencing of reforms, willingness to pursue these initiatives, and capability to mitigate any unintend-ed consequences such as “gaming.” For example, the recent es-tablishment of an employee performance measurement system may require some time for this practice to become established and widely accepted prior to utilizing stronger incentives. How-ever, there is a clear trend in other jurisdictions of utilizing per-formance related pay, stronger oversight through board decision making and greater transparency of performance.
The Government Summit Thought Leadership Series 27
Achieving Systematic Government Efficiency
There are few organizations that can match government’s size. Seven of the 10 largest employers in the world are government run68 and government represents around 22 percent of the economy in the UAE.
The scale of operations represents a major opportunity for efficiency savings through a process of innovation, stand-ardization, pooling of resources, and driving down costs through more integrated approaches to a wide range of government services including procurement, service deliv-ery and corporate functions. As production costs in many governments amount to around 20 to 25 percent of GDP, even modest changes where successfully executed at scale can have a very significant impact.
While efficiency in government appears to be declining over time the good news is that there is a clear path for sys-tematically improving efficiency in government. Through greater innovation, better capability to scale, improved measurement and greater use of management incentives, increased efficiency can be achieved. Not only will this help to drive down the costs of government, it can unleash the forces of creativity to generate better social and eco-nomic outcomes.
In order to introduce a program that involves greater in-novation, scaling, measurement and incenting, govern-ments will need to focus on mutual benefit for all govern-ment entities. An efficiency program roadmap and action plan should prioritize, sequence and develop mechanisms for managing change, while taking into consideration that the speed and methods of reform will vary depending on conditions and priorities of governments.
Conclusion
28 The Government Summit Thought Leadership Series

References1 World Economic Forum, The Global Competitiveness Re-port 2010-2011(2010). http://www3.weforum.org/docs/WEF_GlobalCompetitivenessReport_2010-11.pdf
2 World Bank, Worldwide Governance Indicators (WGI) Project- Government Effectiveness (2012). http://info.worldbank.org/governance/wgi/
3 World Bank, Worldwide Governance Indicators: Sources of Governance Data Used in WGI (2012). http://info.worldbank.org/governance/wgi/pdf/ge.pdf
4 Ibid.
5 International Monetary Fund, Strategies for Fiscal Consolida-tion in the Post-Crisis World (IMF: IMF Multimedia Services Division 2010). http://www.imf.org/external/pubs/ft/dp/2010/dp1004.pdf
6 Organisation for Economic Co-operation and Development (OECD), Government at a Glance 2009 (October 2009), p. 73. http://www.oecd.org/gov/governmentataglance2009.htm
7 UK Centre for the Measurement of Government Activity, Of-fice for National Statistics: Total Public Service Output and Pro-ductivity (June, 2009), p. 3. http://www.statistics.gov.uk/articles/nojournal/TotalPublicServiceFinalv5.pdf
8 University of Oxford & University of Cambridge, Politics in Spires: Cutting the Costs of Bureaucracy: Are we Nearly There Yet andHowWouldWeKnow? (July, 2012). http://politicsin-spires.org/2012/07/cutting-the-costs-of-bureaucracy-are-we-nearly-there-yet-and-how-would-we-know/
9 Deloitte, Boosting Public Sector Productivity by Going Mobile (October 2012).
10 Source: Ruth Lawrence, Yasmin Parekh, and Jillian Bordonada, Australia and New Zealand Expenditure Review Roundtable Background Paper: Overview of Expenditure Review Mecha-nisms in Australia and New Zealand (August 2011). http://www.treasury.nsw.gov.au/__data/assets/pdf_file/0017/21572/2011_Aug_ROUNDTABLE_BACKGROUND_PAPER_FINAL.pdf
11 Treasury Board of Canada Secretariat, Frequently Asked Ques-tions (November, 2011). http://www.tbs-sct.gc.ca/sr-es/faq-eng.asp
12 Sir Peter Gershon, Releasing Resources to the Front Line: In-dependent Review of Public Sector Efficiency (July 2004). http://www.hm-treasury.gov.uk/d/efficiency_review120704.pdf
13 Sir Philip Green, Efficiency Review by Sir Philip Green: Key Findings and Recommendations (October, 2010). http://www.cabinetoffice.gov.uk/sites/default/files/resources/sirphilipgreen-review.pdf
14 UK Cabinet Office, Government Digital Strategy, Digital Effi-ciency Report (November 2012). http://publications.cabinetof-fice.gov.uk/digital/efficiency/
15 United Nations Economics and Social Affairs, E-Government Survey 2012: E-Government for the People, (2012). http://unpan1.un.org/intradoc/groups/public/documents/un/un-pan048065.pdf
16 Ibid.
17 OECD, Towards National Social Protection Floors: prepared for G20 Labour and Employment Ministerial) (September 2011). http://www.oecd.org/social/socialpoliciesanddata/socialex-pendituredatabasesocx.htm
18 Government of British Columbia, Integrated Case Manage-ment (ICM) (October, 2012). http://www.integratedcaseman-agement.gov.bc.ca/
19 Ibid.
20 Ibid.
21 Singapore Government, Infocomm Development Authority of Singapore (IDA) (2012). http://www.ida.gov.sg/
22 Ministry of Finance Singapore & IDA, Factsheet of Public Services Infrastructure (PSi) (September 2003). http://unpan1.un.org/intradoc/groups/public/documents/APCITY/UN-PAN014669.pdf
The Government Summit Thought Leadership Series 29

23 Singapore eGov, eGov Programmes eGap I: Public Service In-frastructure (September 2011). http://www.egov.gov.sg/egov-programmes/programmes-by-government/public-service-infra-structure
24 TuoiTre News, Smartphones Drive Complaints Spike in Aus-tralia (October 2012). http://tuoitrenews.vn/cmlink/tuoitre-news/business/smartphones-drive-complaints-spike-in-austral-ia-1.90295
25 Enterprise Innovation, Australians Now Prefer Internet for Accessing Government Services (February, 2012). http://www.enterpriseinnovation.net/content/australians-now-prefer-inter-net-accessing-government-services
26 Ibid.
27 Deloitte Digital, EzyReg (2012). http://www.deloittedigital.com/au/work/ezyreg
28 Ibid.
29 Government of Alberta: Business Case: ICT Service Coordina-tion Initiative (February 2007).
30 Dalibor Petrovic, Deloitte. Shared IT Services for Govern-ments- Governance, collaboration and the “me” factor (July 2008).
31 Ibid.
32 Ibid.
33 BC Health Authority Shared Services Organization, Health Shares Services BC: A Division of the Provincial Health Services Authority (October 2012). http://www.hssbc.ca/default.htm
34 Singapore Government, Vital Shared Services (2011). http://www.vital.gov.sg/
35 OECD, Government at a Glance 2009. http://www.oecd.org/gov/governmentataglance2011.htm
36 Singapore Government Enterprise One, Success with GeBiz (July 2011). http://www.enterpriseone.gov.sg/en/Resources/Publications/Online%20Articles/Success%20With%20GeBiz.aspx
37 Civil Service College Singapore, Value for Money in Sin-gapore’s Government Procurement Regime; Prepared for Sixth Regional Public Procurement Forum (2010). http://
siteresources.worldbank.org/INTECACOSUPROC/Resourc-es/776023-1271709540888/Singapore-Govt-Proc-Regime.pdf
38 Ibid.
39 Ibid.
40 Civil Service College Singapore, Value for Money in Sin-gapore’s Government Procurement Regime; Prepared for Sixth Regional Public Procurement Forum (2010). http://siteresources.worldbank.org/INTECACOSUPROC/Resourc-es/776023-1271709540888/Singapore-Govt-Proc-Regime.pdf
41 Singapore Government Enterprise One, Success with GeBiz (July 2011). http://www.enterpriseone.gov.sg/en/Resources/Publications/Online%20Articles/Success%20With%20GeBiz.aspx
42 Carol Lo S Chia, Defence Science & Technology Agency (DSTA) E-Government Procurement Workshop: The Singapore E-Government Procurement Experience. http://www.slideserve.com/topper/e-government-procurement-workshop-the-singa-pore-e-government-procurement-experience-carol-lo-s-chia-assistant-directo
43 Ibid.
44 Singapore Government Enterprise One, Success with GeBiz (July 2011). http://www.enterpriseone.gov.sg/en/Resources/Publications/Online%20Articles/Success%20With%20GeBiz.aspx
45 Saskatchewan Ministry of Health: Putting patients first, Transforming Health Care Through Lean (2012). http://www.saskatoonhealthregion.ca/lean/documents/SKH_LeanNewslet-ter_June20124.pdf
46 OECD, Government at a Glance 2011 (2011) http://www.oecd.org/gov/governmentataglance2011.htm
47 Lonti, Z. and M. Woods, OECD Working Papers on Public Governance No. 7, Towards Government at a Glance: Identifica-tion of Core Data and Issues related to Public Sector Efficiency (OECD Publishing, 2008) p. 19. http://www.oecd-ilibrary.org/governance/government-at-a-glance-2011_gov_glance-2011-en
48 Public Service Commission of Canada, Evaluation of the Re-cruitment of Policy Leaders Program- Summary Report (March 2008). http://www.psc-cfp.gc.ca/abt-aps/inev-evin/2008/rpl-rlp-eval-eng.htm
30 The Government Summit Thought Leadership Series

49 Treasury Board of Canada Secretariat, Overview of MAF (June 2011). http://www.tbs-sct.gc.ca/maf-crg/overview-apercu/over-view-apercu-eng.asp
50 Eggers, William D. et al., Deloitte, Public sector, disrupted: How disruptive innovation can help government achieve more for less, (2012). http://insights.deloitte.ca/wp-content/up-loads/2012/03/dttl_ps_DisruptedFullStudy2012.pdf
51 Jocelyne Bourgon, Institute for Government, Program Review: The Government of Canada’s Experience Eliminating the Deficit, 1994-99: a Canadian Case Study (September 2009). http://www.instituteforgovernment.org.uk/sites/default/files/publications/Program%20Review.pdf
52 Frank Frick, Henrik Brinkmann, Sunset Legislation and Bet-ter Regulation, Empirical Evidence from Four Countries (June 2010). http://www.bertelsmann-stiftung.de/cps/rde/xbcr/SID-E8B3D0D1-5443791C/bst_engl/xcms_bst_dms_35739__2.pdf
53 Paul Teske, University of Colorado at Denver, Is the Recent ofExpandingStateRegulationBeneficialorHarmful?TheNewRole and Politics of State Regulation (2004). http://www.cato.org/pubs/regulation/regv27n3/v27n3-1.pdf
54 HM Government, Sunsetting Regulations: Guidance (March 2011). http://www.parliament.uk/deposits/depositedpa-pers/2011/DEP2011-0504.pdf
Source: Government UK, Department for Business Innovation & Skills, Sunsetting Regulations (2012). http://www.bis.gov.uk/policies/bre/effectiveness-of-regulation/sunsetting-regulations
55 Frank Frick, Henrik Brinkmann, Sunset Legislation and Bet-ter Regulation, Empirical Evidence from Four Countries (June 2010). http://www.bertelsmann-stiftung.de/cps/rde/xbcr/SID-E8B3D0D1-5443791C/bst_engl/xcms_bst_dms_35739__2.pdf
56 Parliament UK, Parliamentary Business (December 2010). http://www.publications.parliament.uk/pa/cm201012/cmse-lect/cmpubacc/c1352-i/c135201.htm
57 The City of Calgary & Government Finance Officers Asso-ciation, Zero-Base Budgeting: Modern Experiences and Current Perspectives (2011). http://www.gfoa.org/downloads/GFOAZe-roBasedBudgeting.pdf
58 HM Government, Benchmarking the Back Office: Central Government (HM Government: HM Treasury Publishing Unit, 2009).
59 Jocelyne Bourgon, Institute for Government, Program Review: The Government of Canada’s Experience Eliminating the Deficit, 1994-99: a Canadian Case Study (September 2009). http://www.instituteforgovernment.org.uk/sites/default/files/publications/Program%20Review.pdf
60OECD, Performance-Related Pay Policies for Government Em-ployees (2005). http://www.oecd.org/gov/performance-related-paypoliciesforgovernmentemployees.htm
61 Julian McCrae, Justine Stephen, Theresa Guermellou and Ree-ma Mehta, Institute for Government, Improving Decision Mak-ing in Whitehall: Effective Use of Management Information (May 2012). http://www.instituteforgovernment.org.uk/sites/default/files/publications/Improving%20decision%20making%20in%20Whitehall.pdf
62 Treasury Board of Canada Secretariat, Revised Technical Budg-et Instructions 2011-2012 for the Performance Management Program for Executives (EX PMP) (April 2012). http://www.tbs-sct.gc.ca/prg/tbiex12-itbex12-eng.asp
63 Treasury Board of Canada Secretariat, Directive on Internal Auditing in the Government of Canada (April 2012). http://www.tbs-sct.gc.ca/pol/doc-eng.aspx?section=text&id=25610
64 Cabinet Office, HM Treasury, Corporate Governance in Cen-tral Government Departments: Code of Good Practice 2011 (July 2011), p. 7. http://www.hm- treasury.gov.uk/d/corporate_governance_good_practice_july2011.pdf
65 Institute for Government, Transforming Whitehall Depart-ments- Six steps to making Whitehall boards work (December 2010). http://www.instituteforgovernment.org.uk/news/latest/six-steps-making-whitehall-boards-work
66 Timothy Besley, Gwyn Bevan and Konrad Burchardi, London School of Economics, Accountability and Incentives: The Impacts of Different Regimes on Hospital Waiting Times in England and Wales (September 2008), p. 6. http://econ.lse.ac.uk/~tbesley/papers/nhs.pdf
The Government Summit Thought Leadership Series 31

67 Judith H. Hibbard, Jean Stockard and Martin Tusler, Health Af-fairs, Does Pub-licizing Hospital Performance Stimulate Quality ImprovementEfforts?(2003)22(2),84{94Source: Health Affairs, Hospital Performance Reports: Impact On Quality,MarketShare,AndReputation(2005),24(4),1150{1160
68 Economist, Employment: Defending Jobs (September 2011). http://www.economist.com/blogs/dailychart/2011/09/employment?fsrc=scn/tw/te/dc/defending
References for Figures
World Bank 2011 Database. http://data.worldbank.org/indica-tor/SP.POP.TOTL
World Economic Forum, Executive Opinion Survey. http://www.weforum.org/content/pages/competitiveness-library International Monetary Fund, World Economic Outlook (Au-gust 2012). http://www.imf.org/external/pubs/ft/weo/2012/01/index.htm
OECD, Government at a Glance 2009. http://www.oecd.org/gov/governmentataglance2011.htm
OECD, Government at a Glance 2011. http://www.oecd.org/gov/governmentataglance2011.htm
32 The Government Summit Thought Leadership Series

Annex:What Does Inefficiency LookLike?Department Planning and Management Oversight
• Seniormanagersresponsiblefortasksthatcouldbehandledby more junior personnel
• Managershavenarrowspansofcontrolor1:1reportingrela-tionships
• Largenumberofreportinglayers• Managershaveoverlappingresponsibilities• Decentralizedfacilities(requiringredundantsetsofmanag-
ers)• Personnel engaging in unnecessary or inefficient planning
activities
Internal Support Services
• Fragmenteddeliverymodel(redundancyacrossthedepart-ment)
• Inefficient/overlycomplexbusinessprocesses• OverlycomplexbusinessapplicationsandITinfrastructure• Sub-optimal organization structure (narrow spans of con-
trol, large number of reporting layers)• Activitiesin-housethatwouldbelesscostlyand/ormoreef-
fective if outsourced• Redundant facilities/offices (across geographies, depart-
ments)• Lackofstandardizationcreatinginefficiencies• Manualprocessthatcouldbeautomated
The Government Summit Thought Leadership Series 33

Logistics and Supply Activities
• Excesscomplexityinprocesses• Distributionnetworkcomplexity• Lowcapacityutilization• Unnecessarymanualprocesses• Lackofmaturityandfunctionalcapabilities
Internal Policy/ Program Development
• Decentralizeddecisionrights• Excessiveinter-departmentcoordination• Complexpolicyrules• Sub-optimalresourceallocationamongpolicydevelopment
needs
Regulation/ Compliance Management
• Excessivefocusonpost-audits(vs.earlydetectionandpre-vention)
• Lackofautomationininspection/monitoringprocesses• Complexgeographic footprint leading to redundant facili-
ties/offices
Physical Operating Activities
• Sub-optimalpersonnellogistics• Narrowspansofcontrol• Overlappingresponsibilities• Lowlabourproductivity• Unnecessaryactivities• Unnecessarycomplexity• Complexgeographic footprint leading to redundant facili-
ties/bases• Sub-optimalcapacitydistribution(time,geography)• Low capacity utilization or capacity not aligned with de-
mand
Case Management
• Sub-optimalpersonnellogistics• Inefficientallocationofresponsibilitiesamongpersonnel• Lackofstandardizationincasemanagementprocesses
• Lackofautomationincasemanagementprocesses• Lowlabourproductivity• Unnecessaryactivities• Redundantfacilities/offices
Asset and Resource Management
• Excessiveresourcesdedicatedtounderperformingassets• Excessive resources dedicated to assets at underutilized
times of day/year• Complexgeographic footprint leading to redundant facili-
ties• Low capacity utilization or capacity not aligned with de-
mand• Lackofstandardizationamongfunctionsorgeographies• Inefficientprocurement/disposalprocesses
Transactional Services
• Excesstraffictohighercostchannels,minimalusageoflowcost channels
• Fragmentation of service delivery (across geographies, de-partments)
• Lackofstandardizationcreatinginefficiencies• Manualprocesscouldbeautomated• Unnecessarycomplexityreducingspeedandeffectivenessof
processes• Activitiesin-housethatwouldbelesscostlyand/ormoreef-
fective if outsourced• Complexgeographic footprint leading to redundant facili-
ties/offices• Sub-optimalcapacitydistribution(time,geographies)
Grants and Contributions Management
• Fragmentationofdelivery• Lackofstandardization• Decentralizeddecisionrights• Narrowspansofcontrol• Inefficientprocesses• Complexgeographic footprint leading to redundant facili-
ties/offices• Sub-optimalcapacitydistribution(time,geographies)
34 The Government Summit Thought Leadership Series

Research, Analysis and InformationServices
• Overpricedspecializedresearchfacilities• Redundantspecializedresearchfacilities• Redundantresearchtopics• Unnecessaryresearchtopics• Lackofstandardization• Lackofautomation• Unnecessaryin-houseactivities• Sub-optimalcapacitydistribution(time,geographies)
Intra-government Support Services
• Inefficient/overlycomplexbusinessprocesses• OverlycomplexbusinessapplicationsandITinfrastructure• Sub-optimal organization structure (narrow spans of con-
trol, large number of reporting layers)• Activitiesin-housethatwouldbelesscostlyand/ormoreef-
fective if outsourced• Redundant facilities/offices (across geographies, depart-
ments)• Lackofstandardizationcreatinginefficiencies• Manualprocessthatcouldbeautomated
The Government Summit Thought Leadership Series 35

Contact Information:
Abu Dhabi Rashid Bashir Partner +971 2 408 [email protected]
DubaiAbdelhamid SubohPartnerNational Public Sector Leader+971 4 369 [email protected]
MontrealKhalil NasrallahPartner+1 514 393 [email protected]
TorontoPaul MacmillanPartnerGlobal Public Sector Leader+1 416 874 [email protected]