government deficits, wealth effects and the price level in an
TRANSCRIPT

E U R O P E A N C E N T R A L B A N K
WO R K I N G PA P E R S E R I E S
EC
B
EZ
B
EK
T
BC
E
EK
P
WORKING PAPER NO. 285
GOVERNMENT DEFICITS,WEALTH EFFECTS AND THE PRICELEVEL IN AN OPTIMIZING MODEL
BY BARBARA ANNICCHIARICO
November 2003

1 I would like to thank Nicola Giammarioli, Giancarlo Marini,Alessandro Piergallini, Rolf Strauch and Jürgen Von Hagen for useful comments and suggestions.This paper has benefitedfrom detailed comments of an anonymous referee and of the editorial board, for which I am indebted.The responsibility for any errors is mine only.This paper has been preparedwhile I was visiting the ECB in the context of an internship program in the Fiscal Policies Division whose hospitality is gratefully acknowledged.The opinions expressed herein arethose of the author and do not necessarily represent those of the European Central Bank.This paper can be downloaded without charge from http://www.ecb.int or from the SocialScience Research Network electronic library at http://ssrn.com/abstract_id=487448.
2 Address for correspondence: Ceis, Facoltà di Economia, Università di Roma “Tor Vergata”,Via Columbia 2, 00133 Rome, Italy. E-mail: [email protected]
WORKING PAPER NO. 285
GOVERNMENT DEFICITS,WEALTH EFFECTS AND THE PRICELEVEL IN AN OPTIMIZING MODEL
BY BARBARA ANNICCHIARICO
November 2003
E U R O P E A N C E N T R A L B A N K
WO R K I N G PA P E R S E R I E S

© European Central Bank, 2003
Address Kaiserstrasse 29
D-60311 Frankfurt am Main
Germany
Postal address Postfach 16 03 19
D-60066 Frankfurt am Main
Germany
Telephone +49 69 1344 0
Internet http://www.ecb.int
Fax +49 69 1344 6000
Telex 411 144 ecb d
All rights reserved.
Reproduction for educational and non-commercial purposes is permitted provided that the source is acknowledged.
The views expressed in this paper do not necessarily reflect those of the European Central Bank.
The statement of purpose for the ECB Working Paper Series is available form the ECB website, http://www.ecb.int.
ISSN 1561-0810 (print)
ISSN 1725-2806 (online)

ECB • Work ing Pape r No 285 • November 2003 3
Contents
Abstract 4
Non-technical summary 5
1 Introduction 7
2 Related literature 8
3 The basic model 103.1 Consumers 113.2 Firms 143.3 The monetary authority 143.4 Government 153.5 Equilibrium conditions and steady state 163.6 Model solution 16
4 Calibration 18
5 The response of the economy to fiscal expansions 205.1 Increase in lump-sum transfer 205.2 Increase in public expenditure 22
6 Conclusions 24
References 27
Appendix 31
European Central Bank working paper series 37

Abstract
This paper investigates the inflationary effects of fiscal policy in an opti-
mizing general equilibrium monetary model with capital accumulation, flexi-
ble prices and wealth effects. The model is calibrated to Euro Area quarterly
data. Simulation results show that government deficits, high debt level and
slow fiscal adjustment adversely affect price stability in the presence of an
independent monetary authority adopting a monetary targeting regime. The
mechanism through which fiscal policy affects the dynamics of the price level
presents monetarist properties, since the price level is determined in the
monetary market. The effects produced by fiscal expansions on price dynam-
ics are due to the behavior of consumers, facing a positive probability of death
and sharing the burden of fiscal adjustment with future generations. Fiscal
variables are shown to influence the consumption plan of individuals and the
demand for real money balances, thus affecting the equilibrium conditions in
the money market where the price level is determined.
JEL Classification Code: E31, E62.
Keywords: Price Stability, Fiscal Policy and Government Debt.
ECB • Work ing Pape r No 285 • November 20034

Non-technical summary
The negative consequences of high government debt and deficits on price
stability and the potential interrelations between fiscal and monetary policy
are a debated issue in the Euro Area. It is argued that the fiscal restric-
tions, defined in the Maastricht Treaty, are necessary for the ECB to pursue
the primary objective of price stability. The present paper illustrates how
government debt and deficits might be linked to the price level dynamics in
a small structural model of analysis with overlapping generations.
The paper develops an optimizing general equilibrium monetary model
with capital accumulation, fully flexible prices and wealth effects in which
the Ricardian Equivalence condition is not satisfied. The main purpose is
to analyze the inflationary consequences of a fiscal expansion and to study
the role of wealth effects in the transmission mechanism from fiscal policy
to price level dynamics. In particular, in a simulation model, calibrated to
Euro Area quarterly data, this paper evaluates the implications on price
level dynamics and on other macro variables of increases in transfers to
households and in the level of public expenditure. All the fiscal experiments
are carried out under the assumptions that the government adopts a fiscal
rule that maintains a convergent path for public debt, while the rate of
money growth is set by an independent monetary authority.
The main mechanism through which fiscal policy affects the dynamics
of the price level can be illustrated as follows. Since the Ricardian Equiv-
alence condition is not satisfied, fiscal policy affects the consumption plan
and the timing of taxes alters the consumers’ decisions. The changes in the
consumption plan, due to fiscal expansions, influence the demand for real
money holdings, thus affecting the equilibrium conditions of the monetary
market. Since the nominal stock of money is exogenously set by the mon-
etary authorities, the price level adjusts to guarantee the equilibrium. In
other words, fiscal policies indirectly affect the equilibrium conditions in the
money market in which the price level is determined. It is shown that the
effectiveness of this basic mechanism depends on:
• the nature of the fiscal expansion (transfers to households or increase
in public expenditure);
• the magnitude of the wealth effects;
• the level of the public debt-GDP ratio;
• the speed of fiscal adjustment.
ECB • Work ing Pape r No 285 • November 2003 5

Specifically, the simulations show that temporary fiscal expansions neg-
atively affect price stability. Wealth effects enlarge the response of the price
level and of all the other variables to fiscal expansions. The price level path
is always above its long run trend during the adjustment process. In addi-
tion, economies with high public debt-GDP ratios and slow fiscal adjustment
experience larger price deviations after a fiscal expansion.
From the simulations it emerges that the effects produced by fiscal ex-
pansions on price level dynamics through wealth effects are minor. The rea-
son why the role of wealth effects seems small is that the model underlying
the simulations considers only a minimum deviation from Ricardian Equiv-
alence. It follows that the role of wealth effects is small by construction.
Nevertheless, the analysis provides insights into the linkages between fiscal
variables and the dynamics of the price level and illustrates the directions
in which wealth effects work.
The results of this paper provide extra reasons to promote fiscal conver-
gence in the Euro Area and to enforce the respect of both fiscal requirements,
the deficit criterion and the debt criterion. In the light of this analysis, it
is argued that future research should evaluate the degree to which the Euro
Area deviates from Ricardian Equivalence. If Ricardian Equivalence does
not hold, then the lack of fiscal discipline will make the pursuit of price
stability more difficult and there will be additional reasons to enforce the
Stability and Growth Pact.
ECB • Work ing Pape r No 285 • November 20036
1 Introduction
The negative consequences of large government debt and deficits on inflation
and the possible interrelations between fiscal and monetary policy are a
central issue in the current macroeconomic policy debate. The Maastricht
Treaty and the Stability and Growth Pact impose limitations on the size
of public debt and deficits for each country in the Euro Area. It is argued
that fiscal discipline is a necessary condition for the ECB to pursue the
objective of price stability and there is also consensus on the need to take
into account both of the fiscal criteria defined in the Maastricht Treaty,
the deficit criterion and the debt criterion1. From the present debate it
emerges that the independence of the central monetary authority would be
a necessary but not sufficient condition to ensure price stability2.
The main aim of the present paper is to evaluate the inflationary con-
sequences of a fiscal expansion and to provide a quantitative assessment
of wealth effects in a simulation analysis. In particular, this paper repre-
sents a first attempt to quantify the effects of fiscal expansions on price
level dynamics and on other relevant variables via the wealth effects in a
simulation model, calibrated for the Euro Area, through the Yaari (1965)-
Blanchard (1985) framework of analysis. The basic model of analysis is a
non-stochastic discrete time monetary model of perpetual youth with capi-
tal accumulation and fully flexible prices, where the Ricardian Equivalence
condition is not satisfied. The government is assumed to choose a sequence
of taxes according to a fiscal rule that maintains a convergent path for public
debt, given the monetary policy rule set by an independent authority. Both
the implications of increases in transfers to households and in the level of
public expenditure are considered.
The simulations carried out in this paper clearly show how fiscal policy
affects the dynamics of the price level and of other relevant variables. It
emerges that wealth effects enlarge the response of the price level and of all
the other variables to fiscal expansions. In particular, it is shown that the
price level path is always above its long run trend during the adjustment
process. Moreover, the results suggest that economies with high public
debt-GDP ratios and slow adjustment are likely to experience larger price
deviations after a fiscal expansion.
1A protocol to the Treaty sets the budget deficit threshold at 3% of the GDP and the
public debt at 60% of the GDP.2The public debt requirement has received renewed attention and there is wide po-
litical consensus on the importance of reducing the public debt-GDP ratio at a suitable
pace towards the 60% reference value. See European Commission (2003a) and European
Central Bank (2003).
ECB • Work ing Pape r No 285 • November 2003 7

The mechanism of transmission from fiscal policy to prices is not straight-
forward. In a few words, the main mechanism at work behind the observed
results, can be synthesized as follows. Since the Ricardian Equivalence con-
dition is not satisfied, the consumption plan of individuals depends on the
timing of taxes. It follows that fiscal expansions are shown to always alter
the consumption plan of individuals. This change in the consumption plan
alters the demand for real money balances. Since the nominal supply of
money is exogenously set by the monetary authorities, the price level must
change to restore the equilibrium in the money market. In this sense the
mechanism through which fiscal policy affects the dynamics of the price level
displays entirely monetarist properties.
The effects produced by fiscal expansions on price level dynamics through
wealth effects, however, seem to be minor. The magnitude of the simulations
results is driven by the departure of the economy from Ricardian Equivalence
which, in the present model, is assumed to be small. Nonetheless, the paper
shows the directions in which the wealth effects work in transmitting the
effects of a fiscal expansion from the changes in the consumption plan to
the monetary market and stresses the importance for future research of
investigating the role of wealth effects and the departure from the Ricardian
Equivalence condition in the Euro Area. The Yaari-Blanchard framework,
in fact, is shown to provide an additional perspective to discuss the Stability
and Growth Pact and offers extra reasons to promote fiscal convergence in
the Euro Area.
The paper is organized as follows. Section 2 relates the present paper
to the economic literature. Section 3 presents the basic monetary model
with overlapping generations and capital accumulation; Section 4 describes
calibration; Section 5 illustrates simulation results for different fiscal ex-
periments. Section 6 concludes and summarizes the main findings of the
paper.
2 Related Literature
A well known result since Sargent and Wallace (1981) is that fiscal policy
matters for price stability, since large deficits and increasing government
debt may eventually force the central bank to issue money to ensure sol-
vency. In a seminal paper Aiyagari and Gertler (1985) study the inflationary
effects of high current public deficits in an optimizing general equilibrium
model when they are expected to be financed by future money creation. In a
stochastic monetary model Leeper (1991) shows under which circumstances
the effects of monetary policy on prices depend on the fiscal rule adopted by
ECB • Work ing Pape r No 285 • November 20038

the government. Recently, following the contributions by Woodford (1994,
1995) and Sims (1994), the ’fiscal theory of the price level’ (FTPL) has
become increasingly popular in providing a theoretical framework able to
identify the conditions under which fiscal policy alone determines inflation
dynamics. Specifically, the FTPL distinguishes between Ricardian and non-
Ricardian fiscal regimes, in the terminology of Woodford (1995): in the first
case the nominal anchor is provided by monetary policy and the price level
is determined in the monetary market, while in the second case fiscal policy
serves as the nominal anchor and determines the price level. In other words,
in the Ricardian regime fiscal policy is irrelevant for the determination of
the price level and the intertemporal budget constraint of the government
necessarily holds regardless of the time path of the price level. Conversely,
in a non-Ricardian regime prices and not deficits adjust to satisfy the in-
tertemporal budget constraint of the government. From this point of view
the FTPL shows under which circumstances the time path of the price level
is determined by the needs of fiscal solvency and provides a theoretical ra-
tionale supporting the idea that the respect of the fiscal criteria, defined in
the Maastricht Treaty, is necessary for price stability. This theory, appealing
as it might be, has been seriously questioned by Buiter (2002) and McCal-
lum (2001). In particular, both authors criticize the ’fiscalist’ proposition in
the case of a non-Ricardian regime. McCallum claims that in this case the
solution for the price level outlined by the FTPL is not unique and shows
the existence of an alternative monetarist solution, based on fundamentals,
as suggested by the minimal-state-variable approach. Buiter argues that
the FTPL is misspecified, since it denies that the intertemporal government
budget constraint must hold as an identity and assumes that it needs to be
satisfied only in equilibrium. Buiter shows that this feature of the FTPL is
a source of internal contradictions and anomalies.
The role of fiscal deficits in determining inflation dynamics has also been
investigated in optimizing general equilibrium models with wealth effects.
The Yaari (1965)-Blanchard (1985) model has been used in several contribu-
tions3 and has become increasingly popular as a basic framework of analysis
to study the interrelations between monetary and fiscal policies. See for
example Marini and Van der Ploeg (1987), Leith and Wren-Lewis (2000)
and the modified version a la Weil proposed by Detken (1999) who uses the
Blanchard-Weil OLG model to address the question of intergenerational fair-
ness and interprets the Stability and Growth Pact ”as an intergenerational
contract safeguarding the interests of future generations”. The implications
3See Heijdra and Van der Ploeg (2002) for an exhaustive survey.
ECB • Work ing Pape r No 285 • November 2003 9

of the FTPL for price level dynamics are analyzed by Leith and Wren-Lewis
(2002) in a continuous time version of the Yaari-Blanchard model with en-
dogenous labor supply and sticky prices. In fully flexible price models Annic-
chiarico and Marini (2003a, 2003b) provide an alternative perspective and
show that high public debt and deficits are inflationary by affecting money
market equilibrium through the wealth effects, even when the intertemporal
budget constraint of the government is satisfied for any sequence of prices
and there is no money financing of public deficit4.
This paper presents an extension of the Yaari-Blanchard model to pro-
vide a link between fiscal policy and the dynamics of the price level. In this
sense the model presented could be included in the class of models proposed
by the FTPL. Nonetheless, the mechanisms at work in our framework are
monetarist, since the price level is always determined in the monetary mar-
ket and the intertemporal budget constraint of the government is always
satisfied for any sequence of prices. From this point of view the model pre-
sented is standard and is solved along the lines of the monetarist approach.
All policy experiments, in fact, are carried out under the assumption that
fiscal authorities adopt a tax rule which guarantees solvency, without any
recourse to any of the revaluation mechanisms characterizing the FTPL,
which have been the object of the main critiques, as explained above5.
3 The Basic Model
Consider the following optimizing general equilibrium monetary model in
discrete time with production and overlapping generations6. The economy
is populated by four types of agents: consumers, firms, the monetary au-
thority and the government. The demand side of the economy is an ex-
tended version of the Yaari-Blanchard model of perpetual youth. Money
yields transaction services and enters the consumers’ utility function along
the lines of Sidrauski (1965) and Brock (1975)7. The dynamic behavior of
4Their approach to the problem provides a monetarist perspective that could be defined
as a ’money market fiscal theory of the price level’.5In this sense we assume a fiscal regime which, in the terminology of Woodford (1995),
is Ricardian. However, in our framework this terminology can be a source of confusion,
since in the present model the Ricardian Equivalence condition is not satisfied.6Smets and Wouters (2002) use a discrete time version of the Yaari-Blanchard frame-
work in an open economy, calibrated to Euro Area data, to study the implications for the
optimal monetary policy of an imperfect pass-through.7Real money balances entering as an argument of the utility function are a common
feature of several contributions extending the Blanchard-Yaari framework to monetary
models. See for example Marini and Van der Ploeg (1988), Leith and Wren-Lewis (2000,
ECB • Work ing Pape r No 285 • November 200310

the economy in response to fiscal expansions is also shaped by the physi-
cal capital accumulation process, which results from the saving decisions of
the finite lived consumers and from the expenditure decisions of an infinite
lived public sector. Prices are assumed to be fully flexible and lifetime is
uncertain. For a given monetary policy rule the government finances its
purchases by levying taxes and by issuing bonds, so as to always satisfy the
intertemporal budget constraint.
3.1 Consumers
The demand side of the economy is composed of cohorts of different ages
and population is assumed to be constant over time. All agents face the
same probability of survival between two consecutive periods, γ > 0, and
have the same preferences. For simplicity, the size of total population is
normalized to one; hence the proportion of population dying and being
born at the end of each period is 1 − γ. Since lifetime is uncertain and
there is no bequest motive, agents sell their contingent claims on their non-
human wealth to life insurance companies. In each period agents receive a
fair insurance premium, while in the case of death all their wealth goes to
insurance companies. Competition among insurance companies implies that
the net return on the insurance contract is 1−γγ
. All agents face the same
sequences of taxes and labor income and decide on consumption, real money
holdings and wealth accumulation. Total non-human wealth is composed of
real money balances, physical capital and government bonds. Labor income
and taxes are assumed to be independent of age. Finally, newly born agents
are assumed not to hold any assets.
The representative agent of the generation born at time s faces a lifetime
utility function of the form
U =∞∑
t=0
(βγ)t log[(cs,t)ξ(ms,t)
1−ξ] (1)
where 0 < ξ < 1, 0 < β < 1 is the subjective discount factor, cs,t and
ms,t denote consumption and real money balances at time t. The budget
constraint of the representative agent of generation s is
cs,t + as,t + ms,t = ws,t − τ s,t +1
γ
[ms,t−1
1 + πt+ (1 + rt−1)as,t−1
](2)
2002). See also Cushing (1999) who presents a discrete time version of the Blanchard-Yaari
monetary model.
ECB • Work ing Pape r No 285 • November 2003 11

where ws,t and τ s,t denote real wage income and lump-sum taxation in period
t, respectively; as,t is the individual’s real non-monetary wealth, as,t = ks,t+
bs,t, where kt,s and bs,t stand for physical capital and real government bonds
at the end of period t8; rt−1 is the real interest rate between period t − 1
and t and πt is the inflation rate defined as πt = Pt
Pt−1−19. Market efficiency
and absence of uncertainty ensure that the rates of returns on capital and
government bonds are equalized. The representative consumer of generation
s chooses a sequence cs,t, ms,t, a,s,t∞t=0 in order to maximize (1) subject to
(2). The solution to the dynamic optimization problem yields the following
conditions
cs,t+1 = βRt−1
Rtcs,t (3)
ηcs,t =it
1 + itms,t (4)
together with the solvency constraint
limt→∞
γtRt(as,t + ms,t) = 0 (5)
where η ≡ 1−ξξ
, (3) is the optimal path for individual consumption, (4) is
the portfolio equilibrium condition, it is the nominal interest rate and Rt
is the interest factor, which is composed of one-period real interest rates
compounded from period 0 to period t
Rt =1
(1 + r0)(1 + r1)(1 + r2)...(1 + rt)(6)
where by definition Rt−1
Rt= 1 + rt. The nominal interest rate represents the
opportunity cost of real money holdings and the Fisher equation holds at
all times
(1 + it) = (1 + πt+1)(1 + rt) (7)
The closed form solution for the optimal choice of individual consumption
is
8This timing convention is common in monetary economics and implies that money
acquired in period t by the representative agent born at time s is ms,t. Real money
balances are assumed to yield transaction services within the period. On this issue see
Obstfeld and Rogoff (1996), chapter 8.9It should be noted that the budget constraint (2) incorporates the premium paid by
insurance companies to the consumer which amounts to 1−γ
γ
[ms,t−1
1+πt+ (1 + rt−1)as,t−1
].
ECB • Work ing Pape r No 285 • November 200312

cs,t =1 − βγ
1 + η
[1
γ
(ms,t−1
1 + πt+
Rt−1
Rtas,t−1
)+ ht,s
](8)
where ht,s is the human wealth, defined as the present discounted value of
future labor incomes net of taxes
ht,s =
∞∑
v=0
γv Rt+v
Rt(ws,t+v − τ s,t+v) (9)
Since the size of the cohort born at time s at time t is (1 − γ)γt−s, the
aggregate value for a generic economic variable, say xs,t, can be obtained as
Xt =t∑
s=−∞
xs,t(1 − γ)γt−s (10)
where upper case letters denote aggregate values.
Aggregation of all generations gives the following expressions for aggre-
gate consumption and the portfolio balance condition10
Ct =1 − βγ
1 + η
[Mt−1
1 + πt+ (1 + rt−1)At−1 + Ht
](11)
ηCt =it
1 + itMt (12)
where aggregate human wealth is defined as
Ht =∞∑
v=0
γv Rt+v
Rt(Wt+v − Tt+v) (13)
The aggregate budget constraint is
Ct + At + Mt = Wt − Tt +Mt−1
1 + πt+ (1 + rt−1)At−1 (14)
The difference equation describing the time path of aggregate consumption
is11
Ct = β(1 + rt−1)Ct−1 −1 − γ
γ
(1 − βγ)
(1 + η)
[Mt−1
1 + πt+ (1 + rt−1)At−1
](15)
10The portfolio balance condition characterizes the demand for real money holdings,
which is increasing in consumption and decreasing in the nominal interest rate (i.e. the
opportunity cost of real money balances).11A specific feature of the Yaari-Blanchard framework is that the time path of aggregate
consumption depends on total wealth. See Blanchard (1985). Setting γ = 1, consumption
evolves according to the standard Euler equation.
ECB • Work ing Pape r No 285 • November 2003 13

3.2 Firms
The supply side of the economy is described by a standard neoclassical
constant return production function in labor and physical capital. Output
at each time period t, Yt, is given by
Yt = AF (Kt−1, Lt) (16)
where Lt is the labor force employed by the firms and A is a measure of
total factor productivity assumed to be constant and normalized to one for
simplicity. For all K, L > 0, F (·) is such that
F (0, L) = 0, Fk(K, L) > 0, FKK(K, L) < 0
and
limK→0
FK(K, 1) = ∞
limK→∞
FK(K, 1) = 0
Since the marginal product of labor is always positive and leisure is not an
argument of the utility function, all population is employed at the optimum
and Lt = 1 for each t. Physical capital depreciates at a constant rate
δ ∈ (0, 1). Competitive profit-maximizing firms equate the marginal product
of capital to the user cost of capital, (rt + δ)
AFK(Kt, 1) = rt + δ (17)
and output is equal to factor payments
Yt = AF (Kt−1, 1) = (rt−1 + δ)Kt−1 + Wt (18)
3.3 The Monetary Authority
The monetary authority is assumed to choose its policy rule independently.
We assume that a strict monetary targeting rule is adopted, that is that
the nominal money stock evolves according to an exogenously given rate of
growth µt. Real money balances are then described by
Mt =1 + µt
1 + πtMt−1 (19)
In this monetary regime the long run level of the inflation rate is given
by the rate of money growth, while short run inflation is endogenously de-
termined and responds to changes in exogenous variables.
ECB • Work ing Pape r No 285 • November 200314

3.4 Government
The government, for a given monetary policy, is assumed to choose the
sequence of taxes and public expenditure in order to always satisfy the in-
tertemporal budget constraint. The flow budget constraint of the govern-
ment is given by
Bt = (1 + rt−1)Bt−1 + Gt − Tt − Mt +Mt−1
(1 + πt)(20)
where Gt is public expenditure12. Equation (20) says that public expendi-
tures and interest payments can be financed by taxes, issuance of new bonds
and seigniorage. The solvency constraint precluding Ponzi’s game requires
that
limt→∞
RtBt = 0 (21)
Conditions (20) and (21) imply that the government satisfies its intertem-
poral budget constraint for a given monetary policy. The current value of
the government’s liabilities is equal to the present discounted value of cur-
rent and future budget surpluses for any sequence of the price level, nominal
interest rate and money stock. The fiscal authority can be defined as Ricar-
dian, in the sense of Woodford (1995).
The sequence of public expenditure Gt∞t=0 is exogenously given, while
the sequence of lump-sum taxes Tt∞t=0 is an increasing function of public
debt
Tt = θBt − Zt (22)
where θ > 0 and Zt∞t=0 is an exogenous sequence of positive transfers13.
The parameter θ is chosen in order to ensure a convergent path of the gov-
ernment debt and can be interpreted as the speed of fiscal adjustment of
taxes to real public debt changes. In fact, the larger θ, the greater the
effects on taxation of an increase in the public debt.
12It should be noted that the government is assumed to issue fully indexed bonds. In
the FTPL class of models the government is assumed to issue also or exclusively nominal
debt.
13The feedback rule (22) is a form of wealth tax and was introduced by Blanchard (1985)
in his original contribution. Ganelli (2002) shows under which circumstances the wealth
tax is not sufficient to ensure saddle-path stability.
ECB • Work ing Pape r No 285 • November 2003 15

3.5 Equilibrium Conditions and Steady State
Equilibrium is given by the market clearing conditions and by the efficiency
conditions for consumers and firms, under the above defined monetary and
fiscal rules. The dynamic competitive equilibrium is described by the fol-
lowing system of difference equations
Ct = β(1 + rt−1)Ct−1 −1 − γ
γ
(1 − βγ)
(1 + η)
[Mt−1
1 + πt+ (1 + rt−1)(Bt−1 + Kt−1)
]
(23)
Kt = AF (Kt−1, 1) + Kt−1(1 − δ) − Ct − Gt (24)
Bt = (1 + rt−1)Bt−1 + Gt − θBt + Zt − Mt +Mt−1
(1 + πt)(25)
Mt = (1 + µt)(1 + rt−1)(Mt−1 − ηCt−1) (26)
where (23) is the difference equation describing the time path of consump-
tion; equation (24), obtained by combining (14), (18) and (20) describes
the accumulation of physical capital; (25) is the budget constraint of the
government incorporating the fiscal rule; equation (26), obtained from the
Fisher equation combining the portfolio condition (12) with the monetary
rule (20), describes the equilibrium condition in the money market. The
price level adjusts in order to clear the money market.
In the absence of changes in the level of transfers and of public expen-
diture the economy converges to a steady state denoted by C, K, B and
M . In steady state the inflation rate is equal to the rate of growth of the
nominal stock of money, π = µ.
3.6 Model Solution
In this Section the non-linear system (23)-(26) is approximated by a first
order Taylor expansion around the steady state and technology is assumed
to be given by
Yt = AF (Kt−1, 1) = AKαt−1 (27)
with α ∈ (0, 1). In particular, the model is log-linearized so as to obtain a
linear system of difference equations where variables are expressed in terms
of percentage deviations from the steady state.
ECB • Work ing Pape r No 285 • November 200316
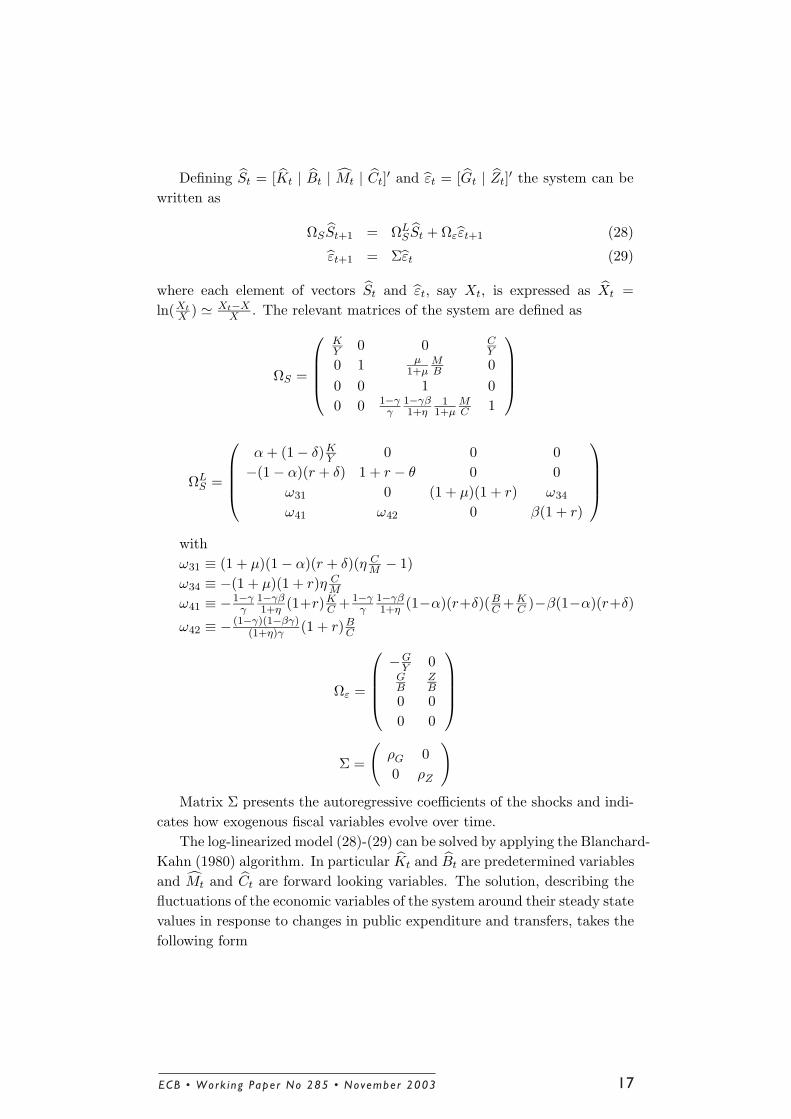
Defining St = [Kt | Bt | Mt | Ct]′ and εt = [Gt | Zt]
′ the system can be
written as
ΩSSt+1 = ΩLS St + Ωεεt+1 (28)
εt+1 = Σεt (29)
where each element of vectors St and εt, say Xt, is expressed as Xt =
ln(Xt
X) ' Xt−X
X. The relevant matrices of the system are defined as
ΩS =
KY
0 0 CY
0 1 µ1+µ
MB
0
0 0 1 0
0 0 1−γγ
1−γβ1+η
11+µ
MC
1
ΩLS =
α + (1 − δ)KY
0 0 0
−(1 − α)(r + δ) 1 + r − θ 0 0
ω31 0 (1 + µ)(1 + r) ω34
ω41 ω42 0 β(1 + r)
with
ω31 ≡ (1 + µ)(1 − α)(r + δ)(η CM
− 1)
ω34 ≡ −(1 + µ)(1 + r)η CM
ω41 ≡ −1−γγ
1−γβ1+η
(1+r)KC
+ 1−γγ
1−γβ1+η
(1−α)(r+δ)(BC
+ KC
)−β(1−α)(r+δ)
ω42 ≡ − (1−γ)(1−βγ)(1+η)γ (1 + r)B
C
Ωε =
−GY
0GB
ZB
0 0
0 0
Σ =
(ρG 0
0 ρZ
)
Matrix Σ presents the autoregressive coefficients of the shocks and indi-
cates how exogenous fiscal variables evolve over time.
The log-linearized model (28)-(29) can be solved by applying the Blanchard-
Kahn (1980) algorithm. In particular Kt and Bt are predetermined variables
and Mt and Ct are forward looking variables. The solution, describing the
fluctuations of the economic variables of the system around their steady state
values in response to changes in public expenditure and transfers, takes the
following form
ECB • Work ing Pape r No 285 • November 2003 17

S1,t+1 = ΘS1,t + Φεt (30)
S2,t = ΥS1,t + Ψεt (31)
where S1 and S2 are the subvectors of endogenous states and of forward
looking variables, respectively. The elements of the matrices Θ, Φ, Υ and
Ψ depend on the underlying parameters and on the critical ratios of the
model14.
In order to better understand the dynamic properties of the model in re-
sponse to changes in εt, we characterize the dynamics of three other forward
looking variables (the inflation rate, the price level and the nominal interest
rate) and of another predetermined variable (the real interest rate).
The path for the inflation rate and for the price level as percentage
deviations from their trend are
πt+1 = πt+1µ = −(1 + µ)Mt+1 + (1 + µ)Mt (32)
Pt = −Mt (33)
where πt+1 = πt+1 − π. Finally, the time path for the real and the nominal
interest rate as deviations from their steady state levels are
rt = rt − r = (r + δ)(α − 1)Kt (34)
it = it − i = (1 + r)rt + (1 + π)πt+1 (35)
The time path of the nominal interest rate turns out to be crucial in
the determination of the equilibrium conditions in the money market and
in the characterization of the effects produced by fiscal expansions in the
simulations.
Computations are performed under the assumption that the rate of
money growth is constant over time, that is µt = µ for each t.
4 Calibration
In order to analyze the response to changes in the level of transfers and
public expenditure, we calibrate the parameters of the model using Euro
14The numerical solution of the model is reported in the Appendix.
ECB • Work ing Pape r No 285 • November 200318

Area quarterly data and assume that each period corresponds to a quarter
of a year15.
Private consumption share C/Y = 0.57 is the average ratio of final
consumption of households to GDP for the period 1991-2001. Public expen-
diture share, set equal to G/Y = 0.20, and transfers share, Z/Y = 0.26, are
defined as the average ratios of final consumption of general government to
GDP and of current transfer to GDP, respectively. The average annual ratio
of GDP and of the monetary aggregate M1, Y/M , for the period 1997-2001
is 3.32.
We set the rate of growth of the nominal stock of money to 2% per
annum16. For the Euro area the average labor share is approximately 0.69
and is the average of the compensation per employee as a percentage of
GDP for the period 1991-200117. The implied value for the parameter α is
then 0.31. The real interest rate is set equal to 3% per annum. Finally, we
calibrate the probability of survival between two consecutive quarters to be
0.98518.
In the benchmark economy the annual public debt to GDP ratio is set
equal to 0.6 and the parameter of the fiscal rule θ is chosen in order to ensure
public solvency19. The model is also solved for an economy characterized
by a larger annual government debt-GDP ratio, 1.0620. It should be noted
that the high debt economy differs from the low debt one in three important
aspects: first, the level of the steady state human wealth is lower, the amount
of taxes necessary to sustain a high public debt being larger as a percentage
of GDP21; second, the parameter of the fiscal rule, θ, is smaller, implying
that the speed of adjustment of taxes with respect to public debt is lower;
third, the time path of aggregate consumption, described by equation (23),
15The Euro Area Data Source is the ECB Statistical DataBank. Tables 2.04, 5.01 and
7.01 of the Euro Area Statistics have been used.16In this simplified model the rate of money growth determines the steady state level
of the inflation rate. Considering a 2% target for the inflation rate, the rate of money
growth is set accordingly.17See European Commission (2003b), Table 32.18The choice of this parameter is crucial for the results. The positive probability of
death is the only source of heterogeneity in this model.19The steady state quarterly public debt-GDP ratio is then equal to 2.4.20Italy and Belgium present the largest government debt as percentage of the GDP
among the Euro Area countries. In 2002 Italy and Belgium’s annual government debt-
GDP ratios were 106.7 and 105.4, respectively.21In steady state the sustainability of a high level of debt requires a larger amount of
total taxation to be levied on households. It follows that human wealth, as defined in (13),
is lower for consumers in the high public debt country, the flow of future labor income
they face being the same.
is substantially altered by the high public debt.
ECB • Work ing Pape r No 285 • November 2003 19

Finally, we will analyze the behavior of the benchmark economy in the
absence of wealth effects, that is setting the probability of survival between
two consecutive periods, γ, equal to one. In this case Ricardian Equivalence
prevails and aggregate consumption evolves according to the standard Euler
equation.
Table 1 summarizes the underlying parameter values, long run properties
of the economy in the three cases and the implied values for the rate of time
preference β, the rate of depreciation δ and the parameters η and θ22.
5 The Response of the Economy to Fiscal Expan-
sions
This Section reports the responses of the economy to fiscal expansions.
Specifically, increases in transfers to households and in public expenditure
are considered in turn. The fiscal changes analyzed are assumed to bring
on impact the fiscal deficit as a percentage of the GDP to 3% and 6%. All
the experiments are carried out under the assumptions that the economy is
initially in steady state and that fiscal expansions are financed entirely by
issuance of new bonds and future taxes.
5.1 Increase in Lump-Sum Transfer
Figures 1 and 2 plot the responses of the economy to an increase in transfer
payments to households which decays with an autoregressive coefficient of
0.95.
In the first place, consider the reactions of the relevant economic variables
in the benchmark economy, described by the continuous lines. A positive
change in transfers leads to an increase in consumption on impact, while
real money balances negatively deviate from their steady state level. During
the later phases of the adjustment consumption is below its long run level.
Physical capital reduces gradually and then starts to increase again, but
is always below its steady state level during the adjustment process. For a
constant rate of nominal money growth, all deviations of real money balances
from the steady state, observed during the adjustment process, are due to
movements in the price level. In other words, after the expansion, the price
level deviates from its trend. In particular, the price level jumps on impact
by 0.022% and then follows a bell shaped path, as shown in Figure 1. The
22Full derivation of the implied parameter values is reported in the Appendix.
ECB • Work ing Pape r No 285 • November 200320

maximum deviation from its trend is 0.029%. In Figure 2, the impact effect
is 0.049% and the maximum deviation is 0.066%.
These results can be explained as follows. When Ricardian Equivalence
is not satisfied, an increase in the level of transfers to households augments
the human wealth of current generations, which fully benefit from the fiscal
expansion and share the burden of taxation with as yet unborn cohorts. For
this reason total consumption jumps upwards on impact and then starts
to decrease. After the fiscal expansion the nominal interest rate jumps up-
wards and is always above its steady state level along the adjustment path.
The nominal interest rate is, in fact, a forward looking variable whose level
depends on a weighted average of future real interest rates. At the same
time the real interest rate is anchored to the level of capital, whose accu-
mulation process is governed by consumption. In this sense all the observed
dynamics are triggered by changes in the consumption plan. Consider now
the effects on the money market. The initial increase in consumption boosts
the demand for real money balances on impact, while the increase in the op-
portunity cost of real money holdings depresses the demand for money. The
negative effect prevails, hence we observe a downward jump in the demand
for real money balances. Afterwards both effects are negative and therefore
real money balances are always below their steady state level. Since the
nominal money supply growth rate is kept constant, during the adjustment
process the price level path must be above its long run level to ensure the
equilibrium in the money market. In this sense a temporary increase in
transfers alters the equilibrium conditions in the monetary market and the
time path of the price level.
The dotted lines indicate the responses of the economy to an increase
in transfers when simulations are carried out neglecting wealth effects (i.e.
setting the probability of survival between two consecutive periods to 1). In
the absence of wealth effects Ricardian Equivalence prevails and the timing
of taxes does not affect the time profile of consumption. An increase in
transfers only affects the time path of public debt during the adjustment
process23. In this case the real and the nominal interest rates are constant
over time and the equilibrium in the monetary market is unaffected by the
fiscal expansion. The paths of public debt with and without wealth effects
are virtually identical, as shown in Figures 1 and 2.
The dashed lines illustrate the responses of economic variables to the fis-
cal expansion under the assumption that the steady state annual government
23An increase in transfer payments, financed by new bond issue and future taxes, is
considered a pure ’Ricardian experiment’.
ECB • Work ing Pape r No 285 • November 2003 21

bond-GDP ratio is 1.06. The effects of an increase in lump sum transfers are
larger than those observed in the low debt economy. The price level jumps
on impact by 0.041 % in Figure 1 and by 0.092% in Figure 2. Results show
that fiscal expansions tend to be more inflationary in economies with higher
debt to GDP ratios.
The intuition behind this finding can be explained as follows. The policy
experiment is conducted in such a way that two economies share the same
characteristics and differ only in the public debt-GDP ratio and in the im-
plied value of the fiscal parameter of adjustment, θ, which is lower in the
high debt economy. In this case consumers pay a large amount of taxes and
the level of their steady state human wealth is lower than that of individuals
in a low debt economy. However, the same increase in transfers determines
a larger increase in human wealth in the high debt economy. Since the low
fiscal adjustment spreads the burden of future taxation across a larger num-
ber of cohorts, individuals initially benefit from the transfer increase in a
large measure and boost their consumption more. On the other hand, the
nominal interest rate increases more than in the low debt economy. This
major change in the consumption plan of individuals, in fact, determines
larger deviations of all the other economic variables from their steady state
levels in response to the fiscal expansion. The same mechanism explained
above is at work, but the effects produced by the fiscal expansion on the
demand for real money balances are now larger, hence a greater change in
the time path of the price level is required to restore the equilibrium.
5.2 Increase in Public Expenditure
Consider now the effects of an increase in public expenditures. Figures 3 and
4 plot the responses of selected variables to a temporary increase in public
expenditure which brings on impact the budget deficit-GDP ratio to 3% and
6%, respectively. The autoregressive coefficient is again assumed to be 0.95.
As before, we consider first the responses of the benchmark economy, with
low debt and wealth effects, described by the continuous lines.
In Figure 3 the expansion generates a decrease in consumption of 1.52%;
the nominal interest rate increases on impact and the price level jumps
upwards by 1.70%. The demand for real money balances reduces on impact
as consequence of the decline in the level of consumption and of the increase
in the opportunity cost of real money holdings. Since the rate of nominal
money growth is kept constant, the equilibrium in the monetary market
is restored by an upward jump of the price level path. Physical capital is
crowded out by public debt and is below its steady state level during the
ECB • Work ing Pape r No 285 • November 200322

adjustment process. It follows that the real interest rate is above its steady
state value. All the effects are larger in Figure 4, where a higher change in
public expenditure is considered.
The dotted lines indicate the percentage deviations of the relevant eco-
nomic variables with no wealth effects. Initially wealth effects amplify the
responses of the nominal interest rate, of the price level and of capital to
increases in public expenditure, while they dampen the effects on consump-
tion. An increase in the level of public expenditure still crowds out private
consumption in the representative agent framework, but consumption is less
reduced on impact when current generations expect to share the burden of
taxation with future generations (human wealth of current generations de-
creases less in the economy with wealth effects). At a later stage however,
the situation is reverted. The ’excessive’ consumption, due to the presence of
wealth effects, determines a larger negative effect on capital accumulation,
and therefore less resources are available for consumption at later stages.
The nominal interest rate of the economy with wealth effects deviates in a
larger measure from the long run level than that of the economy in which
Ricardian Equivalence condition holds. The larger opportunity cost for real
money holdings explains why we observe a larger deviation of the price level
path in the economy with heterogeneity.
The dashed lines illustrate the responses of a high debt economy to a
temporary increase in the level of public expenditure of the same amount.
The downward jump in consumption is smaller than in the low debt case,
because current consumers suffer a smaller reduction in their human wealth.
Since the fiscal adjustment is slower, taxes are more smoothed across gen-
erations and individuals initially reduce their consumption level less. As
explained above, a larger consumption level during the earlier stages deter-
mines larger negative effects on capital and reduces the resources available
for consumption during the later stages. The nominal interest rate is larger
than in the low debt economy, as expected. Again the demand for real
money balances is lower and the deviation of the price level from the steady
state path is larger.
***
This model introduces wealth effects among agents and the time path of
consumption depends on wealth and on the time path of taxes. An increase
in transfers alters the time profile of taxes and, via wealth effects, influ-
ences consumption. An increase in public expenditure crowds out private
ECB • Work ing Pape r No 285 • November 2003 23
consumption and the magnitude of the effect is shown to depend on hetero-
geneity. Changes in consumption plans and in the nominal interest rate alter
the demand for real money balances. Under the assumption of a constant
rate of money growth, the price level deviates from its trend to clear the
money market. In other words, the effects produced by fiscal variables on the
price level are due to the consumers behavior facing a positive probability of
death. Consumers alter their consumption plan in response to fiscal changes
and their choices are shown to depend on the speed of fiscal adjustment and
on the level of the public debt. These effects are rather important quan-
titatively in the second experiment, where public expenditure crowds out
consumption in any case (even when γ = 1) and triggers a pervasive process
of adjustment in the whole economy. Wealth effects explain the difference
in the magnitude of these responses in the three economies considered in
the simulations. On the other hand, the magnitude of the effects produced
by the fiscal expansion on the price level path and on the other economic
variables is minor in the first experiment. The reason is that simulations
are based on a model in which the only source of heterogeneity is a positive,
but low, probability of death. This paper, in fact, expressly considers the
minimum deviation from Ricardian Equivalence, theoretically achievable in
a microfounded optimizing general equilibrium model. The wealth effects
described by the simulations must then be small by construction24.
The departure from Ricardian Equivalence considered in the model, al-
beit small, is sufficient to show the directions in which wealth effects work
in providing a link between fiscal variables and the dynamics of the price
level. It would be interesting to investigate the magnitude of the wealth
effects and the relative consequences for economic policies in the Euro Area,
without any presumption ex ante on the nature of these effects.
6 Conclusions
The Stability and Growth Pact imposes limitations on the size of public
debt and of budget deficit in each country of the EMU. Constraints on fis-
cal policy are considered by policy makers to be necessary to safeguard the
ECB credibility and to ensure price stability. In the absence of fiscal limita-
tions, in fact, political pressures might arise to finance budget deficits with
seignorage and to monetize public debt. The Yaari-Blanchard model offers
an additional perspective to discuss the Stability and Growth Pact. From
24For a survey on the empirical literature on the observed deviations from Ricardian
Equivalence see Mankiw and Elmendorf (1999).
ECB • Work ing Pape r No 285 • November 200324

a theoretical point of view wealth effects provide supplementary reasons to
enforce fiscal convergence in the Euro Area and the respect of both fiscal
requirements: the deficit criterion and the debt criterion.
We have presented a small structural model showing the role of wealth
effects in affecting the dynamic response of the economy to fiscal expansions
entirely financed by future lump-sum taxation. In particular, this paper
shows how temporary fiscal expansions affect the equilibrium conditions in
the money market and negatively affect price stability. Overall the results
suggest that wealth effects enlarge the response of the price level to fiscal
variables. The price level path is always above its long run trend during
the adjustment process. Budgetary policies need not be intertemporally un-
balanced to explain the correlation between fiscal variables and price level
dynamics. All the results are obtained under the assumption of flexible
prices, so that the good’s market is always in equilibrium and the price level
has to change in response to a fiscal expansion to equilibrate the money mar-
ket. In other words, the excess of real money supply requires an increase in
the price level to clear the money market during the adjustment. Moreover,
the model indicates that wealth effects amplify the crowding out of physi-
cal capital due to excessive public debt along the adjustment path, but the
quantitative results of the simulations are obviously driven by unrealistic
assumptions and the role of wealth effects is minor by construction. It also
emerges that public debt-GDP ratio and the degree of fiscal adjustment
influence the responses of the economy to a fiscal expansion. Economies
with higher public debt ratios and slow fiscal adjustment experience larger
deviations of the price level from its trend after a fiscal expansion.
This result of the analysis is in line with the renewed attention paid by
policy makers to the respect of the debt criterion in the Euro Area and with
the insistent recommendations to national governments to run down public
debt towards the 60% of GDP reference value at an adequate pace.
This paper clearly shows the directions in which wealth effects work and
the characteristics of the distortionary effects of fiscal policy and of high
public debt. However, simulation analyses are based on a theoretical model
which considers only a small departure from Ricardian Equivalence and
wealth effects do not seem to significantly affect prices. Given these results,
the natural question to address is the following: does Ricardian Equivalence
hold in the Euro Area? If not, then there is an additional concern for the
monetary authorities and there are extra reasons to enforce the Stability
and Growth Pact. Loose fiscal policies and the lack of fiscal convergence
would make it more difficult the pursuit of price stability. Equilibrium in
the money market would in fact be substantially altered by fiscal expansions
ECB • Work ing Pape r No 285 • November 2003 25

and a whole new game between fiscal and monetary authorities would open
up.
Finally, the model presented, based on several simplifying hypotheses,
can be used as benchmark for future investigations. Extensions should incor-
porate additional sources of heterogeneity other than a small probability of
death, which is the only departure from the representative agent framework
considered in the present paper. In addition, different fiscal adjustment rules
could also be taken into account to analyze the responses of the economy to
a fiscal expansion. Some form of price stickiness could be introduced into
the model, in order to better analyze the short run implications of fiscal
policy. Finally, the model could consider different monetary regimes, such
as inflation targeting or interest rate rules.
ECB • Work ing Pape r No 285 • November 200326

References
[1] Aiyagari, R. S. and Gertler, M. (1985), ”The Backing of Government
Bonds and Monetarism”, Journal of Monetary Economics, 16, 19-44.
[2] Annicchiarico, B. and Marini, G. (2003a), ”Fiscal Policy and Price
Stability”, CeFiMS, Discussion Paper no. 33.
[3] Annicchiarico, B. and Marini, G. (2003b), ”Government Deficits, Con-
sumption and the Price Level”, CeFiMS, Discussion Paper no. 34.
[4] Blanchard, O. J. (1985), ”Debt, Deficits, and Finite Horizons”, Journal
of Political Economy, 93, 223-247.
[5] Blanchard, O. J. and Kahn, C. M. (1980), ”The Solution of Linear
Difference Models under Rational Expectations”, Econometrica, 48(5),
1305-1311.
[6] Brock, W. A. (1975), ”A Simple Perfect Foresight Monetary Model”,
Journal of Monetary Economics, 1, 133-150.
[7] Buiter, W. H. (2002), ”The Fiscal Theory of the Price Level: A Cri-
tique”, The Economic Journal, 112, 459-480.
[8] Cushing, M. J. (1999), ”The Indeterminacy of Prices under Interest
Rate Pegging: The Non-Ricardian Case”, Journal of Monetary Eco-
nomics, 44, 131-148.
[9] Detken, C., (1999), ”Fiscal Policy Effectiveness and Neutrality Results
in a Non-Ricardian World”, ECB Working Paper, no. 3.
[10] Elmendorf, D. and Mankiw G. N., (1999), ”Government Debt”, Hand-
book of Macroeconomics, Vol. 1, Taylor, J.B. and M. Woodford (eds.),
Elsevier Science, B.V., 1999, 1615-1699.
[11] European Central Bank (2003), Annual Report 2002.
[12] European Commission (2003a), Public Finance in EMU, European
Economy, Spring 2003.
[13] European Commission (2003b), Statistical Annex of European Econ-
omy, Spring 2003.
[14] Ganelli, G. (2002), ”Fiscal Policy Rules in an Overlapping Generations
Model with Endogenous Labour Supply”, mimeo, Department of Eco-
nomics, Trinity College Dublin.
ECB • Work ing Pape r No 285 • November 2003 27

[15] Heijdra, B. J. and Van der Ploeg, F. (2002), Foundations of Modern
Macroeconomics, Oxford: Oxford University Press.
[16] Leeper, E. M. (1991), ”Equilibria under ’Active’ and ’Passive’ Monetary
and Fiscal Policy”, Journal of Monetary Economics, 27, 129-147.
[17] Leith, C., and Wren-Lewis, S. (2000), ”Interaction between Monetary
and Fiscal Policy”, The Economic Journal, 110, 93-108.
[18] Leith, C., and Wren-Lewis, S. (2002), ”Compatibility Between Mone-
tary and Fiscal Policy under EMU”, mimeo, University of Glasgow.
[19] Marini, G. and Van der Ploeg, F. (1988), ”Monetary and Fiscal Policy
in an Optimising Model with Capital Accumulation and Finite Lives”,
The Economic Journal, 98, 772-786.
[20] McCallum, B. T. (2001), ”Indeterminacy, Bubbles, and the Fiscal The-
ory of Price Level Determination”, Journal of Monetary Economics, 47,
19-30.
[21] Obstfeld, M. and Rogoff, K. (1996), Foundations of International
Macroeconomics, Cambridge MA: The MIT Press.
[22] Sargent, T. J. and Wallace, N. (1981), ”Some Unpleasant Monetarist
Arithmetic”, Quarterly Review of Minneapolis Federal Reserve Bank,
Fall, 1-17.
[23] Sidrauski, M. (1967), ”Rational Choice and Patterns of Growth in a
Monetary Economy”, American Economic Review, 57, 534-544.
[24] Sims, C. (1994), ”A Simple Model for the Study of the Determination
of the Price Level and the Interaction of Monetary and Fiscal Policy”,
Economic Theory, 4, 381-399.
[25] Smets, F. and Wouters R. (2002), ”Openness, Imperfect Exchange Rate
Pass-Through and Monetary Policy”, Journal of Monetary Economics,
49, 947-981.
[26] Woodford, M. (1994), ”Monetary Policy and Price Level Determinacy
in a Cash-in-Advance Economy”, Economic Theory, 4, 345-380.
[27] Woodford, M. (1995), ”Price Level Determinacy without Control of a
Monetary Aggregate”, Carnegie Rochester Conference Series on Public
Policy, 43, 1-46.
ECB • Work ing Pape r No 285 • November 200328

[28] Yaari, M. E. (1965), ”Uncertain Lifetime, Life Insurance, and the The-
ory of the Consumer”, The Review of Economic Studies, Vol. 32, 137-
150.
ECB • Work ing Pape r No 285 • November 2003 29
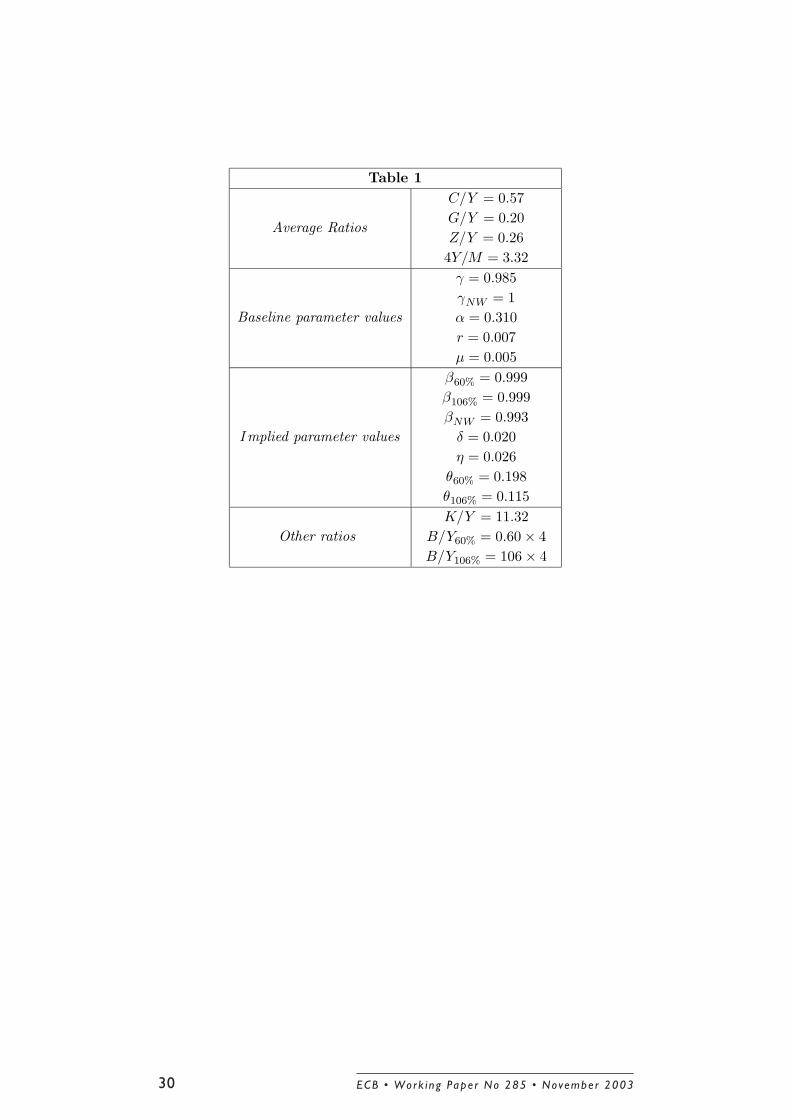
Table 1
Average Ratios
C/Y = 0.57
G/Y = 0.20
Z/Y = 0.26
4Y/M = 3.32
Baseline parameter values
γ = 0.985
γNW = 1
α = 0.310
r = 0.007
µ = 0.005
Implied parameter values
β60% = 0.999
β106% = 0.999
βNW = 0.993
δ = 0.020
η = 0.026
θ60% = 0.198
θ106% = 0.115
Other ratios
K/Y = 11.32
B/Y60% = 0.60 × 4
B/Y106% = 106 × 4
ECB • Work ing Pape r No 285 • November 200330

Appendix
Steady state conditions and implied parameter values
In steady state equations (18) and (24) can be re-written as
δK
Y= 1 −
C
Y−
G
Y(1A)
1 = (r + δ)K
Y+ (1 − α) (2A)
The rate of depreciation δ and the capital/income ratio must satisfy both
conditions. It follows that
K
Y=
α
r− (1 −
C
Y−
G
Y) (3A)
δ =(1 − C
Y− G
Y)
αr− (1 − C
Y− G
Y)
(4A)
The subjective discount factor β is given by equation (23) in steady state
β =
CY
(1 + η) + 1−γγ
[ 11+π
M
Y+ (1 + r)A
Y]
(1 + r)(1 + η)CY
+ (1 − γ)[ 11+π
M
Y+ (1 + r)A
Y]
(5A)
The coefficient η is derived from equation (26)
η =M
C
r + µ(1 + r)
(1 + µ) (1 + r)(6A)
Finally, the critical parameter of the wealth tax must be chosen so as to
keep the budget constraint of the government (25) on balance
θ = r +G
B+
Z
B−
M
B(1 −
1
1 + π) (7A)
Model solution
The relevant matrices that describe the model solution under the assumption
of an annual government debt-GDP ratio equal to 60% are the following
Θ60% =
(.9728 −.0002
−.0206 .8091
)
Φ60% =
(−.0107 −.0003
.0815 .1025
)
ECB • Work ing Pape r No 285 • November 2003 31
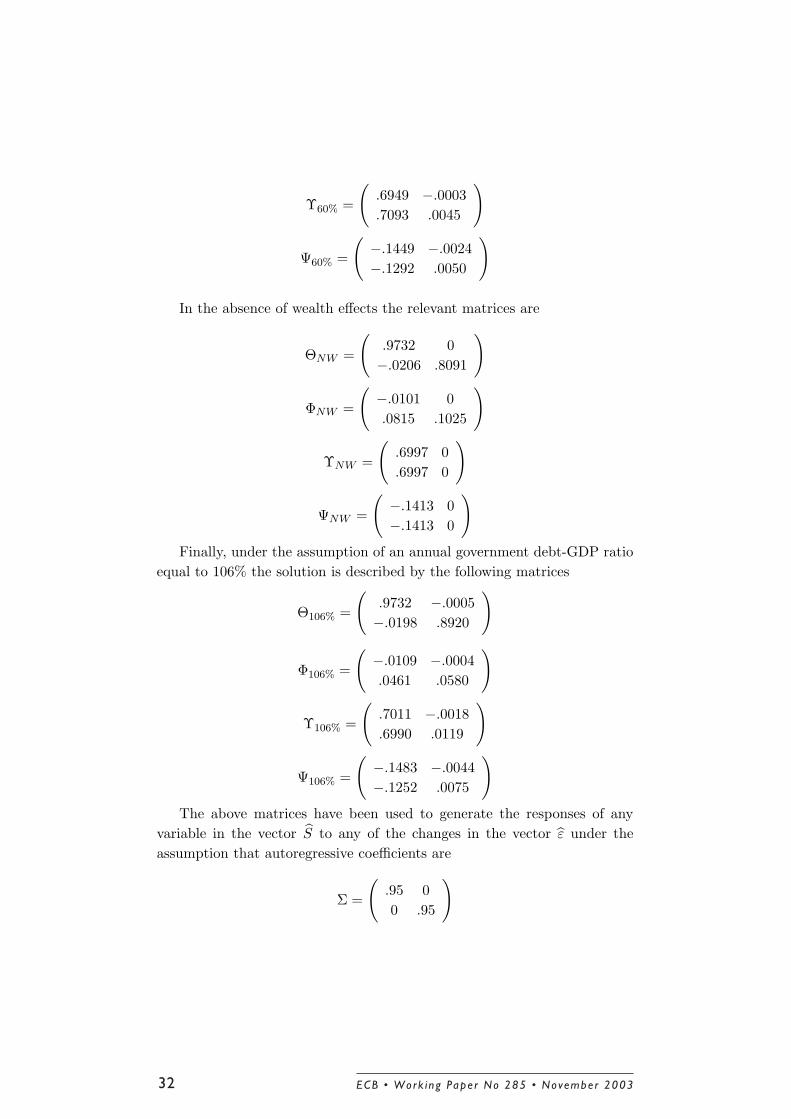
Υ60% =
(.6949 −.0003
.7093 .0045
)
Ψ60% =
(−.1449 −.0024
−.1292 .0050
)
In the absence of wealth effects the relevant matrices are
ΘNW =
(.9732 0
−.0206 .8091
)
ΦNW =
(−.0101 0
.0815 .1025
)
ΥNW =
(.6997 0
.6997 0
)
ΨNW =
(−.1413 0
−.1413 0
)
Finally, under the assumption of an annual government debt-GDP ratio
equal to 106% the solution is described by the following matrices
Θ106% =
(.9732 −.0005
−.0198 .8920
)
Φ106% =
(−.0109 −.0004
.0461 .0580
)
Υ106% =
(.7011 −.0018
.6990 .0119
)
Ψ106% =
(−.1483 −.0044
−.1252 .0075
)
The above matrices have been used to generate the responses of any
variable in the vector S to any of the changes in the vector ε under the
assumption that autoregressive coefficients are
Σ =
(.95 0
0 .95
)
ECB • Work ing Pape r No 285 • November 200332
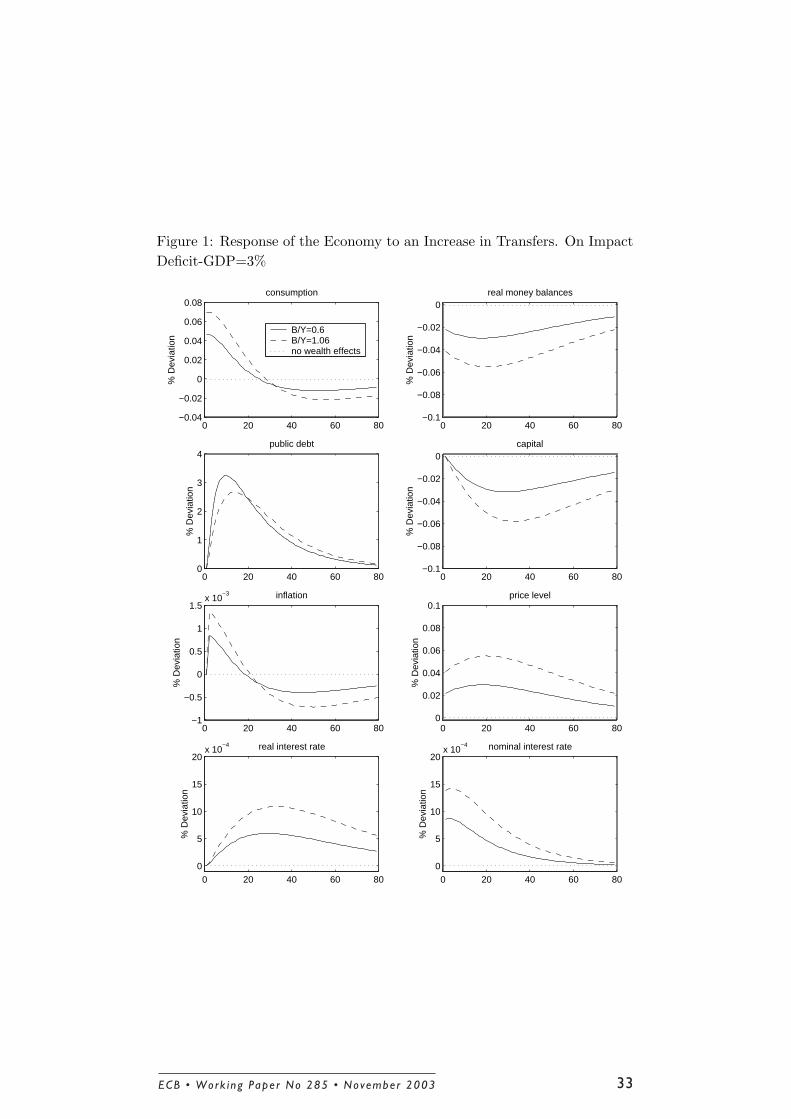
Figure 1: Response of the Economy to an Increase in Transfers. On Impact
Deficit-GDP=3%
0 20 40 60 80−0.04
−0.02
0
0.02
0.04
0.06
0.08consumption
% D
evia
tion
0 20 40 60 80−0.1
−0.08
−0.06
−0.04
−0.02
0real money balances
% D
evia
tion
0 20 40 60 80−1
−0.5
0
0.5
1
1.5x 10
−3 inflation
% D
evia
tion
0 20 40 60 80−0.1
−0.08
−0.06
−0.04
−0.02
0capital
% D
evia
tion
0 20 40 60 800
1
2
3
4public debt
% D
evia
tion
B/Y=0.6 B/Y=1.06 no wealth effects
0 20 40 60 800
0.02
0.04
0.06
0.08
0.1price level
% D
evia
tion
0 20 40 60 800
5
10
15
20x 10
−4 real interest rate
% D
evia
tion
0 20 40 60 800
5
10
15
20x 10
−4 nominal interest rate
% D
evia
tion
ECB • Work ing Pape r No 285 • November 2003 33

Figure 2: Response of the Economy to an Increase in Transfers. On Impact
Deficit-GDP=6%
0 20 40 60 80−0.05
0
0.05
0.1
0.15
0.2consumption
% D
evia
tion
0 20 40 60−0.2
−0.15
−0.1
−0.05
0
real money balances
% D
evia
tion
0 20 40 60 80−2
−1
0
1
2
3
4x 10
−3 inflation
% D
evia
tion
0 20 40 60−0.2
−0.15
−0.1
−0.05
0
capital
% D
evia
tion
0 20 40 60 800
2
4
6
8public debt
% D
evia
tion
B/Y=0.6 B/Y=1.06 no wealth effects
0 20 40 600
0.05
0.1
0.15
0.2price level
% D
evia
tion
0 20 40 60 800
1
2
3
4x 10
−3 real interest rate
% D
evia
tion
0 20 40 60 800
1
2
3
4x 10
−3 nominal interest rate
% D
evia
tion
ECB • Work ing Pape r No 285 • November 200334

Figure 3: Response of the Economy to an Increase in Public Expenditure.
On Impact Deficit-GDP=3%
0 20 40 60 80−2
−1.5
−1
−0.5
0consumption
% D
evia
tion
0 20 40 60 80−2
−1.5
−1
−0.5
0real money balances
% D
evia
tion
0 20 40 60 80−0.025
−0.02
−0.015
−0.01
−0.005
0
0.005inflation
% D
evia
tion
0 20 40 60 80−1.5
−1
−0.5
0capital
% D
evia
tion
0 20 40 60 800
1
2
3
4public debt
% D
evia
tion
B/Y=0.6 B/Y=1.06 no wealth effects
0 20 40 60 800
0.5
1
1.5
2price level
% D
evia
tion
0 20 40 60 800
0.005
0.01
0.015
0.02
0.025real interest rate
% D
evia
tion
0 20 40 60 800
1
2
3
4x 10
−3 nominal interest rate
% D
evia
tion
ECB • Work ing Pape r No 285 • November 2003 35

Figure 4: Response of the Economy to an Increase in Public Expenditure.
On Impact Deficit-GDP=6%
0 20 40 60 80−4
−3
−2
−1
0consumption
% D
evia
tion
0 20 40 60 80−4
−3
−2
−1
0real money balances
% D
evia
tion
0 20 40 60 80−0.06
−0.04
−0.02
0
0.02inflation
% D
evia
tion
0 20 40 60 80−3
−2.5
−2
−1.5
−1
−0.5
0capital
% D
evia
tion
0 20 40 60 800
2
4
6
8public debt
% D
evia
tion
B/Y=0.6 B/Y=1.06 no wealth effects
0 20 40 60 800
1
2
3
4price level
% D
evia
tion
0 20 40 60 800
0.01
0.02
0.03
0.04
0.05
0.06real interest rate
% D
evia
tion
0 20 40 60 800
2
4
6
8x 10
−3 nominal interest rate
% D
evia
tion
ECB • Work ing Pape r No 285 • November 200336

European Central Bank working paper series
For a complete list of Working Papers published by the ECB, please visit the ECBs website(http://www.ecb.int).
202 Aggregate loans to the euro area private sector by A. Calza, M. Manrique and J. Sousa,January 2003.
203 Myopic loss aversion, disappointment aversion and the equity premium puzzle byD. Fielding and L. Stracca, January 2003.
204 Asymmetric dynamics in the correlations of global equity and bond returns byL. Cappiello, R.F. Engle and K. Sheppard, January 2003.
205 Real exchange rate in an inter-temporal n-country-model with incomplete markets byB. Mercereau, January 2003.
206 Empirical estimates of reaction functions for the euro area by D. Gerdesmeier andB. Roffia, January 2003.
207 A comprehensive model on the euro overnight rate by F. R. Würtz, January 2003.
208 Do demographic changes affect risk premiums? Evidence from international data byA. Ang and A. Maddaloni, January 2003.
209 A framework for collateral risk control determination by D. Cossin, Z. Huang,D. Aunon-Nerin and F. González, January 2003.
210 Anticipated Ramsey reforms and the uniform taxation principle: the role of internationalfinancial markets by S. Schmitt-Grohé and M. Uribe, January 2003.
211 Self-control and savings by P. Michel and J.P. Vidal, January 2003.
212 Modelling the implied probability of stock market movements by E. Glatzer andM. Scheicher, January 2003.
213 Aggregation and euro area Phillips curves by S. Fabiani and J. Morgan, February 2003.
214 On the selection of forecasting models by A. Inoue and L. Kilian, February 2003.
215 Budget institutions and fiscal performance in Central and Eastern European countries byH. Gleich, February 2003.
216 The admission of accession countries to an enlarged monetary union: a tentativeassessment by M. CaZorzi and R. A. De Santis, February 2003.
217 The role of product market regulations in the process of structural change by J. Messina,March 2003.
ECB • Work ing Pape r No 285 • November 2003 37

218 The zero-interest-rate bound and the role of the exchange rate for monetary policy inJapan by G. Coenen and V. Wieland, March 2003.
219 Extra-euro area manufacturing import prices and exchange rate pass-through byB. Anderton, March 2003.
220 The allocation of competencies in an international union: a positive analysis by M. Ruta,April 2003.
221 Estimating risk premia in money market rates by A. Durré, S. Evjen and R. Pilegaard,April 2003.
222 Inflation dynamics and subjective expectations in the United States by K. Adam andM. Padula, April 2003.
223 Optimal monetary policy with imperfect common knowledge by K. Adam, April 2003.
224 The rise of the yen vis-à-vis the (synthetic) euro: is it supported by economicfundamentals? by C. Osbat, R. Rüffer and B. Schnatz, April 2003.
225 Productivity and the (synthetic) euro-dollar exchange rate by C. Osbat, F. Vijselaar andB. Schnatz, April 2003.
226 The central banker as a risk manager: quantifying and forecasting inflation risks byL. Kilian and S. Manganelli, April 2003.
227 Monetary policy in a low pass-through environment by T. Monacelli, April 2003.
228 Monetary policy shocks a nonfundamental look at the data by M. Klaeffing, May 2003.
229 How does the ECB target inflation? by P. Surico, May 2003.
230 The euro area financial system: structure, integration and policy initiatives byP. Hartmann, A. Maddaloni and S. Manganelli, May 2003.
231 Price stability and monetary policy effectiveness when nominal interest rates are boundedat zero by G. Coenen, A. Orphanides and V. Wieland, May 2003.
232 Describing the Feds conduct with Taylor rules: is interest rate smoothing important? byE. Castelnuovo, May 2003.
233 The natural real rate of interest in the euro area by N. Giammarioli and N. Valla,May 2003.
234 Unemployment, hysteresis and transition by M. León-Ledesma and P. McAdam,May 2003.
235 Volatility of interest rates in the euro area: evidence from high frequency data byN. Cassola and C. Morana, June 2003.
ECB • Work ing Pape r No 285 • November 200338

236 Swiss monetary targeting 1974-1996: the role of internal policy analysis by G. Rich, June 2003.
237 Growth expectations, capital flows and international risk sharing by O. Castrén, M. Millerand R. Stiegert, June 2003.
238 The impact of monetary union on trade prices by R. Anderton, R. E. Baldwin andD. Taglioni, June 2003.
239 Temporary shocks and unavoidable transitions to a high-unemployment regime byW. J. Denhaan, June 2003.
240 Monetary policy transmission in the euro area: any changes after EMU? by I. Angeloni andM. Ehrmann, July 2003.
241 Maintaining price stability under free-floating: a fearless way out of the corner? byC. Detken and V. Gaspar, July 2003.
242 Public sector efficiency: an international comparison by A. Afonso, L. Schuknecht andV. Tanzi, July 2003.
243 Pass-through of external shocks to euro area inflation by E. Hahn, July 2003.
244 How does the ECB allot liquidity in its weekly main refinancing operations? A look at theempirical evidence by S. Ejerskov, C. Martin Moss and L. Stracca, July 2003.
245 Money and payments: a modern perspective by C. Holthausen and C. Monnet, July 2003.
246 Public finances and long-term growth in Europe evidence from a panel data analysis byD. R. de Ávila Torrijos and R. Strauch, July 2003.
247 Forecasting euro area inflation: does aggregating forecasts by HICP component improveforecast accuracy? by K. Hubrich, August 2003.
248 Exchange rates and fundamentals by C. Engel and K. D. West, August 2003.
249 Trade advantages and specialisation dynamics in acceding countries by A. Zaghini,August 2003.
250 Persistence, the transmission mechanism and robust monetary policy by I. Angeloni,G. Coenen and F. Smets, August 2003.
251 Consumption, habit persistence, imperfect information and the lifetime budget constraintby A. Willman, August 2003.
252 Interpolation and backdating with a large information set by E. Angelini, J. Henry andM. Marcellino, August 2003.
253 Bond market inflation expectations and longer-term trends in broad monetary growth andinflation in industrial countries, 1880-2001 by W. G. Dewald, September 2003.
ECB • Work ing Pape r No 285 • November 2003 39

254 Forecasting real GDP: what role for narrow money? by C. Brand, H.-E. Reimers andF. Seitz, September 2003.
255 Is the demand for euro area M3 stable? by A. Bruggeman, P. Donati and A. Warne,September 2003.
256 Information acquisition and decision making in committees: a survey by K. Gerling,H. P. Grüner, A. Kiel and E. Schulte, September 2003.
257 Macroeconomic modelling of monetary policy by M. Klaeffling, September 2003.
258 Interest rate reaction functions and the Taylor rule in the euro area by P. Gerlach-Kristen, September 2003.
259 Implicit tax co-ordination under repeated policy interactions by M. Catenaro andJ.-P. Vidal, September 2003.
260 Aggregation-theoretic monetary aggregation over the euro area, when countries areheterogeneous by W. A. Barnett, September 2003.
261 Why has broad money demand been more stable in the euro area than in othereconomies? A literature review by A. Calza and J. Sousa, September 2003.
262 Indeterminacy of rational expectations equilibria in sequential financial markets byP. Donati, September 2003.
263 Measuring contagion with a Bayesian, time-varying coefficient model by M. Ciccarelli andA. Rebucci, September 2003.
264 A monthly monetary model with banking intermediation for the euro area byA. Bruggeman and M. Donnay, September 2003.
265 New Keynesian Phillips Curves: a reassessment using euro area data by P. McAdam andA. Willman, September 2003.
266 Finance and growth in the EU: new evidence from the liberalisation and harmonisation ofthe banking industry by D. Romero de Ávila, September 2003.
267 Comparing economic dynamics in the EU and CEE accession countries by R. Süppel,September 2003.
268 The output composition puzzle: a difference in the monetary transmission mechanism inthe euro area and the US by I. Angeloni, A. K. Kashyap, B. Mojon and D. Terlizzese,September 2003.
269 Zero lower bound: is it a problem with the euro area?" by G. Coenen, September 2003.
270 Downward nominal wage rigidity and the long-run Phillips curve: simulation-basedevidence for the euro area by G. Coenen, September 2003.
271 Indeterminacy and search theory by N. Giammarioli, September 2003.
ECB • Work ing Pape r No 285 • November 200340

272 Inflation targets and the liquidity trap by M. Klaeffling and V. López Pérez,September 2003.
273 Definition of price stability, range and point inflation targets: the anchoring of long-terminflation expectations by E. Castelnuovo, S. Nicoletti-Altimari and D. Rodriguez-Palenzuela, September 2003.
274 Interpreting implied risk neutral densities: the role of risk premia by P. Hördahl andD. Vestin, September 2003.
275 Identifying the monetary transmission mechanism using structural breaks by A. Beyer andR. Farmer, September 2003.
276 Short-term estimates of euro area real GDP by means of monthly data by G. Rünstler,September 2003.
277 On the indeterminacy of determinacy and indeterminacy" by A. Beyer and R. Farmer,September 2003.
278 Relevant economic issues concerning the optimal rate of inflation by D. R. Palenzuela,G. Camba-Méndez and J. Á. García, September 2003.
279 Designing targeting rules for international monetary policy cooperation by G. Benignoand P. Benigno, October 2003.
280 Inflation, factor substitution and growth by R. Klump, October 2003.
281 Identifying fiscal shocks and policy regimes in OECD countries by G. de Arcangelis and S. Lamartina, October 2003.
.
282 Optimal dynamic risk sharing when enforcement is a decision variable by T. V. Koeppl,
October 2003.
283 US, Japan and the euro area: comparing business-cycle features by P. McAdam,
November 2003.
284 The credibility of the monetary policy ‘free lunch’ by J. Yetman, November 2003.
ECB • Work ing Pape r No 285 • November 2003 41
285 Government deficits, wealth effects and the price level in an optimizing model
by B. Annicchiarico, November 2003.