governance quality, fairness perceptions, and satisfaction
TRANSCRIPT
Governance Quality, Fairness Perceptions, and Satisfaction with Democracy in Latin America
Gregory W. Saxton, PhD Texas Tech University
*Invited for Revise and Resubmit at Latin American Politics and Society
Abstract:
How do individuals’ fairness judgments affect support for the political system? I argue that when citizens perceive high levels of distributive unfairness in society, they will be less satisfied with the way democracy functions. Yet, good governance – i.e., impartiality in the exercise of political authority – should mitigate the negative influence of perceived distributive unfairness on satisfaction. Using a cross-national analysis of 18 Latin American countries from 2011 to 2015, I demonstrate individuals are significantly less satisfied with democracy when they perceive their country’s income distribution as unfair. Yet, good governance – as indicated by a country’s level of corruption – significantly offsets this negative relationship, even in a region with the highest level of inequality in the world. These findings imply that policymakers can bolster democratic satisfaction, even in places where citizens perceive the income distribution as fundamentally unfair, by committing to good governance and fair democratic procedures.
Keywords: satisfaction with democracy, governance, corruption, inequality, distributive fairness
1
Satisfaction with democracy is a widely used indicator of political support that taps
evaluations the “how the democratic regime works in practice” (Linde and Eckman 2003).
Dissatisfaction with democratic institutions undermines conventional forms of political participation
(Dalton 2004), and it has to potential to undercut the legitimacy required for democracy to
consolidate (Almond and Verba 1963; Linz and Stepan 1996). Despite its importance, however,
satisfaction with democracy is at troubling low levels in a number of Latin American countries. In
Mexico, less than 20 percent of the people interviewed in the 2015 Latinobarometer indicated they
were satisfied with the way their country’s democracy functions, and in Brazil, barely 22 percent of
respondents were satisfied with democracy. This stands in stark contrast to countries such as
Ecuador or Uruguay, where satisfaction with democracy ranges between 60 and 70 percent.
Scholars have grappled to understand why satisfaction with democracy is so low in a number
of Latin American countries. Dissatisfaction with democracy has been linked to poor economic
performance (Booth and Seligson 2009; Dalton 2004), majoritarian electoral systems (Anderson and
Guillory 1997), election scandals (Kumlin and Esaisson 2012), and economic inequality (Anderson
and Singer 2008). A growing body of literature further argues that poor governance and weak state
capacity have resulted in a “crisis of representation,” characterized by widespread disillusionment
and disenchantment with democratic institutions (e.g., Mainwaring 2006), in a number of Latin
American countries. Indeed, poor governance quality – i.e., a lack of impartiality in the exercise of
political authority (Rothstein and Teorell 2008) – is associated with decreased satisfaction not only in
Latin America (Weitz-Shapiro 2008), but in new and mature democracies more generally (Anderson
and Tverdova 2003).
Here, I argue that citizens’ perceptions of the income distribution are another important
determinant of democratic dissatisfaction. Individuals are generally less satisfied when democratic
outcomes do not match their normative expectations about what democracy should do in practice
2
(Singh and Carlin 2015). When citizens perceive or experience distributive unfairness – for example,
when they perceive their country’s income distribution as unfair – this signals that the democratic
process is not producing the outcomes it was intended to produce (Meltzer and Richards 1981).
Yet, when individuals are presented with alternative evidence that democracy is functioning
properly, this suggests that democracy is not to blame for the inequalities that exist in society. In
this paper, I demonstrate that individuals are less satisfied with democracy when they perceive their
country’s income distribution to be unfair. Yet, the presence of good governance (e.g., low levels of
corruption, but also electoral accountability and fair and transparent government decision-making
procedures) can reduce the negative impact of perceived distributive unfairness on democratic
satisfaction. In this way, I demonstrate an important principle of fairness theory: the presence of
fair democratic processes can help mitigate the impact of negative distributive outcomes.
One important contribution of this research is that I investigate factors giving rise to the
frequently documented connection between economic outcomes, governance quality, and political
support. Another contribution is that I draw upon social justice theories to derive new hypotheses
about how people formulate fairness judgments and use these judgments to evaluate democratic
governments. Beyond these theoretical contributions, my findings have a number of broader
implications for policy and democratic consolidation.
As I elaborate in the conclusion, the finding that good governance mitigates the negative
influence of distributive unfairness on democratic satisfaction speaks to a broad literature on
representation, women and politics, and corruption. For instance, prior research finds a robust
correlation between women in government and lower levels of corruption (Bauhr, Charron, and
Wängnerud 2018; Esarey and Schwindt-Bayer 2018; Stensöta, Wängnerud, and Svensson 2015).
Scholars have also begun investigating the mechanisms that explain this relationship (Stensöta and
Wängnerud 2018), demonstrating that citizens believe the government is less corrupt when it is not
3
dominated by political elites or insiders (Barnes and Beaulieu 2019; Barnes, Beaulieu, and Saxton
2018). An implication of this research is that when government is not dominated by elites, citizens
should be more likely to believe the democratic process is functioning properly and that government
is exercising its power transparently and impartially. My findings suggest that initiatives aimed at
reducing corruption, such as increasing the presence of historically marginalized groups in politics,
could help bolster political support in the face of unfair distributive outcomes.
The Sources of Satisfaction with Democracy
Political support, as reflected in satisfaction with democracy, or support for “how the
democratic regime works in practice” (Linde and Eckman 2003), is at low levels in several Latin
American countries. In particular, a number of democracies in the region are experiencing crises of
representation (Mainwaring 2006), party system collapses (Morgan 2011), and the rise of illiberal
populist leaders and political outsiders (Carreras 2012). Low levels of democratic satisfaction are
important because even though such measures of support are not considered indicators of what
Easton (1975) and others term “diffuse” support, they are stable enough to resist the short-term
fluctuations of “specific” support that political authorities tend to face (Dalton 2004). Hence, a
prolonged period of democratic dissatisfaction may have serious consequences for the consolidation
of democracies in the region.
Research on political support posits a number of potential causes of low satisfaction with
democracy. One set of explanations focuses on political institutions and the representative
outcomes they produce. Citizens are generally less satisfied when their normative expectations
about representation and accountability do not align with actual democratic outcomes (Singh and
Carlin 2015). Moreover, democratic satisfaction suffers when citizens are on the losing side of
elections (Anderson et al. 2005), yet this satisfaction gap between electoral winners and losers is
smaller in more proportional systems than in majoritarian ones (Anderson and Guillory 1997).
4
Another set of explanations focuses on citizens’ evaluations of government performance and
suggests that favorable economic outcomes explain political support (Booth and Seligson 2009;
Dalton 2004). In particular, negative evaluations of government performance have an especially
damaging influence on political support in newer, less consolidated democracies (Dahlberg, Linde,
and Holmberg 2015). Meanwhile, others have suggested that citizens care not only about
government outputs, but also about the fairness of democratic procedures (Hibbing and Theiss-
Morse 2001; Van Ryzin 2011). For instance, citizens are less satisfied with democracy when they live
in countries with high corruption (Anderson and Tverdova 2003). By contrast, citizens are more
satisfied with democracy when they perceive that elections hold representatives accountable and
guarantee the voices of all voters are represented (Aarts and Thomassen 2008).
A growing body of research also shows that economic inequality is associated with decreased
political support, such as satisfaction with democracy (Anderson and Singer 2008); support for
democracy (Krieckhaus et al. 2014), and political trust (Córdova and Layton 2016; Zmerli and
Castillo 2015). By giving wealthier individuals a disproportionate amount of political influence
(Gilens 2012), economic inequality violates the key democratic principle of one person, one vote. In
this way, objective economic inequality certainly shapes citizens’ evaluations of democratic
governments.
Yet, when it comes to satisfaction with democracy, I argue that citizens’ perceptions of the
income distribution are equally important. Not only do individuals sometimes underestimate the true
magnitude of income disparities, especially at high levels of inequality (Osberg and Smeeding), but
they also tend to legitimize income differences (Trump 2018) and become less supportive of
redistributive policies (Kelly and Enns 2010) as objective levels of inequality increase. Indeed, in
Latin America objective levels of inequality and citizens’ perceptions of the fairness of the income
distribution are only moderately correlated (See Appendix Figure A1). Below, I advance these
5
scholarly lines of research by examining the relationship between perceptions of distributive fairness,
governance quality, and satisfaction with democracy in Latin America, a region with the highest
levels of economic inequality in the world.
Linking Distributive Unfairness to Political Support
Inequality challenges a fundamental human motivation—people’s desire to live in a just
world (Lerner and Miller 1978). Classic political economy models assume that under democracy the
poor will demand wealth redistribution, thus decreasing economic inequality (Meltzer and Richard
1981). An implication of this “conventional wisdom” is that certain groups of people (i.e., the poor)
dislike inequality, and they dislike it as a matter of resource attribution: resources are finite,
economic resources are concentrated in the hands of the rich, and the poor want a larger share of
these economic resources. Yet, psychological research on social justice suggests that all citizens—
rich and poor alike—should dislike economic disparities, albeit for different reasons. Drawing on
equity theories that date back to Aristotle, this research suggests people care deeply about
proportionality, that is, whether the outcomes that people receive (income and other resources) are
proportional to their inputs (e.g., time and effort) (Jost and Kay 2010). When a CEO is paid 300
times the salary of an average worker for what is perceived to be the same amount of time and
effort, this outcome violates the distributive justice concept of desert, or deservingness (Miller 1999).
Although this disproportionate outcome clearly disadvantages the worker, leaving her to feel angry
or resentful, the CEO should feel guilty about being over-benefitted and should seek to restore
equity (Waksalk et al. 2007).1
Just because individuals dislike social and economic inequalities, however, it remains unclear
whether perceived distributive unfairness should translate into political dissatisfaction. Yet, there is
evidence from Latin America to suggest that citizens draw strong connections between government
(in)action and unfair distributive outcomes. In Argentina, for instance, the vast majority of citizens
6
believe the government should redistribute wealth to reduce economic inequality (Lupu 2016).
Elsewhere in Latin America, public opinion data shows that anywhere from 70 to 90 percent of
citizens indicate that the government “should enact firm policies to reduce inequality”. These data
suggest that people understand how government could implement policies that reduce economic
disparities, and in a context of economic inequality they recognize that the government is not doing
as much as it could to correct for unfair distributive outcomes.
In sum, when people perceive distributive unfairness, resulting from the inaction of
democratic governments, their political satisfaction is likely to suffer. In this way, the distributive
outcomes that individuals experience are not in line with their normative expectations about the
outcomes that the democratic process is supposed to produce (Singh and Carlin 2015). Given this, I
posit:
Hypothesis 1: On average, perceived distributive unfairness will be associated with diminished satisfaction
with democracy.
Perceived Distributive Unfairness in a Context of Good Governance
The above theory and hypothesis posit that citizens’ evaluations of distributive outcomes
shape their support for the political system. Yet, the context in which people form their perceptions
of distributive fairness matters for their political evaluations as well. Specifically, insights from social
psychology suggest that governance quality – i.e., impartiality in the exercise of political authority
(Rothstein and Teorell 2008) – affects how citizens form judgments about distributive fairness and
use these judgments to subsequently evaluate democracy.
People care deeply about the procedures by which political outcomes are produced (André
and Depauw 2017; Hibbing and Theiss-Morse 2001). In particular, good governance, which some
scholars have also referred to as procedural fairness (Linde 2012), should diminish the extent to
which distributive unfairness erodes political support, even in the face of economic inequality. An
7
implication of research on the Fair Process Effect (e.g., van den Bos, Wilke, Lind, and Vermunt
1998) is that governance quality shapes people’s expectations about the outcomes they receive and
their responses to any distributive unfairness they may experience. People desire fair procedures,
such as impartiality in the exercise of political authority (Rothstein and Teorell 2008), because they
are perceived to produce fair outcomes (Thibaut and Walker 1975). Additionally, people are
generally more satisfied with outcomes—unfavorable or otherwise—when they are the result of fair,
impartial, and transparent processes (van den Bos 2005).
Individuals often draw on multiple sources of information when forming their judgments
about fairness and democracy (André and Depauw 2017), and Fairness Heuristic Theory (FTH)
further suggests that governance quality is important when people lack the information they need to
make accurate social comparisons. People often underestimate the true magnitude of income
disparities at high levels of inequality (Osberg and Smeeding 2006), and low status individuals
generally inflate their own position in the income distribution (Aalberg 2003). If and when such
accurate social comparisons are lacking, FTH suggests that people use noneconomic information
about processes and procedures – such as the governance quality – to help form perceptions of
distributive fairness, and consequently evaluations of political support (Magalhães 2016; Van Ryzin
2011).
Following the above logic, in a context of good governance, citizens should react less
unfavorably to social and economic inequalities in the first place. Yet, even when citizens perceive
or experience distributive unfairness, the presence of good governance, such as the impartial
exercise of public power (Linde 2012; Rothstein and Teorell 2008) should make them less likely to
express political dissatisfaction as a result. Distributive unfairness signals to citizens that democracy
is not functioning properly, by challenging their normative expectations about the outcomes that
democracy is supposed to produce in practice (Singh and Carlin 2015). Yet, the presence of good
8
governance should allay citizens’ concerns about perceived distributive injustice by providing
alternative information that democracy is indeed functioning properly, and that democracy is the
most legitimate vehicle for addressing inequities in society.
Hypothesis 2: Good governance will mitigate the negative relationship between perceived distributive unfairness and
satisfaction with democracy.
Evaluating the Relationship between Fairness Perceptions and Satisfaction
with Democracy
Dependent Variable
The dependent variable in this analysis is satisfaction with democracy. Satisfaction with
democracy represents an important and widely used indicator of political support (Norris 2011) that
taps citizens’ evaluations of “how the democratic regime works in practice” (Linde and Ekman
2003). To measure satisfaction with democracy, Latinobarometer asks respondents, “In general,
would you say that you are very satisfied, quite satisfied, not very satisfied, or not at all satisfied with
the working of democracy in your country?” Responses in the analysis are coded such that “not at
all satisfied” (coded 1); “not very satisfied” (2); “quite satisfied” (3); and “very satisfied” (4). When
pooling data across country-year surveys, the average response to this question is 2.4 and the modal
response is 2 (“not very satisfied”), although there is considerable variation in satisfaction with
democracy across Latin American countries.
Independent Variables
Perceptions of Distributive Unfairness: The primary individual-level predictor of
satisfaction with democracy, perceptions of distributive unfairness, is based on the Latinobarometer
question, “How fair do you think the income distribution is in your country?” This survey item is
ideal for the research at hand: it maps onto the core theoretical concept—i.e., fairness perceptions, as
opposed to assessments or evaluations of actual inequality—remarkably well. Cross-national public
9
opinion surveys frequently ask respondents whether they think the gap between the rich and poor is
getting bigger or smaller, but just because individuals perceive inequality to be on the rise, they will
not necessarily respond negatively to it (Trump 2018). Latinobarometer is one of the few surveys
that consistently asks this question about distributive fairness perceptions. Responses range from “very
fair” (coded 1) to “very unfair” (4), and the mean and modal response to this question is 3
(“unfair”).
Governance Quality: In addition to individual-level factors, I hypothesize that governance
quality should ameliorate the negative influence of perceived distributive unfairness on political
support. One important indicator of governance quality is corruption, which conveys important
messages to citizens about the fairness of government policies and processes. Corruption on the part
of government officials violates “the belief that the authority makes genuine attempts at being fair
and ethical” (Tyler and Lind 1992). It sends a signal that certain people are above the law, and that
all citizens are not treated equally (Linde 2012, 413). In addition to affecting citizens’ judgments
about fairness, corruption also impedes government capacity (Graycar and Villa 2011), hinders the
political advancement of politically marginalized groups, such as women (Stockemer and Sundström
2019; Sundström and Wängnerud 2016), and undermines electoral accountability and democratic
legitimacy more generally (Bauhr and Charron 2018; Booth and Seligson 2009; Kumlin and Esaisson
2012; Linde and Erlingsson 2013).
Corruption is salient and pervasive in a number of Latin American countries, at all levels of
government. In the 2015 Latinobarometer, nearly 20 percent of all respondents indicated that they
or a family member had personally witnessed an act of corruption or bribe taking by a politician or
government official in the last year. Themes about corruption, inequality, and support for the
political system are also evident in elite and media discourse in Latin America. An article in Clarín, a
national newspaper in Argentina, reported in 2018, for instance: “It would seem that a kind of
10
vicious circle has been generated between corruption, the unequal distribution of power in society
and inequality in the distribution of wealth. Corruption is destroying the fabric of society and the
confidence of the population in the political system and its leaders.”2
Previous research has identified a number of different ways for measuring governance
quality, one of which is corruption. In the results below, I operationalize governance quality as control
of corruption, using a measure from the World Bank’s Worldwide Governance Indicators (WGI)
project (Kaufmann, Kraay, and Mastruzzi 2011). Control of corruption captures “[expert] perceptions
of the extent to which public power is exercised for private gain, including both petty and grand
forms of corruption, as well as ‘capture’ of the state by elites and private interests.” The control of
corruption figures used in this analysis correspond to the year immediately preceding the respective
Latinobarometer wave. The control of corruption measure theoretically ranges from -2.5 to 2.5, with
higher values indicating lower levels of corruption. In this sample, the control of corruption measure
ranges from -1.38 (Venezuela in 2015) to 1.56 (Chile in 2013), with a mean value of -.30. In
Appendix Table A1 and Figure A2, I demonstrate that the results are also robust to other measures
of governance quality, including WGI measures of rule of law, voice and accountability, and government
effectiveness, as well as an alternative corruption measure from the Bayesian Corruption Index
(Standaert 2015).
Control Variables
To control for potential sources of spuriousness, I include a number of individual-level
variables that existing research consistently shows to be important predictors of support for the
political system and that theoretically could correlate with perceptions of distributive unfairness,
particularly: support for the incumbent government and perceptions of the national economy.
Individuals who approve of the incumbent and express favorable evaluations of the economy are
more likely to support the political system (e.g., Anderson et al. 2005; McAllister 1999), and these

11
individuals could be less likely to blame the government for unfavorable distributive outcomes.
Support for the incumbent comes from the question, “Do you approve or not of the performance of the
government led by President (name)?” Responses are coded such that 0=Disapprove and
1=Approve. Perceptions of the national economy comes from the question, “Do you consider the
country’s present economic situation to be better (coded 1), a little better (2), the same (3), a little
worse (4), or much worse (5) than 12 months ago?” I also control for political ideology: “In politics,
people normally speak of ‘left’ and ‘right.’ On a scale where 0 is left and 10 is right, where would you
place yourself.” To rule out the possibility that socioeconomic factors are driving both satisfaction
with democracy and perceptions of distributive unfairness, I control for wealth quintile (Córdova
2009) and education, as well as respondent’s sex, subjective social class, age, and whether the
respondent lives in a rural area.
In addition to individual-level covariates, I control for factors at the country-level that could
theoretically correlate with fairness perceptions and political support, particularly aggregate levels of
inequality. Although the focus here is on perceptions of fairness of the income distribution, as
opposed to objective levels of inequality, there is reason to suspect that aggregate inequality could
affect both perceptions of distributive unfairness (Trump 2018) and satisfaction with democracy
(Anderson and Singer 2008). To account for this possibility, I include a measure of net national-
level income inequality from the Standardized World Income Inequality Database (Solt 2016).
Inequality figures represent the most recent available Gini coefficients prior to the survey year.
Also, given that recent research has shown that the level of government involvement in the
economy conditions the relationship between citizens’ economic evaluations and satisfaction with
democracy (Tang and Naris 2019), I include a control from the Fraser Institute’s Economic Freedom of
the World that captures the extent of the government’s economic engagement (higher values
correspond to less engagement).
12
Prior research has also shown that women’s presence in government reduces corruption
(Esarey and Chirillo 2013; Dollar, Fisman, and Gatti 2001) and increases satisfaction with democracy
(Schwindt-Bayer 2010). As such, I demonstrate that the results are robust when controlling for the
percentage of women in the legislature in Appendix Table A2. Given the previously documented
connection between evaluations of the economy and political support (e.g., Booth and Seligson
2009), I also show that the main results are robust when controlling for gross national income
(GNI) per capita and GDP change (Appendix Table A2). Finally, given that the democratic context
in a country could affect individuals’ evaluations of how well democracy is performing, I include two
additional robustness checks in the appendix. First, I estimate a model controlling for a country’s
Freedom House political rights score. Second, I re-estimate the model from the main analysis and
exclude any nondemocracies from the sample. I do not include a control for level of democracy in
the main analysis because of its high correlation with governance quality.
Methodology
To test my hypotheses, I conduct a multilevel analysis of individual responses from three
different waves of the Latinobarometer survey, covering 18 Latin American countries from 2011-
2015, in conjunction with country-level measures of income inequality, state involvement in the
economy, and governance quality. Given the nested nature of my survey data, with individuals (level
1) nested within surveys (level 2) nested within countries (level 3), a multilevel model is appropriate.
However, given that there are only 18 observations at the highest level, modeling country-level
effects presents its own problems (Stegmueller 2013). Rather, I use a two-level model for the main
analysis in which individuals are nested within 54 country-waves, and following Heisig and Schaeffer
(2019), I include a random slope for the individual-level independent variable, perceived distributive
13
unfairness, in all of the models.3 As a robustness check, I estimate a three level model in the
Appendix Table A3.
Results of the Cross-National Analysis
Model 1 in Table 1 presents a baseline model without any higher-order covariates or
interactions. The first thing to notice in Model 1 is that the variable for perceived distributive unfairness
has a negative and statistically significant coefficient. Model 2 includes the country-level measure of
governance quality (control of corruption), and Model 3 includes all higher-level covariates. As with
Model 1, the coefficient on the variable for perceived distributive unfairness is negative and statistically
significant in Models 2 and 3, thus lending support for Hypothesis 1. On average, individuals are less
likely to be satisfied with democracy when they perceive their country’s income distribution as
unfair. In Model 4, I include a cross-level interaction between perceived distributive unfairness and
governance quality to test Hypothesis 2. Lending preliminary support to Hypothesis 2, the interaction
term in Model 4 is significant. The control variables in Table 1, which allow me to account for a
number of possible sources of spuriousness, all behave largely as expected and consistent with prior
research. In particular, the models in Table 1 allow me to demonstrate that the relationship between
perceived distributive unfairness and satisfaction with democracy holds even when taking into
account actual levels of inequality, economic evaluations, incumbent approval, and a number of
socioeconomic factors that have previously been shown to predict political support.
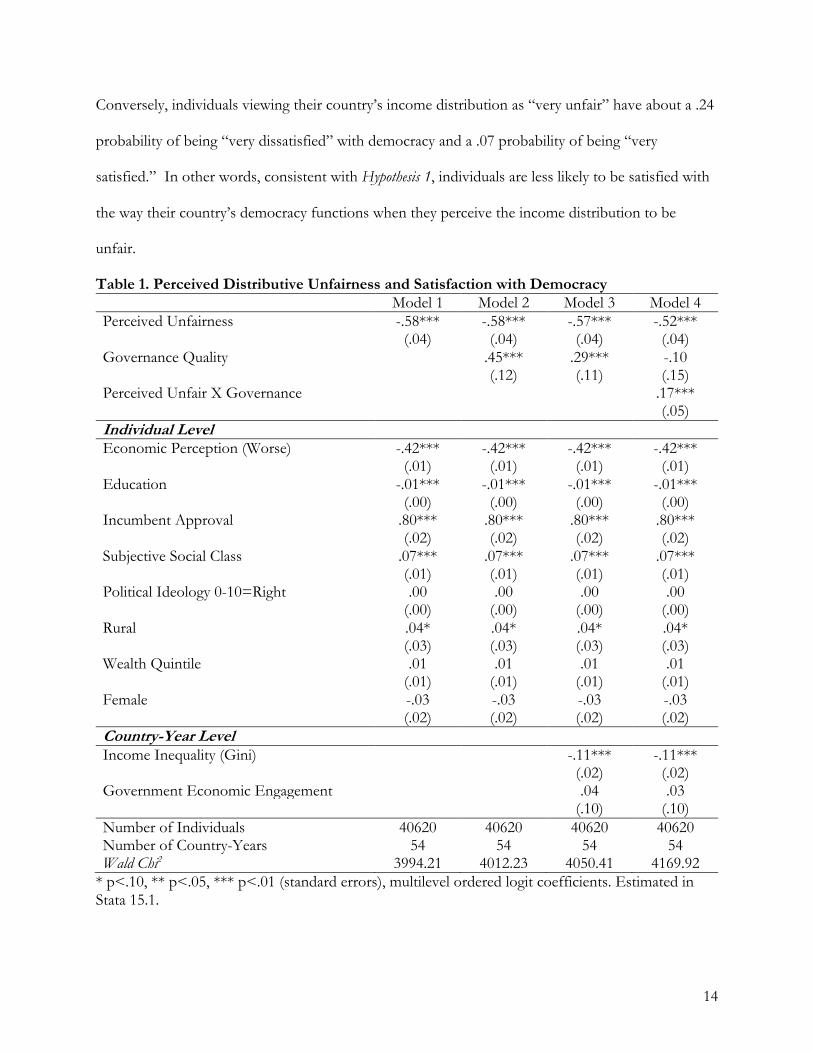
While the results in Table 1 are consistent with the hypothesized relationship between
perceived distributive unfairness and satisfaction with democracy (Hypothesis 1), substantive effects
are difficult to intuit from nonlinear models. With this in mind, I use the results in Table 1, Model 4
to calculate a series of predicted probabilities. In substantive terms, when individuals perceive their
country’s income distribution as “very fair,” they have about a .06 probability of being “very
dissatisfied” with democracy and a .23 probability of being “very satisfied” with democracy.
14
Conversely, individuals viewing their country’s income distribution as “very unfair” have about a .24
probability of being “very dissatisfied” with democracy and a .07 probability of being “very
satisfied.” In other words, consistent with Hypothesis 1, individuals are less likely to be satisfied with
the way their country’s democracy functions when they perceive the income distribution to be
unfair.
Table 1. Perceived Distributive Unfairness and Satisfaction with Democracy Model 1 Model 2 Model 3 Model 4 Perceived Unfairness -.58*** -.58*** -.57*** -.52*** (.04) (.04) (.04) (.04) Governance Quality .45*** .29*** -.10 (.12) (.11) (.15) Perceived Unfair X Governance .17*** (.05) Individual Level Economic Perception (Worse) -.42*** -.42*** -.42*** -.42*** (.01) (.01) (.01) (.01) Education -.01*** -.01*** -.01*** -.01*** (.00) (.00) (.00) (.00) Incumbent Approval .80*** .80*** .80*** .80*** (.02) (.02) (.02) (.02) Subjective Social Class .07*** .07*** .07*** .07*** (.01) (.01) (.01) (.01) Political Ideology 0-10=Right .00 .00 .00 .00 (.00) (.00) (.00) (.00) Rural .04* .04* .04* .04* (.03) (.03) (.03) (.03) Wealth Quintile .01 .01 .01 .01 (.01) (.01) (.01) (.01) Female -.03 -.03 -.03 -.03 (.02) (.02) (.02) (.02) Country-Year Level Income Inequality (Gini) -.11*** -.11*** (.02) (.02) Government Economic Engagement .04 .03 (.10) (.10) Number of Individuals 40620 40620 40620 40620 Number of Country-Years 54 54 54 54 Wald Chi2 3994.21 4012.23 4050.41 4169.92
* p<.10, ** p<.05, *** p<.01 (standard errors), multilevel ordered logit coefficients. Estimated in Stata 15.1.
15
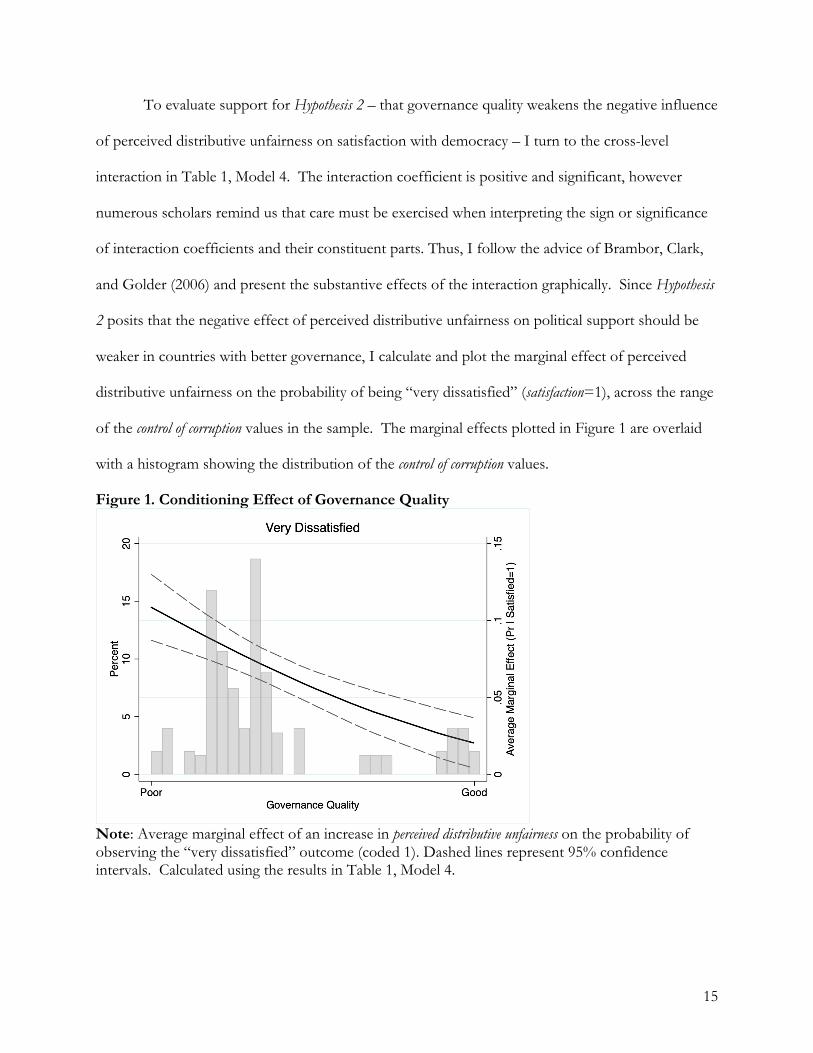
To evaluate support for Hypothesis 2 – that governance quality weakens the negative influence
of perceived distributive unfairness on satisfaction with democracy – I turn to the cross-level
interaction in Table 1, Model 4. The interaction coefficient is positive and significant, however
numerous scholars remind us that care must be exercised when interpreting the sign or significance
of interaction coefficients and their constituent parts. Thus, I follow the advice of Brambor, Clark,
and Golder (2006) and present the substantive effects of the interaction graphically. Since Hypothesis
2 posits that the negative effect of perceived distributive unfairness on political support should be
weaker in countries with better governance, I calculate and plot the marginal effect of perceived
distributive unfairness on the probability of being “very dissatisfied” (satisfaction=1), across the range
of the control of corruption values in the sample. The marginal effects plotted in Figure 1 are overlaid
with a histogram showing the distribution of the control of corruption values.
Figure 1. Conditioning Effect of Governance Quality
Note: Average marginal effect of an increase in perceived distributive unfairness on the probability of observing the “very dissatisfied” outcome (coded 1). Dashed lines represent 95% confidence intervals. Calculated using the results in Table 1, Model 4.
16
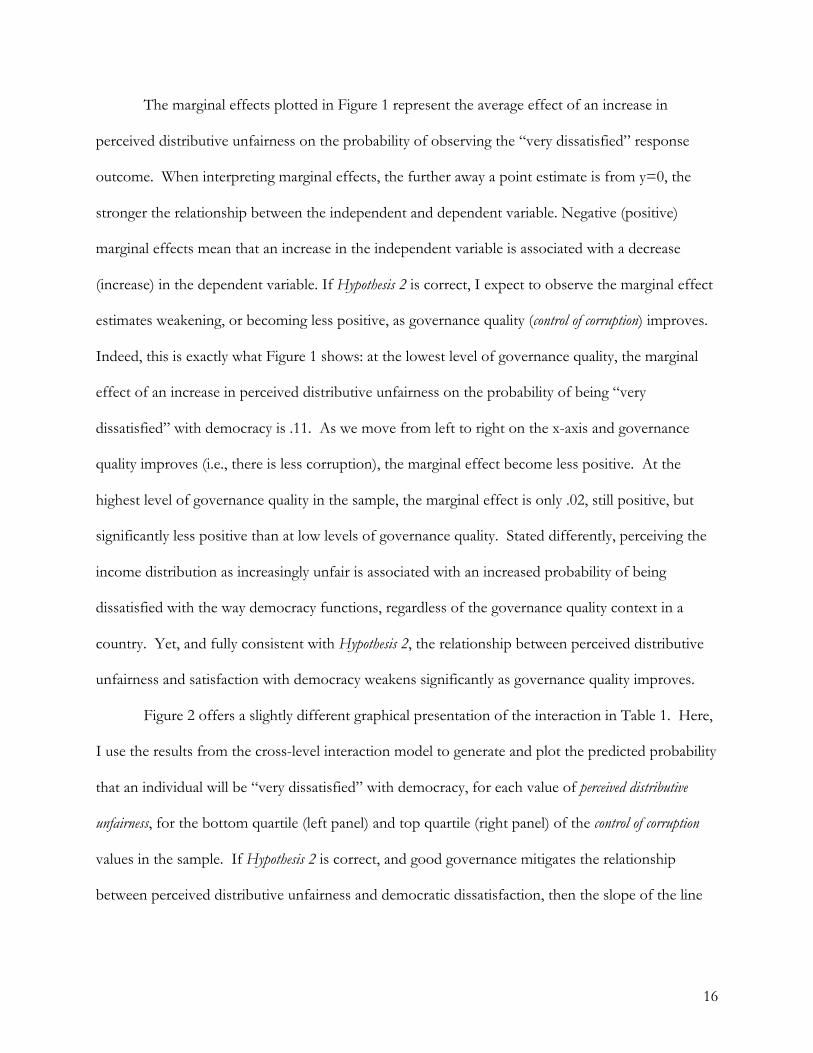
The marginal effects plotted in Figure 1 represent the average effect of an increase in
perceived distributive unfairness on the probability of observing the “very dissatisfied” response
outcome. When interpreting marginal effects, the further away a point estimate is from y=0, the
stronger the relationship between the independent and dependent variable. Negative (positive)
marginal effects mean that an increase in the independent variable is associated with a decrease
(increase) in the dependent variable. If Hypothesis 2 is correct, I expect to observe the marginal effect
estimates weakening, or becoming less positive, as governance quality (control of corruption) improves.
Indeed, this is exactly what Figure 1 shows: at the lowest level of governance quality, the marginal
effect of an increase in perceived distributive unfairness on the probability of being “very
dissatisfied” with democracy is .11. As we move from left to right on the x-axis and governance
quality improves (i.e., there is less corruption), the marginal effect become less positive. At the
highest level of governance quality in the sample, the marginal effect is only .02, still positive, but
significantly less positive than at low levels of governance quality. Stated differently, perceiving the
income distribution as increasingly unfair is associated with an increased probability of being
dissatisfied with the way democracy functions, regardless of the governance quality context in a
country. Yet, and fully consistent with Hypothesis 2, the relationship between perceived distributive
unfairness and satisfaction with democracy weakens significantly as governance quality improves.
Figure 2 offers a slightly different graphical presentation of the interaction in Table 1. Here,
I use the results from the cross-level interaction model to generate and plot the predicted probability
that an individual will be “very dissatisfied” with democracy, for each value of perceived distributive
unfairness, for the bottom quartile (left panel) and top quartile (right panel) of the control of corruption
values in the sample. If Hypothesis 2 is correct, and good governance mitigates the relationship
between perceived distributive unfairness and democratic dissatisfaction, then the slope of the line
17
for perceived distributive unfairness should be steeper in a context of poor governance than a context of
good governance.
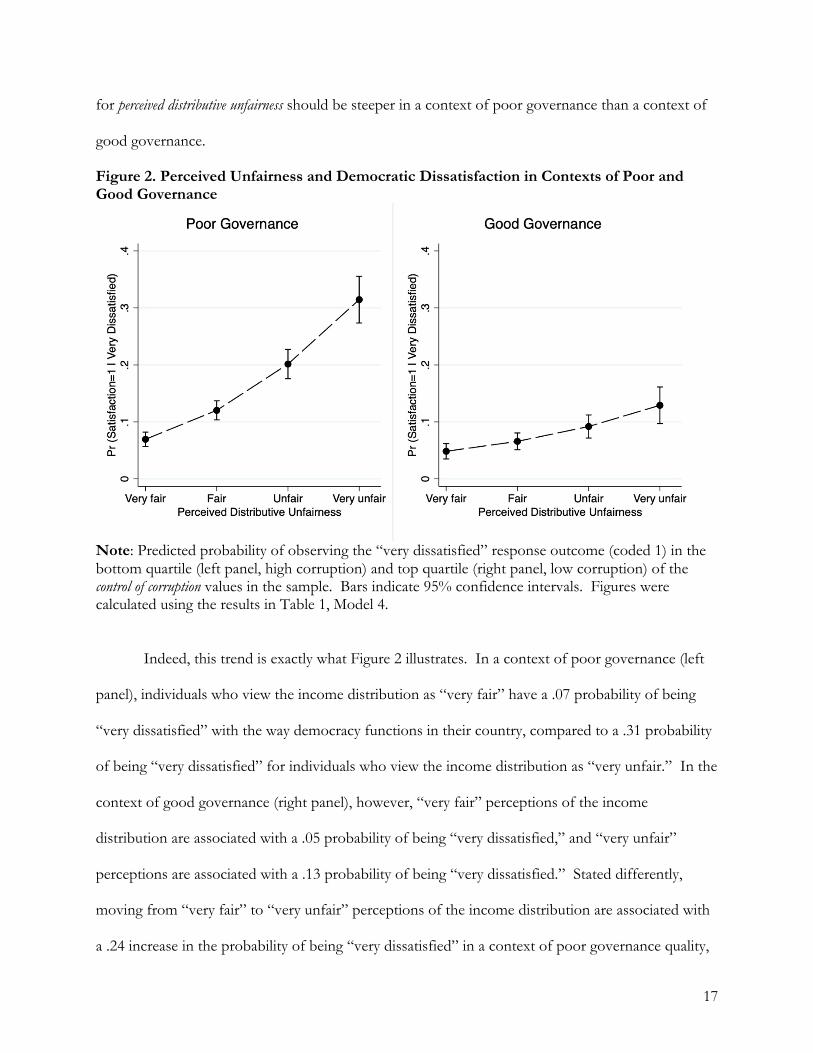
Figure 2. Perceived Unfairness and Democratic Dissatisfaction in Contexts of Poor and Good Governance
Note: Predicted probability of observing the “very dissatisfied” response outcome (coded 1) in the bottom quartile (left panel, high corruption) and top quartile (right panel, low corruption) of the control of corruption values in the sample. Bars indicate 95% confidence intervals. Figures were calculated using the results in Table 1, Model 4.
Indeed, this trend is exactly what Figure 2 illustrates. In a context of poor governance (left
panel), individuals who view the income distribution as “very fair” have a .07 probability of being
“very dissatisfied” with the way democracy functions in their country, compared to a .31 probability
of being “very dissatisfied” for individuals who view the income distribution as “very unfair.” In the
context of good governance (right panel), however, “very fair” perceptions of the income
distribution are associated with a .05 probability of being “very dissatisfied,” and “very unfair”
perceptions are associated with a .13 probability of being “very dissatisfied.” Stated differently,
moving from “very fair” to “very unfair” perceptions of the income distribution are associated with
a .24 increase in the probability of being “very dissatisfied” in a context of poor governance quality,
18
but only a .08 increase in the probability of being “very dissatisfied” in a context of good governance
quality.
Consistent with Hypothesis 2, the results in Figure 2 show that the context in which people’s
perceptions of fairness are formed matters a great deal for whether or not perceived distributive
unfairness will be associated with diminished satisfaction with democracy. In a context of good
governance, perceptions of the fairness of the income distribution are only loosely associated with
satisfaction. In countries with poor governance quality, there is a significant satisfaction gap
between individuals who view the income distribution as “very fair” compared to “very unfair,” with
individuals who view their country’s income distribution as unfair being more dissatisfied with
democracy than anywhere else in Latin America. Taken together Figures 1 and 2 lend strong support
to the theoretical argument that good governance mitigates the relationship between perceived
distributive unfairness and democratic dissatisfaction.
Discussion and Conclusion
Political support is at troubling low levels and has been steadily declining during the last
decade in a number of Latin American countries. In Brazil, for instance, recent high-profile
corruption scandals coupled with a severe economic recession have left citizens disillusioned with
their democratic institutions (Lopes 2018). Prior research has linked dissatisfaction and
disenchantment with democratic institutions to weak state capacity and poor governance (Anderson
and Tverdova 2003; Kumlin and Esaisson 2012; Mainwaring 2006; Weitz-Shapiro 2008), legislative
gridlock (Singh and Carlin 2015), and economic inequality (Anderson and Singer 2008). I advance
these scholarly lines of inquiry by examining how individuals’ perceptions of distributive unfairness
affect their satisfaction with the way democracy works, and how this relationship is conditioned by
the quality of governance in a country. Citizens become dissatisfied with democracy when their
normative expectations about what democracy should produce do not align with the democratic
19
outcomes they experience (Singh and Carlin 2015). When citizens perceive distributive outcomes to
be unfair, they are less likely to be satisfied with the way democracy functions in their country. Yet,
when citizens are presented with alternative evidence that democracy is functioning properly, such
as the presence of good governance, their concerns about distributive unfairness are allayed.
Using a multilevel analysis of public opinion data from 18 Latin American countries (2011-
2015), I demonstrate that citizens who perceive their country’s income distribution to be unfair are
less likely to be satisfied with the way democracy. Moreover, this relationship holds even after
controlling for other previously theorized determinants of political support, such as aggregate levels
of income inequality, approval of the incumbent government, retrospective economic evaluations,
political ideology, and socioeconomic factors such as wealth and education. This large-N cross-
national analysis also shows that although perceptions of distributive unfairness are associated with
lower democratic satisfaction for all citizens, on average, this relationship is weakest in a context of
good governance. Empirically, these results demonstrate that as corruption decreases, the negative
relationship between perceptions of distributive unfairness and satisfaction with democracy weakens
significantly as well.
Although the empirical analysis in this paper employs a broad measure of corruption that
captures petty and grand forms of corruption, as well as state capture by political elites and private
interests, future research should examine whether different forms of corruption condition the
relationship between perceptions of distributive unfairness and political support in the same manner.
Bauhr (2017), for instance, finds that citizens mobilize to fight corruption when corruption is
needed to gain access to public services, but not when corruption grants special advantages to
private actors such as government contractors.
Future research should also consider whether corruption affects the relationship between
perceived distributive unfairness and political support in the same manner for different groups of
20
citizens. For instance, prior research has shown that even when citizens are aware of corruption,
individual-level characteristics such as gender (Barnes and Beaulieu 2014) and partisanship (Beaulieu
2014; Holman and Lay 2018) condition the relationship between corruption and individuals’
assessments of political institutions and the fairness of government processes, such as elections.
Prior research has also shown that members of clientelistic patronage networks are more tolerant of
corruption (Chang and Kerr 2017), as are supporters of the incumbent administration (Anderson
and Tverdova 2003). When it comes to evaluating democracy, those of the left of the political
spectrum may be more concerned about distributive unfairness than those on the political Right.
Indeed, Anderson and Singer’s (2008) seminal finding that income inequality is associated with lower
satisfaction with democracy in Europe is primarily driven by those on the political Left, and research
on the moral foundations of political ideology (e.g., Graham, Haidt, and Nosek 2009) suggests that
those on the political Left should be more moralize outcomes they perceive as unfair or harmful to
others, whereas those on the political Right tend to care more about order, authority, and the rule of
law.
Prior research also suggests that education may condition the relationship between fairness
perceptions, governance quality, and satisfaction. For instance, Hakhverdian and Mayne (2012) find
that educated individuals are more sensitive to corruption when it comes to evaluating political
institutions because they have a higher capacity to monitor governance quality and because they are
more normatively troubled by corrupt practices. Finally, income or class status could further
condition the relationships examined here. Prior research on system justification theory suggests
that higher status individuals are more likely to legitimize group differences by adopting narratives
about deservingness or meritocracy to understand inequality (Jost and Hunyady 2003), and recent
research find that economic inequality hampers the positive effect of improvements in governance
capacity on political trust, especially among the poor (Córdova and Layton 2016).
21
Finally, it is important to note that the interaction between perceived distributive unfairness
and governance quality could be explained by alternative theoretical approaches. The arguments
developed in this paper, which are empirically supported, suggest that good governance mitigates
citizens’ concerns about inequality and distributive unfairness when it comes to evaluating democracy.
However, it is also possible that perceptions of distributive fairness could mitigate citizens’ concerns
about governance quality. Zechmeister and Zizumbo-Colunga (2013) find, for instance, that
individuals who espouse subjectively positive economic evaluations are more likely to discount
corruption when it comes to presidential approval. Future research, including the use of
experimental methods, could shed further light on the mechanisms that explain the empirical
findings in this and other studies.
Poverty and distributive unfairness are widespread problems that have the potential to
undermine not only support for the political system, but also political engagement and participation
(Solt 2008). People care a great deal about fairness, and when they perceive patently unfair
outcomes, such as an unfair distribution of wealth or income, they are less likely to be satisfied with
their democratic government. On the one hand, this may be troubling for the prospects of
democracy in regions such as Latin America: despite some recent declines in inequality, citizens
across Latin America overwhelmingly perceive their countries’ income distributions as unfair. As
this research shows, high levels of perceived distributive unfairness harm satisfaction with
democracy, and thus undermine the widespread democratic “buy-in” that is crucial for democracy to
consolidate (Linz and Stepan 1996).
Yet, these findings also provide some room for optimism, and they speak to broader themes
in the literature on governance quality and corruption more generally. By delivering quality
governance—for instance, by combatting corruption—political authorities in democracies can
effectively offset the negative influence of perceived distributive unfairness on satisfaction with
22
democracy, even in a context of high inequality. One way to effectively combat corruption is to
enhance political accountability. A study of local governments in Brazil, for instance, found
significantly less corruption in municipalities where mayors were eligible for reelection (Ferraz and
Finan 2011).
Prior research has also suggested that incorporating more women into governmental office
could prove a successful anti-corruption reform. There is a robust and negative correlation between
the presence of women in government and corruption (Esarey and Chirillo 2013; Dollar, Fisman,
and Gatti 2001), particularly in legislative institutions (Stensöta, Wängnerud, and Svensson 2015) and
in democracies with high electoral accountability (Esarey and Schwindt-Bayer 2018). Moreover,
women’s descriptive representation (Watson and Moreland 2014), as well as formal representation in
the form of gender quotas (Schwindt-Bayer 2010), is associated with reduced suspicions of
corruption among citizens. These findings are bolstered by more recent research showing women
to be less corrupt than men (Bauhr, Charron, and Wängnerud 2018), as well as evidence from survey
experiments (Barnes et al. 2018) showing that citizens believe increasing women’s presence in
government is successful for reducing corruption. Beyond bolstering satisfaction with democracy,
low levels of corruption signal to citizens that government is not dominated by elites, that the
democratic process is functioning properly, and that policies are being made and administered via
fair, impartial, and transparent procedures. In sum, democratic governments and political elites can
foster accountability, transparency, and rule of law. When fair procedures for governing are in place,
citizens may still perceive unfair distributive outcomes, but they are more likely to also believe that
democracy is the most legitimate vehicle for addressing their country’s most pressing concerns.
23
1 In Latin America, perceptions of distributive unfairness are similar across wealth quintiles
(Latinobarometer 2011-2015), and neither wealth quintile nor class self-placement are significant
predictors of perceived unfairness.
2 https://tinyurl.com/yxh75cn9
3 Given that there is not consensus in the literature about whether or not to include a random slope
in models with cross-level interactions (e.g., Snijders and Bosker 2012), I show in the Appendix
Table A3 that my results do not hinge on this modeling choice.
24
References
Aalberg, Toril. 2003. Achieving Justice Comparative Public Opinion on Income Distribution. Leiden ;
Boston: Leiden ; Boston : Brill.
Aarts, Kees, and Jaccques Thomassen. 2008. "Satisfaction with Democracy: Do Institutions
Matter?". Electoral Studies 27: 5-18.
Almond, Gabriel A, and Sidney Verba. 1963. The Civic Culture: Political Attitudes and Democracy in Five
Nations: Sage.
Anderson, Christopher, André Blais, Shaun Bowler, Todd Donovan, and Ola Listaug. 2005. Losers'
Consent: Elections and Democratic Legitimacy. New York: Oxford University Press.
Anderson, Christopher, and Christine A. Guillory. 1997. "Political Institutions and Satisfaction
with Democracy: A Cross-National Analysis of Consensus and Majoritarian Systems."
American Political Science Review 91: 66-81.
Anderson, Christopher J., and Yuliya V. Tverdova. 2003. "Corruption, Political Allegiances, and
Attitudes toward Government in Contemporary Democracies." American Journal of Political
Science 47: 91-109.
Anderson, Christopher, and Matthew Singer. 2008. "The Sensitive Left and the Impervious Right:
Multilevel Models and the Politics of Inequality, Ideology, and Legitimacy in Europe."
Comparative Political Studies 41: 564.
Andre, Audrey, and Sam Depauw. 2017. "The Quality of Representation and Satisfaction with
Democracy: The Consequences of Citizen-Elite Policy and Process Congruence." Political
Behavior 39: 377-97.
Barnes, Tiffany D, and Emily Beaulieu. 2014. "Gender Stereotypes and Corruption: How
Candidates Affect Perceptions of Election Fraud." Politics & Gender 10: 365-91.
25
Barnes, Tiffany D., and Emily Beaulieu. 2019. "Women Politicians, Institutions, and Perceptions of
Corruption." Comparative Political Studies 52: 134-67.
Barnes, Tiffany D., Emily Beaulieu, and Gregory W. Saxton. 2018. "Restoring Trust in the Police:
How Female Officers Reduce Suspicions of Corruption." Governance 31: 143-61.
Bauhr, Monika, and Nicholas Charron. 2018. "Insider or Outsider? Grand Corruption and
Electoral Accountability." Comparative Political Studies 51: 415-46.
Bauhr, Monika, Nicholas Charron, and Lena Wängnerud. 2018. "Exclusion or Interests? Why
Females in Elected Office Reduce Petty and Grand Corruption." European Journal of Political
Research: <xocs:firstpage xmlns:xocs=""/>.
Beaulieu, Emily. 2014. "From Voter Id to Party Id: Political Parties and Perceptions of Election
Fraud in the U.S.". Electoral Studies 35: 24-32.
Booth, John A, and Mitchell A. Seligson. 2009. The Legitimacy Puzzle in Latin America: Political Support
and Democracy in Eight Nations. New York: Cambridge University Press.
Brambor, Thomas, William R. Clark, and Matt Golder. 2006. "Understanding Interaction Models:
Improving Empirical Analyses." Political Analysis 14: 63-82.
Carreras, Miguel. 2012. "The Rise of Outsiders in Latin America, 1980–2010: An Institutionalist
Perspective." Comparative Political Studies 45: 1451-82.
Chang, Eric C. C., and Nicholas N. Kerr. 2017. "An Insider–Outsider Theory of Popular
Tolerance for Corrupt Politicians." Governance 30: 67-84.
Córdova, Abby. 2009. "Methodological Note: Measuring Relative Wealth Using Household Asset
Indicators." AmericasBarometer Insights.
Córdova, Abby, and Matthew Layton. 2016. "When Is "Delivering the Goods" Not Enough? How
Economic Disparities in Latin American Neighborhoods Shape Citizen Trust in Local
Government." World Politics 68: 74-110.
26
Dahlberg, Stefan, Jonas Linde, and Sören Holmberg. 2015. "Democratic Discontent in Old and
New Democracies: Assessing the Importance of Democratic Input and Governmental
Output." Political Studies 63: 18-37.
Dalton, Russell. 2004. Democratic Challenges, Democratic Choices: The Erosion of Political Support in
Advanced Industrial Democracies. New York: Oxford University Press.
Dollar, David, Raymond Fisman, and Roberta Gatti. 2001. "Are Women Really the “Fairer” Sex?
Corruption and Women in Government." Journal of Economic Behavior & Organization 46: 423-
29.
Easton, David. 1975. "A Re-Assessment of the Concept of Political Support." British Journal of
Political Science 5: 435-57.
Esarey, Justin, and Gina Chirillo. 2013. "“Fairer Sex” or Purity Myth? Corruption, Gender, and
Institutional Context." Politics & Gender 9: 361-89.
Esarey, Justin, and Leslie A. Schwindt-Bayer. 2018. "Women's Representation, Accountability and
Corruption in Democracies." British Journal of Political Science 48: 659-90.
Ferraz, Claudio, and Frederico Finan. 2011. "Electoral Accountability and Corruption: Evidence
from the Audits of Local Governments." American Economic Review 101: 1274-311.
Gilens, Martin. 2012. Affluence and Influence: Economic Inequality and Political Power in America. New
York: Russell Sage Foundation.
Graham, Jesse, Jonathan Haidt, and Brian A Nosek. 2009. "Liberals and Conservatives Rely on
Different Sets of Moral Foundations." Journal of personality and social psychology 96: 1029-46.
Graycar, Adam, and Diego Villa. 2011. "The Loss of Governance Capacity through Corruption."
Governance 24: 419-38.
Hakhverdian, Armen, and Quinton Mayne. 2012. "Institutional Trust, Education, and Corruption:
A Micro-Macro Interactive Approach." The Journal of Politics 74: 739-50.
27
Heisig, Jan Paul, and Merlin Schaeffer. 2019. "Why You Should Always Include a Random Slope
for the Lower-Level Variable Involved in a Cross-Level Interaction." European Sociological
Review 35: 258-79.
Hibbing, John, and Elizabeth Theiss-Morse. 2001. "Process Preferences and American Politics:
What the People Want Government to Be." American Political Science Review 95: 145-53.
Holman, Mirya R., and J. Celeste Lay. 2018. "They See Dead People (Voting): Correcting
Misperceptions About Voter Fraud in the 2016 U.S. Presidential Election." Journal of Political
Marketing 18: 1-38.
Jost, John, and Orsolya Hunyady. 2003. "The Psychology of System Justification and the Palliative
Function of Ideology." European review of social psychology 13: 111-53.
Jost, John T, and Aaron C Kay. 2010. "Social Justice." In Handbook of Social Psychology, eds. Susan T
Fiske, Daniel Todd Gilbert and Gardner Lindzey. Hoboken, NJ: Wiley.
Kaufmann, Daniel, Aart Kraay, and Massimo Mastruzzi. 2011. "The Worldwide Governance
Indicators: Methodology and Analytical Issues." Hague Journal on the Rule of Law 3: 220-46.
Kelly, Nathan J., and Peter K. Enns. 2010. "Inequality and the Dynamics of Public Opinion: The
Self-Reinforcing Link between Economic Inequality and Mass Preferences." American Journal
of Political Science 54: 855-70.
Krieckhaus, Jonathan, Byunghwan Son, Nisha Mukherjee Bellinger, and Jason M. Wells. 2014.
"Economic Inequality and Democratic Support." The Journal of Politics 76: 139-51.
Kumlin, Staffan, and Peter Esaiasson. 2012. "Scandal Fatigue? Scandal Elections and Satisfaction
with Democracy in Western Europe, 1977-2007." British Journal of Political Science 42: 263-82.
Lerner, Melvin J., and Dale T. Miller. 1978. "Just World Research and the Attribution
Process:Looking Back and Ahead." Psychological Bulletin 85: 1030-51.
28
Linde, Jonas. 2012. "Why Feed the Hand That Bites You? Perceptions of Procedural Fairness and
System Support in Post-Communist Democracies." European Journal of Political Research 51:
410-34.
Linde, Jonas, and Joakim Ekman. 2003. "Satisfaction with Democracy: A Note on a Frequently
Used Indicator in Comparative Politics." European Journal of Political Research 42: 391-408.
Linde, Jonas, and Gissur Ó Erlingsson. 2013. "The Eroding Effect of Corruption on System
Support in Sweden." Governance 26: 585-603.
Linz, Juan J, and Alfred Stepan. 1996. Problems of Democratic Transition and Consolidation: Southern
Europe, South America, and Post-Communist Europe. Baltimore: Johns Hopkins University Press.
Lopes, Marina. 2018. “In Brazil, Nostalgia Grows for the Dictatorship – Not the Brutality, but the
Law and Order.” Washington Post, March 15, 2018. https://tinyurl.com/yxsaus8y.
Lupu, Noam. 2016. "The End of the Kirchner Era." Journal of Democracy 27: 35-49.
Magalhães, Pedro C. 2016. "Economic Evaluations, Procedural Fairness, and Satisfaction with
Democracy." Political Research Quarterly 69: 522-34.
Mainwaring, Scott. 2006. "The Crisis of Representation in the Andes." Journal of Democracy 17: 13-
27.
McAllister, Ian. 1999. "The Economic Performance of Governments." In Critical Citizens: Global
Support for Democratic Governance, ed. Pippa Norris. New York: Oxford University Press.
169-87.
Meltzer, Allan H, and Scott F Richard. 1981. "A Rational Theory of the Size of Government."
Journal of Political Economy 89: 914-27.
Miller, David. 1999. Principles of Social Justice. Cambridge, Harvard University Press.
Morgan, Jana. 2011. Bankrupt Representation and Party System Collapse. University Park, PA: The
Pennsylvania State University Press.
29
Norris, Pippa. 2011. Democratic Deficit: Critical Citizens Revisited. New York: Cambridge University
Press.
Osberg, Lars, and Timothy Smeeding. 2006. "'Fair' Inequality? Attitudes toward Pay Differentials:
The United States in Comparative Perspective." American Sociological Review 71: 450-73.
Rothstein, Bo, and Jan Teorell. 2008. "What Is Quality of Government? A Theory of Impartial
Government Institutions." Governance 21: 165-90.
Schwindt-Bayer, Leslie A. 2010. Political Power and Women's Representation in Latin America. New
York: Oxford University Press.
Singh, Shane, and Ryan Carlin. 2015. "Happy Medium, Happy Citizens: Presidential Power and
Democratic Regime Support." Political Research Quarterly 68: 3-17.
Snijders, Tom A. B., and Roel Bosker. 2012. Multilevel Analysis: An Introduction to Basic and Advanced
Multilevel Modeling. Los Angeles: Sage Press.
Solt, Frederick. 2008. "Economic Inequality and Democratic Political Engagement." American
Journal of Political Science 52: 48-60.
———. 2016. "The Standardized World Income Inequality Database*." Social Science Quarterly 97:
1267-81.
Standaert, Samuel. 2015. "Divining the Level of Corruption: A Bayesian State-Space Approach."
Journal of Comparative Economics 43: 782-803.
Stegmueller, Daniel. 2013. "How Many Countries for Multilevel Modeling? A Comparison of
Frequentist and Bayesian Approaches." American Journal of Political Science 57: 748-61.
Stensöta, Helena, and Lena Wängnerud, eds. 2018. Gender and Corruption: Historical Roots and New
Avenues for Research. Switzerland: Palgrave MacMillan.
Stensöta, Helena, Lena Wängnerud, and Richard Svensson. 2015. "Gender and Corruption: The
Mediating Power of Institutional Logics." Governance 28: 475-96.
30
Stockemer, Daniel, and Aksel Sundström. 2019. "Corruption and Women in Cabinets: Informal
Barriers to Recruitment in the Executive." Governance 32: 83-102.
Sundström, Aksel, and Lena Wängnerud. 2016. "Corruption as an Obstacle to Women’s Political
Representation Evidence from Local Councils in 18 European Countries." Party Politics 22:
354-69.
Tang, Min, and Narisong Huhe. 2019. "Contextualizing the Economic Basis of Political Support:
Government Economic Engagement, Economic Perceptions, and Democratic
Satisfaction." Political Research Quarterly First View.
Thibaut, John W., and Laurens Walker. 1975. Procedural Justice : A Psychological Analysis. Hillsdale,
N.J.: L. Erlbaum.
Trump, Kris-Stella. 2018. "Inequality Influences Perceptions of Legitimate Income Differences."
British Journal of Political Science 48: 929-52.
Tyler, Tom R, and E. Allen Lind. 1992. "A Relational Model of Authority in Groups." Advances in
Experimental Social Psychology 25: 115-91.
van den Bos, Kees. 2005. "What Is Responsible for the Fair Process Effect?" In The Handbook of
Organization Justice: Fundamental Questions About Fairness in the Workplace, eds. Jerald Greenberg
and Jason A. Colquitt. Mahwah, NJ: Lawrence Erlbaum & Associates. 273-300.
Van Den Bos, Kees, Henk A. M. Wilke, E. Allan Lind, and Riël Vermunt. 1998. "Evaluating
Outcomes by Means of the Fair Process Effect: Evidence for Different Processes in
Fairness and Satisfaction Judgments." Journal of Personality and Social Psychology 74: 1493-503.
Van Ryzin, Gregg G. 2011. "Outcomes, Process, and Trust of Civil Servants." Journal of Public
Administration Research and Theory 21: 745-60.
31
Waksalk, Cheryl J, John T. Jost, Tom R Tyler, and Emmeline S Chen. 2007. "Moral Outrage
Mediates the Dampening Effect of System Justification on Support for Redistribution."
Psychological Science 18: 267-74.
Watson, David, and Amy Moreland. 2014. "Perceptions of Corruption and the Dynamics of
Women's Representation." Politics & Gender 10: 392-412.
Weitz-Shapiro, Rebecca. 2008. "The Local Connection: Local Government Performance and
Satisfaction with Democracy in Argentina." Comparative Political Studies 41: 285-308.
Zechmeister, Elizabeth J., and Daniel Zizumbo-Colunga. 2013. "The Varying Political Toll of
Concerns About Corruption in Good Versus Bad Economic Times." Comparative political
studies. 46: 1190-218.
Zmerli, Sonja, and Juan Carlos Castillo. 2015. "Income Inequality, Distributive Fairness and
Political Trust in Latin America." Social Science Research 52: 179-92.
32
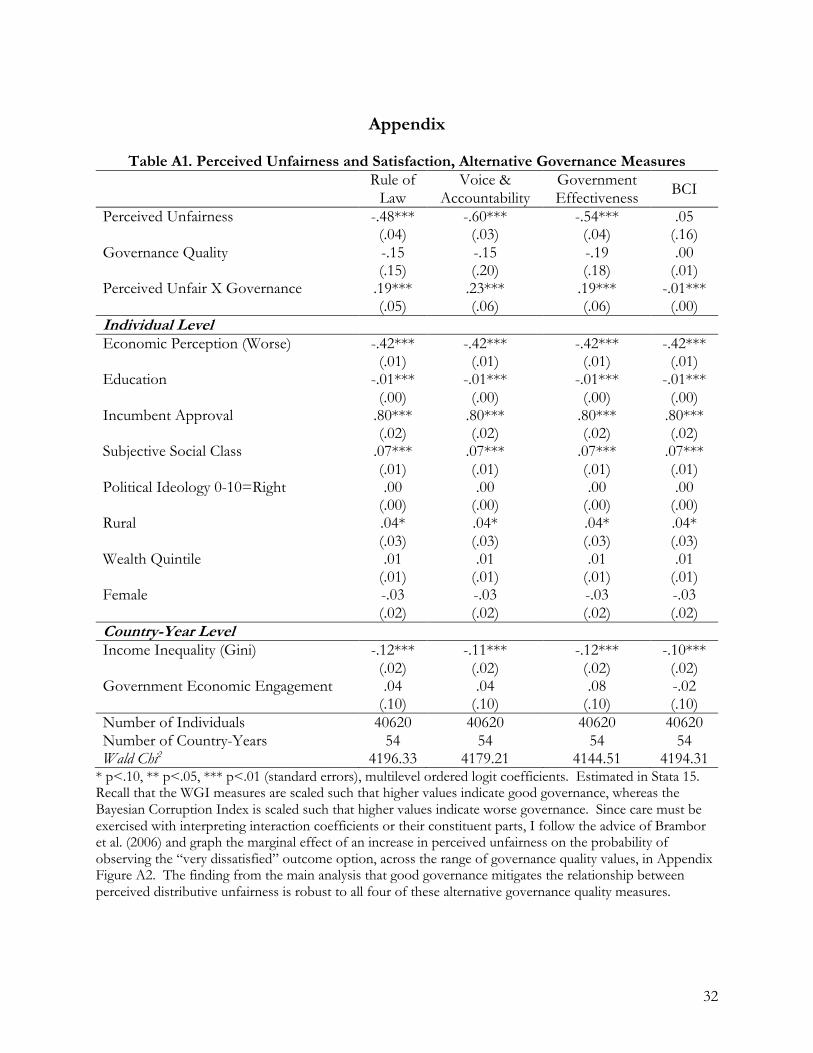
Appendix
Table A1. Perceived Unfairness and Satisfaction, Alternative Governance Measures
Rule of Law
Voice & Accountability
Government Effectiveness BCI
Perceived Unfairness -.48*** -.60*** -.54*** .05 (.04) (.03) (.04) (.16) Governance Quality -.15 -.15 -.19 .00 (.15) (.20) (.18) (.01) Perceived Unfair X Governance .19*** .23*** .19*** -.01*** (.05) (.06) (.06) (.00) Individual Level Economic Perception (Worse) -.42*** -.42*** -.42*** -.42*** (.01) (.01) (.01) (.01) Education -.01*** -.01*** -.01*** -.01*** (.00) (.00) (.00) (.00) Incumbent Approval .80*** .80*** .80*** .80*** (.02) (.02) (.02) (.02) Subjective Social Class .07*** .07*** .07*** .07*** (.01) (.01) (.01) (.01) Political Ideology 0-10=Right .00 .00 .00 .00 (.00) (.00) (.00) (.00) Rural .04* .04* .04* .04* (.03) (.03) (.03) (.03) Wealth Quintile .01 .01 .01 .01 (.01) (.01) (.01) (.01) Female -.03 -.03 -.03 -.03 (.02) (.02) (.02) (.02) Country-Year Level Income Inequality (Gini) -.12*** -.11*** -.12*** -.10*** (.02) (.02) (.02) (.02) Government Economic Engagement .04 .04 .08 -.02 (.10) (.10) (.10) (.10) Number of Individuals 40620 40620 40620 40620 Number of Country-Years 54 54 54 54 Wald Chi2 4196.33 4179.21 4144.51 4194.31
* p<.10, ** p<.05, *** p<.01 (standard errors), multilevel ordered logit coefficients. Estimated in Stata 15. Recall that the WGI measures are scaled such that higher values indicate good governance, whereas the Bayesian Corruption Index is scaled such that higher values indicate worse governance. Since care must be exercised with interpreting interaction coefficients or their constituent parts, I follow the advice of Brambor et al. (2006) and graph the marginal effect of an increase in perceived unfairness on the probability of observing the “very dissatisfied” outcome option, across the range of governance quality values, in Appendix Figure A2. The finding from the main analysis that good governance mitigates the relationship between perceived distributive unfairness is robust to all four of these alternative governance quality measures.
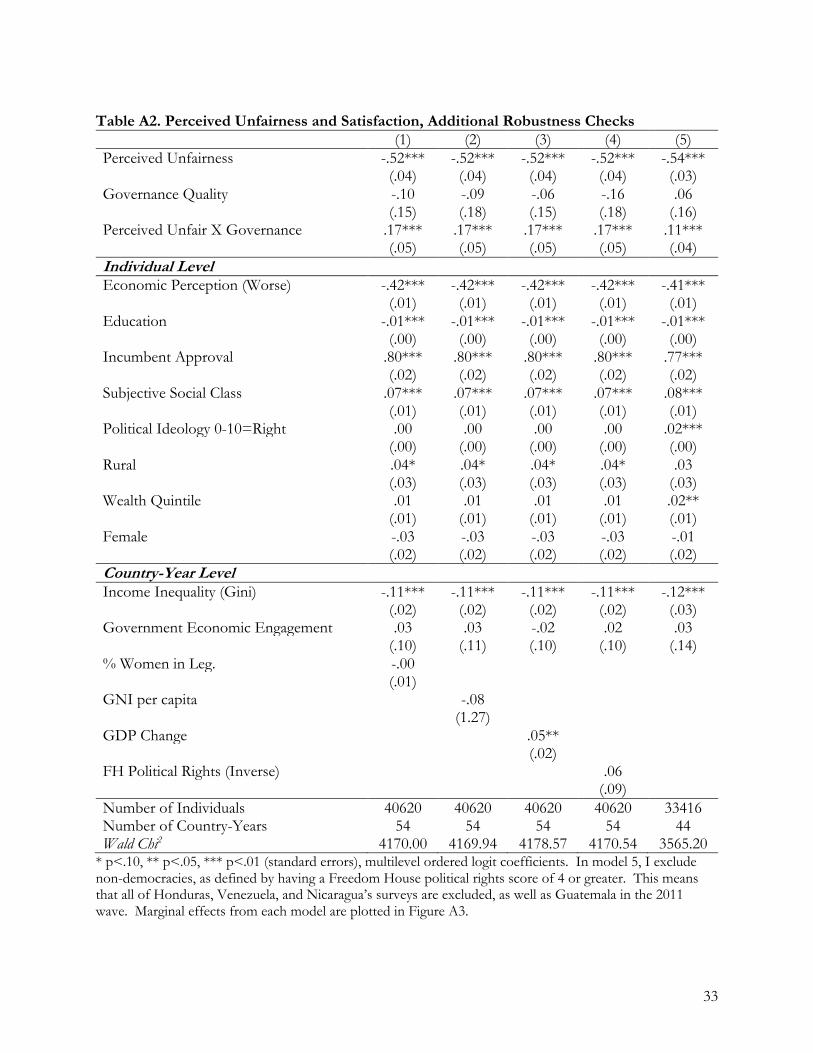
33
Table A2. Perceived Unfairness and Satisfaction, Additional Robustness Checks (1) (2) (3) (4) (5) Perceived Unfairness -.52*** -.52*** -.52*** -.52*** -.54*** (.04) (.04) (.04) (.04) (.03) Governance Quality -.10 -.09 -.06 -.16 .06 (.15) (.18) (.15) (.18) (.16) Perceived Unfair X Governance .17*** .17*** .17*** .17*** .11*** (.05) (.05) (.05) (.05) (.04) Individual Level Economic Perception (Worse) -.42*** -.42*** -.42*** -.42*** -.41*** (.01) (.01) (.01) (.01) (.01) Education -.01*** -.01*** -.01*** -.01*** -.01*** (.00) (.00) (.00) (.00) (.00) Incumbent Approval .80*** .80*** .80*** .80*** .77*** (.02) (.02) (.02) (.02) (.02) Subjective Social Class .07*** .07*** .07*** .07*** .08*** (.01) (.01) (.01) (.01) (.01) Political Ideology 0-10=Right .00 .00 .00 .00 .02*** (.00) (.00) (.00) (.00) (.00) Rural .04* .04* .04* .04* .03 (.03) (.03) (.03) (.03) (.03) Wealth Quintile .01 .01 .01 .01 .02** (.01) (.01) (.01) (.01) (.01) Female -.03 -.03 -.03 -.03 -.01 (.02) (.02) (.02) (.02) (.02) Country-Year Level Income Inequality (Gini) -.11*** -.11*** -.11*** -.11*** -.12*** (.02) (.02) (.02) (.02) (.03) Government Economic Engagement .03 .03 -.02 .02 .03 (.10) (.11) (.10) (.10) (.14) % Women in Leg. -.00 (.01) GNI per capita -.08 (1.27) GDP Change .05** (.02) FH Political Rights (Inverse) .06 (.09) Number of Individuals 40620 40620 40620 40620 33416 Number of Country-Years 54 54 54 54 44 Wald Chi2 4170.00 4169.94 4178.57 4170.54 3565.20
* p<.10, ** p<.05, *** p<.01 (standard errors), multilevel ordered logit coefficients. In model 5, I exclude non-democracies, as defined by having a Freedom House political rights score of 4 or greater. This means that all of Honduras, Venezuela, and Nicaragua’s surveys are excluded, as well as Guatemala in the 2011 wave. Marginal effects from each model are plotted in Figure A3.
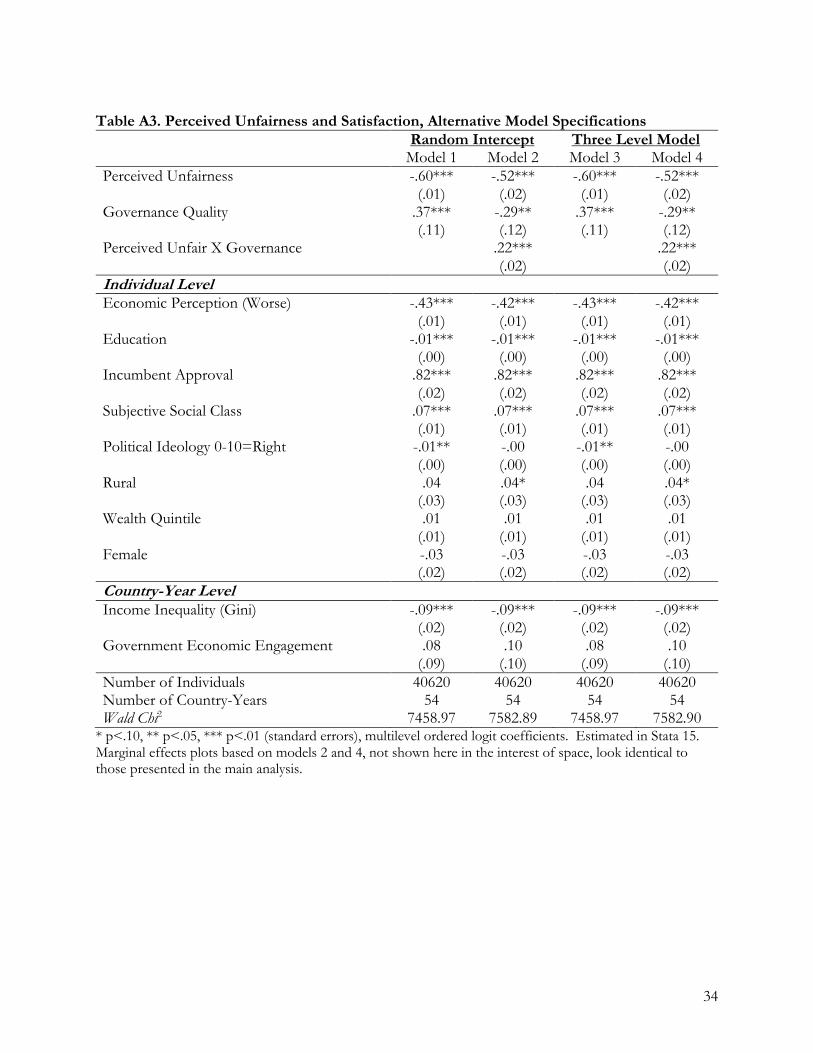
34
Table A3. Perceived Unfairness and Satisfaction, Alternative Model Specifications Random Intercept Three Level Model Model 1 Model 2 Model 3 Model 4 Perceived Unfairness -.60*** -.52*** -.60*** -.52*** (.01) (.02) (.01) (.02) Governance Quality .37*** -.29** .37*** -.29** (.11) (.12) (.11) (.12) Perceived Unfair X Governance .22*** .22*** (.02) (.02) Individual Level Economic Perception (Worse) -.43*** -.42*** -.43*** -.42*** (.01) (.01) (.01) (.01) Education -.01*** -.01*** -.01*** -.01*** (.00) (.00) (.00) (.00) Incumbent Approval .82*** .82*** .82*** .82*** (.02) (.02) (.02) (.02) Subjective Social Class .07*** .07*** .07*** .07*** (.01) (.01) (.01) (.01) Political Ideology 0-10=Right -.01** -.00 -.01** -.00 (.00) (.00) (.00) (.00) Rural .04 .04* .04 .04* (.03) (.03) (.03) (.03) Wealth Quintile .01 .01 .01 .01 (.01) (.01) (.01) (.01) Female -.03 -.03 -.03 -.03 (.02) (.02) (.02) (.02) Country-Year Level Income Inequality (Gini) -.09*** -.09*** -.09*** -.09*** (.02) (.02) (.02) (.02) Government Economic Engagement .08 .10 .08 .10 (.09) (.10) (.09) (.10) Number of Individuals 40620 40620 40620 40620 Number of Country-Years 54 54 54 54 Wald Chi2 7458.97 7582.89 7458.97 7582.90
* p<.10, ** p<.05, *** p<.01 (standard errors), multilevel ordered logit coefficients. Estimated in Stata 15. Marginal effects plots based on models 2 and 4, not shown here in the interest of space, look identical to those presented in the main analysis.
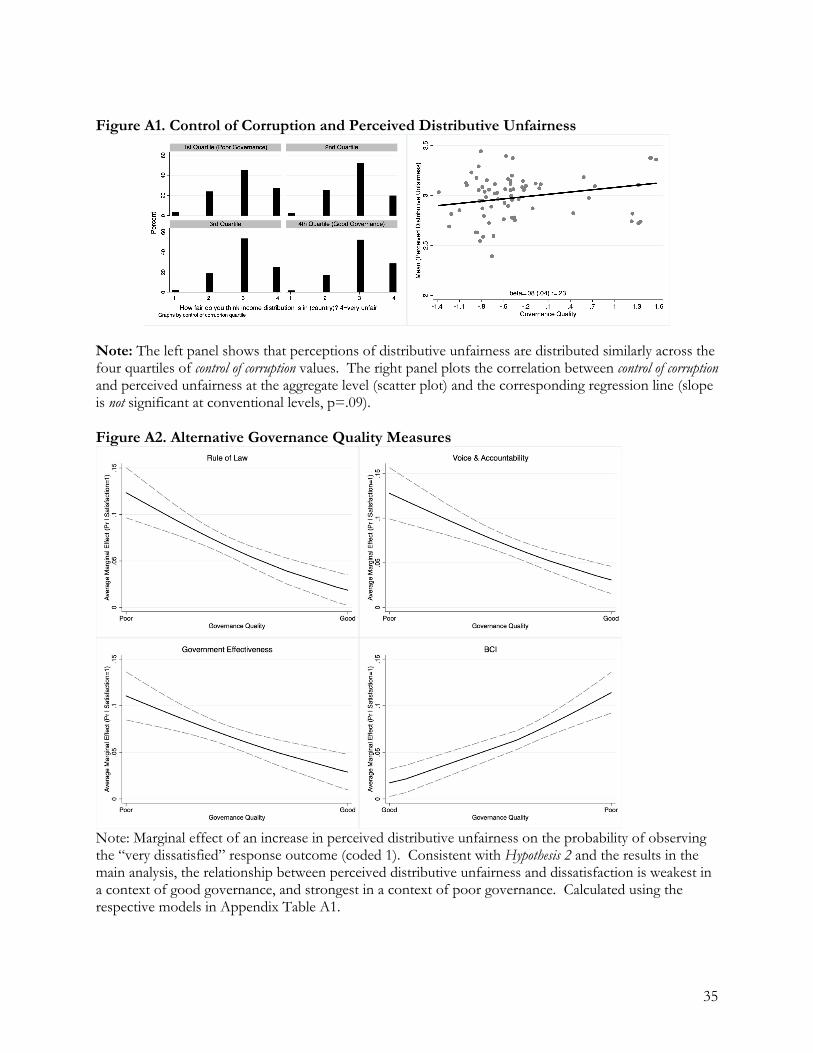
35
Figure A1. Control of Corruption and Perceived Distributive Unfairness
Note: The left panel shows that perceptions of distributive unfairness are distributed similarly across the four quartiles of control of corruption values. The right panel plots the correlation between control of corruption and perceived unfairness at the aggregate level (scatter plot) and the corresponding regression line (slope is not significant at conventional levels, p=.09). Figure A2. Alternative Governance Quality Measures
Note: Marginal effect of an increase in perceived distributive unfairness on the probability of observing the “very dissatisfied” response outcome (coded 1). Consistent with Hypothesis 2 and the results in the main analysis, the relationship between perceived distributive unfairness and dissatisfaction is weakest in a context of good governance, and strongest in a context of poor governance. Calculated using the respective models in Appendix Table A1.
36
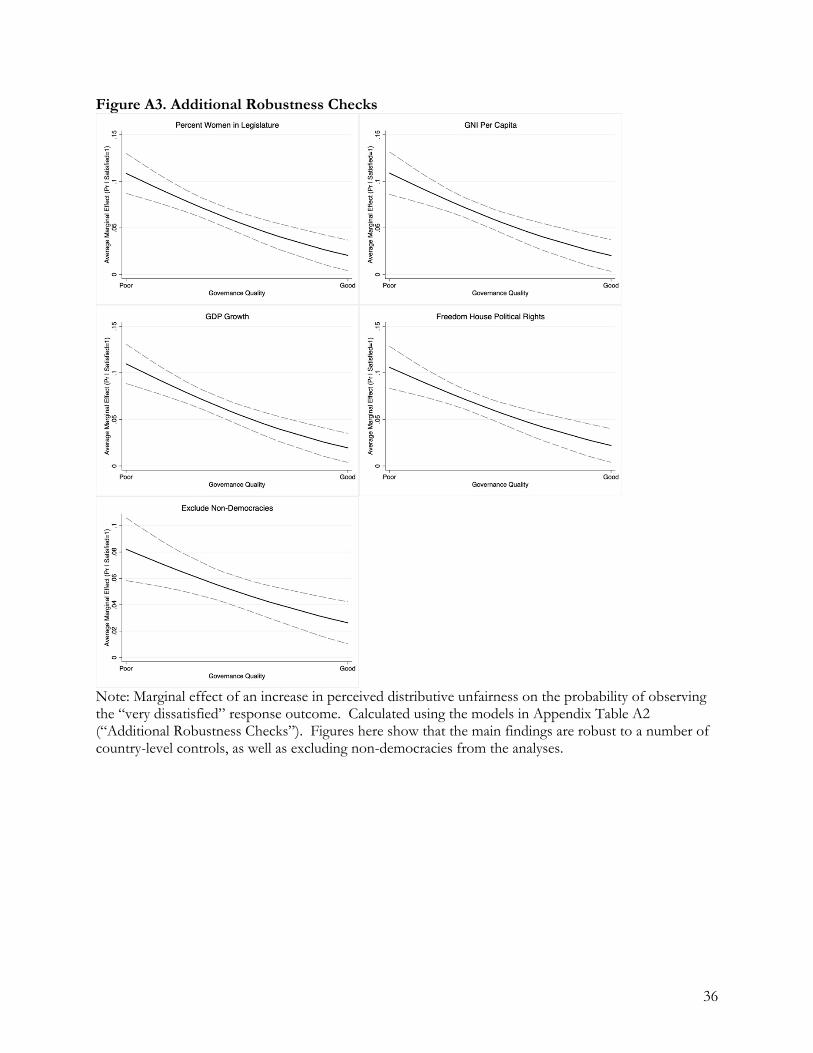
Figure A3. Additional Robustness Checks
Note: Marginal effect of an increase in perceived distributive unfairness on the probability of observing the “very dissatisfied” response outcome. Calculated using the models in Appendix Table A2 (“Additional Robustness Checks”). Figures here show that the main findings are robust to a number of country-level controls, as well as excluding non-democracies from the analyses.