governance and urban development: case study of metro … · table 18 land use classification in...
TRANSCRIPT

For comments, suggestions or further inquiries please contact:
Philippine Institute for Development StudiesPhilippine Institute for Development Studies
The PIDS Discussion Paper Seriesconstitutes studies that are preliminary andsubject to further revisions. They are be-ing circulated in a limited number of cop-ies only for purposes of soliciting com-ments and suggestions for further refine-ments. The studies under the Series areunedited and unreviewed.
The views and opinions expressedare those of the author(s) and do not neces-sarily reflect those of the Institute.
Not for quotation without permissionfrom the author(s) and the Institute.
The Research Information Staff, The Research Information Staff, Philippine Institute for Development Studies3rd Floor, NEDA sa Makati Building, 106 Amorsolo Street, Legaspi Village, Makati City, PhilippinesTel Nos: 8924059 and 8935705; Fax No: 8939589; E-mail: [email protected]
Or visit our website at http://www.pids.gov.ph
February 1999
DISCUSSION PAPER SERIES NO. 99-03
Governance and UrbanDevelopment: Case Study
of Metro ManilaRosario G. Manasan and Ruben G. Mercado

GGOOVVEERRNNAANNCCEE AANNDD UURRBBAANNDDEEVVEELLOOPPMMEENNTT::
CCAASSEE SSTTUUDDYY OOFF MMEETTRROO MMAANNIILLAA
Rosario G. Manasan, Ph.D.Ruben G. Mercado
January 1999

1
TABLE OF CONTENTS
Page
EXECUTIVE SUMMARY i
1. INTRODUCTION 1
2. BACKGROUND 2
2.1 Geography 22.2 Demography 22.3 Economic Development 32.4 Spatial Development 5
3. METROPOLITAN GOVERNANCE 6
3.1 Overall Governance Framework 63.2 Early Antecedents of Metropolitan Organization 73.3 Metropolitan Manila Commission, 1975-1990 83.4 Metropolitan Manila Authority, 1990-1995 113.5 Metropolitan Manila Development Authority, 1995-present 13
4. MAJOR METROPOLITAN GOVERNANCE CHALLENGES 16
4.1 Transport and Traffic Management 164.2 Flood Control 194.3 Solid Waste Management 204.4 Land Use, Housing and Urban Poverty 21
5. MODELS OF GOOD GOVERNANCE IN METRO MANILA 23
5.1 Marikina City: River Park Management 235.2 Las Pinas City: Urban Renewal and Redesign 255.3 Mandaluyong City: Financing Public Infrastructure Through
Build-Operate-Transfer (BOT) Program 265.4 Muntinlupa City: Housing Program Efforts Through Tripartite Partnership 28
6. FUTURE CHALLENGES AND DIRECTIONS 29
REFERENCES
TABLES
FIGURES

2
LIST OF TABLES
Table Number Title
Table 1 Demographic Facts About Metro Manila
Table 2 Population Density
Table 3 Gross Domestic Product Structure
Table 4 Regional GDP Per Capita
Table 5 Poverty Incidence of Families, by Region and Urbanity, 1985-1997
Table 6 Gini Concentration Ratios by Region, 1985, 1988, 1991, 1994 and 1997
Table 7 Household Population 15 Years Old and Over by Employment Status
Table 8 Inflation by Region
Table 9 Comparative Overview of Metro Manila Commission (P.D. 824), MetroManila Authority (E.O. 392), and Metro Manila DevelopmentAuthority (R.A. 7924)
Table 10 Comparative Revenue Sources of Metropolitan Organization
Table 11 Expenditure Pattern of Metropolitan Body
Table 12 Total General Government Expenditures in Metro Manila, 1989-1997\
Table 13 Traffic Volume on Major Road, 1980 and 1995 (Vehicles/Day)
Table 14 Number of Registered Vehicles in Metro Manila, 1980, 1990, 1995
Table 15 Car Ownership Structure, 1980 and 1996
Table 16 Public Transportation Supply Estimated Number Operating Units,1983 and 1996
Table 17 Transport and Traffic Management in Metro Manila
Table 18 Land Use Classification in Metro Manila

3
LIST OF FIGURES
Figure Number Title
Figure 1 Map of the Philippines/ Metro Manila
Figure 2 Major Road Network System of Metro Manila
Figure 3 Metro Manila, CALABARZON and MARILAQUE
Figure 4 Structure of Philippine Local Government Units
Figure 5 Organizational Structure of Metropolitan ManilaDevelopment Authority
Figure 6 Waste Flow in Metro Manila

4
EXECUTIVE SUMMARY
Metropolitan Manila has become an experimental laboratory of various governance systems forthe last twenty years. This is mainly the result of the country’s transformation from an overly centralizedadministration during the Marcos regime to a more decentralized management structure and system fromthe Aquino government in 1986 to the present .
This paper explains the evolution of the metropolitan organizations that have been established tooversee the development of Metro Manila, provides a survey of their responsibilities, authorities,organizational structure, financing, institutional relationships as well as briefly assess their strengths andweaknesses. It then discusses the major management challenges in Metro Manila at present and how theyare being addressed under the current set-up.
Under the present decentralized framework, governance of Metro Manila becomesmore challenging as cities and municipalities that compose it have political legitimacy andsignificant powers and authorities relative to the Metropolitan organization. However, thepaper has emphasized that with proper allocation of powers, authorities and financing, themetropolitan body can take on a more important role in terms of actual delivery of metro-wide services. While the present metropolitan body appears to have taken on moreresponsibilities in the delivery of services transcending local boundaries, still a large partof these metro-wide services still remain with the national government agencies. This isprimarily explained by the fact that while the national government has continuouslyprovided subsidies to the metropolitan body, it still allocates a sizeable portion of thebudget for metro-wide services to the national government agencies. These agencies,being line departments, are inherently concerned with their own sectoral priorities ratherthan serving the needs of the metropolis per se. Consequently, the metropolitan body isleft with the very difficult task of having to orchestrate the sectoral programs of variousnational government agencies, including metro-wide services. This situation not onlymakes government effort almost intractable but also increases costs in terms of bothmanpower and financial costs.
The advantage of metropolitan governance under a decentralized framework isthat it allows the local government units within the metropolis to respond directly to thepriority needs of their respective constituents by seeking creative means to deliver urbanservices. This is attested to by the innovative programs and projects some cities in MetroManila have implemented which have been included in this paper under the discussion ofmodels of good city governance.

5
1. INTRODUCTION
In 1990, Metro Manila, with 7.9 million population, ranked 18th among the largesturban agglomeration in the world. By the turn of the century, it is expected to reach 11.8million and will rank 20th of the 28 identified megalopolises or megacities in the world.1
(UNU, 1994).
Metro Manila or the National Capital Region is the smallest of the 16 regions ofthe Philippines in terms of land area (636 square kilometers) but is the prime financial,commercial, social, cultural and educational center and the seat of the nationalgovernment. Its cumulative development through centuries has built a solid foundation forit to become the premier metropolis in the country and which new metropolises will finddifficult to outdo or outrank. However, Metro Manila needs to speed up its effort to becompetitive with the world-class cities in Asia and in the West.
The rapid growth in public expenditure needed to meet the social and physicalinfrastructure requirements of the expanding metropolis has been a constant challenge andis more highlighted in recent years. Efficient transportation leaves much to be desired.Basic utilities in terms of water, power and communication facilities have yet to reach ahundred percent accessibility. The current emphasis on making premier cities globallycompetitive or world class further pressures the country to seek creative means to fundcapital intensive programs. Alongside these challenges are institutional dilemma whichhave taken root from the country’s colonial past and the political turmoil that plaguedpost-war national leaderships.
The present paper aims to provide a brief sketch of the demographic, economicand spatial development of Metro Manila at present and likely scenario towards the nextmillenium. The study will also explain and assess the various governance systems,structures and processes that have evolved in Metro Manila from the post-World War IIera to the present. It will also highlight the challenges and issues confronting themetropolis by evaluating specific sectors or services that are critical to its betterfunctioning. These include transport and traffic management, flood control, solid wastemanagement, housing provision and urban poverty alleviation. The study will also featuresome cities in Metro Manila whose programs and their execution can serve as models ofgood city governance. The paper shall conclude with some policy directions that will haveto be considered in the medium and long term.
1 Recently, the emergence of big metropolises in the world has prompted the United Nations to classifycertain metropolises as megalopolises which pertain to cities or metropolises having a population of 8million and over (ADB, 1994).

6
2. BACKGROUND
Metro Manila has had a long history. For 250 years before the Spanish arrived,Manila has been a prosperous city engaged in trading with neighboring China, Vietnam,Indonesia, Malaysia, Borneo and Kampuchea and with Acapulco as well. Because it wasa progressive city with rich agricultural hinterland, Manila became the Spanish and, thenlater, America’s colonial capital. Aside from being the direct link between the Philippinesand its colonial rulers, Manila through its port served as the gateway for the export ofagricultural products and raw materials to Europe and the United States and for import ofBritish and American manufactured goods. During the Spanish and the American rule,colonial policies promoted the development of Manila as a primate city. In this sense, thecountryside was “economically exploited to support the colonial bureaucracy in Manila”(Caoili, 1985 based on Cushner, 1971 and Regidor and Mason, 1905/1925). After WorldWar II, economic policies have contributed further to the uneven development betweenManila and the rest of the country. Manila was the favored location of industrialestablishments because of its developed infrastructure and its being the country’s principalport and financial and commercial center. This, together with political unrest andunderdevelopment in the other regions, have encouraged rural migration to Manila andaccelerated the urbanization process in the area.
2.1. Geography
Metropolitan Manila (or the National Capital Region, NCR) is located in thesouthwestern portion of Luzon, directly below Central Luzon. It lies along the flat alluviallands extending from the mouth of the Pasig River in the west to the higher rugged landsof Marikina Valley in the east. It is bounded by the province of Bulacan in the north, theSierra Madre mountains and Laguna de Bay in the east, Manila Bay in the west, and theprovinces of Cavite and Laguna in the south.
Metro Manila is comprised of the cities of Manila, Caloocan, Las Pinas,Mandaluyong, Makati, Marikina, Muntinlupa, Paranaque, Pasay, Pasig, and Quezon, aswell as the municipalities of Malabon, Navotas, Pateros, San Juan, Taguig, andValenzuela. With a land area of 636 sq. km., it may be subdivided it into 4 zones: theCoastal Margin (including the reclaimed area in Manila Bay), the Guadalupe Plateau, theMarikina Valley, and the Laguna Lowlands (MMDA 1996). The Coastal Margin islocated along Manila Bay and possesses resources for offshore fisheries and fishponddevelopment. The various reclamation projects in the Coastal Margin are meant for mixedused urban development activities. The Guadalupe Plateau actually contains most of theMetro Manila jurisdictions. This plateau is most adaptable to urban development activitiesnot only because of its solid geological foundations but also because the existinginfrastructure links with the rest of the Luzon. On the other hand, the Marikina Valley hasfertile land suitable for crop cultivation while the Marikina River provides water forindustrial uses and discharge. Lastly, the Laguna Lowlands, another fertile but lessexpansive area, borders the Laguna de Bay making it suitable not only for agriculture andaqua-culture but also for industrial activity (Figure 1).

7
2.2. Demography
In 1995, total population of Metro Manila reached 9.5 million, accounting for 13.8percent of the total population and some 25.1 percent of the total urban population (Table1). The primacy of Metro Manila has been declining continuously after reaching a peak of34 percent in 1970. The diminishing primacy of the metropolis is partly attributed to thedeceleration of the rate of growth of its population from a peak of 4.9 percent annually inthe 1960s to 3.0 percent in the 1980s (Pernia and Israel 1994). However, the populationgrowth rate of Metro Manila rose to 3.3 percent yearly in 1990-1995, almost 50 percenthigher than the national average of 2.3 percent. Still another factor that helps explainsprimacy reversal is the decline in the contribution of net migration to the growth of themetropolis. To wit, the proportion of migrants in Metro Manila’s population in 1975-1980 was 18.2 percent compared to only 11.5 percent in 1985-1990.
The population density of Metro Manila in 1995 is estimated at 14,865 persons persq. km., 65 times the national average of 229 persons per sq. km.. Congestion in MetroManila is more glaring if one looks at the individual cities and municipalities in the region.Congestion, as measured by population density, is more evident in Manila, Makati, Pasay,Navotas Pasig and Caloocan. Although population growth in the first 3 LGUs has sloweddown in in 1990-1995, the same cannot be said for the last 3 LGUs (Table 2).
The population is young and a substantial portion is at the peak of their productiveyears. While the metropolitan population is not as young as that of the entire country withonly 43 percent of its population below 20 years of age compared to the entire country’s49 percent, the proportion of the population between 20 and 35 years of age is higher inMetro Manila (30.7 percent) than in the rest of the country (24.6 percent).
2.3. Economic Development
GDP. The Gross Domestic Product (GDP) of the National Capital Regionreached P835.6 billion (US$28.4 billion) in 1997. The share of Metropolitan Manila in thetotal economy’s GDP initially went down from 30.1 percent in 1980 to 28.3 percent in1985 before recovering to 34.5 percent in 1997 (Table 3). Thus, it appears that althoughthe NCR was more badly affected by the economic crisis that confronted the Philippines in1983-1985, it was also the major beneficiary of the turnaround in the economy in the late1980s and the 1990s. In more specific terms, the annual rate of growth of NCR’s realGDP declined from 6.3 percent in 1975-1980 (compared to the Philippines’ real GDPgrowth rate of 6.2 percent) to negative 1.9 percent in 1980-1985 (compared to thenational average of negative 0.5 percent) but bounced back to 3.9 percent in 1985-1997(compared to the national average of 3.2 percent). Consequently, the region re-established its hold on economic primacy (in contrast to urban primacy) in 1986-1997.
The resurgent economic primacy of the NCR is largely driven by the recovery of

8
the services sector (especially the finance and housing sub-sector). In contrast, NCR’sindustrial sector (including the manufacturing and the construction sub-sectors) laggedbehind the rest of the regions’. In particular, NCR’s gross value added (GVA) in theservices sector grew by 5.2 percent yearly on the average in 1985-1997 (compared to thenational average of 3.7 percent), NCR’s GVA in construction and manufacturingincreased by 3.5 and 2.2 percent, respectively (compared to the national average of 6.3and 3.4 percent, respectively).
Consequently, the services sector became the most dominant sector in the NCRstarting in 1988 in terms of GVA shares. Prior to this year, the industrial sectorcontributed the majority of regional GDP. The relative contraction of the industrial sectorin the NCR is largely attributed to the declining share of the manufacturing sub-sector inthe said period. In turn, this development may be traced in part to the deconcentration ofmanufacturing activity from the NCR to Southern Tagalog and Central Luzon in the late1980s although the encroachment of the peripheral regions appeared to have waned in the1990s. However, the manufacturing sub-sector which accounted for over 40 percent oftotal NCR GDP in 1985 exhibited a less vibrant performance in the 1990s.
Per capita GDP. In 1997, per capita GDP in Metro Manila stood at P82,832(US$2,811). Although there has been some diminution in the relative well-being of theNCR, as measured by per capita GDP in 1975-1985, this trend was reversed in 1985-1997. However, the improvement in Metro Manila’s per capita GDP in the latter periodwas not enough to bring it back to the position it enjoyed (relative to the other regions) in1975. Nonetheless, the metropolitan region continues to dominate all the other regionswith a per capita income that is 2.5 times the national per capita GDP of P33,722US$1,144), 2.1 times the per capita GDP of the second richest region, Cordillera, and 7.7times the per capita GDP of poorest region, Muslim Mindanao (Table 4).
Poverty. The sterling performance of Metro Manila in terms of improvements inper capita GDP is mirrored in the trend in poverty reduction. Of the 2.0 millionhouseholds living in the metropolis, 8.0 percent live below the 1997 poverty line ofP71,800 per year for a family of 5. This compares favorably with the national povertyincidence of 32.1 percent. It also represents a marked improvement in poverty reductionas the 1985 poverty incidence in the region was almost 3 times higher at 23.0 percent(Table 5).
Income Disparity. Although income inequality (measured in terms of the Giniconcentration ratio) in the NCR is consistently lower than that in the entire country in1985-1997, Table 6 indicates that incomes are becoming more unequal over time in theregion, particularly in the 1994-1997 period.
Unemployment Rate. On the average, the total working age population grew by3.0 percent yearly between 1988-1997. In 1997, the working age population in Metro
Manila reached 6.5 million people, 4.1 million people of which are in the labor force.In

9
turn, 14.5 percent of the labor were unemployed (Table 7). The unemployment rate in1997 is higher than that in 1996 but still slightly lower than the average for the boom yearsof 1993-1996 despite the onset of the Asian currency crisis in 1997.
It is also notable unemployment is more prevalent in the NCR than in the rest ofthe country. NCR’s unemployment rate was almost twice high as the national average in1988-1997.
The distribution of employment across industries closely follow the distribution ofGVA across sectors. From the 1980s onwards, the share of the service sectors in totalemployment ballooned. In 1997, almost three-quarters of total employment in the NCR iscontributed by the services sector. This dramatic expansion in services sector employmentin Metro Manila came largely at the expense of manufacturing employment, whose shareshrank 27 percent in 1975 to 18 percent in 1997.
Inflation. In the late 1970s and early 1980s, Metro Manila’s inflation rate waslower than the national average. However, the situation was reversed in the late 1980sand early 1990s.
Because of the economic crisis in 1983-1985, the inflation rate in Metro Manilaalmost doubled from an annual average of 11.5 percent in 1975-1980 to 20.0 percent in1980-1985. Following the macroeconomic stabilization measures undertaken by thegovernment in the late 1980s and 1990s, inflation in Metro Manila stabilized at 11.3percent in 1988-1997. Moreover, the inflation rate in the region has been maintained atthe single digit level since 1992 (Table 8).
2.4. Spatial Development
The composition of Metro Manila has not changed since its formation in 1975under Presidential Decree 824 to the current legal geopolitical composition under RA7924. The only change has been the recent reclassification of some municipalities intocities, namely Makati, Muntinlupa, Mandaluyong, Pasig, Marikina, Las Pinas andParanaque.
Metro Manila has been geographically subdivided by previous planning documentsinto an inner core and intermediate core. This subdivision has been largely based on thecircumferential road boundaries (Figure 2). The inner core is composed of the cities ofManila, Pasay, Caloocan, Quezon, Makati and Mandaluyong and the municipalities ofSan Juan, Navotas and Malabon. The intermediate core consists of the cities of Pasig,Paranaque, Muntinlupa, Marikina, Las Pinas and the municipalities of Valenzuela, Taguigand Pateros.
In the immediate post-war period, urban development radiated from the city ofManila, which has been the administrative, economic, educational and social center sincethe colonial period, northwards to Caloocan City, and southwards to Pasay City.

10
Meanwhile, the development of government housing projects in Quezon City and privatesector development of Makati as a financial, commercial and residential center in the late1950s and the 1960s completed the filling up of the inner core between Manila Bay andEDSA (or C-4). Industrial and residential development intensified in Navotas, Malabonand Valenzuela in the late 1960s and in Marikina, Pasig , Paranaque, Las Pinas, andMuntinlupa in the 1960s and the 1970s (League 1993). By 1975, the distinction betweeninner and outer core has been obliterated as infrastructure and economic links havevirtually made all these local units a unified core and have spatially merged them into ametropolitan area that was then loosely referred to a Greater Manila Area (Figure 2).
Related to this, the Physical Framework Development Plan for Metro Manila(MMDA, 1996) identified an outer core consisting of municipalities beyond the originallyidentified intermediate core and located in the neighboring regions particularly in theprovinces of Rizal, Cavite, Laguna and Bulacan. These areas are outside the legalcomposition of Metro Manila but are included as part of the planning region of MetroManila .
The development of Metro Manila beyond its present legal boundaries has beenmore pronounced in recent years than it was twenty years ago. Aside from the abovecited planning framework for Metro Manila, the Philippine National Development Plan forthe 21st Century or Plan 21 (NEDA, 1998) has made explicit its recognition of MetroManila’s spatial development by referring to a Metropolitan Manila Growth Network thatincludes the industrial areas of the neighboring regions, namely, Southern Tagalog Region(Cavite-Laguna-Batangas-Rizal Quezon or CALABARZON and the Manila-Rizal-Laguna-Quezon or MARILAQUE areas) and the Central Luzon Region (areas linkingManila with the Subic and Clark Special Economic Zones). Refer to Figure 3.
Corpuz (1995) in his analysis of the growth directions of Metro Manila usingcentrography has shown parts of the provinces of Cavite, Bulacan, Rizal and Laguna asareas where growth and development are occurring and would continue to take place asMetro Manila continues to experience fast growth at its periphery.
3. METROPOLITAN GOVERNANCE
3.1. Overall Governance Framework
The Philippines has a unitary form of government with a multi-tiered structure. Itis a presidential republic with a bi-cameral legislature (composed of the Senate with 24members and a House of Representatives with at most 250 members).
At the top is the central government operating through some 20departments/agencies. Administratively, the country is divided into 16 administrativeregions and most departments maintain regional offices. It should be emphasized that theregions (with the exception of the Autonomous Region of Muslim Mindanao) are just

11
administrative sub-divisions and not regional governments with elected regional officials.
The second tier of government is composed of local government units (LGUs). Thelocal government structure is composed of three layers. The first layer is composed of theprovinces. In turn, the province is divided into municipalities and component cities, eachof which is further subdivided into barangays, the smallest political unit. At the same time,highly urbanized cities exist at the same level as the provinces, i.e., they share the samefunctions and authorities. However, highly urbanized cities are partitioned directly intobarangays (Figure 4).
Provinces are headed by a Governor and Vice-Governor; cities and municipalitiesare headed by Mayors and Vice-Mayors. Each level of local government have their ownlegislative bodies called Sanggunians. Members of the Sanggunians are called Boardmembers in the case of provinces and councilors in the case of cities and municipalities.Local chief executives, local vice-chief executives and Sanggunian members are all electedin popular elections.
3.2. Early Antecedents of Metropolitan Organization
In the 1950s and the 1960s, rapid and uncontrolled population growth, resultingfrom a high rate of natural increase and significant internal migration, contributed to theeconomic growth of Manila but brought countless problems in the process. Theseproblems include poverty and housing shortage exemplified by the proliferation of slumsand squatter settlements, inadequate public transportation system, traffic, deterioratinghealth and sanitation condition due to lack of potable water and unsanitary disposal ofwaste, lack of drainage and sewage system, pollution (air, water and noise) and worseningpeace and order situation. Caoili (1985) argues that the failure to address the problems ofMetro Manila during the immediate post-war period up to the 1960s stem from thepiecemeal and uncoordinated solutions employed by local governments due to partypolitics and jurisdictional disputes over responsibility for service delivery. Also, there wasa highly uneven distribution of financial resources among local units resulting in widedisparities in the availability and quality of public services.2
The need to consolidate service efforts in view of urban services that transcendlocal jurisdictions in Metro Manila became more obvious in time. Thus, ad-hoc bodies orlocal government arrangements were established to address specific problems or needs.These included the United Intelligence Operations Group (tasked to implementcooperative laws among the cities and municipalities), Fire Protection Organization,
Metropolitan Health Council, Inter-Police Coordinating Council and the Metropolitan
2 Caoili (1985) cites that “ …in fiscal year 1974-75, per capita revenue among MMA units ranged fromP16 in Pateros to P223 in Manila. Per capita expenditures during the same year varied from P19 inPateros to 243 in Makati. In calendar year 1980, per capita revenue among MMA units ranged from P34in Pateros to P412 in Makati. Per capita expenditures during the same year varied from P28 in Pateros toP351 in Makati”.

12
Mayors Coordinating Council. Nonetheless, these ad-hoc arrangements were found to beinadequate in addressing the complex problems of the metropolis.
At about this time also, the needs of Metro Manila became a priority concern ofthe national leadership. This concern was hinged on two major considerations. The firstcentered on the need to improve public services in the areas geographically embracing thecenter of government. Inefficient and uncoordinated services in the metropolis in the faceof rapid urbanization caught the attention of the Marcos leadership. The second stemmedfrom the need to develop a region that will serve as the showcase of the country’smodernization thrusts. Given these considerations, Memorandum Order No. 314 (datedNovember 10, 1972) was issued creating the Inter-Agency Committee on Metro Manila.
The Inter-Agency Committee was tasked “to study the system of municipal/citygovernment in Metropolitan Manila and to recommend whatever measures of coordinationand integration are deemed appropriate and to study the functions and responsibilities ofthe National Government in the metropolitan area, and to recommend whatever changes instructure and interrelation with municipal governments are deemed appropriate”. Thecommittee proposed for the creation of a Metropolitan Manila Authority under the Officeof the President through a promulgation of a Presidential Decree.
3.3. Metro Manila Commission, 1975-1989
A referendum was called for to get the people’s support for the new jurisdictionaldelineation of Metro Manila and to give the President the authority to create a newadministrative structure for the National Capital Region (NCR). Eventually, PresidentialDecree 824, creating the Metro Manila Commission (MMC), was issued in 1975.Moreover, PD 824 delineated the territorial jurisdiction of the MMC to include the 17LGUs enumerated earlier. The important features of the MMC are summarized in Table9.
Responsibilities. The MMC was tasked to take primary responsibility in thedelivery of garbage collection and disposal, transport and traffic services and fire controlservices. It was also mandated to coordinate and monitor government and privateactivities pertaining to the delivery of essential services like water supply and sanitation,flood control, health, social welfare, housing, and park development. More important, theCommission was ordained to develop a comprehensive social, economic and physical planfor the region.
Authorities. PD 824 enabled the MMC to act as a central government to establishand administer programs and provide services common to the area. The MMC was alsovested with legislative powers; it can enact and approve ordinances and resolutions. Inaddition, the MMC was also authorized to levy and collect taxes and fees, expend andborrow money, issue bonds and others instruments of indebtedness. Moreover, it wasempowered to review, amend, revise or repeal all ordinances and resolutions of thedifferent LGUs within its jurisdictions including their annual budgets.

13
Organizational structure. The MMC was composed primarily of the Governor,Vice-Governor, and three Commissioner, one each for Operations, Finance and Planning.All of these officials were appointed by the President of the Philippines.
The Governor and Vice-Governor also assumed the position of General Managerand Deputy General Manager. As such, they were responsible for the implementation ofthe MMC’s policies, programs and regulations. At its peak, the MMC’s personnelnumbered 35,000, majority of whom were in Operations.
Finance. The MMC had access to the following revenue sources: (1) IRA share;(2) central government subsidies; (3) contribution from the member LGUs; (4) share inproceeds of specified taxes imposed by member LGUs; and (5) own collection of taxesand fees. Effectively, the MMC was treated much like a provincial level government interms of share in the Internal Revenue Allotment3 and taxing powers. Specifically, theMMC received 45 percent of the proceeds from the municipal collections of real propertytax. It was also entitled to varying proportions from the collection of other taxes and feesimposed by member LGUs like the corporate residence tax, excavation fees, building andsanitary permit fees, parking fees and the like (Metropolitan Manila Management Study orMMMS 1993). Moreover, the MMC also imposed and collected the following taxes/fees:cinema tax, franchise tax, delivery van tax, peddlers tax, tax on transfer of real propertyand traffic violation fees. Lastly, member LGUs were ordained to contribute 20 percent oftheir regular income to the MMC.
In 1988-1989, yearly MMC revenues amounted to P1,037 million on the averagein 1992 prices. Statutory contributions of member LGUs was the single biggest source ofrevenue for the MMC. Its share in total MMC income was 34.7 percent on the averageduring this period. Over of 30 percent of total MMC income came from its share in thereal property tax, 13.1 percent from other taxes, 11.1 percent from fees and charges (non-tax revenues), 5.4 percent from the IRA and 5.6 percent from subsidies from the centralgovernment (Table 10).
MMC-LGU relations. PD 824 effectively emasculated its member LGUs. Itabolished the legislative councils of the member LGUs and vested the power to enactordinances on the MMC itself. In principle, the city/municipal mayors retained the powersand functions assigned to them prior to the issuance of PD 824. However, they
were also tasked to execute MMC approved programs in their respective jurisdictions.Thus, they became area administrators/managers.
3 The IRA is the mandated share of LGUs in internal revenue collections of the Bureau of InternalRevenue (BIR). Prior to 1991, total IRA was at the maximum equal to 20 percent of BIR collections threeyears prior to the current year. The IRA is allocated to the different levels of local government and tospecific LGUs within each level according to a pre-determined formula that is based on population, landarea and equal sharing.

14
Linkages with national government agencies. As earlier stated, the MMC wasmandated to coordinate and monitor key sectoral services. Largely, because of thepolitical clout of the First Lady (Imelda Marcos) who was Governor/General Manager ofthe MMC for 10 years, the MCC exercised more than a coordinative function over saidservices (League 1993). Senior officials of key national government agencies (like theDepartment of Public Works and Highways, Department of Health Department ofEducation) were appointed as Action Officers of the MMC. Through this arrangement,the MMC formalize its influence over national government line agencies in terms ofensuring budget support to metropolitan projects.
Assessment. League (1993) noted that because of the unique situation broughtabout by the appointment of the First Lady as Governor of Metro Manila while being thehead of the powerful Ministry of Human Settlements (MHS), the MMC enjoyed a positionof primacy in the metropolis. While no formal evaluation of the performance effectivenesshas been undertaken, there is some agreement that the MMC was effective in more waysthan one (MMMS, 1993; League, 1993; Cabanilla, 1998). For instance, the squatterproblem was reportedly better controlled; traffic and public transport were bettermanaged; the environment was cleaner and greener. Moreover, the MMC was able togenerate strict compliance from LGUs with respect to the remittance of their mandatedcontributions. The MMC was able to prepare the first metropolitan land use and zoningplan which was enforced through a zoning ordinance. Much of this success wasdependent of the personality/individuality of the First Lady who was able to generate thegreater support and cooperation of LGUs and national government agencies than wouldhave been possible if any other person were appointed Governor (MMMS 1993).
In spite of the MMC’s enormous power and influence, it did not evolve into a realmetropolitan institution. The MMC actually performed a rather limited range of normalmetropolitan services. For most services, it was unduly dependent on national governmentagencies.
Table 11 shows that in 1988-1989 the MMC spent 84.3 percent of its budget onoperations. In turn, 91.9 percent of this amount was expended on solid wastemanagement. On the other hand, Table 12 documents MMC’s reliance on centralgovernment agencies. In 1988-1989, MMC’s expenditures accounted for a low 7.5percent of total general government expenditures in Metro Manila. The bulk (62.2percent) of total general government expenditures in the region was expended by centralgovernment agencies. In comparison, member LGUs contributed a sizable portion (30.3percent) of total general government expenditures. The latter were allocated to largelylocal concerns.
League (1993) further noted that without a NEDA4 Regional Office in the NCR, 4 National Economic and Development Authority (NEDA) is a constitutional body mandated to provide

15
there was no Regional Development Plan to guide the development of the metropolis in anintegrated fashion with its neighboring regions and with national priorities. Consequently,the MMC had a tendency to concentrate on “high visibility impact projects….reactions tospecific problems or showcase projects which were not sustainable”. It was not until the1980’s when the Commissioner for Planning (within the MMC structure) was appointedto take on the functions and responsibilities similar to those of a NEDA Regional Director.However, the MMC was shortlived with the ouster of the Marcos government followingthe People’s Power/EDSA Revolution in February 1986.
3.4. Metropolitan Manila Authority, 1990-1995
The collapse of the Marcos administration in 1986 and the adoption of a newConstitution (which passed on to Congress the task of determining the appropriateinstitutional mechanism for metropolitan management) placed Metro Manila ininstitutional limbo, with an ambiguous structure and leadership. The growing problems ofMetro Manila, most especially with respect to traffic and garbage, triggered then PresidentCorazon Aquino to issue Executive Order (EO) 392 in 1990 which created the MetroManila Authority (MMA) as an interim body pending the creation of a more permanentmetropolitan organization for the region in a manner that is consistent with the provisionsof the 1987 Constitution.
The MMA is considered by many as a weaker version of its predecessor (theMMC) in terms of both executive and revenue powers. Moreover, the passage of the newLocal Government Code in 1991, which enhanced the autonomy of local governmentunits, further debilitated the MMA. The more important features of the MMC under themore decentralized framework are presented in Table 9.
Responsibilities. The MMA was given jurisdiction over the delivery of basicurban services requiring coordination. These basic services included among others: landuse, planning and zoning; traffic management; urban development and renewal; disastermanagement; and sanitation and waste management.
Authorities. The MMA had no legislative authority. Prior to the passage of theLocal Government Code (or LGC), the MMA had the authority to collect taxes whichwere accruing to it 100 percent. This was no longer true in the post-LGC period.
Organizational structure. The MMA was governed by the Metro Manila Councilwhich was composed of the mayors of the member LGUs. The Chairman of the Councilwas elected from among its mayor-members for a six-month term and performs a largelytitular (e.g. preside over meetings) and recommendatory function. The Secretaries of the
Department of Transportation and Communication (DOTC), Department of Public Worksand Highways (DPWH), and Department of Budget and Management (DBM) attendedthe meetings of the Council as non-voting members. The Council was responsible for the over-all leadership in economic and social development planning and policy formulation.

16
formulation of policies on the delivery of services and the promulgation of resolutions ofmetro-wide application. However, EO 392 provided that a General Manager, appointedby the President of the Philippines, was to be in charge of day-to-day operations.
Finance. EO 392 reduced mandatory LGU contributions to the MMA from 20percent to 15 percent of LGU regular income. With the implementation of the LocalGovernment Code in 1991, the share of the MMA in the real property tax was alsoreduced from 45 percent to 35 percent. Moreover, provincial taxes which were previouslyaccruing to the MMA prior to the LGC were withdrawn and assigned to member LGUs.Also, the Implementing Rules and Regulations (IRR) of the LGC provided that cities andmunicipalities were no longer required to make contributions to the MMA, causing themember LGUs not to remit any contributions at all. However, the LGC provided forhigher aggregate IRA levels. In sum, the MMA, post-LGC, had to content itself with thefollowing sources of revenue: (1) higher IRA share; (2) reduced/voluntary LGUcontributions; (3) reduced share in some taxes levied by member LGUs; and (4) centralgovernment subsidies.
Table 10 highlights the diminution of MMA income with the implementation ofthe LGC. Effectively, MMA income (expressed in 1992 prices) was reduced by more than50 percent in spite of larger central government subsidies during the period. Expressed asa proportion of GDP, MMA declined from 0.3 percent of GDP in 1991 to 0.1 percent ofGDP in 1992/1993.
At the same time, there was a dramatic shift in the composition of MMA income.The IRA emerged to be the most important revenue source. Its share in total MMAincome rose from 12.2 percent in 1991 to 50.8 percent in 1993. The share of centralgovernments subsidies also rose dramatically from 0.6 percent to 18.2 percent. Incontrast, the share of tax revenues dropped from 44.2 percent to 12.5 percent.
MMA-LGU relations. LGU legislative bodies were re-constituted with theimplementation of the LGC. As earlier noted, mayors of member LGUs are votingmembers of the Metro Manila Council. While the MMA was given the primaryresponsibility over metro-wide services, LGUs were assigned locality-specific services. Inthe post-LGC period, LGUs refuse to remit their contributions to the MMA.
Linkages with national government agencies. The MMA coordinated withsectoral national government agencies the program implementation. The venue for thiswas essentially the participation of selected Secretaries in the Metro Manila Council.
Assessment. Institutional ambiguity, the reduced revenue generating powers as aresult of the passage of the Local Government Code combined to constrict and hamperMMA’s provision of public services in the metropolis. Given its very limited funding, theMMA has had to rely more on its coordinative role. However, in practice, neither theMMA Chairman or General Manager may not have sufficient clout to be effective incoordinating with national government agencies or with the member LGUs themselves.

17
Moreover, the very short term of office of the Chairman of the MMA did not promotecontinuity in policy formulation and program implementation. As such, the focus ofpolicies and programs changes with every turnover in the chairmanship. Also,
Concomitant with the dramatic decline in MMA income with the implementationof the Local Government Code, MMA expenditures also contracted from 0.3 percent ofGDP in 1991 to 0.1 percent of GDP in 1993. However, the composition of MMAexpenditures did not change that much. In 1991-1993, 86.3 percent of MMAexpenditures went into operations. Of this amount, 91.3 percent was allocated to solidwaste management (Table 11).
During this period, LGUs gained increasing prominence as their share in totalgeneral government expenditures rose from 31.5 percent in 1991 to 42.6 percent in 1993(Table 12). This occurred as the expenditures of both the MMA and central governmentagencies declined in terms of 1992 prices and when expressed as a proportion of GDP.Note that many health and social welfare functions previously discharged by the centralgovernment were devolved to LGUs during this period. In like manner, LGUs took oversome of the services in solid waste management that the MMC used to provide.
3.5. Metropolitan Manila Development Authority, 1995 to the Present
Mounting metropolitan problems continued to haunt Metro Manila and the clamorfor a better and stronger metropolitan body became stronger. It was not until 1995 thatthe Lower House and the Senate were able to reach a compromise bill and enactedRepublic Act 7924 . RA 7924 reaffirms the compositional definition of Metro Manilaconstituting it into a “special development and administrative region” subject to directsupervision of the President of the Philippines. The law also provided for the creation ofthe Metropolitan Manila Development Authority (MMDA). In general terms, the MMDAshall perform planning, monitoring, coordinative, regulatory, and supervisory authorityover the delivery of metro-wide services within Metro Manila without diminution of theautonomy of LGUs concerning purely local matters. RA 7924 grants a more permanentterm for the MMDA Chairman. A feature of RA 7924 which is not found in previouslegislation is the prescription for the MMDA to work closely with non-governmentorganizations (NGOs), peoples’ organizations (POs) and the private sector.
Responsibilities. RA 7924 mandates the MMDA to (1) formulate, coordinate, andregulate the implementation of medium- and long-term plans and programs, includinginvestment programs, for the delivery of metro-wide services, land use, and physicaldevelopment; (2) undertake and manage on its own metro-wide programs and projects forthe delivery of specific services under its jurisdiction; (3) set policies concerning traffic inMetro Manila; and (f) install and administer a single ticketing system, fix, impose andcollect fines and penalties for all kinds of traffic violations.
RA 7924 defines the scope of MMDA’s functions to include services “which havemetro-wide impact and transcend local political boundaries or entail huge expenditures

18
such that it would not be viable for said services to be provided by the individual localgovernment units comprising Metro Manila”. These services include developmentplanning, transport and traffic management, flood control and sewerage management,urban renewal, zoning and shelter services, health and sanitation, urban protection andpollution control and public safety.
Authorities. The MMDA, like the MMA, has no legislative powers. Neither canit levy and collect taxes.
Organizational structure. The MMDA structure is almost identical with that ofthe MMA. It has a Chairman, a General Manager (GM), and three Assistant GeneralManagers (AGMs), one each for Planning, Operations, and Finance and Administration(Figure 5). The Chairman is given executive functions, which he shares with the GeneralManager. The Chairman is appointed by the President of the Philippines, holds the rank ofa Cabinet member and holds office at the discretion of the President. The GM and AGMsare also appointed by the President.
The Metro Manila Council remains the policy-making body. The membership ofthe Metro Manila Council is expanded to include the president of the Metro Manila Vice-Mayors League, and the president of the Metro Manila Councilors League, the heads ofthe Department of Tourism (DOT), Housing and Urban Development and CoordinatingCouncil (HUDCC), and the Philippine National Police (PNP) in addition to all the mayorsof member LGUs and the heads of the DOTC, DPWH, DBM.
MMDA has 10,820 personnel service positions, 70 percent of which are filled as ofApril 1998. About 90 percent of the total plantilla positions are allocated to theEnvironmental Sanitation Center (ESC) which are mainly composed of Metro Hardineroor street-sweepers. There is a realization that the MMDA should no longer hire streetsweepers in as much as the LGUs hire their own in their respective localities. The currentproposal to correct the lopsided distribution of manpower complement in the wholeorganizational structure has been submitted by MMDA to the DBM for consideration andstudy. The proposal basically reduces the number of ESC personnel while beefing uppersonnel complement in the technical departments especially in the office of planning,operations and administration.
Finance. RA 7924 prescribes the following sources of revenue for the MMDA:(1) its own IRA share; (2) subsidies from the national government; (3) contribution ofmember LGUs set equal to 5 percent of their total annual gross revenue of the precedingyear, net of IRA; and (4) fines and fees the MMDA may impose and collect for servicesrendered. As such, the MMDA is highly dependent on central government subsidies. In1996-1998, central government subsidies accounted for 48.9 percent of total MMDA
income (Table 10). In comparison, the share of mandatory contributions from memberLGUs was 25.3 percent while that of the IRA was 18.9 percent during the period.

19
MMDA-LGU relations. Policy coordination with the LGUs is done within theMMDA structure through the Metro Manila Council. However, operational coordinationwith respect to area-wide services such as traffic and transport management, solid wastemanagement, disaster management as well as planning functions such as physicalframework, socio-economic and land use planning are coordinated with individual LGUs.
Linkages with national government agencies, NGOs/POs and private sector.Several sectoral national government agencies and government corporations areundertaking various programs and projects in Metro Manila. These include the DPWHresponsible for roads, bridges, flood control and drainage as well as traffic engineering, theDOTC and its various bureaus5 dealing with transport and traffic management, theNational Housing Authority (NHA) on housing, Housing and Land Use Regulatory Board(HLURB) for subdivision plans, Metropolitan Waterworks and Sewerage System(MWSS) for water supply, the Department of Environment and Natural Resources(DENR) on environmental management, the Laguna Lake Development Authority(LLDA) for the management of the Laguna de Bay region encompassing the five cities inMetro Manila, the Department of Interior and Local Government (DILG) exercisingoversight function over the LGUs as well as in police assistance, the National Economicand Development Authority (NEDA) on planning, monitoring and evaluation of plans andprojects and the Department of Health (DOH) on health and sanitation. On top of thesegovernment agencies are ad-hoc commissions or task forces created by the Presidentincluding the Presidential Task Force on Solid Waste Management, the Presidential TaskForce on Traffic Improvement and Management (TRAFIMM), the Philippine Council forSustainable Development and the Cabinet Officer for Regional Development (CORD)6 forNCR who is the HUDCC Chairman serving as the link of Metro Manila to the President.
MMDA coordinates its interregional concerns basically through the NEDA. Thisis with respect to the formulation of its regional development plan and physical frameworkwhich takes into account the spatial development of the metropolis in the neighboringregions of Region III (Central Luzon) and Region IV (Southern Tagalog). However,MMDA needs to improve its linkage with institutions responsible for translating theintererregional framework to actual plans and programs. For instance, at
present, there is no involvement of MMDA in the MARILAQUE Commission establishedby the President to plan for and develop the growth corridor from NCR to the provincesof Rizal, Laguna and Quezon. Neither is MMDA involved with efforts relative toCALABARZON development.
5 These include the Transportation Planning Service of the DOTC Central for overall formulation oftransportation policies, Land Transportation Office (LTO) for vehicle registration, vehicle inspection andissuance of drivers’ license and the Land Transportation Franchising and Regulatory Board (LTFRB) forissuance of franchises to motorized road based modes of public transport services.
6 The CORD system was introduced by the Aquino administration and was carried over by the Ramosadministration. Each of the 15 regions is assigned a CORD coming from the members of the ExecutiveCabinet. It is not yet known whether this system will be continued by the Estrada administration.

20
The MMDA is mandated to enhance institution-building and effective people’sparticipation in governance through (1) private sector/NGO involvement in MMDAprograms and projects; (2) improved transparency through the provision of better privatesector access to information on government activities; and (3) promotion of private sectorinitiatives in urban development.
Assessment. The relatively stable term of office of the Chairman of the MMDAenhances institutional focus and sharpens its vision. Although the scope of its mandateover metro-wide services has been expanded to include more services, it continues toperform a largely coordinative role because its revenue raising powers are still ratherlimited.
The expenditures of the metropolitan entity (expressed in terms of either 1992prices or a proportion of GDP) doubled with the establishment of the MMDA. But whatis perhaps more significant is the fact that the MMDA effectively expanded its ambit toinclude more metro-wide responsibilities. While the operations budgets of both the MMCand the MMA were spent almost solely on solid waste management, that of the MMDA’sis now allocating sizable amounts for traffic and infrastructure development (Table 11).
However, the majority of total general government expenditures in Metro Manilastill comes from central government agencies. At the same time, LGUs continued toexpand in 1996-1997 (Table 12).
4. MAJOR METROPOLITAN GOVERNANCE CHALLENGES
In a nutshell, the problems in metropolitan governance in Metro Manila manifestthemselves in the inefficient and inadequate delivery of metro-wide services. Largely, thislack stems from the rather unwieldy institutional set-up. The following discussion on theimportant management challenges in Metro Manila provides a more detailed explanationof these problems.
4.1. Transport and Traffic Management
As in many big cities in the world, traffic management dominates Metro Manila’sdevelopment challenge. The deterioration of transport and traffic condition has afflictedMetro Manila since the 1950s. Simply put, traffic woes in Metro Manila stem primarilyfrom an insufficient road system, the rapid increase in car ownership, the lack of qualitypublic transportation services, poor enforcement of traffic regulations and lack ofdiscipline on the part of both motorists and pedestrians. These problems are againvalidated in the initial findings of the Metro Manila Urban Transportation IntegrationStudy (MMUTIS 1997).7 In addition, there is a problem of overlapping of functions and
7 The MMUTIS Project was launched in March 1996 with technical assistance from the JapanInternational Cooperation Agency (JICA). The Project, jointly undertaken by the Department ofTransportation and Communication (DOTC), Metro Manila Development Authority (MMDA), National

21
duplication of services in view of the multiplicity of players involved in transport andtraffic management in the metropolis.
Insufficient Road System. Major roads in Metro Manila are no longer sufficientto accommodate the rapidly rising traffic volume which have increased by more than 50percent on the average during the last 15 years (Table 13). Private cars and trucksdominate traffic volume even in bus and jeepney-dominated major routes such as EDSA(C4) and Shaw Boulevard (R5).
Accelerated Increase in Car Ownership. The number of registered vehicles inMetro Manila more than doubled during the period 1980 to 1995, growing at an averagerate of 6 percent annually (Table 14). The increase has been more evident during the 90s.During this period, personal incomes have improved significantly concomitant with theeconomic recovery. At the same time, liquidity in the banking system was relativelyrelaxed and credit access (for car financing) easy.
At present, more than 40 percent of all registered vehicles in the country are plyingin Metro Manila. This represents 1.1 million private and “for-hire” vehicles. Of these,almost half are privately-owned cars and utility vehicles. Household car ownershipdoubled from 9.5 percent in 1980 to 19.7 percent in 1996 (Table 15). The percentage ofhouseholds with more than one car has also risen. A similar trend is also evident in areasadjoining Metro Manila.
The increase in household car ownership has been found to be positively correlatedwith household income. Thus, MMUTIS (1997) projected car ownership to increase by 2percent annually from 1996 to 2015 as population and income levels continue to rise. Carownership in the adjoining areas was projected to increase at an even higher rate of 5.1percent.
Increased Demand for Quality Public Transport Services. Public transportationservices are mainly provided by buses, jeepneys, taxis and tricycles. While the supply ofthese services had increased dramatically through the years (Table 16), traffic congestionhas decreased the quality of service of these transport modes in terms of travel speed,riding comfort and in-vehicle air-quality. Although air-conditioned bus units have
increased in terms of both the number of units and routes, in-vehicle crowding is stillevident and only a few are well-maintained to provide comfort to the riding public. Tosatisfy the demand for better transport services, the number of Tamaraw FX or shared taxion fixed route has increased rapidly since 1995. On the one hand, the addition of these
Economic and Development Authority (NEDA) and the University of the Philippines (UP), is based at theUP National Center for Transportation Studies (NCTS). The long-term objective of the Project is toestablish and update transportation database that will aid in the formulation of a transportation masterplan for Metro Manila to year 2015. The short-term objective is to prepare feasibility studies on priorityprojects that can be implemented within the present time to year 2005. The Project is expected toterminate in March 1999.

22
utility vehicles provided an alternative mode of transport for passengers willing to pay ahigher than the normal fare for efficiency and travel comfort. On the other hand, itcontributed further to the increase in the already high traffic volume and to the furtherworsening of the traffic situation in the metropolis.
Urban rail transport services are still limited. At present, only the LRT Line 1 andthe PNR provide rail transport services. But with the projected completion of the LRTlines 2 and 3 in 1999/2000, urban rail transit will take on a more important role intransport service in the metropolis by the turn of the century.
Need for Institutional Integration and Coordination With a MetropolitanPerspective. A well-integrated and coordinated traffic management has always been achallenge in Metro Manila in view of the many players involved in the sector. Table 17presents the various institutions in transport and traffic management at the national,metropolitan and local levels, including the private sector.
Prior to the creation of the MMDA, institutional integration was approached bycreating the Metro Manila Land Transportation Coordinating Council (MMLTCC). TheMMLTCC was created in 1989 and then redefined in 1994 under Executive Order No.170. It was tasked to be the policymaking body on all matters pertaining to trafficmanagement in Metro Manila. Chaired by the MMA, its members include the CORD forNCR, the Secretaries of DOTC, DPWH, DILG, DECS and the General Manager of MMAas ex-officio member. While the composition of the MMLTCC included the majoragencies involved in traffic management, there has been little actual coordination in policyand program formulation since the Council failed to formulate a unified and adequatetransportation policy which impacts on a more coordinated and consistent (vs.contradictory) implementation of the various programs and projects of the agenciesrepresented. Despite the MMLTCC, some major projects of the national agencies (e.g.,projects which are in the department’s list of priority activities or projects which areforeign funded with committed deadlines to spend the funds) are implemented withoutconsultation with MMA or within the member agencies of the MMLTCC. For instance,the construction by DPWH of a fly-over along a section of Circumferential Road 4 (C-4)which favor private vehicles conflicted with the DOTC’s long-term plan to construct apublic-oriented rail transit system within the same corridor. The presence of the fly-overled to complications in the construction of the on-going Metro Rail Transit therebyincreasing construction and engineering cost, prolonging the construction, and furtheraggravating traffic congestion in the area.
In the initial phase of the MRT project, there has been a serious clamor fromprivate citizens and the business sector to address the traffic problem in the metropoliswhich has already reached a crisis stage. Then President Ramos issued AdministrativeOrder No. 351 in August 1997 creating the Presidential Task Force on TrafficImprovement and Management (TRAFIMM) to be the integrating, coordinating anddirecting authority on traffic management nationwide, particularly in Metro Manila andother urban centers. The TRAFIMM in Metro Manila is headed by the Secretary of the

23
Department of Transportation and Communications with a representative from the privatesector appointed by the President as co-chairman. The members include the Secretaries ofthe DPWH, the Department of Interior and Local Government (DILG) and theDepartment of National Defense (DND), the Chief of the PNP, the Chief of the ArmedForces of the Philippines, the MMDA Chairman, concerned local chief executives, andthree representatives from the private sector appointed by the Chairman of the TaskForce. While the TRAFIMM has made a significant effort in easing traffic condition inMetro Manila through the enforcement of new rules and regulations for landtransportation, the Task Force is faced with certain constraints. It does not have thepolicy formulation mandate and review and approving authority over programs andprojects of the various agencies that would have direct or indirect impact to the transportsituation in the whole metropolis. Moreover, TRAFIMM’s area of intervention is onlylimited to the national highways of the metropolis. The management of traffic in the rest ofthe road network remains the responsibility the LGUs concerned. The traffic managementin Metro Manila., thus, reflects weakened metropolitan planning and policymaking vis-a-vis the national government and local government policy processes.
4.2. Flood Control
The occurrence of both big and isolated flash floods is one of the biggest problemsfacing the metropolis. The reasons for flooding are multitudinous. They include theoverflow of major river systems during intense rain or storm, poor local drainage due toinadequate capacity and maintenance of the system, and illegal encroachment on river andother natural channels by squatters, business establishments and residential houses(MMDA, HUDCC, LOGODEF, 1995). Coordination problems between DPWH,MMDA and LGUs have also caused delayed response to flooding and hindered a moreproactive approach to solve or to mitigate flooding in known flood-prone areas like theKAMANAVA area (Kalookan, Malabon, Navotas, Valenzuela), Central Metro Manila(Tondo, Sta. Cruz, Sampaloc, Sta. Mesa, San Andres, Balon-Bato, Talayan-Tatalon andSan Juan-Mandaluyong), Upper Marikina area, and North Laguna Lakeshore (Manggahanand Taguig-Pateros). Moreover, there is an inadequate regulatory framework withrespect to subdivision and housing development, particularly that related to the provisionof sound and sufficient drainage facilities.
Flood control in Metro Manila is the concern of a number of national and localgovernment instrumentalities. The DPWH is the major implementor of all flood controland drainage projects. The NCR Office of the DPWH provides administrative andtechnical supervision over the operation and maintenance of completed flood control anddrainage projects. With the establishment of the MMDA, this responsibility including theoperation and maintenance of pumping stations and floodgates, is transferred to theMMDA within a transition period of about two years. At present, the turnover of DPWHfunctions and facilities to MMDA relative to flood control has yet to be formalized. Theacquisition of the necessary technical and management capabilities of the MMDA from theDPWH is yet to be determined and evaluated before a turnover shall be effected.

24
The nature of the flooding problem in the metropolis is multidimensional as it doesnot only require infrastructure improvement but also institutional approaches andregulatory policies. Thus, program and policy coordination may have to be tightened byrationalizing the functions of the various agencies that have roles to play in floodmitigation, including the Environment and Management Bureau of the Department ofEnvironment and Natural Resources (DENR/EMB), the Housing Land Use andRegulatory Board (HLURB), the Metropolitan Water Supply and Sanitation System(MWSS), the DND, NEDA, the Laguna Lake and Development Authority (LLDA), andthe LGUs.
4.3. Solid Waste Management
Three major challenges face Metro Manila with respect to solid wastemanagement. The first concerns the need to improve waste collection. The second is theneed to address the problem of final disposal. The third concerns an institutional dilemma.
Waste Collection. Figure 6 shows the waste flow in Metro Manila. Out of the5,350 tons per day waste generated in Metro Manila, about 75 percent are collected whilethe rest are illegally dumped in open spaces or thrown in metropolitan waterways (JICA1998).
Under the current metropolitan arrangement, LGUs are responsible for wastecollection while MMDA is primarily responsible for final disposal of waste collected.Collection coverage for 1997 among the 17 LGUs range from a low of 40 percent in thecase of Navotas to a high of 98 percent in the case of Makati City. The disparity may beattributed to the fiscal capacity of the respective LGUs. LGUs which have high collectioncoverage performance are those which have fully or partly consigned waste collection andhaulage to private companies. JICA (1998) has projected collection coverage of LGUs inthe metropolis to increase or approximate full coverage with greater privatization ofcollection and haulage services during the next decade.
Waste Disposal. One of the biggest challenges in solid waste management inMetro Manila is the identification and maintenance of final disposal sites. At present,there are four available sites for final waste disposal in the metropolis: the two opendumpsites in Payatas and Catmon and the two landfill sites in San Mateo and Carmona.The Payatas and Catmon sites have been closed because of health and environmental risks.Carmona site was also closed due to complaints from the nearby residents and themunicipal government. The San Mateo landfill will reach its full capacity by 2004 but withthe closure of the other sites its full capacity will be reached before the turn of the century.In this regard, the identification and development of a new landfill site will be a criticalconcern in the immediate term. The recently prepared study/master plan for solid wastemanagement in Metro Manila by JICA (JICA,1998) has identified and made a technicalevaluation of candidate disposal sites. Five sites were identified and ranked: Pintong,Bocaue (Rizal), sea landfill in the Navotas offshore area, Kalawakan (Bulacan),

25
Maragondon (Cavite) and Bacolor, Pampanga. The development of any of these sites willbe critical given the circumstances plaguing the existing disposal sites.
Institutional Problem. Pardo (1996) in his analysis of solid waste management inMetro Manila highlighted the absence of a single agency that has overall responsibility forall aspects of solid waste management from collection, transport and transfer, recyclingand final disposal. MMDA, the LGUs and the various units of the DENR and DPWHtake on various functions, jurisdictions and SWM responsibilities. However, noneorchestrates all these activities so that they will be complementary and not conflicting.Such coordinating entity can also develop mechanisms to improve financing arrangementin the delivery of this important urban service.
4.4. Land Use, Housing and Urban Poverty
Land Use. Rapid urbanization over almost 30 years has altered Metro Manila’slandscape as can be gleaned from the changes in the land use mix from 1972 to 1991(Table 18). Residential land use currently predominate land use activity in the metropolis.Three decades ago, open space was the predominant land use. Recreation land usesincluding parks and sports area comprise only one percent of total land area in 1991compared to 20 percent in 1980. A large percentage of these lands for open spaces andfor other purposes have been used for housing.
In spite of this large tract of land currently allocated for residential use, housinglack is still a major problem as manifested by the increased demand for rental housing, theconcomitant rise in rental rates, and the increased number of squatter households. Highland prices and the low income capacity of many families in the metropolis hinder manyhouseholds to participate in government and private housing projects. Thus, about half ofNCR households do not own the land they occupy. The number of squatter families hasbeen rising as many opt to build substandard dwellings in private and public lands withinthe metropolis so as not to be too distant from their employment or livelihood source.
Institutional Arrangements. Housing programs for the poor and low-income hadbeen the purview of national government and LGUs rather than of the metropolitan body.The HUDCC is the national agency tasked with coordination of all government andprivate housing programs. It provides guidelines to implement Republic Act 7279 whichis the basic law for a comprehensive and continuing housing program of which nationalagencies, LGUs, NGOs and the private sector participate. The National HousingAuthority (NHA) is the sole agency engaged in direct shelter production. The UnifiedHome Lending Program (UHLP) supports the financing requirements of the SocialSecurity System (SSS), Government Service Insurance System (GSIS) and the HomeDevelopment Mutual Fund (HDMF), otherwise known as the PAG-IBIG Fund. The 1991Local Government Code empowered LGUs to assume greater responsibilities in deliveringand financing basic infrastructure and urban services.
Squatting Problem. In Metro Manila, the biggest task of LGUs is how to deal

26
with the many squatters that occupy danger areas such as riverbanks, esteros, railroadtracks, garbage dumps, shorelines, waterways and other public places such as sidewalks,roads, parks and playground. There are also those who are threatened with eviction byprivate landowners. The law allows for the eviction and demolition under thesecircumstances. However, LGUs and the MHA are given the responsibility to provide arelocation or resettlement site “with basic services and facilities and access to employmentand livelihood opportunities sufficient to meet the basic needs of the affected families”.
There are not many LGUs in Metro Manila which have been successful inresettling squatters not only because of the political repercussions but also due to theoperational and financial cost, especially when the LGU does not own the available landfor such relocation. Two cities, however, have successfully done so as will be discussedlater in the section on model city programs. One is Marikina City which, as part of itsriver management effort, facilitated the relocation of families from the riverbanks throughthe Community Mortgage Program (CMP). The CMP is an innovative concept of low-income home financing program of the National Home Mortgage Finance Corporation(NHMFC), the government corporation which administers the UHLP, whereby anundivided tract of land may be acquired by several beneficiaries through communityownership. Marikina City took effort in convincing families of the dangers of residingalong the riverbanks and the benefits of eventually owning their own house with veryminimal financial cost. Muntinlupa City also availed of the CMP program and enjoined anNGO to provide interim financing and assistance in negotiations with private landowners.There is no denying, however, that some LGUs have tolerated squatting for politicaladvancement. The tales of these two cities, Marikina and Muntinlupa, provide lessons forthe other LGUs in the metropolis in dealing with the squatting problem.
Squatting Problem as a Metropolitan Governance Challenge. While LGUs aregiven the biggest responsibility in dealing with the squatting problem, the issue takes on ametropolitan dimension in the following situations: (1) when LGUs are constrained withthe absence of land for relocation; (2) when the constraint for relocation is theinaccessibility of people to their place of work due to poor transport system; (3) whensquatting becomes a major factor in the clogging of waterways and sewerage and riversystems causing flooding and aggravating the traffic condition in the metropolis; and (4)when the sub-standard living environment becomes the breeding ground for infectiousdiseases and viruses causing illnesses and deaths in the metropolis (e.g. dengue fever). Itbecomes a national issue when taken in totality as squatting is the glaring symptom ofurban poverty which have to be dealt with by improving not only the macroeconomiccondition but also by providing employment opportunities in the other regions to curtailfurther in-migration to the metropolis. The current administration has put forwardpoverty alleviation as its major focus. In terms of housing for the urban poor, the newlyinstalled leadership underscored the need for government intervention in housingproduction which forms part of its pro-poor program and addressing the current crisis inthe government’s housing finance.

27
5. MODELS OF GOOD GOVERNANCE IN METRO MANILA
The advantage of metropolitan governance under a decentralized framework isthat it allows the local government units within the metropolis to respond directly to thepriority needs of their respective constituents and by seeking creative means to deliverurban services within their jurisdictions.
There are a number of successful and innovative programs undertaken by somecities in Metro Manila. These best practice cases demonstrate that LGUs can be effectivein public service provision when they involve various stakeholders (local institutions andpeople) and when they are able to break free from financial constraints through theadoption of various creative funding schemes. Program sustainability is also achievedwhen it is undertaken within an integrated, intersectoral development strategy thatattempts to capture the synergy from program interdependencies.
5.1. Marikina City: River Park Management
The success of the Marikina River Development Program or what has been morepopularly known as the Save the Marikina River Project provides fresh perspective andvaluable lessons on river rehabilitation and river park management in the metropolis. Theprogram, which started in 1992, has received numerous citations and awards from regionaland national bodies and has been an inspiration to the current efforts to rehabilitate thePasig River of which the Marikina River is a tributary. The city’s project also drewpopularity with the holding of the Philippine Earth Day Festival in April 1996 and theWorld Earth Day Festival in April 1997 where major activities took place in the river park.
The current features of the river park were far more ambitious than what wereoriginally conceived. The simple objective of the city leadership is just to revive the riverand its traditional use as a people’s park, the way it has been prior to the 1970s beforethe squatters settled along the river banks. The task is to simply relocate the squatters andto clean the 22-kilometer stretch, plant shade trees, carve out jogging, biking and walkingpaths along both banks, set-up park benches and put park lights. To date, about 12kilometer stretch has been paved with the following features: a skating rink, picnic andcamping grounds, water fountains, a Roman Garden, gazebos, a floating restaurant (asmall ship turned into a restaurant) and a floating stage (used for public performances).The fountains and the ship are lighted to enhance the view at nighttime.
The river park project is one of the major programs of the city to address abroader city concern which is to improve the living environment and conditions of theMarikina residents. It should be mentioned that about a third of the people are living indepressed areas many of them settling in disaster-prone places such as those located in theriver banks. Flooding is one of the biggest problems of the city. Being situated in avalley, the city has the geographical disadvantage of being vulnerable to flooding. Excessflow of the Marikina River is not only caused by heavy rains but exacerbated by its being arepository of garbage largely coming from factories and homes mired in the waters

28
especially squatter shanties along the river area.
A successful resettlement program, would be a prerequisite to the implementationof a more focused river rehabilitation and park development. While in-city resettlementwas opted instead of relocating people outside the city, surprisingly, resettlement effortwas not as easy as it was thought it would be. After a year of discussion whichnecessitated the hiring of community development experts and sociologists, the squatterfamilies finally were convinced to resettle in Malanday and Tumana areas. Inasmuch asthe land is privately-owned, the city government helped the families to organizethemselves and facilitated their enrollment in the Community Mortgage Program (CMP)so that they will eventually own the land and house they will occupy. One of the majorfactors that led the people to cooperate was the city government’s effort to ensure that theresettlement sites have the basic facilities such as water, electricity and sewerage.
After the resettlement, the city government issued an ordinance that wouldpenalize garbage dumping into the river. A fine of P2000 was set for violators. Theordinance is strictly enforced and those who cannot pay the amount of fine are given theoption to pay the equivalent amount in the form of community service. The constructionof the 5-kilometer biking, jogging and walking lanes passing through 11 of the town’s 14barangays then proceeded. Electric lights were installed and park benches put up along theriver stretch. In cooperation with DENR, eight hundred ornamental trees were initiallyplanted along the river banks. Fish seeding (carp, plapla and tilapia) were also undertakenwhich at present continue to thrive in the river. Marikina river prides itself as the onlybiologically living river in the whole Metro Manila. The rise of numerous structures alongthe river followed. Included here are the playgrounds, picnic groves, camping grounds,basketball courts, skating rink a floating restaurant and water fountains. From 1993 to1997, the city government has spent about P34.7 million or an average of P6.9 million peryear. The city has received about P1.6 million from various national government entitiesincluding funding support from the Countrywide Development Fund (CDF) of twosenators. Donations in kind were given by the city’s private sector. The Chinese Chamberof Commerce built the Chinese Pagoda and the Marikina Zonta Club designed a Romangarden.
The Marikina River Park Authority (MRPA) under Office of the Mayor wascreated to oversee the whole river park program. It is presently an attached agency of thecity government manned by about 50 personnel. MRPA coordinates with the CityEngineering Office, City Settlements Office, City Health Office and City Public Safety andSecurity Office and the barangays. The program is also now being supported through thecity’s radio broadcast facility, DZBF, which airs public service programs and informationabout city programs daily from 6:00 in the morning to 7:30 in the evening. Marikina Cityis the only local government unit in Metro Manila adopting this form of communicationservice to its constituents.
The whole program has achieved more than its basic objective. It caused therecovery of valuable land for public use. It helped restore the people’s confidence in the

29
local government since the river now provides townsfolk a source of pride and recreation.Dredging activities currently being undertaken to alleviate the effects of La Nina can nowbe undertaken with less difficulty as big equipment can easily move around the river park.Lastly, Marikina City’s experience provided hope and a tested model for rehabilitatingwaterways in the other parts of the metropolis.
5.2. Las Pinas City: Urban Renewal and Redesign
A creative way to improve the city’s environment is to introduce changes in thebuilt structures of the city so that it will project a unified architectural theme. This strategywhich aligns itself with the city’s tourism master plan is exemplified by Las Pinas City’sHistorical Corridor Project.
Las Pinas, which has recently been declared a city (from a municipality status), isone of the cleanest and greenest places in Metro Manila. More especially, the city takespride in having the Las Pinas (St. Joseph’s Parish) Church and Bamboo Organ that havegained world-wide fame and which regularly draw local and foreign tourists into the area.This has triggered the realization that the city can develop further its tourism potentialsby restoring its historical and cultural sites and artifacts.
The vision that has been laid down by the city in cooperation with theCongressional district office is to develop a 3.4 kilometer stretch of the city into ahistorical corridor bringing back and showcasing picturesque aspects of Spanish colonialheritage. This covers the old district of Father Diego Cera Avenue stretching fromBarangay Manuyo, Daniel Fajardo, E. Aldana, Ilaya, Pulang Lupa towards Zapote. Theidea is to restore public historical buildings and to allow privately-owned structures withinthe coverage area to conform to an architectural master plan which is essentially aPhilippine-Spanish colonial architecture. A prominent architect was commissioned todraw the city’s architectural design. The architectural standards and guidelines include notonly the design of buildings but also specifications on the design for sidewalks, lamp posts,walls, park benches, street signs, waiting sheds, pot planters and garbage bins.
The project kicked off in 1995 with the signing into law of Republic Act No. 8003declaring the following as priority tourist spots: Las Pinas Church and Bamboo Organ,Las Pinas Bridge, Asinan Area, the Father Cera Bridge and the Old District Hospital and
mandating the Department of Tourism to incorporate these spots in its overalldevelopment program starting 1996.
The city passed an ordinance in this regard (City Ordinance No. 275-96) whichwas enacted in March 1997 entitled “An Ordinance Regulating Construction,Renovation, Alteration or Repair of Properties and Establishments or InfrastructureWorks Undertaken Within the Tourism Development Zone of Las Pinas, Requiring theConformity of Whatever Works in Zone With the Philippine-Spanish Colonial Design”.

30
The ordinance has included other structures not covered under RA 8003 as priority areasfor development, as follows: Plaza Quezon, Zapote Hall, Public Library, Fire Station,andthe Gabaldon Hall in the Las Pinas Elementary School. The Countrywide DevelopmentFund has been used to start restoration and reconstruction work of some public buildingsincluding the Old District Hospital, Manpower School and most recently the DanielFajardo Public Library.
The project has received support from residents, private groups and business clubs.Some even gave donations and offered free services to support the project. TheFederation of Las Pinas Homeowners Association (FOLPHA) expressed no hesitation infully supporting and endorsing the project. The Las Pinas Chamber of Commerce andIndustry has organized a fund-raising activity for the project. The Las Pinas Garden Cluboffered their services of propagating plants, flowers and trees that grace old Filipinohomes. The Zonta Club of Las Pinas donated P5000 for the purchase of two lamp posts.The Philippine Dental Association-Las Pinas Chapter donated P1000 as a sign of support.The Las Pinas Lions Club pledged for the construction of a Spanish-design waiting shed.The Philippine Tourism Authority has fielded a Technical Team to estimate project costfor the improvement of the Bamboo Organ and the Church.
To date, the city is discussing more detailed policies and guidelines particularly onSection 6 of the City ordinance concerning incentives and financial grants for thedevelopment of private properties to comply with the required design. The use of taxincentives is being considered as a possible scheme to effect support and compliance to theprogram.
5.3. Mandaluyong City: Financing Public Infrastructure through Build-Operate-Transfer (BOT) Program
Mandaluyong City’s successful Build-Operate-Transfer (BOT) program8 provideda paradigm shift in reorienting LGUs from being the major infrastructure provider to beinga coordinator and facilitator. It also proved that government-private sector partnershipcan be an effective strategy and mechanism to finance and manage public infrastructure.
Fire destroyed the city’s public market in 1990. As a temporary remedy, the cityofficials allowed areas along roads and sidewalks to preserve the livelihood of some fivehundred displaced market vendors. This temporary public market caused traffic andsanitation problems in the city and thus, rebuilding the market became more immediate.Moreover, the absence of a public market translates into income loss for the city as themarket is an important revenue source.
Considering the strategic location and high land value of the area occupied by the
8 The Mandaluyong Marketplace was one of the early successful BOT projects in the world along
with the North South Expressway of Malaysia, the Hub-River Power Projects of Pakistan and the Euro-Tunnel Link Projects in Europe.

31
public market, the city officials thought that what can be more profitable than justrebuilding the public market is to transform the site as a prime commercial complex.Financially constrained, the city ventured on a recently passed BOT Law (Republic Act6957)9 which enjoins private sector financing of public infrastructure projects. A masterplan was formulated for a brand new market cum commercial complex. The same waspresented to several of the city government’s prospective business partners. The MacroFunders and Developers (MFD) Corporation emerged as the winning bidder.
Mandaluyong City adopted the BT and DOT schemes in the public marketconstruction and maintenance. The following were agreed upon between the citygovernment and MFD under these BOT arrangements. Under the BT concept, (1)MFDbuilds the public market and transfers it immediately to the city government; (2) the citygovernment constructs half of the number of stalls inside the market, while the rest areconstructed by the stallholders themselves; (3) the city government collects the stall feeswhich are then deposited in a bank; and (4) MFD handles maintenance and security.Under the DOT concept, (1) MFD is allowed the construction of a 6-storey commercialcomplex above the public market in exchange for putting up the latter facility for the citygovernment; (2) MFD manages the commercial complex and transfers it to the citygovernment after 40 years; (3) the city government allows MFD the use of the land onwhich facilities have been constructed, free of rent; and (4) the city government does notcollect any dues from MFD for the operation of the commercial complex.
The new seven-storey commercial complex houses a modern public market, fourmovie houses, an amusement plaza including a bowling center, a fast food place, shoppingfacilities and two-level parking area. The construction of the commercial complex has alsosolved constant flooding in the vicinity with the construction of a box
culvert from the main road to the San Juan River. The complex is also provided with amodern garbage collection and waste water pollution control system.
The benefits of the new commercial complex are wide-ranging. Aside fromkeeping the livelihood of the original vendors of the public market, about six hundred newjobs were created. It also benefitted from the escalation in the land value on which the newcomplex is constructed which is estimated to have doubled its value from P10,000 toP20,000 per square meter.
9 The BOT program is considered one of the first multisectoral, integrated infrastructure privatization
in the world. In the Philippines, the BOT scheme was made into a law (Republic Act 6957) in 1991 inresponse to an emergency situation in the power sector. Three years after, the law was amended (RA7718) to make it more flexible and responsive to private investors. Under the BOT program, the privatesector undertakes the construction including its financing, operation and maintenance and then operatesthe facility over a fixed term and then transfers the facility to the government after a term not exceeding50 years. Among the acceptable variants of the BOT include Build-Transfer (BT), Build-Own-Operate(BOO), Build-Lease-Transfer (BLT), Build-Transfer-Operate (BTO), Contract Add-Operate (CAO) andfor rehabilitation projects, Develop-Operate-Transfer (DOT), Rehabilitate-Operate-Transfer (ROT) andRehabilitate-Own-Operate (ROO).

32
Above all, the city program has proven the BOT scheme to be practicable andsuccessful alternative method of financing urban facilities. Other LGUs within MetroManila and from other regions in the country have shown interest in the program andrequested the city more information on how to replicate the program to address theirspecific needs and requirements.
5.4. Muntinlupa City: Housing Program Efforts through Tripartite Partnership
Housing program takes center stage in Muntinlupa City’s priority programs asnearly half of its 400,000 residents belong to the urban poor sector. These large urbanpoor population are occupying 87 blighted communities scattered throughout the city’snine barangays.
The first successful housing program was undertaken in 1988 when the citygovernment assisted the Putatan Urban Poor Association composed of 219 members topurchase a piece of property in Barangay Putatan through the Community MortgageProgram (CMP). The success of this effort made the government realize the importanceof a strong partnership between people’s organization and the city government. In itssucceeding programs, however, a tripartite partnership was forged. The governmentrealized that it needs the help of a third sector, a Non-Government Organization (NGO) toassist in financing and in providing community organizing interventions. Theseinterventions include assistance in negotiating and working for land acquisition as well asthe establishment of systems for collection of dues and contributions among thebeneficiaries.
In 1991, the city started to collaborate work with an NGO called the MuntinlupaDevelopment Foundation (MDF). Prior to this, the MDF has been active in helpingcommunities in land acquisition and community strengthening. It has helped a group of 27families which called themselves Samahang Magkakapitbahay ng Purok 6, Tunasan(SMP-6) acquire the land they occupy. With MDF’s guidance, they were able to raise P300,000 which was then used as advance payment to the landowners. The group alsosecured from the Muntinlupa City government P50,000 to pay for the capital gains tax.Another group it helped was the Putatan Hillside Neighborhood Association (PHNA)composed of 150 members which was facing an eviction case. MDF helped PHNA closea contract with the landowners of the resettlement site. PHNA was able toadvance
P718,000 to the landowners through MDF’s financial assistance of P200,000 and aboutP300,000 from the local government.
With the success of these two projects, the city government formally employed theassistance of MDF in its housing program for the urban poor. A P17 million fund was setaside for this program for interim financing of community associations organized by theMDF. Three urban poor organizations were helped through the program. The first was a

33
group called Samahan ng Nagkakaisang Magkakapitbahay ng Medina Compoundcomposed of 89 members which were resettled outside the city. The second was theSamahan ng Nagkakaisang Magkakapitbahay ng 7-A Extension, Alabang comprising 364members who were victims of fire that razed their houses in 1994. The third was calledthe Samahang Magkakapitbahay ng Cabazas Compound, an urban poor group inBarangay Cupang composed of 56 families. Aside from funds coming from the citygovernment and MDF, the beneficiaries have also raised an aggregate amount of P2.2million for interim financing.The interim financing coming from the city government andMDF are considered loans to the beneficiaries. To ensure high repayment, a compulsorysavings scheme was installed and which MDF closely monitors.
The program has given the city residents land tenure security and instilled in themgreater responsibility and value of hard work. Through the MDF and assistance from thecity government, the various groups have been more active in formulating andimplementing plans to improve water system, drainage, flood control and sanitation intheir respective communities.
6. FUTURE CHALLENGES AND DIRECTIONS
Addressing the challenges of Metro Manila over the medium and long-term wouldentail pursuing three development directions: regional development dispersal, institutionalstrengthening of the metropolitan body and setting up of a more unified and coordinatedmechanism for the various key players involved in the management of Metro Manila.
History tells us that the problems of Metro Manila have to be dealt with at itsroots: addressing the uneven development between geographic regions. Developing themetropolis should be done simultaneously with the other equally promising cities in thecountry as well as promoting growth in the countryside. This would contribute tominimizing further pressure on the already strained metropolitan environment and wouldinvariably help in managing the continued growth of Metro Manila. Furthermore, thedevelopment of Metro Manila should always take into account the development of itsimmediate regions and spillover areas. In this respect, interregional efforts taken throughthe MARILAQUE Commission should be continued. The same effort should be extendedwith respect to developments in the CALABARZON area so that it will not conflict withand instead contribute to realizing the metropolitan vision.
On the other hand, a sound and respectable metropolitan institution, politically andtechnically armed to address the problems and needs of the metropolis is critical if successis to be achieved. Metro Manila’s management experience under three governance regimesover the past three decades has highlighted the importance of finding the optimal mix ofpowers, functions and responsibilities amongst the national government agencies, localgovernment units and the metropolitan body in managing the metropolis. What is evidentis that the local government units can singly handle local concerns effectively andefficiently depending on the leadership, the administrative capability and the financial

34
capacity of the LGU concerned as shown by the model cities presented. On the otherhand, international experience indicates that the metropolitan body plays a distinct andcritical role in addressing concerns which transcend local boundaries and which arecharacterized by economies of scale and externalities.
A number of challenges and opportunities are evident in the need to strengthen theMMDA. First, although it may still be relatively premature to evaluate the effectiveness ofthe existing organization in tackling metropolitan issues, there is a perception among thelocal government units in Metro Manila at present of the MMDA’s incapability tocommand respect and authority over them. The appointment of the MMDA Chairmanshould always be given serious thought – the same fervency as appointing a major cabinetpost. The MMDA leadership must be able to put political and national governmentleaders together while making the organization more credible to earn the command andrespect from the LGUs it coordinates.
Second, in the medium-term, the national government has to seriously examineMMDA’s proposed reorganization plan so that it will be enabled to improve its capacityto fulfill its roles and functions both from the standpoint of effectiveness and efficiency.Of greatest importance is the need for the metropolitan body to revitalize the developmentplanning function that has not been adequately carried out of late. MMDA should providethe planning leadership in the pursuit of area-wide functions and in inspiring LGUs toattain a common vision for the metropolis. Such planning function cannot be carried outeffectively if human resource availability and professional expertise are not improved.
Third, the review of the performance of the different metropolitan arrangements inMetro Manila in the past indicates that a common thread that runs through the variousexperiments is the very limited role the metropolitan body has actually played in terms ofactual delivery of metro-wide services. The MMC, MMA and MMDA have all relied forthe most part on national government agencies in ensuring that metro-wide services aremade available to Metro Manila residents. To a large extent, all three metropolitan bodieshave exercised their coordinative function more than their service delivery function. Whilethe MMDA appears to have taken on more responsibilities in the delivery of metro-wideservices, a hefty proportion of metro-wide services still remains with national governmentagencies. This development is primarily explained by the fact that although the nationalgovernment has continuously provided subsidies to the metropolitan body, it still allocatesa sizable portion of the budget for metro-wide services to national government agencies.Thus, funding support for metro-wide services is principally retained in the budgets ofnational government agencies. (In contrast, funding support given to the metropolitanbody (whether in terms of revenue raising powers or direct budget support) has neverbeen commensurate with its expenditure assignment.) These agencies, being linedepartments, are inherently concerned with their own sectoral priorities rather than withthe serving the needs of the metropolis per se. Consequently, the metropolitan body is leftwith the very difficult task of having to orchestrate the sectoral programs of variousnational government agencies, including metro-wide services. This situation not onlymakes government effort almost intractable but also increases costs in terms of both

35
manpower and financial costs.
The recently installed national leadership has recognized the problems ofurbanization, in general, and Metro Manila, in particular. A Presidential Commission orTask Force on Urbanization has just been formed to review and fine tune policies andinstitutions to effectively and efficiently address urban issues in the country, speciallyMetro Manila. The present study which attempts to digest some of the lessons learnedfrom the experimental laboratory that Metro Manila has become in the recent past shouldhelp provide needed inputs in moving the metropolis onwards to the next millenium.

36
REFERENCES
Caoili, Manuel A. (1985). “Reflections on Metropolitan Manila Reorganization and SocialChange”. In Journal of Public Administration, Vol. XXIX, No. 1 January 1985.
Congress of the Philippines (1995). Republic Act No. 7924. An Act Creating theMetropolitan Manila Development Authority, Defining Its Powers and Functions,Providing Funds Therefor and for Other Purposes.
Corpuz, Arturo G. (1995). Metro Manila Growth Directions: Location, Distributionand Shape. Input Study for the National Urban Policy prepared for NEDA.
Go-Soco Jr., Buenaventura (1988). A Study on the Possibility of Establishing ARegional Development Council (RDC) and Promoting Coordinated Developmentin the National Capital Region, Unpublished Material, November 1988.
Housing and Urban Development Coordinating Council (HUDCC) / Housing and LandUse Regulatory Board (1994). National Urban Development and HousingFramework 1993-1998, Second Edition, May 1994.
HUDCC and Local Government Development Foundation, Inc. (LOGODEF) (1995).Metropolitan Manila Management Study, January 1995. [In the text, this paper isreferred to as MMMS.]
HUDCC / Planning and Development Collaborative International (PADCO) (1992).Urban Development Sector Review.
Interagency Committee on Metropolitan Manila (1973) Metropolitan Manila Authority:A Development and Reform Strategy Proposal, Government Printing Office, Manila
Japan International Corporation Agency (JICA) (1997) A Factbook on Metro Manila’sTransportation and Traffic Situation (Draft Version) prepared by the MMUTISStudy Team.
JICA and Metropolitan Manila Development Authority (1998) The Study on Solid WasteManagement for Metro Manila in the Republic of the Philippines (Master PlanReport) March 1998.
League, Jose Antonio L. (1993) Manila Metropolitan Management Experience. A Paperprepared for the World Bank in connection with the Metropolitan ManagementSystems – Workshop on Policy Options, Feb 6, 1993, Manila.
Metro Manila Authority (1993). National Capital Region – Regional Development Plan1993-1998. July 1993.

37
Metropolitan Manila Commission (1972) Toward the City of Man: The Metro ManilaApproach to Urban Management
Metro Manila Development Authority (1996). Towards a Humane World ClassMetropolis: A Physical Framework Development Plan for Metro Manila, 1996-2016.
Metropolitan Manila Development Authority. Urban Planning and Development inMetro Manila. Makati: MMDA, 1996.
National Economic and Development Authority (1998). Philippine NationalDevelopment Plan for the 21st Century, Pasig City.
National Economic and Development Authority (1994). Draft National Urban Policy,December 1994.
National Economic and Development Authority (1994). Final Report: ConsultativeMeeting on the Draft National Urban Policy Framework, December 8-9, 1994,Manila.
Pardo, Erlito (1996). Country Report of the Philippines in Urban Infrastructure Finance,Royston A.C. Brockman and Allen Williams (eds.), Asian Development Bank, Manila.
Pernia, Ernesto and Rex David Israel. “Spatial Development, Urbanization and MigrationPatterns in the Philippines,” in Arsenio Balisacan et al., Spatial Development, LandUse, and Urban-Rural Growth Linkages in the Philippines. Manila: NEDA, 1994.
United Nations University (1994). Mega-City Growth and the Future, UNU Press,Tokyo.

38
Table 1Demographic Facts About Metro Manila
1948 1960 1970 1980 1990 1995 1998 a/
Total Metro Manila Population (in 000) 1,569 2,462 3,967 5,926 7,948 9,454 10,012 Urban Metro Manila Population 1,526 2,427 3,967 5,926 7,948 9,454 10,012 Level of Urbanization - Total Metro Manila 97.3 98.6 100.0 100.0 100.0 100.0 100.0 Level of Urbanization - Total Philippines 27.0 29.8 31.8 37.1 47.0 55.0 Metro Manila Primacy 29.4 30.1 34.0 33.2 27.8 25.1 Metro Manila Popn as % of Total Philippine Popn 7.9 9.0 10.8 12.3 13.1 13.8 13.7 Growth Rate of Total Metro Manila Popn 3.8 4.9 4.1 3.0 3.3 1.9 Growth Rate of Total Philippine Popn 2.9 3.1 2.7 2.4 2.3 2.1 Growth Rate of Urban Metro Manila Popn 3.9 5.0 4.1 3.0 3.3 1.9 Growth Rate of Urban Philippine Popn 3.8 3.8 4.3 4.8 5.7 Total Philippine Popn (in 000) 19,234 27,088 36,684 48,098 60,703 68,617 73,131
a/ - 1998 figures are based on NSO medium asssumption projections

39
Table 2Population Density
Land Area Density (persons/sq km)(sq km) 1995 1990 Growth Rate
National Capital Region 636.0 14,864.8 12,497.5 3.30Manila 38.3 43,205.2 41,807.7 0.62Mandaluyong 26.0 11,033.5 9,544.0 2.75Marikina 38.9 9,183.3 7,975.0 2.68Pasig 13.0 36,236.5 30,590.7 3.22Quezon 166.2 11,970.0 10,046.8 3.34San Juan 10.4 11,941.1 12,197.5 -0.40Kalookan 55.8 18,336.2 13,681.3 5.64Malabon 23.4 14,849.7 11,967.0 4.13Navotas 2.6 88,091.9 72,107.3 3.82Valenzuela 47.0 9,301.4 7,238.9 4.81Las Pinas 41.5 9,953.9 7,159.1 6.37Makati 29.9 16,193.2 15,156.2 1.25Muntinlupa 46.7 8,562.0 5,961.7 7.02Paranaque 38.3 10,216.6 8,047.9 4.57Pasay 13.9 29,396.4 26,501.2 1.96Pateros 10.4 5,316.0 4,943.2 1.37Taguig 33.7 11,316.0 7,912.1 6.93
Source : Philippine Statistical Yearbook

40
Table 3Gross Domestic Product Structure
1975 1980 1985 1990 1992 1997 Ave
1985-1997
Metro Manila Share in National Gross Domestic Product (GDP)/Gross Value Added (GVA)GDP 28.99 30.16 28.35 32.27 32.39 32.74 34.48 GVA in Industry Sector 44.18 40.94 42.97 38.82 38.30 38.41 38.71 GVA in Manufacturing 47.86 48.02 45.80 42.97 42.03 43.26 43.82 GVA in Construction 38.40 32.84 40.97 36.49 34.09 30.08 30.46 GVA in Service Sector 37.84 37.89 35.06 43.29 43.69 44.09 44.81
Rate of Growth (in Constant Prices)MM GDP 6.28 (1.88) 5.01 (1.43) 5.04 3.92 MM GVA in Industry Sector 6.84 (2.20) 2.16 (3.68) 5.16 2.39 MM GVA in Manufacturing 6.45 (2.00) 2.13 (3.51) 4.63 2.19 MM GVA in Construction 9.16 (6.37) 5.72 (10.13) 7.10 3.45 MM GVA in Service Sector 5.69 (1.52) 7.54 0.26 4.96 5.22
Phil GDP 6.21 (0.54) 3.30 (0.12) 4.43 3.19 Phil GVA in Industry Sector 7.34 (2.82) 4.97 (1.61) 5.33 3.99 Phil GVA in Manufacturing 5.82 (1.42) 4.09 (1.09) 4.45 3.36 Phil GVA in Construction 12.54 (9.83) 8.76 (6.93) 9.59 6.31 Phil GVA in Service Sector 5.76 (0.40) 4.05 0.59 4.71 3.74
Source: National Income Accounts, National Statistical and Coordination Board (NIA, NSCB)

41
Table 4Regional GDP Per Capita
1975 1980 1985 1990 1992 1995 1997
Regional Per Capita ProductNCR METRO MANILA 6,690.74 13,470.54 25,019.63 43,248.94 51,037.53 65,997.11 82,832.38 CAR CORDILLERA 17,580.16 20,102.59 30,643.55 39,028.29
I ILOCOS REGION 1,432.22 3,023.31 7,033.52 9,114.20 10,138.93 15,460.37 19,214.84 II CAGAYAN VALLEY 1,576.38 3,414.78 6,633.67 10,082.73 11,000.61 15,920.29 19,000.68
III CENTRAL LUZON 2,493.54 5,091.92 10,752.08 14,725.86 18,157.82 23,070.69 28,033.37 IV SOUTHERN TAGALOG 3,240.44 6,412.99 13,077.57 18,639.03 22,897.88 27,514.33 32,059.18 V BICOL REGION 1,301.04 2,535.45 5,352.01 8,113.76 9,693.97 12,920.43 15,551.18
VI WESTERN VISAYAS 2,625.57 4,388.56 8,380.95 13,968.60 17,148.19 22,868.79 27,336.57 VII CENTRAL VISAYAS 2,261.58 4,957.55 9,814.93 15,315.41 18,605.89 24,217.04 30,451.17
VIII EASTERN VISAYAS 1,230.54 2,193.47 5,377.63 9,197.60 10,879.48 14,213.02 17,195.30 IX WESTERN MINDANAO 1,470.85 3,499.57 7,515.23 9,795.78 11,691.13 18,930.41 20,774.61 X NORTHERN MINDANAO 2,194.16 4,730.41 10,339.12 13,816.78 16,557.61 22,070.15 24,716.30
XI SOUTHERN MINDANAO 3,050.11 5,320.13 11,735.76 18,474.67 21,206.58 28,062.74 32,031.06 XII CENTRAL MINDANAO 1,957.35 4,212.76 8,727.88 11,828.27 13,768.27 23,217.11 26,402.07
ARMM MUSLIM MINDANO 9,397.12 10,699.74 PHILIPPINES 2,726.30 5,502.34 11,207.01 17,611.42 21,107.53 27,778.00 33,722.49
Ratio of Regional Per Capita Product to National Per Capita Product (%)
NCR METRO MANILA 245.41 244.81 223.25 245.57 241.80 237.59 245.63 CAR CORDILLERA 99.82 95.24 110.32 115.73
I ILOCOS REGION 52.53 54.95 62.76 51.75 48.03 55.66 56.98 II CAGAYAN VALLEY 57.82 62.06 59.19 57.25 52.12 57.31 56.34
III CENTRAL LUZON 91.46 92.54 95.94 83.62 86.03 83.05 83.13 IV SOUTHERN TAGALOG 118.86 116.55 116.69 105.83 108.48 99.05 95.07 V BICOL REGION 47.72 46.08 47.76 46.07 45.93 46.51 46.12
VI WESTERN VISAYAS 96.31 79.76 74.78 79.32 81.24 82.33 81.06 VII CENTRAL VISAYAS 82.95 90.10 87.58 86.96 88.15 87.18 90.30
VIII EASTERN VISAYAS 45.14 39.86 47.98 52.23 51.54 51.17 50.99 IX WESTERN MINDANAO 53.95 63.60 67.06 55.62 55.39 68.15 61.60 X NORTHERN MINDANAO 80.48 85.97 92.26 78.45 78.44 79.45 73.29
XI SOUTHERN MINDANAO 111.88 96.69 104.72 104.90 100.47 101.03 94.98 XII CENTRAL MINDANAO 71.79 76.56 77.88 67.16 65.23 83.58 78.29
ARMM MUSLIM MINDANO 33.83 31.73 PHILIPPINES 100.00 100.00 100.00 100.00 100.00 100.00 100.00
Annual Rates of Change (%), at Constant Prices 1975-1980 1980-1985 1985-1990 1990-1992 1992-1997 1985-1997
NCR METRO MANILA 2.60 (4.93) 1.98 (4.58) 1.68 0.73 CAR CORDILLERA (1.53) 5.62
I ILOCOS REGION 2.94 0.76 (2.70) (4.79) 4.63 (0.07) II CAGAYAN VALLEY 4.66 (4.37) (0.08) (6.61) 3.85 0.40
III CENTRAL LUZON 3.31 (2.46) 0.34 (0.31) 2.01 0.92 IV SOUTHERN TAGALOG 2.58 (2.73) 0.03 (1.65) 0.61 (0.01) V BICOL REGION 3.74 (2.54) 0.59 (1.39) 1.37 0.58
VI WESTERN VISAYAS 1.62 (5.01) 2.26 1.20 2.04 1.99 VII CENTRAL VISAYAS 5.57 (3.64) 0.80 (1.73) 2.79 1.20
VIII EASTERN VISAYAS 2.07 (1.54) 0.94 (2.47) 1.99 0.80 IX WESTERN MINDANAO 7.04 (1.27) (2.45) (2.21) 4.43 0.40 X NORTHERN MINDANAO 5.38 (1.24) (2.10) (1.73) 1.35 (0.61)
XI SOUTHERN MINDANAO 0.69 (0.91) 1.09 (3.67) 1.00 0.24 XII CENTRAL MINDANAO 6.65 (2.87) (2.20) (3.41) 5.76 0.83
ARMM MUSLIM MINDANOPHILIPPINES 3.41 (3.06) 1.01 (2.38) 2.05 0.86
Source: Basic data from NIA, NSCB

42
Table 5Poverty Incidence of Families, By Region and Urbanity, 1985-1997
ReductionRegion 1985 1988 1991 1994 1997 p/ 1985-1994 1985-1997
Philippines 44.2 40.2 39.9 35.5 32.1 8.7 12.1
NCR 23.0 21.6 13.2 8.0 7.1 15.0 15.9 Areas Outside NCR 47.5 43.1 44.2 39.9 36.2 7.6 11.3
CAR -- 41.9 48.8 51.0 42.3 -- --I ILOCOS REGION 37.5 44.9 48.4 47.9 37.6 (10.4) (0.1)
II CAGAYAN VALLEY 37.8 40.4 43.3 35.5 31.6 2.3 6.2 III CENTRAL LUZON 27.7 29.3 31.1 25.2 16.8 2.5 10.9 IV SOUTHERN TAGALOG 40.3 41.1 37.9 29.7 25.7 10.6 14.6 V BICOL REGION 60.5 54.5 55.0 55.1 50.1 5.4 10.4
VI WESTERN VISAYAS 59.9 49.4 45.3 43.0 41.6 16.9 18.3 VII CENTRAL VISAYAS 57.4 46.8 41.7 32.7 34.2 24.7 23.2
VIII EASTERN VISAYAS 59.0 48.9 40.1 37.9 40.7 21.1 18.3 IX WESTERN MINDANAO 54.3 38.7 49.7 44.7 39.8 9.6 14.5 X NORTHERN MINDANAO 53.1 46.1 53.0 49.2 46.8 3.9 6.3
XI SOUTHERN MINDANAO 43.9 43.1 46.2 40.3 37.9 3.6 6.0 XII CENTRAL MINDANAO 51.7 36.1 57.0 54.7 49.1 (3.0) 2.6
ARMM MUSLIM MINDANO -- -- 50.7 60.0 58.6 -- --
p - prelimanary results of the 1997 FIES
Source: Economic and Social Statistics Office, NSCB

43
Table 6Gini Concentration Ratios By Region
1985, 1988, 1991, 1994 and 1997
Region 1985 1988 1991 1994 1997 p/
Philippines 0.4466 0.4446 0.4680 0.4507 0.4960
NCR METRO MANILA 0.4146 0.4258 0.4282 0.3967 0.4713
CAR CORDILLERA a/ 0.3741 0.4372 0.4100 0.4631
I ILOCOS REGION b/ 0.4011 0.3743 0.4039 0.3814 0.4249
II CAGAYAN VALLEY c/ 0.3856 0.3962 0.4172 0.4056 0.4122 III CENTRAL LUZON 0.3992 0.3861 0.3986 0.3630 0.3675 IV SOUTHERN TAGALOG 0.4058 0.4034 0.4236 0.4016 0.4258 V BICOL REGION 0.3798 0.3876 0.3910 0.4116 0.4370
VI WESTERN VISAYAS 0.4499 0.4080 0.4031 0.4063 0.4414 VII CENTRAL VISAYAS 0.4537 0.4602 0.4604 0.4417 0.4758
VIII EASTERN VISAYAS 0.3904 0.4041 0.4149 0.4198 0.4483 IX WESTERN MINDANAO 0.3947 0.4087 0.4057 0.3861 0.4775 X NORTHERN MINDANAO 0.4539 0.4424 0.4380 0.4157 0.4965
XI SOUTHERN MINDANAO 0.3932 0.4019 0.4348 0.4114 0.4452 XII CENTRAL MINDANAO 0.3709 0.3583 0.4050 0.4280 0.4638
ARMM MUSLIM MINDANO 0.3197 0.3125 0.3441 CARAGA 0.4411
a - Not yet generated in 1985
b - In 1985, includes CAR provinces
c - In 1987, includes Sultan Kudarat
p - preliminary results
Source: FIES, NSO

44
Table 7Household Population 15 Years Old and Over By Employment Status
Employment Status Year Philippines Metro Manila
Projected HH Population, 15 yrs. Old and over (000)1988 35,865 5,005 1989 36,916 5,148 1990 37,999 5,296 1991 39,114 5,447 1992 40,265 5,609 1993 41,453 5,781 1994 42,670 5,969 1995 42,770 6,164 1996 45,034 6,338 1997 46,214 6,516
Percent in the Labor Force1988 65.4 60.2 1989 64.6 58.5 1990 64.5 59.8 1991 64.5 61.6 1992 65.0 61.5 1993 64.7 59.5 1994 64.4 60.1 1995 65.6 60.0 1996 65.8 62.5 1997 65.5 63.4
Unemployment Rate1988 8.3 17.2 1989 8.4 15.9 1990 8.1 14.1 1991 9.0 15.4 1992 8.6 15.7 1993 8.9 16.1 1994 8.4 16.2 1995 8.4 15.8 1996 7.4 11.6 1997 7.9 14.5
Source : 1998 Philippine Statistical Yearbook

45
Table 8Inflation by Region
AVERAGE1975-1980 1980-1985 1988-1997 1990 1991 1992 1993 1994 1995 1996 1997
NCR METRO MANILA 11.45 19.99 11.3 16.15 20.66 12.17 10.50 10.19 8.10 8.33 6.59 CAR CORDILLERA 9.5 12.33 15.69 6.55 7.65 11.01 7.97 7.29 2.08
I ILOCOS REGION 12.29 20.84 9.9 13.02 16.19 7.43 10.91 8.43 8.40 8.94 2.94 II CAGAYAN VALLEY 11.71 18.54 9.4 15.25 15.51 10.85 7.83 5.67 6.49 9.12 3.79
III CENTRAL LUZON 12.54 22.42 9.6 12.26 20.64 7.46 5.58 9.98 6.62 7.96 5.98 IV SOUTHERN TAGALOG 12.21 19.98 10.0 13.35 18.67 7.77 5.88 8.98 7.87 8.61 5.78 V BICOL REGION 14.13 19.50 10.2 16.07 16.40 7.11 7.54 8.25 10.68 9.93 2.39
VI WESTERN VISAYAS 12.04 21.31 10.0 14.70 19.03 6.11 8.34 7.09 9.16 7.58 4.01 VII CENTRAL VISAYAS 11.46 21.03 10.5 19.45 21.86 8.05 6.38 8.01 6.98 7.53 5.13
VIII EASTERN VISAYAS 12.55 19.26 9.8 9.49 18.22 9.22 6.78 9.35 9.87 9.65 1.62 IX WESTERN MINDANAO 11.10 21.00 9.8 14.12 18.02 6.95 6.80 9.24 7.14 10.83 2.74 X NORTHERN MINDANAO 14.45 19.80 9.3 11.67 15.52 9.12 5.65 9.27 7.94 7.86 4.21
XI SOUTHERN MINDANAO 13.23 20.02 8.5 9.84 14.43 9.28 4.71 8.68 8.10 7.49 4.16 XII CENTRAL MINDANAO 13.45 20.74 9.5 13.68 18.21 9.01 5.99 7.85 5.29 7.66 4.90
ARMM MUSLIM MINDANO 9.25 7.83
PHILIPPINES 12.38 20.48 10.2 14.17 18.66 8.95 7.61 9.03 8.08 8.43 5.01
Source: Basic data from NSCB

Table 9Comparative Overview of Metro Manila Commission (P.D. 824), Metro Manila Authority (E.O. 392),
and Metro Manila Development Authority (R.A. 7924)
Metrowide Legislative Powers Executive Structure Major Functions Intergovernmental Sources of OtherInstitutions Relations Revenue Characteristics
Metropolitan Metro Manila Commission Governor 1. Delivery of metro- 1. Local legislative 1. Even taxes 1. Personality centeredManila itself had legislative wide services councils abolishedCommission powers Vice Governor 2. Share in proceeds 2. Single tier legislative(MMC) 2. Coordination of 2. City and municipal of LGU taxes (e.g. council
Commission for other services mayors also act as 45% of RPT) a) Planning area managers b) Operations 3. Development 3. IRA c) Finance planning 3. Sectoral Departments
coordinated by 4. Central governmentAll appointed by Metro Governor of subsidies President National government
5. LGU constructions - 20% of all regular revenue
Metropolitan None Chairman of Council - 1. MMA gives jurisdiction 1. Local legislative 1. Share in proceeds 1. Basically weak-Manila elected by member - over delivery of basic councils retained of LGU taxes (e.g. legally andAuthority mayors urban services 35% of RPT) institutionally(MMA) requiring coordination; 2. City and municipal
General Manager - but de facto MMA mayors sit in the 2. IRA appointed by President was limited to metro council
coordination 3. Central government3. Sectoral subsidies
2. Development departments planning coordinate programs 4. Lower LGU contribution - 15 %
implementation of all regular revenue; with MMA but unable to collect after LGC
implementation
Metropolitan None Chairman - 1. Delivery of metro- 1. Local legislative 1. IRA 1. Stronger than MMAManila appointed by President wide services councils retained but weaker thanDevelopment with cabinet rank 2. Central government MMCAuthority 2. Coordination of 2. City and municipal subsidies(MMDA) General Manager - other services mayors sit in the
appointed by President metro council 3. Lower LGU contribution - 5 % of3. Development all regular revenue net of IRA planning 3. Sectoral
departments coordinate programs implementation with MMA
Source: MMC/MMA entries adapted from MMMS 1993

Table 10Comparative Revenue Sources of Metropolitan Organization
I. Metro Manila Commission 1988-1990
Level in Current Prices (P million) Level in 1992 Prices (P million) % SharesSource 1988 1989 Average 1988 1989 Average 1988 1989 Average
1. Tax Revenues 268.75 336.37 302.56 416.20 477.78 446.99 44.25 42.16 43.20A. Real Property Tax 192.37 228.17 210.27 297.91 324.09 311.00 31.67 28.60 30.13B. Business Taxes 45.26 55.29 50.28 70.09 78.53 74.31 7.45 6.93 7.19C. Other Taxes 31.12 52.91 42.02 48.19 75.15 61.67 5.12 6.63 5.88
2. Non-Tax Revenues 62.13 94.64 78.39 96.22 134.43 115.32 10.23 11.86 11.053. Other Income (Receipts) 276.5 366.91 321.71 428.20 521.15 474.68 45.52 45.98 45.75
A. Statutory Contributions 198.28 293.15 245.72 307.07 416.39 361.73 32.65 36.74 34.69B. Internal Revenue Allotment 26.01 52.61 39.31 40.28 74.73 57.50 4.28 6.59 5.44C. Capital Revenue 0.08 0.33 0.21 0.12 0.47 0.30 0.01 0.04 0.03D. Grants & Aids 52.13 20.82 36.48 80.73 29.57 55.15 8.58 2.61 5.60
Total Income 607.38 797.92 702.65 940.62 1133.36 1036.99 100.00 100.00 100.00
% of GDP 24.18 26.72 25.51
II. Metro Manila Authority 1991-1993
Level in Current Prices (P million) Level in 1992 Prices (P million) % Shares1991 1992 1993 Average 1991 1992 1993 Average 1991 1992 1993 Average
1. Tax Revenues 464.87 167.08 79.14 237.03 501.62 167.08 74.16 247.62 41.01 28.57 13.35 27.64A. Real Property Tax 355.31 149.13 79.14 194.53 383.40 149.13 74.16 202.23 31.35 25.50 13.35 23.40B. Business Taxes 62.85 10.67 0.00 24.51 67.82 10.67 0.00 26.16 5.54 1.82 0.00 2.46C. Other Taxes 46.71 7.28 0.00 18.00 50.40 7.28 0.00 19.23 4.12 1.24 0.00 1.79
2. Non-Tax Revenues 112.02 85.46 77.42 91.63 120.88 85.46 72.55 92.96 9.88 14.61 13.06 12.523. Other Income (Receipts) 556.64 332.27 436.25 441.72 600.64 332.27 408.82 447.25 49.11 56.82 73.59 59.84
A. Statutory Contributions 422.26 0.00 0.00 140.75 455.64 0.00 0.00 151.88 37.25 0.00 0.00 12.42B. Internal Revenue Allotment 128.36 184.45 321.28 211.36 138.51 184.45 301.08 208.01 11.32 31.54 54.20 32.35C. Capital Revenue 0.00 0.00 0.00 0.00 0.00 0.00 0.00 0.00 0.00 0.00 0.00 0.00D. Grants & Aids 6.02 147.82 114.97 89.60 6.50 147.82 107.74 87.35 0.53 25.28 19.39 15.07
Total Income 1133.53 584.81 592.81 770.38 1223.14 584.81 555.54 787.83 100.00 100.00 100.00 100.00
% of GDP 27.66 13.36 12.34 17.79
III. Metro Manila Development Authority 1996-1998
Level in Current Prices (P million) Level in 1992 Prices (P million) % Shares1996 1997 1998 Average 1996 1997 1998 Average 1996 1997 1998 Average
1. Tax Revenues 0.00 0.00 0.00 0.00 0.00 0.00 0.00 0.00 0.00 0.00 0.00 0.00A. Real Property Tax 0.00 0.00 0.00 0.00 0.00 0.00 0.00 0.00 0.00 0.00 0.00 0.00B. Business Taxes 0.00 0.00 0.00 0.00 0.00 0.00 0.00 0.00 0.00 0.00 0.00 0.00C. Other Taxes 0.00 0.00 0.00 0.00 0.00 0.00 0.00 0.00 0.00 0.00 0.00 0.00
2. Non-Tax Revenues 120.51 111.73 122.50 118.25 87.55 76.41 76.16 80.04 7.68 6.11 6.77 6.853. Other Income (Receipts) 1448.28 1716.24 1687.61 1617.38 1052.18 1173.72 1049.21 1091.70 92.32 93.89 93.23 93.15
A. Statutory Contributions 372.96 471.62 476.99 440.52 270.96 322.54 296.55 296.68 23.77 25.80 26.35 25.31B. Internal Revenue Allotment 307.89 313.16 361.80 327.62 223.68 214.17 224.94 220.93 19.63 17.13 19.99 18.92C. Capital Revenue 0.00 0.00 0.00 0.00 0.00 0.00 0.00 0.00 0.00 0.00 0.00 0.00D. Grants & Aids 767.43 931.46 848.82 849.23 557.53 637.01 527.73 574.09 48.92 50.96 46.89 48.92
Total Income 1568.80 1827.97 1810.11 1735.62 1139.73 1250.13 1125.38 1171.74 100.00 100.00 100.00 100.00
% of GDP 21.78 21.88 19.59 21.06
Source: Data for MMC and MMA from MMMS 1993; Data for MMDA from MMDA

2
Table 11Expenditure Pattern of Metropolitan Body
Levels (in million Pesos) % distributionI. MMC 1988 1989 Average 1988 1989 Average
Administrative Office 53.41 97.17 102.00 10.99 13.59 12.09 Operations 417.46 587.64 711.28 85.89 82.22 84.33 of which; solid waste 383.23 540.63 653.54 78.85 75.64 77.49 others 34.23 47.01 57.74 7.04 6.58 6.85 Other Purposes 15.18 29.94 30.15 3.12 4.19 3.57 Total 486.05 714.75 843.43 100.00 100.00 100.00
Levels (in million Pesos) % distributionII. MMA 1991 1992 1993 Average 1991 1992 1993 Average
Administrative Office 80.16 72.06 73.48 225.70 7.29 8.97 10.37 8.64 Operations 888.70 720.97 625.82 2,235.49 80.77 89.79 88.32 85.59 of which; solid waste 822.94 658.97 561.99 2,043.89 74.79 82.07 79.31 78.26 others 65.76 62.00 63.83 191.60 5.98 7.72 9.01 7.34 Other Purposes 131.42 9.91 9.29 150.62 11.94 1.23 1.31 5.77 Total 1,100.28 802.94 708.59 2,611.81 100.00 100.00 100.00 100.00
Levels (in million Pesos) % distributionIII. MMDA 1996 1997 Average 1996 1997 Average
Administrative Office 124,920.85 128,125.38 188,983.54 8.05 7.27 7.77 Operations 1,247,011.37 1,377,775.76 1,935,899.25 80.34 78.20 79.57 of which; solid waste 1,041,997.15 1,188,062.01 1,636,028.15 67.13 67.43 67.24 traffic 119,523.79 125,132.01 182,089.80 7.70 7.10 7.48 infrastructure dev't. 57,070.44 36,661.87 75,401.37 3.68 2.08 3.10 pollution control 7,288.19 6,098.17 10,337.27 0.47 0.35 0.42 others 21,131.81 21,821.69 32,042.65 1.36 1.24 1.32 Other Purposes 180,246.01 255,936.17 308,214.09 11.61 14.53 12.67 Total 1,552,178.22 1,761,837.31 2,433,096.88 100.00 100.00 100.00
Source: Data for MMC and MMA from MMMS (1993); Data for MMDA from MMDA

Table 12Total General Government Expenditures in Metro Manila, 1989-1997
i n c u r r e n t p r i c e s i n 1 9 9 2 p r i c e s p e r c e n t d i s t r i b u t i o n p e r c e n t t o GDP
Me t r o - L GUs NGAs a / T o t a l Me t r o - L GUs NGAs T o t a l Me t r o - L GUs NGAs T o t a l Me t r o - L GUs NGAs T o t a l
B o d y B o d y B o d y B o d y
I . MMC
1 9 8 8 4 8 6 . 1 2 2 5 5 . 9 3 5 6 1 . 6 6 3 0 3 . 5 7 5 2 . 7 3 4 9 3 . 6 5 5 1 5 . 7 9 7 6 2 . 0 7 . 7 3 5 . 8 5 6 . 5 1 0 0 . 0 0 . 2 0 . 9 1 . 4 2 . 5
1 9 8 9 7 1 4 . 8 2 4 1 6 . 3 6 6 0 6 . 2 9 7 3 7 . 2 1 0 1 5 . 2 3 4 3 2 . 0 9 3 8 3 . 4 1 3 8 3 0 . 7 7 . 3 2 4 . 8 6 7 . 8 1 0 0 . 0 0 . 2 0 . 8 2 . 2 3 . 3
Av e . 8 8 - 8 9 6 0 0 . 4 2 3 3 6 . 1 5 0 8 3 . 9 8 0 2 0 . 4 8 8 4 . 0 3 4 6 2 . 8 7 4 4 9 . 5 1 1 7 9 6 . 3 7 . 5 3 0 . 3 6 2 . 2 1 0 0 . 0 0 . 2 0 . 9 1 . 8 2 . 9
I I . MMA
1 9 9 1 1 1 0 0 . 3 5 2 0 4 . 7 1 0 2 3 0 . 0 1 6 5 3 5 . 0 1 1 8 7 . 3 5 6 1 6 . 2 1 1 0 3 8 . 7 1 7 8 4 2 . 1 6 . 7 3 1 . 5 6 1 . 9 1 0 0 . 0 0 . 3 1 . 3 2 . 5 4 . 0
1 9 9 2 8 0 3 . 0 4 8 9 3 . 7 1 0 5 1 9 . 0 1 6 2 1 5 . 7 8 0 3 . 0 4 8 9 3 . 7 1 0 5 1 9 . 0 1 6 2 1 5 . 7 5 . 0 3 0 . 2 6 4 . 9 1 0 0 . 0 0 . 2 1 . 1 2 . 4 3 . 7
1 9 9 3 7 0 8 . 6 7 4 6 9 . 3 9 3 6 0 . 0 1 7 5 3 7 . 9 6 6 4 . 0 6 9 9 9 . 7 8 7 7 1 . 5 1 6 4 3 5 . 2 4 . 0 4 2 . 6 5 3 . 4 1 0 0 . 0 0 . 1 1 . 6 1 . 9 3 . 7
Av e . 9 1 - 9 3 8 7 0 . 6 5 8 5 5 . 9 1 0 0 3 6 . 3 1 6 7 6 2 . 8 8 8 4 . 8 5 8 3 6 . 5 1 0 1 0 9 . 7 1 6 8 3 1 . 0 5 . 3 3 4 . 7 6 0 . 1 1 0 0 . 0 0 . 2 1 . 3 2 . 3 3 . 8
I I I . MMDA
1 9 9 6 1 5 6 8 . 8 1 5 0 8 5 . 1 1 7 6 6 9 . 5 3 4 3 2 3 . 4 1 1 3 9 . 7 1 0 9 5 9 . 3 1 2 8 3 6 . 9 2 4 9 3 5 . 9 4 . 6 4 3 . 9 5 1 . 5 1 0 0 . 0 0 . 2 2 . 1 2 . 5 4 . 8
1 9 9 7 1 8 2 8 . 0 2 1 3 9 1 . 7 2 2 8 7 3 . 8 4 6 0 9 3 . 4 1 2 5 0 . 1 1 4 6 2 9 . 5 1 5 6 4 3 . 1 3 1 5 2 2 . 8 4 . 0 4 6 . 4 4 9 . 6 1 0 0 . 0 0 . 2 2 . 6 2 . 7 5 . 5
Av e . 9 6 - 9 7 1 6 9 8 . 4 1 8 2 3 8 . 4 2 0 2 7 1 . 6 4 0 2 0 8 . 4 1 1 9 4 . 9 1 2 7 9 4 . 4 1 4 2 4 0 . 0 2 8 2 2 9 . 3 4 . 2 4 5 . 3 5 0 . 4 1 0 0 . 0 0 . 2 2 . 3 2 . 6 5 . 2
a / NGAs r e f e r t o n a t i o n a l g o v e r n me n t a g e n c i e s
S o u r c e : Da t a f o r MMC a n d MMA f r o m MMMS ( 1 9 9 3 ) ; Da t a f o r MMDA f r o m MMDA; Da t a f o r L GUs f r o m Co mmi s s i o n o n A u d i t ; Da t a f o r NGAs f r o m De p a r t me n t o f B u d g e t a n d Ma n a g e me n t

Table 13Traffic Volume on Major Roads, 1980 and 1995(Vehicles/Day)
Road (Location) 1980TotalCount
1995 Ratio ofTotalCount
1995/1980TotalCount
Car/Truck
Jeepney/Bus
1. EDSA (bet.Guadalupe & Buendia)
99,900
172,500
154,700
17,800
1.7
South Super Highway (int. Pres.Quirino Avenue)
72,900
113,700
111,300
2,400
1.6
2. Quezon Avenue (nr. Espana Rotonda)
53,300
102,500
68,400
34,100
2.0
3. Roxas Blvd. (intersecting P. Burgos)
67,800
82,300
74,100
8,200
1.2
4. Ortigas Avenue (intersecting Santolan)
51,500
76,300
72,900
3,400
1.5
5. Shaw Boulevard(intersecting Acacia Lane) 37,300 43,500 27,800 15,700 1.2Source: 1990 JUMSUT and 1995 DPWH-Traffic Engineering Center (TEC); inJICA/MMUTIS, 1997
Table 14Number of Registered Vehicles in Metro Manila, 1980, 1990, 1995
Type 1980 1990 1995 1980-1995Ratio % / Yr.
PrivateMotorcycles 36,854 50,159 73,014 2.0 4.7Cars 218,964 297,094 410,814 1.9 4.3Utility Vehicles 36,770 223,976 368,002 10.0 16.6Buses - 918 491 - -Trucks/Trailers 97,590 51,351 76,060 7.1 10.3
Sub Total 391,178 623,498 928,381 2.4 5.9
For HireMotrocycles 4,801 16,418 34,478 7.2 14.0Taxis 10,125 1,715 21,702 2.1 5.2Cars 1,461 8,150 5,601 3.8 9.4Utility Vehicles 27,202 27,659 53,362 2.0 4.6Buses 3,578 4,329 7,824 2.2 5.4Trucks/Trailers 8,797 3,009 4,344 0.9 -12.5
Sub Total 55,964 61,280 127,331 2.3 5.6TOTAL, MM 446,142 684,778 1,055,692 2.4 5.9Source of Basic Data: JICA/MMUTIS, 1997; Land Transportation Office (LTO)

2
Table 15Car Ownership Structure, 1980 and 1996
Metro Manila1980 1996
Adjoining Areas
% of Car-Owning Households 9.5 19.7 16.9
Average No. of CarsPer Car-Owning Household 1.4 1.3 1.2
% of MultipleCar-Owning Household 19.0 20.1 13.3
Source: JICA/MMUTIS (1997); MMUTIS Person Trip Survey
Table 16Public Transportation SupplyEstimated No. Operating Units, 1983 and 1996
Mode Service Area 1983 1996 1996/1983Bus Intra-city 4,400
1,5005,900
9,6003,300
12,900
2.182.202.19
Inter-cityTOTAL
Jeepney Intra-city 29,3006,300
35,500
57,40012,30069,700
1.961.951.96
Inter-cityTOTAL
Tricycle Inside M. Manila 17,000N.I.N.I.
60,70056,600
117,300
3.57N.IN.I.
Adjoining AreasTOTAL
Source of Basic Data: JICA/MMUTIS (1997)

3
Table 17Transport and Traffic Management in Metro ManilaGovernanceActivity
NATIONAL METRO LOCAL OTHERS
PolicyFormulation
OPDOTC(Central, LTO, LTFRB)DPWH(Central, DPWH-NCR)DILG (PNP)TRAFFIM
MMDA LGUs(TrafficManagementUnits,Local TrafficOrdinances)
TransportPlanning
DOTC(Central, LTFRB, LRTA,PNR)
MMDA LGUsBCDA (FortBonifacio)PEA (ManilaBay Area)
DevelopersandOperatorsof businesscomplexes
TransportServices
Rail
Bus
Jeepneys
Tricycles and Pedicabs
Shuttle Services
DOTC(PNR, LRTA)
DOTC (LTFRB)MMTC
DOTC (Office ofTransport Cooperatives,LTFRB)
LGUs
PrivateCompanies
PrivateCompanies

4
Table 18Land Use Classification in Metro Manila
Land Use 1972 1980 1991(Has.) % (Has.) % (Has.) %
Residential 13,750 28.0 18,948 29.4 41,405 65.0Commercial 530 1.0 2,573 4.0 1,911 3.0Industrial 1,365 3.0 3,0.7 4.7 2,548 4.0Institutional 1,800 4.0 2,892 4.5 3,185 5.0Utilities 890 1.4 637 1.0Open Space 30,980* 64.0 14,380 22.3 5,096 8.0Agricultural 7,806 12.1 5,733 9.0Cemetery/Memorial Parks 637 1.0Recreation/Parks/Sports 13,012 20.2 637 1.0Rivers/Waterways 1,911 3.0Reclamation 671 1.0Agro-Industrial 236 0.4TOTAL 48,425 100.0 64,445 100.0 63,700 100.0
* open space and othersBasic Sources: 1972 figures from Manosa (1974) NEDA Journal of Development,Vol 1/2 1981 figures from Metro Manila Commission (1983) 1991 figures from NCR Regional Development Plan (1993-1998)

5
Figure1Map of Philippines / Metro Manila

6
Figure 2MAJOR ROAD NETWORK OF METRO MANILA
Source: MMDA (1996)
Source: MMDA (1996)

7
Figure 3METRO MANILA, CALABARZON and MARILAQUE
Source: MMMS (1995)

8
Municipalities
Figure 4Structure of Philippine Local Government Untis
HighlyUrbanized
Cities
ComponentCities
Barangays
Provinces
Barangays Barangays
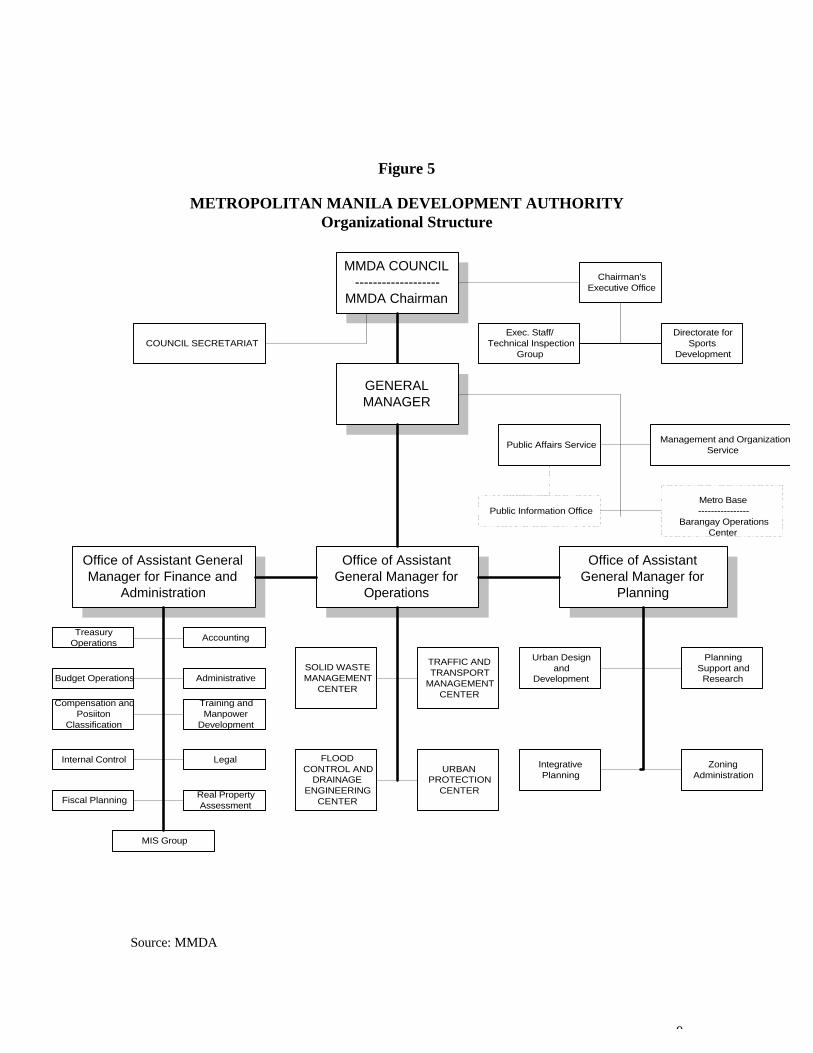
9
Figure 5
METROPOLITAN MANILA DEVELOPMENT AUTHORITYOrganizational Structure
Source: MMDA
MMDA COUNCIL-------------------
MMDA Chairman
COUNCIL SECRETARIAT
Chairman'sExecutive Office
GENERALMANAGER
Office of AssistantGeneral Manager for
Operations
Directorate forSports
Development
Exec. Staff/Technical Inspection
Group
Public Affairs Service
Public Information Office
Management and OrganizationService
Metro Base----------------
Barangay OperationsCenter
Office of Assistant GeneralManager for Finance and
Administration
TreasuryOperations
Budget Operations
Compensation andPosiiton
Classification
Internal Control
Fiscal Planning
Accounting
Administrative
Training andManpower
Development
Legal
Real PropertyAssessment
MIS Group
SOLID WASTEMANAGEMENT
CENTER
FLOODCONTROL AND
DRAINAGEENGINEERING
CENTER
TRAFFIC ANDTRANSPORT
MANAGEMENTCENTER
URBANPROTECTION
CENTER
Office of AssistantGeneral Manager for
Planning
Urban Design and
Development
IntegrativePlanning
PlanningSupport andResearch
ZoningAdministration

10
Figure 6
Waste Flow in Metro Manila
Generation5,345/100% Discharge
4,804/90%
Recycling200/4%
Collection3,496/75%
Las Pinas
Recycling56/2%
Payatas1,169/32%
Catmon95/3%
Carmona1,139/33%
San Mateo1.037/30%
Recycling71/1%
Self Disposal341/6%
IllegalDumping1,308/25%
Source: JICA, 1998Unit:ton/day