got data? now what? - nesacenter.org · laura lipton and bruce wellman co-directors, miravia, ......
TRANSCRIPT

Got Data? Now What? Creating and Leading
Cultures of Inquiry
Presented by Peggy Olcott, Training Associate, MiraVia, LLC
Seminar Handout
Developed by Laura Lipton and Bruce Wellman
Co-directors, MiraVia, LLC
w w w . m i r a v i a . c o m
2 GDNW • Copyright 2012 • Bruce Wellman & Laura Lipton, MiraVia LLC • All rights reserved
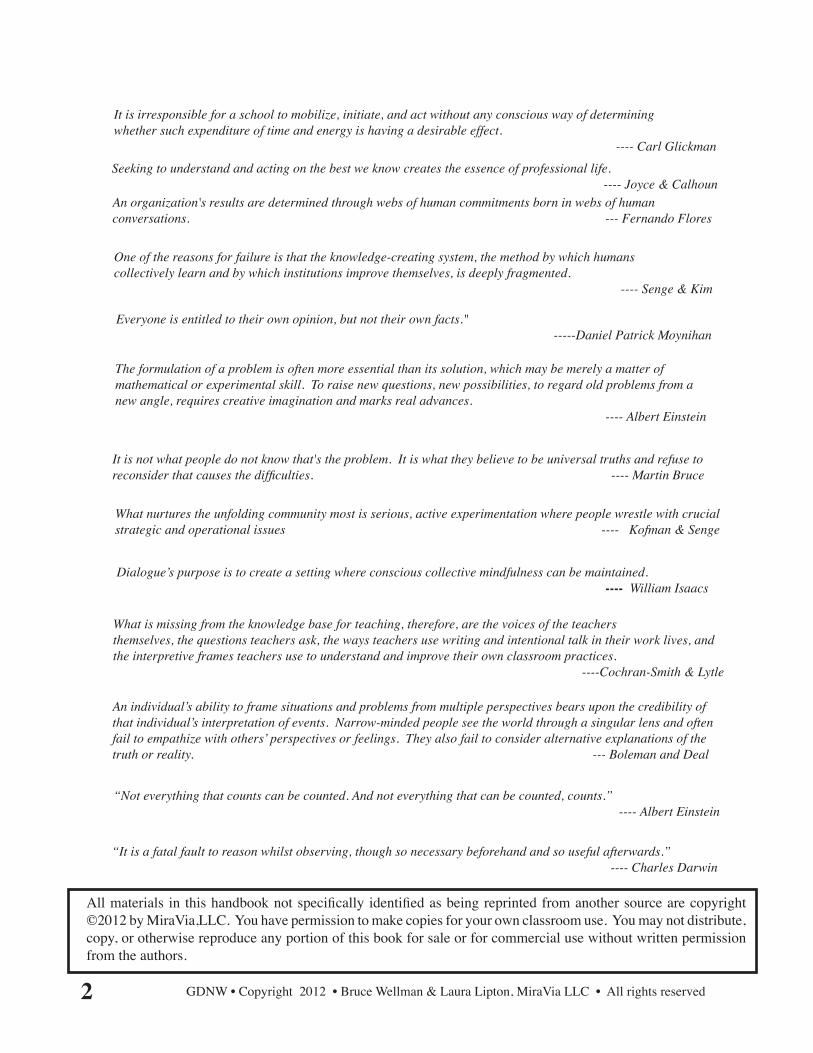
“It is a fatal fault to reason whilst observing, though so necessary beforehand and so useful afterwards.” ---- Charles Darwin
All materials in this handbook not specifically identified as being reprinted from another source are copyright ©2012 by MiraVia,LLC. You have permission to make copies for your own classroom use. You may not distribute, copy, or otherwise reproduce any portion of this book for sale or for commercial use without written permission from the authors.
What is missing from the knowledge base for teaching, therefore, are the voices of the teachers themselves, the questions teachers ask, the ways teachers use writing and intentional talk in their work lives, and the interpretive frames teachers use to understand and improve their own classroom practices. ----Cochran-Smith & Lytle
It is irresponsible for a school to mobilize, initiate, and act without any conscious way of determining whether such expenditure of time and energy is having a desirable effect. ---- Carl Glickman
It is not what people do not know that's the problem. It is what they believe to be universal truths and refuse to reconsider that causes the difficulties. ---- Martin Bruce
The formulation of a problem is often more essential than its solution, which may be merely a matter of mathematical or experimental skill. To raise new questions, new possibilities, to regard old problems from a new angle, requires creative imagination and marks real advances. ---- Albert Einstein
Seeking to understand and acting on the best we know creates the essence of professional life. ---- Joyce & CalhounAn organization's results are determined through webs of human commitments born in webs of human conversations. --- Fernando Flores
One of the reasons for failure is that the knowledge-creating system, the method by which humans collectively learn and by which institutions improve themselves, is deeply fragmented. ---- Senge & Kim
Everyone is entitled to their own opinion, but not their own facts." -----Daniel Patrick Moynihan
Dialogue’s purpose is to create a setting where conscious collective mindfulness can be maintained. ---- William Isaacs
What nurtures the unfolding community most is serious, active experimentation where people wrestle with crucial strategic and operational issues ---- Kofman & Senge
An individual’s ability to frame situations and problems from multiple perspectives bears upon the credibility of that individual’s interpretation of events. Narrow-minded people see the world through a singular lens and often fail to empathize with others’ perspectives or feelings. They also fail to consider alternative explanations of the truth or reality. --- Boleman and Deal
“Not everything that counts can be counted. And not everything that can be counted, counts.” ---- Albert Einstein
3 GDNW • Copyright 2012 • Bruce Wellman & Laura Lipton, MiraVia LLC • All rights reserved
Purposes
• To develop practical structures for using data to focus a group's attention and energy
• To understand and apply a three-phase model for collaborative inquiry
• To extend a repertoire of tools for developing productive group learning, planning and problem solving

4 GDNW • Copyright 2012 • Bruce Wellman & Laura Lipton, MiraVia LLC • All rights reserved
Mix, Match, Exchange
Name __________________________________________
• My greatest hope for data-based inquiry:
• My biggest concern about data-based inquiry:
• A belief I hold about working collaboratively with data:
-----------------------------------------------------------------------------------------------------------------------
Name __________________________________________
• My greatest hope for data-based inquiry:
• My biggest concern about data-based inquiry:
• A belief I hold about working collaboratively with data:

5 GDNW • Copyright 2012 • Bruce Wellman & Laura Lipton, MiraVia LLC • All rights reserved
Three Common Dilemmas
• Committee without community
• Time without tools
• Data without deliberation
Data-Based Collaborative Inquiry
Requires and produces
• Psychological safety
• Cognitive resourcefulness
• Relational resilience

6 GDNW • Copyright 2012 • Bruce Wellman & Laura Lipton, MiraVia LLC • All rights reserved
Group Size, Composition and Length of Time as a Working GroupWorking group size is an often-overlooked variable that affects group task success. Using pairs, trios and quartets increases active participation and establishes a safer working climate. Many groups, both large and small, err in attempting to do the bulk of their work as a committee of the whole. Partners or trios can be pre-assigned, or determined during the work session using pre-recorded grouping sheets such as seasonal partners. With this method, participants mingle and use recording sheets with seasonal icons, exchanging names and creating partnerships in the space allotted. Count-offs or physical repositioning, such as turn to a neighbor or stand and find a colleague are other time efficient ways to subdivide and energize groups. Group composition is another factor to consider. Criteria for grouping, such as roles, years of experience, work style preference or degree of expertise creates small groups that are specialized or diversified, as is appropriate to the task. This intentional design choice spreads the talent within the larger group and breaks down factions that might exist Purposely structured pairs, trios or quartets increases success with many tasks. At appropriate points, pairs can join other pairs to widen the conversation. Length of time as a working group should vary according to task requirements. Small groups are effective for text-based activities, idea generation and data exploration. By varying the length of time that groups work together and regrouping periodically, individuals within a larger group develop deeper working relationships and greater knowledge of one another. Switching partners also provides a period of purposeful movement for energy and brief social interaction. One pattern for intact groups is to establish base groups that meet regularly and employ informal partnering for designated tasks.
Interaction Patterns, Materials and SpaceStructuring the patterns of interaction increases productivity and engagement. As indicated above, most groups are not harmed by structure. By developing a shared repertoire of strategies, protocols and grouping patterns, working groups enhance success and satisfaction. Fundamental structuring moves include: the use of active public recording on chart paper so that all can see ideas and information; providing individual writing time and space to think before a conversation or data exploration starts; using a round-robin pattern for sharing ideas; using a public timer to guide processes; and assigning roles such as that of a facilitator, recorder, and a materials manager. Having supplies such as index cards, sticky notes, pens, pads, markers and chart paper available saves time and allows for flexibility in meeting designs. One last consideration is the arrangement of the physical space within which the group is working. Group members need to be able to see and hear one another and have a clear view of charts on the walls and on chart stands during active public recording. Table and chair arrangements need to be adjusted in some cases to facilitate interaction. Too many and too few tables and chairs are equally problematic. Visual clutter in the room is an additional distraction. Key charts noting a projects purpose, outcomes and logistics should be posted prominently where all participants can see them.
Structuring Decisions
• Starting the conversation
• Structuring the conversation
• Sustaining thinking in the conversation
Purposeful structures maximize the efficient use of time and increase the quality of interactions and results. Novice groups require formal structures to scaffold success. More expert groups know when to select formal structures to match the emotional and cognitive demands of their work. Higher performing groups are not harmed by structure. Groups and group members that need it will be greatly aided by tighter designs. It is always wise to remember that not every participant in a high performing group may be personally skilled in group processes. The following two broad categories describe considerations for group leaders.
Structuring choices greatly affect the outcomes of collaborative group work. These basic design elements set the stage for focusing energy on the task at hand, balancing the
participation of group members and most importantly for producing a psychologically safe forum for participants to contribute ideas and to question the contributions of others. Effective design choices increase a group’s capacity to address hard-to-talk about topics and shape thoughtful dialogue and productive discussion.
Crafting the Container
7 GDNW • Copyright 2012 • Bruce Wellman & Laura Lipton, MiraVia LLC • All rights reserved
Sources of Data
Student Performance Data
Data
Program Data
Community Data
Quantitative Qualitative
8 GDNW • Copyright 2012 • Bruce Wellman & Laura Lipton, MiraVia LLC • All rights reserved
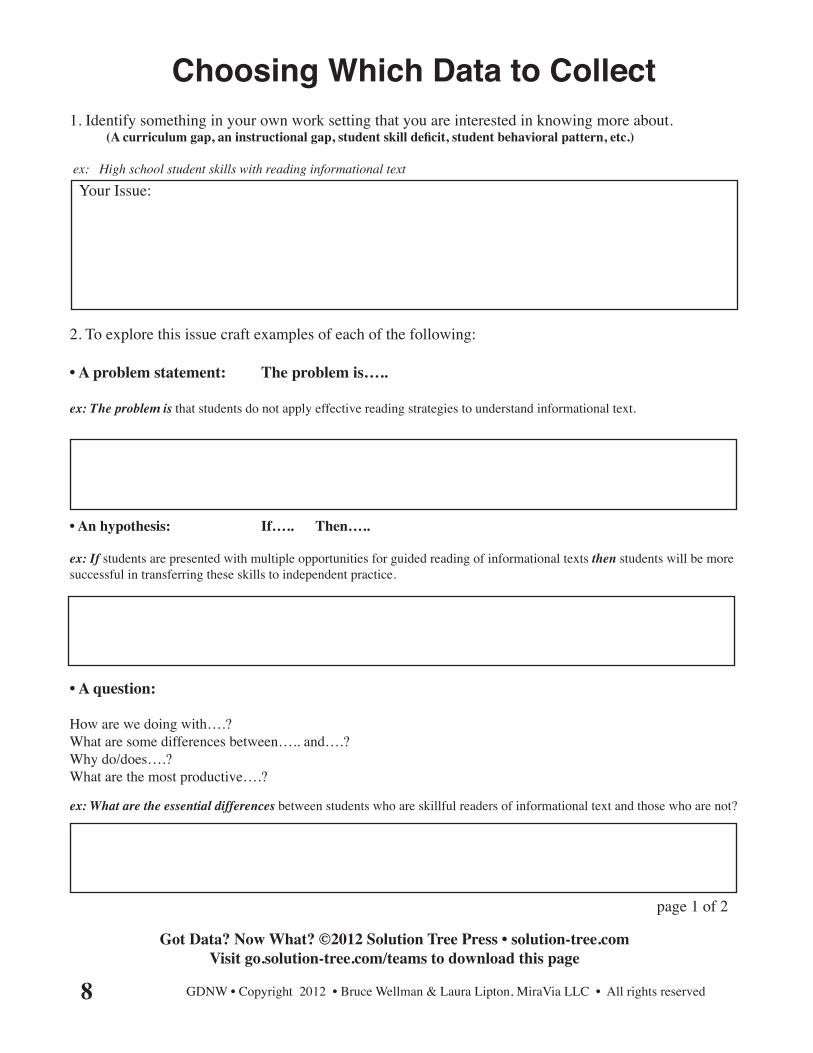
1. Identify something in your own work setting that you are interested in knowing more about. (A curriculum gap, an instructional gap, student skill deficit, student behavioral pattern, etc.)
ex: High school student skills with reading informational text
Your Issue:
2. To explore this issue craft examples of each of the following: • A problem statement: The problem is…..
ex: The problem is that students do not apply effective reading strategies to understand informational text.
• An hypothesis: If….. Then…..
ex: If students are presented with multiple opportunities for guided reading of informational texts then students will be more successful in transferring these skills to independent practice.
• A question: How are we doing with….?What are some differences between….. and….? Why do/does….? What are the most productive….?
ex: What are the essential differences between students who are skillful readers of informational text and those who are not?
Choosing Which Data to Collect
Got Data? Now What? ©2012 Solution Tree Press • solution-tree.comVisit go.solution-tree.com/teams to download this page
page 1 of 2
9 GDNW • Copyright 2012 • Bruce Wellman & Laura Lipton, MiraVia LLC • All rights reserved
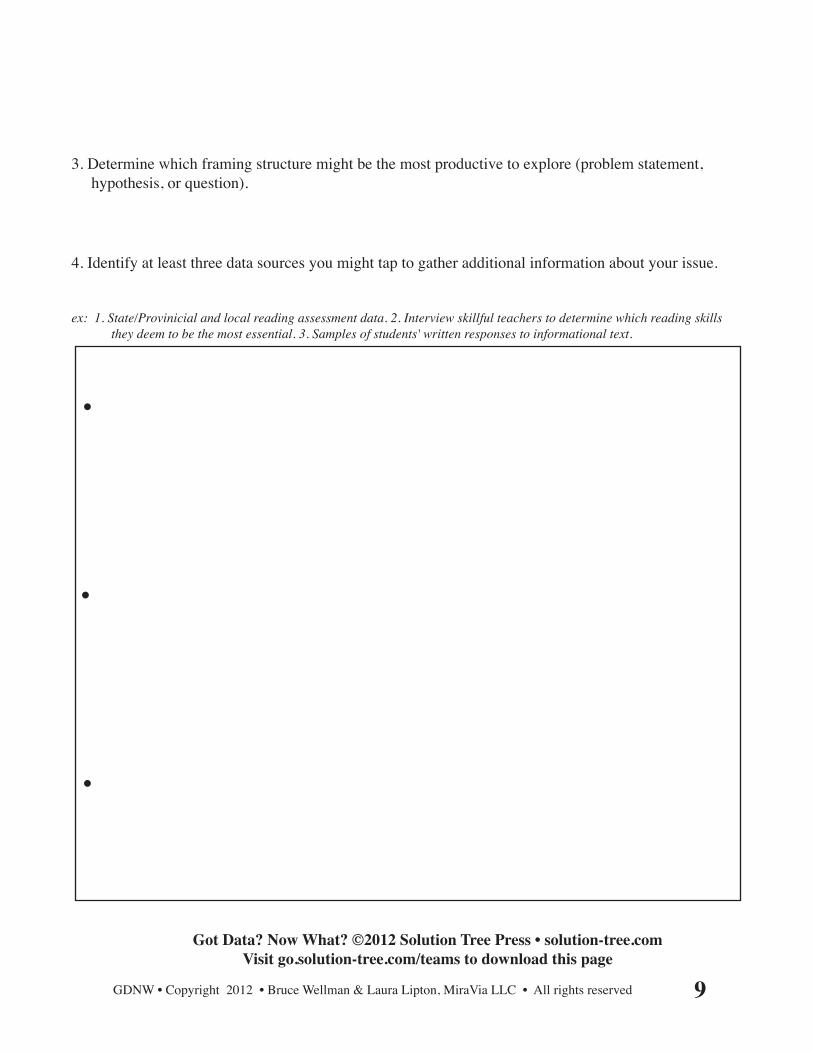
3. Determine which framing structure might be the most productive to explore (problem statement, hypothesis, or question). 4. Identify at least three data sources you might tap to gather additional information about your issue.
ex: 1. State/Provinicial and local reading assessment data. 2. Interview skillful teachers to determine which reading skills they deem to be the most essential. 3. Samples of students' written responses to informational text.
•
•
•
Got Data? Now What? ©2012 Solution Tree Press • solution-tree.comVisit go.solution-tree.com/teams to download this page

10 GDNW • Copyright 2012 • Bruce Wellman & Laura Lipton, MiraVia LLC • All rights reserved
Use this column to record definitions and summaries for each phase of the cycle.
Activating and Engaging
Exploring and Discovering
Organizing and Integrating
The Collaborative Learning Cycle
Save this space for use in the morning.
11 GDNW • Copyright 2012 • Bruce Wellman & Laura Lipton, MiraVia LLC • All rights reserved
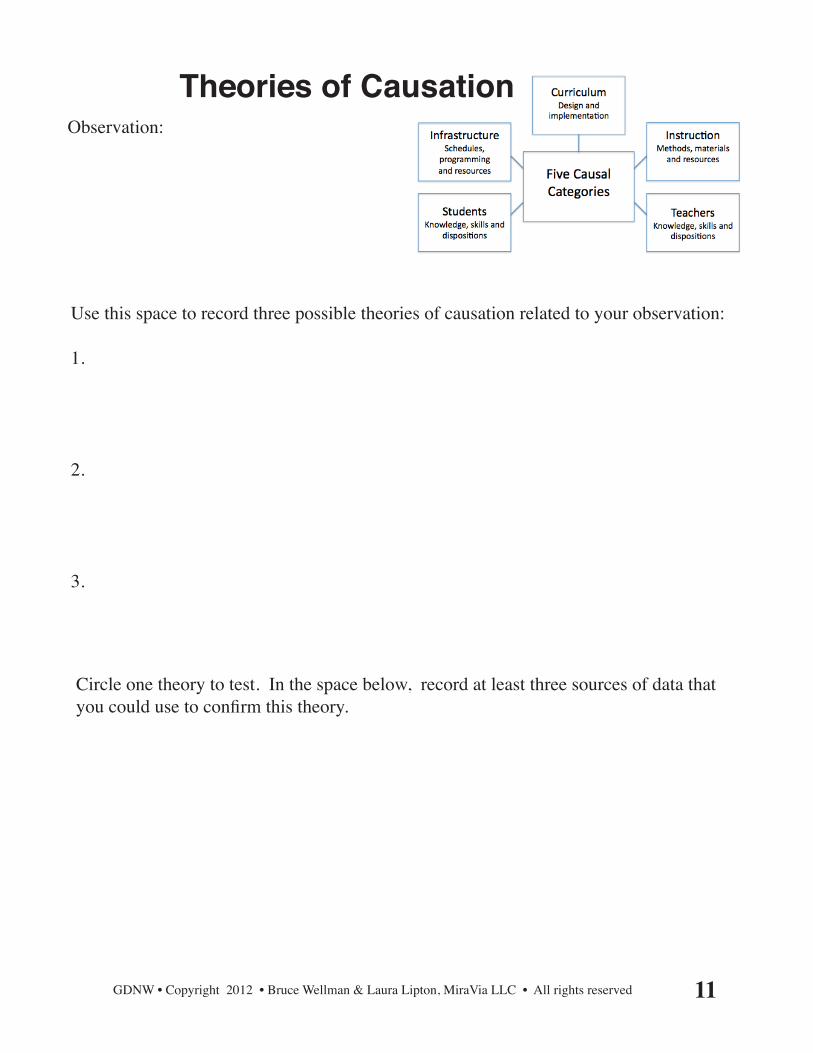
Theories of Causation
Circle one theory to test. In the space below, record at least three sources of data that you could use to confirm this theory.
Observation:
Use this space to record three possible theories of causation related to your observation:
1.
2.
3.

12 GDNW • Copyright 2012 • Bruce Wellman & Laura Lipton, MiraVia LLC • All rights reserved
Template for Advocacy: Making Thinkingand Reasoning Visible
An issue that is important to me is______________
I would like to focus our attention on _______________
My assumptions are ____________________
Describe the focus of your advocacy.
Describe your reasoning.I came to this conclusion because______________
As I thought about this, I recognized _______________
Describe your reasoning. I feel __________________________________about this.
Distinguish data from interpretation.These are some observations that stand out for me in this data.___________________________________________
Now here is what I think these data mean ______________
Reveal your perspectivesI'm seeing this from the viewpoint of ________________or_________________or ___________________________
Given my role and experience as a ___________________
Frame the wider context that surrounds this issue.
It occurs to me that this proposal would affect several groups ____________________________________________________
Give concrete examples To get a clear picture, imagine that you are in school X and ____________________________________________________
Source, Adapted from Senge, Kleiner, Roberts, & Ross, 1994
Got Data? Now What? ©2012 Solution Tree Press • solution-tree.comVisit go.solution-tree.com/teams to download this page
page 1 of 2

13 GDNW • Copyright 2012 • Bruce Wellman & Laura Lipton, MiraVia LLC • All rights reserved
Template for Advocacy: Making Thinkingand Reasoning Visible
Here's an area that is fuzzy for me ____________________
How would you describe it? _____________________________
Reveal where you are least clear.
Indicate your openness to the view-points of others.
What are some different or alternative ways you see this?
Source, Adapted from Senge, Kleiner, Roberts, & Ross, 1994
Encourage others to explore your model, assumptions, and data.
What is your thinking or reaction to what I just shared? What might be some flaws in my reasoning? What might you add or refine? _______________________________
Got Data? Now What? ©2012 Solution Tree Press • solution-tree.comVisit go.solution-tree.com/teams to download this page

14 GDNW • Copyright 2012 • Bruce Wellman & Laura Lipton, MiraVia LLC • All rights reserved
What important points seem to "pop-out"?
What patterns, categories or trends are emerging?
What seems to be surprising or unexpected?
What are some ways we have not yet explored these data?
Exploring and Discovering

15 GDNW • Copyright 2012 • Bruce Wellman & Laura Lipton, MiraVia LLC • All rights reserved
Fro
m C
ausa
tion
to A
ctio
n
The
ory
Im
plic
atio
ns
O
utco
mes
/Act
ions
16 GDNW • Copyright 2012 • Bruce Wellman & Laura Lipton, MiraVia LLC • All rights reserved
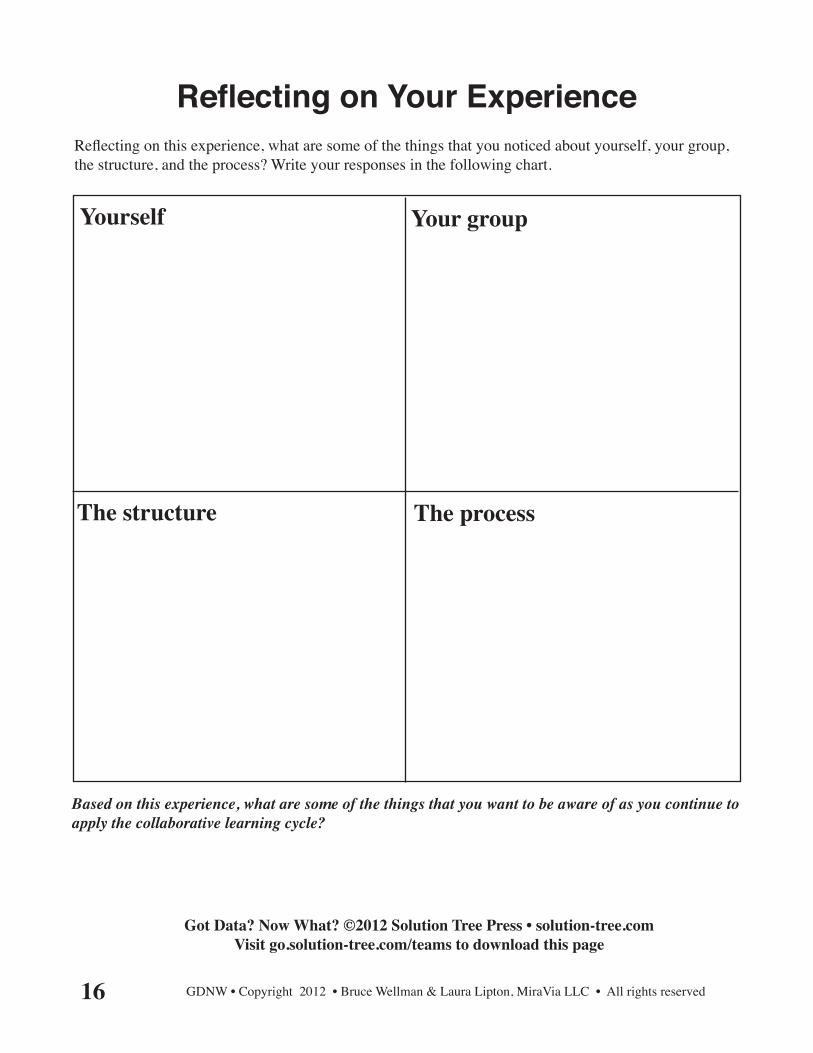
Reflecting on Your ExperienceReflecting on this experience, what are some of the things that you noticed about yourself, your group, the structure, and the process? Write your responses in the following chart.
Yourself Your group
The structure The process
Based on this experience, what are some of the things that you want to be aware of as you continue to apply the collaborative learning cycle?
Got Data? Now What? ©2012 Solution Tree Press • solution-tree.comVisit go.solution-tree.com/teams to download this page

17 GDNW • Copyright 2012 • Bruce Wellman & Laura Lipton, MiraVia LLC • All rights reserved
A to Z Listing
A _____________________________________________B _____________________________________________C _____________________________________________D _____________________________________________E _____________________________________________F _____________________________________________G _____________________________________________H _____________________________________________I _____________________________________________J _____________________________________________K _____________________________________________L _____________________________________________M _____________________________________________N _____________________________________________O _____________________________________________P _____________________________________________Q _____________________________________________R _____________________________________________S _____________________________________________T _____________________________________________U _____________________________________________V _____________________________________________W _____________________________________________X _____________________________________________Y _____________________________________________Z _____________________________________________
18 GDNW • Copyright 2012 • Bruce Wellman & Laura Lipton, MiraVia LLC • All rights reserved
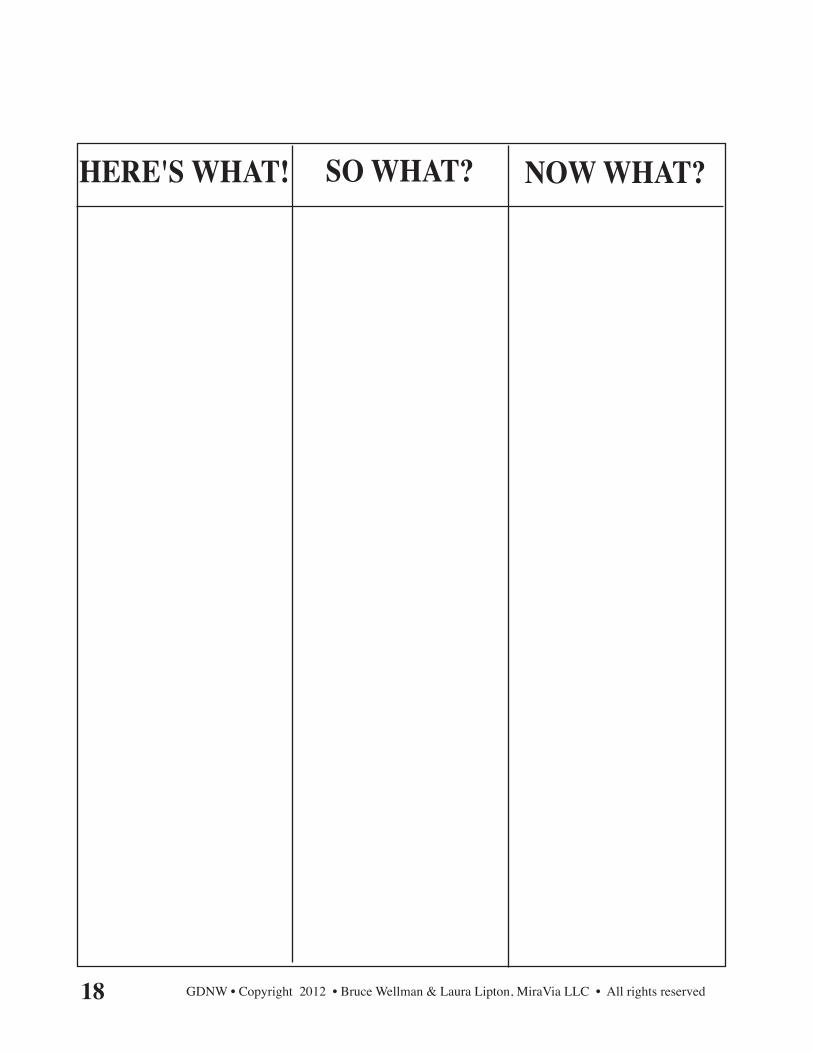
SO WHAT? NOW WHAT?HERE'S WHAT!

19 GDNW • Copyright 2012 • Bruce Wellman & Laura Lipton, MiraVia LLC • All rights reserved
1. Individually rate your level of knowledge, skill and confidence in facilitating data-driven dialogue using a scale of 0-10.
2. Individually rate your level of knowledge, skill and confidence in working with data using a scale of 0-10.
3. Place a dot at the appropriate intersection on the graph.
The Matrix: Predictions
0 10
10
Working with data
Faci
litat
ion
Facilitation skills include: focusing attention, framing and managing inquiry and transitions within the collaborative learning cycle, paraphrasing participant responses, and confidently encouraging diverse perspectives.
Data skills include: crafting appropriate displays, knowledge of essential technical terms such as mean, median, mode, trend, triangulation, and skills in the analysis of various types of data.
The Matrix: Self Assessment
0 10
10
Working with data
Faci
litat
ion

20 GDNW • Copyright 2012 • Bruce Wellman & Laura Lipton, MiraVia LLC • All rights reserved
+ 13-
2-
1-

21 GDNW • Copyright 2012 • Bruce Wellman & Laura Lipton, MiraVia LLC • All rights reserved
Hopes Fears

22 GDNW • Copyright 2012 • Bruce Wellman & Laura Lipton, MiraVia LLC • All rights reserved
Grade 8: Math: Data Analysis and Probability: Question 2
Each Friday, Julie’s track club runs two miles. The graph show the amount of time that it takes Julie to run the 2 miles each week over a period of 20 weeks.
Predict and record which percentage of Ohio 8th graders selected each answer and record the assumptions that inform your predictions on the following page. Which answer describes the relationship between the number of weeks Julie practices and her running time?
A. Julie is running at a slower rate each week.
B. Julie decreases her time by about 20 seconds each week.
C. Julie decreases her time by about a minute each week.
D. Julie is likely to run the 2 miles in 12 minutes during the 21st. week.

23 GDNW • Copyright 2012 • Bruce Wellman & Laura Lipton, MiraVia LLC • All rights reserved
Predictions & Assumptions
Your own
The group's

24 GDNW • Copyright 2012 • Bruce Wellman & Laura Lipton, MiraVia LLC • All rights reserved
First Word
G
O
T
D
A
T
A
25 GDNW • Copyright 2012 • Bruce Wellman & Laura Lipton, MiraVia LLC • All rights reserved
Based on your learning in this seminar, what might you:
• Stop doing
• Continue doing
• Start doing
26 GDNW • Copyright 2012 • Bruce Wellman & Laura Lipton, MiraVia LLC • All rights reserved
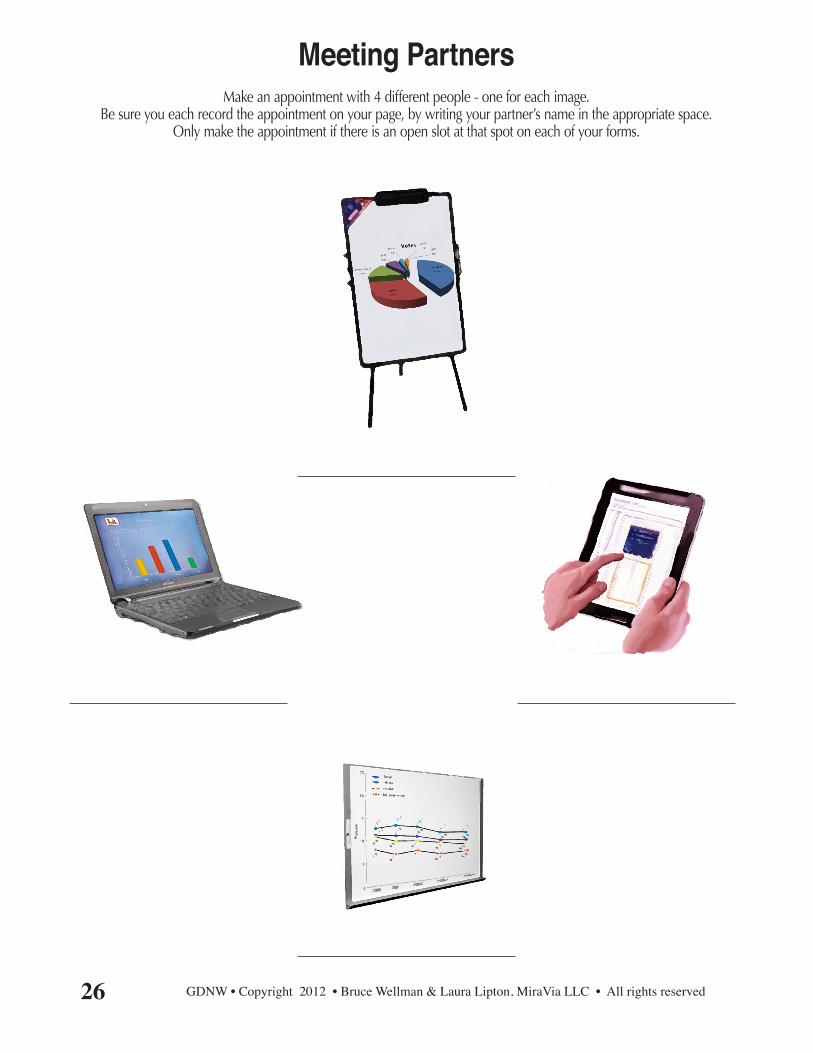
Meeting PartnersMake an appointment with 4 different people - one for each image.
Be sure you each record the appointment on your page, by writing your partner’s name in the appropriate space. Only make the appointment if there is an open slot at that spot on each of your forms.