google file system
TRANSCRIPT

GOOGLE FILE SYSTEMSanjay Ghemawat, Howard Gobioff, and Shun-Tak Leung
Presented By – Ankit Thiranh
OVERVIEW
• Introduction
• Architecture
• Characteristics
• System Interaction
• Master Operation and Fault tolerance and diagnosis
• Measurements
• Some Real world clusters and their performance
INTRODUCTION
• Google – large amount of data
• Need a good file distribution system to process its data
• Solution: Google File System
• GFS is :• Large
• Distributed
• Highly fault tolerant system
ASSUMPTIONS
• The system is built from many inexpensive commodity components that often fail.
• The system stores a modest number of large files.
• Primarily two kind of reads: large streaming reads and small random needs.
• Many large sequential writes append data to files.
• The system must efficiently implement well-defined semantics for multiple clients that concurrently append to the same file.
• High sustained bandwidth is more important than low latency.
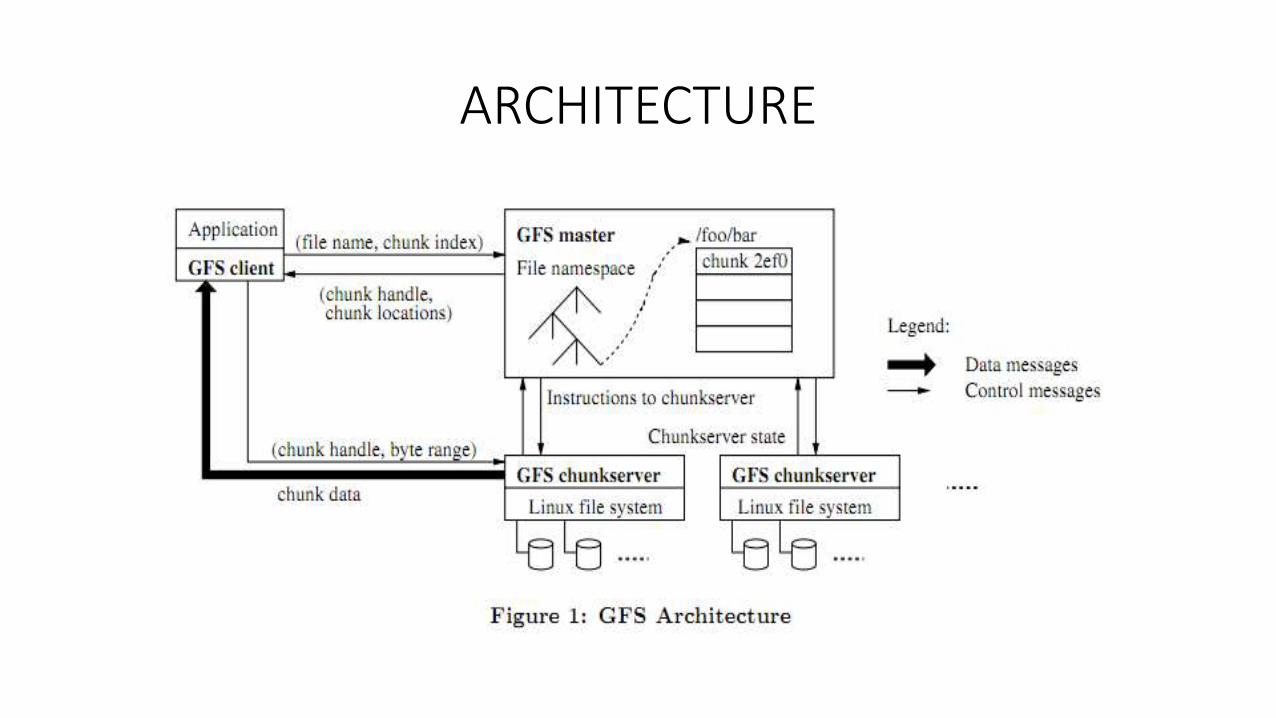
ARCHITECTURE
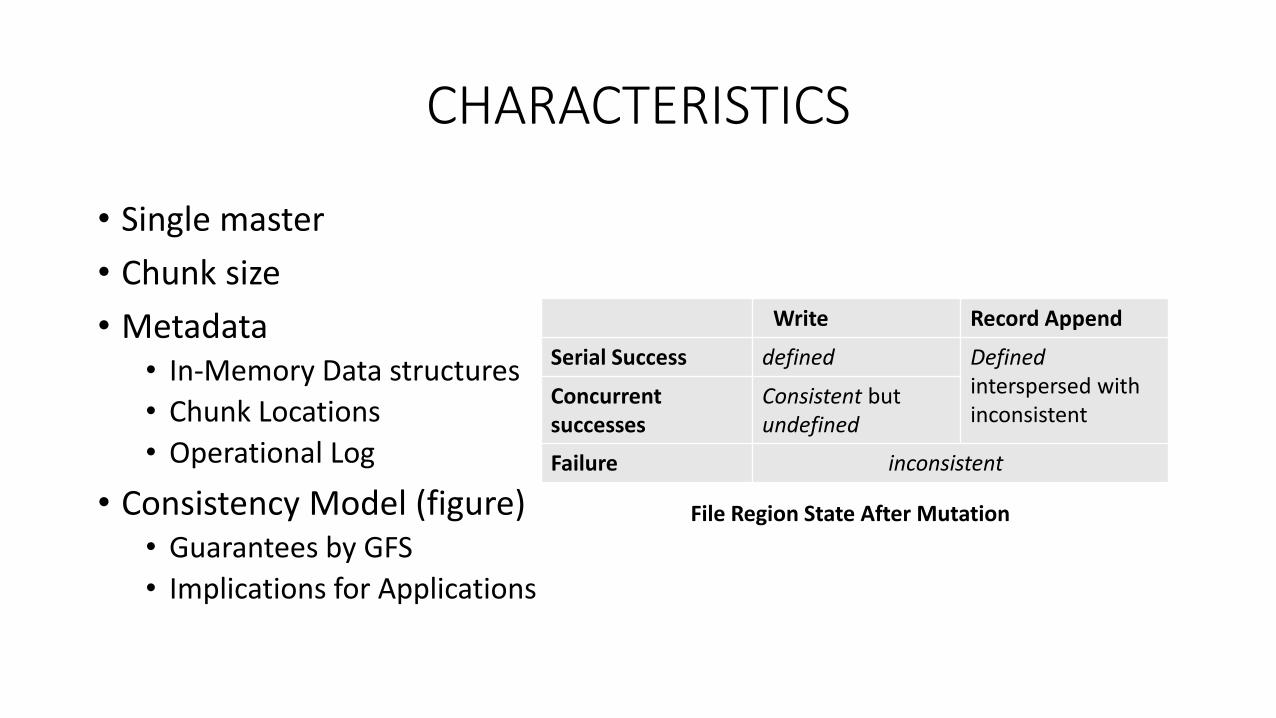
CHARACTERISTICS
• Single master
• Chunk size
• Metadata • In-Memory Data structures
• Chunk Locations
• Operational Log
• Consistency Model (figure)• Guarantees by GFS
• Implications for Applications
Write Record Append
Serial Success defined Definedinterspersed with inconsistent
Concurrentsuccesses
Consistent but undefined
Failure inconsistent
File Region State After Mutation

SYSTEM INTERACTION
• Leases and Mutation Order
• Data flow
• Atomic Record appends
• Snapshot
Figure 2: Write Control and Data Flow
MASTER OPERATION
• Namespace Management and Locking
• Replica Placement
• Creation, Re-replication, Rebalancing
• Garbage Collection• Mechanism
• Discussion
• State Replica Detection

FAULT TOLERANCE AND DIAGNOSIS
• High Availability• Fast Recovery
• Chunk Replication
• Master Replication
• Data Integrity
• Diagnostics tools

MEASUREMENTS
Aggregate Throughputs. Top curves show theoretical limits imposed by the network topology. Bottom curvesshow measured throughputs. They have error bars that show 95% confidence intervals, which are illegible in some cases because of low variance in measurements.
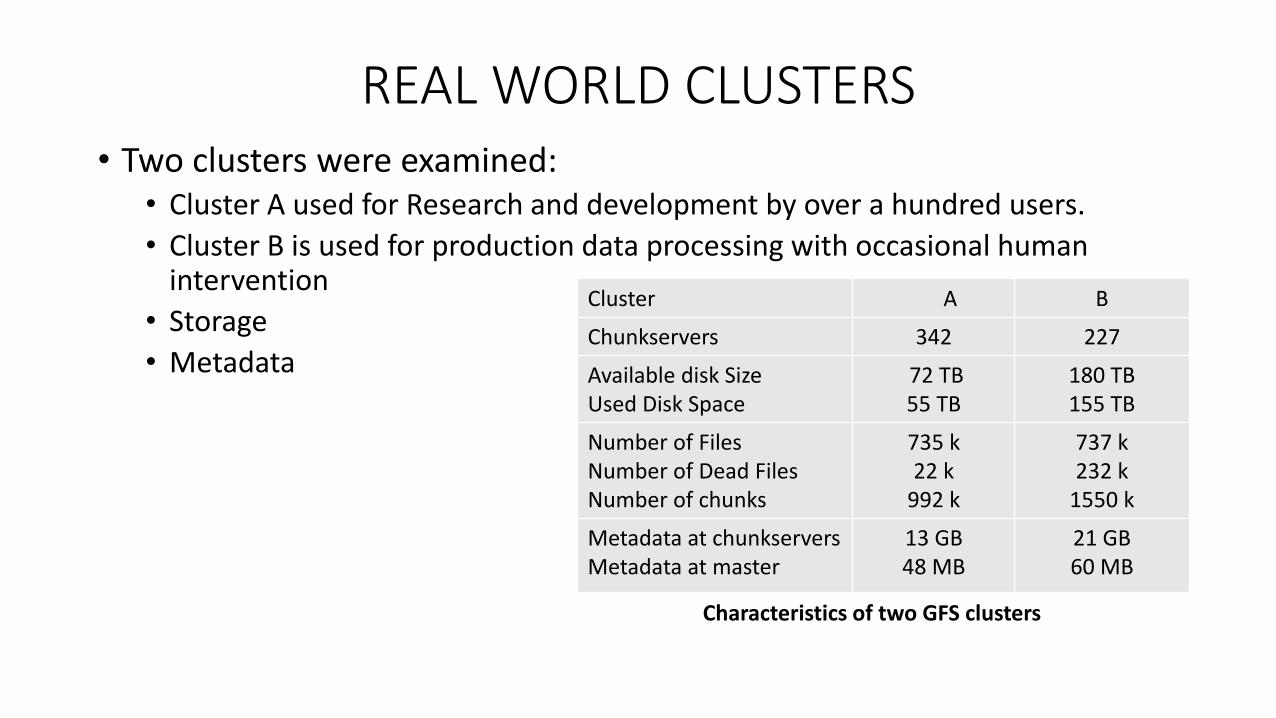
REAL WORLD CLUSTERS• Two clusters were examined:
• Cluster A used for Research and development by over a hundred users.
• Cluster B is used for production data processing with occasional human intervention
• Storage
• Metadata
Characteristics of two GFS clusters
Cluster A B
Chunkservers 342 227
Available disk SizeUsed Disk Space
72 TB55 TB
180 TB155 TB
Number of FilesNumber of Dead FilesNumber of chunks
735 k22 k
992 k
737 k232 k
1550 k
Metadata at chunkserversMetadata at master
13 GB48 MB
21 GB60 MB
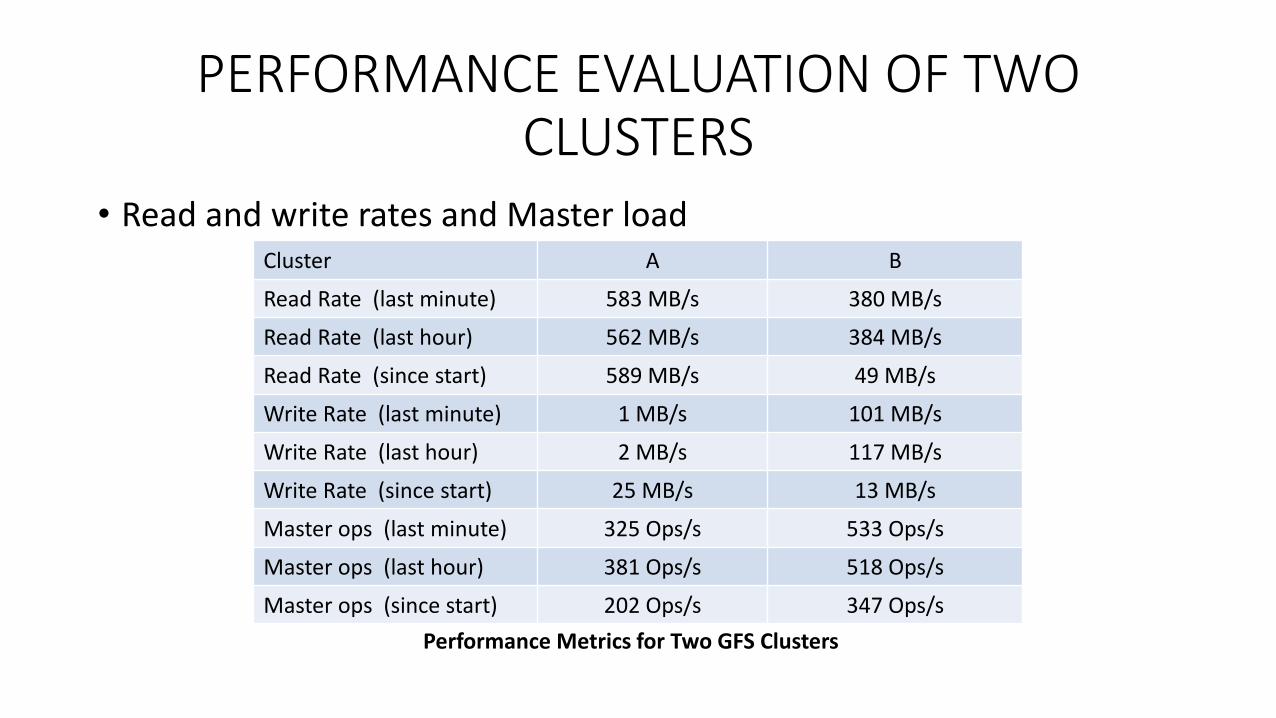
PERFORMANCE EVALUATION OF TWO CLUSTERS
• Read and write rates and Master loadCluster A B
Read Rate (last minute) 583 MB/s 380 MB/s
Read Rate (last hour) 562 MB/s 384 MB/s
Read Rate (since start) 589 MB/s 49 MB/s
Write Rate (last minute) 1 MB/s 101 MB/s
Write Rate (last hour) 2 MB/s 117 MB/s
Write Rate (since start) 25 MB/s 13 MB/s
Master ops (last minute) 325 Ops/s 533 Ops/s
Master ops (last hour) 381 Ops/s 518 Ops/s
Master ops (since start) 202 Ops/s 347 Ops/s
Performance Metrics for Two GFS Clusters

WORKLOAD BREAKDOWN
• Chunkserver Workload
Operation Read Write Record Append
Cluster X Y X Y X Y
0K 0.4 2.6 0 0 0 0
1B….1K 0.1 4.1 6.6 4.9 0.2 9.2
1K…8K 65.2 38.5 0.4 1.0 18.9 15.2
8K…64K 29.9 45.1 17.8 43.0 78.0 2.8
64K….128K 0.1 0.7 2.3 1.9 < 0.1 4.3
128K….256K 0.2 0.3 31.6 0.4 < 0.1 10.6
256K…512K 0.1 0.1 4.2 7.7 < 0.1 31.2
512K….1M 3.9 6.9 35.5 28.7 2.2 25.5
1M..inf 0.1 1.8 1.5 12.3 0.7 2.2
Operation Read Write Record Append
Cluster X Y X Y X Y
1B….1K < 0.1 <0.1 < 0.1 <0.1 < 0.1 <0.1
1K…8K 13.8 3.9 < 0.1 <0.1 < 0.1 0.1
8K…64K 11.4 9.3 2.4 5.9 78.0 0.3
64K….128K 0.3 0.7 0.3 0.3 < 0.1 1.2
128K….256K 0.8 0.6 16.5 0.2 < 0.1 5.8
256K…512K 1.4 0.3 3.4 7.7 < 0.1 38.4
512K….1M 65.9 55.1 74.1 58.0 0.1 46.8
1M..inf 6.4 28.0 3.3 28.0 53.9 7.4
Operations Break down by Size (% ) Bytes Transferred Breakdown by Operation Size (% )
WORKLOAD BREAKDOWN
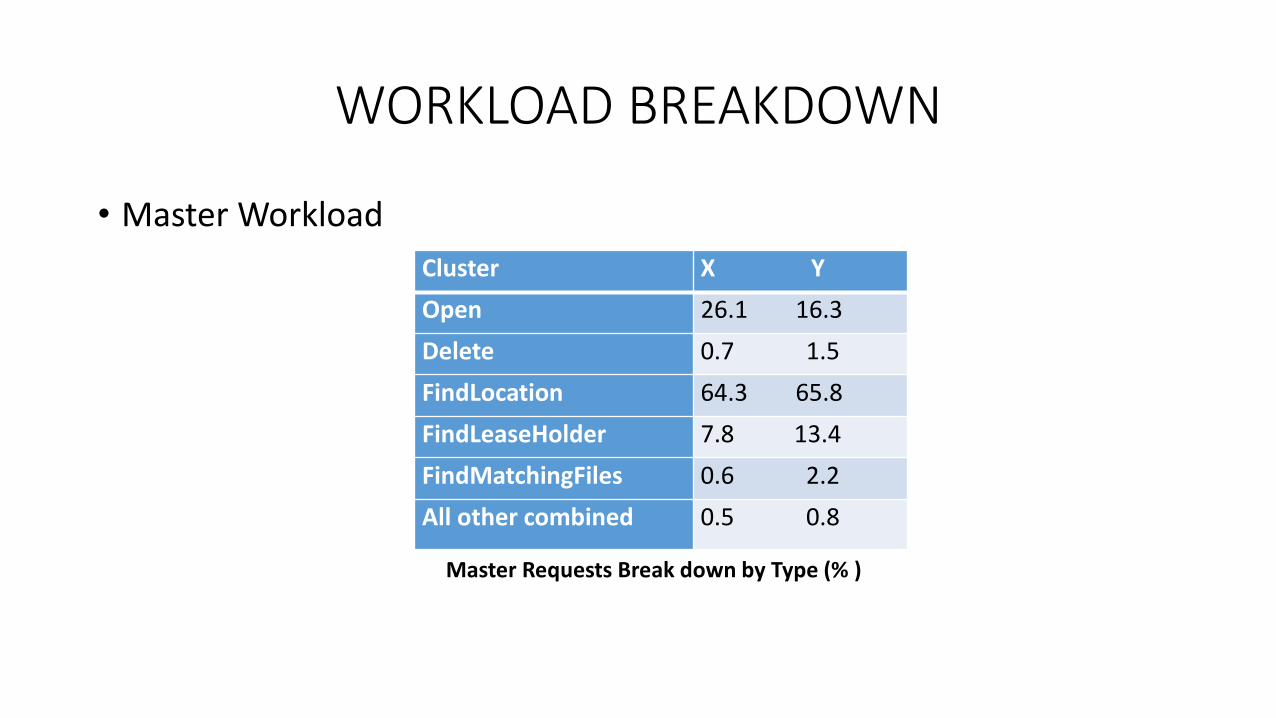
• Master Workload
Cluster X Y
Open 26.1 16.3
Delete 0.7 1.5
FindLocation 64.3 65.8
FindLeaseHolder 7.8 13.4
FindMatchingFiles 0.6 2.2
All other combined 0.5 0.8
Master Requests Break down by Type (% )