good jobs are back - georgetown university
TRANSCRIPT

GOOD JOBS ARE BACK2015Anthony P. Carnevale | |Tamara Jayasundera Artem Gulish
Technical Report
Centeron Education
and the Workforce
McCourt School of Public Policy


GOOD JOBS ARE BACKTechnical Report
2015

Good Jobs - Technical Report4
Acknowledgements We would like to express our gratitude to the individuals and organizations that have made this report possible. First, we thank Lumina Foundation, the Bill & Melinda Gates Foundation, and the Joyce Foundation for their support over the past several years, and in particular we are grateful for the support of Jamie Merisotis, Holly Zanville, Daniel Greenstein, Jennifer Engle, Matthew Muench, and Whitney Smith. We are honored to be partners in their mission of promoting postsecondary access and completion for all Americans. We would like to thank our designer Josias Castorena and our editors Nancy Lewis and Paul Lagasse.Our thanks also go to our colleagues, whose support was vital to our success: • Jeff Strohl and Nicole Smith advised on our methodology and provided insight to the report.• Andrew Hanson and Martin Van Der Werf provided valuable editorial input on the report. • Ban Cheah assisted in extracting household survey data.• Dmitri Repnikov provided research support.• Andrea Porter provided strategic guidance in the design and production of the report. • Ana Castanon assisted with the logistics and provided overall support. Many have contributed their thoughts and feedback throughout the production of this report. That said, all errors, omissions, and views remain the responsibility of the authors.
The views expressed in this publication are those of the authors and do not necessarily represent those of Lumina Foundation, the Bill & Melinda Gates Foundation, the Joyce Foundation, or their officers or employees.

Good Jobs - Technical Report 1
Introduction
The advantages of grouping jobs by occupation compared to grouping jobs by industry
Why do the differences between the Current Population Survey and Current Employment Statistics survey lead to different results?
CPS Basic Monthly and CPS March Supplement vs. CPS Outgoing Rotation Group
Methodology
Results
Sensitivity Analysis
References
Table of Contents2
4
5
9
12
14
15
17

Good Jobs - Technical Report2
IntroductionSince the job recovery began in 2010, many critics have claimed that the economy primarily has been producing low-wage jobs.1,2 , We conclude the exact opposite in Good Jobs Are Back; 44 percent of jobs added in the recovery were good jobs.3 What differentiates our study is how we group jobs. The studies that find a low-wage recovery – chief among them a 2014 study from the National Employment Law Project (NELP)4 – measure job change by industry and assign median wages of
the industry to all jobs within it. By contrast, our work focuses on the actual detailed occupations and uses their median earnings to determine whether growth has ocurred in good, middle-wage, or low-wage jobs. In the end, NELP finds that low-wage industries accounted for 44 percent of jobs added in the recovery,5 while we demonstrate that good jobs have in fact grown the most during recovery.
There is no official definition of a good job. In this report, we define good jobs as those that are in the upper-third by median wages of occupations in which they are classified. These good jobs pay more than $53,000 annually for a full-time, full-year (FTFY) worker.6 This pay level is more than 26 percent above the median earnings of all full-time, full-year workers, which is $42,000 per year.7 A two-earner household in which both were employed in good jobs would have annual household earnings of more than $100,000.8 In addition, a majority of these good jobs are full-time (86 percent), offer health insurance (68 percent), and provide an employer-sponsored retirement plan (61 percent). On average, the employer-provided benefits add more than 30 percent on top of the employees’ reported annual wages and salary.
Middle-wage jobs, as defined in this report, are jobs in the middle third by median wages of the occupations in which they are classified. Middle-wage jobs pay $32,000 to $53,000 per year for a full-time, full-year worker. Eighty percent of workers in middle-wage jobs are full-time; 54 percent of middle-wage jobs provide health insurance; and 46 percent of middle-wage jobs provide an employer-sponsored retirement plan.
Low-wage jobs, as defined in this report, are jobs in the lowest-third by median wages of occupations in which they are classified. Low-wage jobs pay less than $32,000 per year for an FTFY worker. Sixty-two percent of workers in low-wage jobs are full-time; 33 percent of low-wage jobs provide health insurance; and 25 percent of low-wage jobs include employer-sponsored retirement plans.
What do we mean by good jobs?
1. Lowrey, “Recovery Has Created Far More Low-Wage Jobs Than Better-Paid Ones,” 2014; Cohn, “Next Time Someone Says Fast Food Isn’t a Real Job, Remember This,” 2014; Weissman, “Our Low-Wage Recovery: How McJobs Have Replaced Middle Class Jobs,” 2012; Casselman, “There Are Lots of Jobs Available, But Are They Good Jobs?”, 2015; Mancuso, “Are Shifts in Industry Composition Holding Back Wage Growth?,” 2015.
2. Officially, the most recent recession, dubbed the Great Recession by many economists, started in December 2007 and ended in 2009, but the jobs recovery did not start until January 2010. Thus, the terms “Great Recession” and “recession” in this report refer to period from beginning of 2008 to 2010. The term “recovery” refers to the 2010 -2014 period that followed the recession.
3. See Good Jobs Are Back, available at: http://cew.georgetown.edu/goodjobs.4. National Employment Law Project (NELP), “The Low-Wage Recovery: Industry, Employment and Wages Four Years Into Recovery”, April 2014.5. Ibid.6. The concept of a good job incorporates a variety of other factors, such as job satisfaction, full-time status, access to benefits, job security,
working conditions, job meaningfulness, etc. However, due to data limitations and consistency with other research, in this report we use annual wages by occupation to identify good jobs. These other factors are positively correlated with wages, as we demonstrate through analysis of full-time employment, health, and retirement benefits. The wages presented here are full-time, full-year (FTFY) equivalents of 2008 median annual occupational wages (in 2013 dollars). The 2008 median annual occupational wages for all workers were used in the analysis. See the Methodological Appendix for more detail.
7. Based on $802 median weekly earnings of full-time wage and salary workers in 2015 Q1 from CPS, converted to annual salary (52 weeks) and rounded to the nearest $1,000. U.S. Bureau of Labor Statistics, “Median usual weekly earnings of full-time wage and salary workers by sex, quarterly averages, seasonally adjusted,” http://www.bls.gov/news.release/wkyeng.t01.htm.
8. Note that household earnings from wages and salaries differ from household income. Household income is composed of wages and salaries, capital income, retirement income, Social Security payments, child support, disability payments, etc. For 99 percent of tax filers (those with adjusted gross income less than $500,000), wages and salaries account for about 75 percent or more of all reported income. http://www.taxpolicycenter.org/UploadedPDF/2000134-composition-of-income-reported-on-tax-returns-in-2012.pdf.

Good Jobs - Technical Report 3
More specifically, in Good Jobs Are Back, we use employment data from the Current Population Survey (CPS) and group jobs into three wage tiers based on the median wages of each occupation. By contrast, the NELP 2014 study uses employment data from the Current Employment Statistics (CES) survey and groups jobs into three wage tiers based on the median wages in each industry.9
The industry approach classifies jobs by the sector of the economy in which the employer operates, whereas the occupation approach classifies jobs based on the type of duties assigned to employees and the type of activities they perform on the job. In our judgment, the actual occupation is significantly more relevant to the wages paid, level of education required, and job quality than the industry in which the employee works.
As Justin Wolfers wrote in his response to the NELP report in The New York Times:
The industry of a job tells you something about the type of building you walk into when you go to work, and not much about the type of work you do or how well you are paid. Figuring out whether the recovery is creating “good jobs” or “bad jobs” requires looking deeply into skill levels and job responsibilities.10
Accountants who work in manufacturing have more in common with accountants who work in the retail trade than they do with factory floor workers or engineers who work in manufacturing. The two different methods – grouping jobs by industry and grouping jobs by occupation – have substantial impact on how the employment change picture during the most recent recovery is characterized. For example, the healthcare industry – which includes both high-wage healthcare professionals and low-wage healthcare support workers
– added 1.5 million jobs between 2010 and 2014.11 However, when we examine occupations associated with the healthcare industry, the high-wage healthcare professional and technical occupations added around 616,000 jobs, while low-wage healthcare support occupations added only 164,000 jobs.12
The choice between industry and occupation as a grouping mechanism also affects the choice of data source for the analysis. The U.S. Bureau of Labor Statistics (BLS) oversees two primary surveys on employment: the Current Population Survey (CPS) and the Current Employment Statistics (CES) survey (also known as the Payroll Employment Survey). The CES surveys employers and provides employment and wages by industry and not occupation. The CPS surveys households and provides employment, wages, and other demographic information both by industries in which workers are employed and by their occupations. Studies that examine employment changes by industry generally use CES. Studies that examine change in employment by occupation, on the other hand, need to use CPS because CES does not provide occupation information.
The rest of this technical report provides a detailed discussion of how the above-mentioned methodological choices affect the employment changes by wage tiers. First, we describe in more detail the reasoning behind the differences in grouping jobs by occupations versus industries, as well as why occupation is a better reflection of job quality. Then, we discuss the differences between CES and CPS. Next, we discuss our approach to estimating the employment changes by wage tier. Finally, we compare our results with estimates using alternative approaches that researchers may consider for similar studies.
9. A 2012 NELP study that looked at employment change by occupation also found a low-wage recovery. Later in this technical report, we argue that finding is mainly the result of the data used for the analysis – Current Population Survey, Outgoing Rotation Group data – are suboptimal.
10. Wolfers, “A Low-Wage Recovery? The Evidence Isn’t There,” 2014.11. Center on Education and the Workforce analysis of Current Employment Statistics (CES), 2010-2014.12. Center on Education and the Workforce analysis of Current Population Survey (CPS), 2010-2014. Note the employment change numbers for
healthcare professional and technical occupations and healthcare support occupations do not sum up to the employment change for the healthcare industry because the healthcare industry includes workers that fall into other occupations, such as accountants, managers, and IT professionals.

Good Jobs - Technical Report4
13. U.S. Bureau of Labor Statistics, U.S. Department of Labor, Occupational Outlook Handbook, 2014-15 Edition, 2014.14. Ibid.15. National Employment Law Project (NELP), “The Low-Wage Recovery”, April 2014. 16. U.S. Bureau of Labor Statistics. Occupational Employment Statistics, 2014
The advantages of grouping jobs by occupation compared to grouping jobs by industryThere are two major ways the Bureau of Labor Statistics organizes jobs: by industry and by occupation. The BLS defines occupation as:
…a craft, trade, profession, or other means of earning a living. Also, a set of activities or tasks that employees are paid to perform and that together, go by a certain name. Employees who are in the same occupation perform essentially the same tasks, whether or not they work in the same industry.13
Industry, on the other hand, is defined as:
…a group of establishments that produce similar products or provide similar services.14
Therefore, industry refers primarily to the employers and the space in which firms operate, whereas occupation classifies a specific set of activities performed on the job. When studying job characteristics, industry is not an ideal way of examining job quality because each industry includes a wide variety of workers. Anyone who works at a firm, from the CEO to a janitor, is classified in the same industry. In the 2014 NELP study,15 the primary report cited as evidence of a low-wage recovery story, the median wage of industries was used to group jobs. Yet the skills required and the wages paid are vastly different among workers employed in the same industry, but in different roles.
Our analysis found a number of instances that demonstrate how using median industry wages can lead to the misleading classification of high- and middle-wage professionals as low-wage workers. For example, the home health industry is classified as low-wage based on its median wages. This industry includes some low-wage jobs, including nursing, home health, and personal care aides, but it also employs high-wage healthcare professionals, such as registered nurses (RNs) and physical therapists, whose employment grew during the recovery. Another low-wage industry often identified in the media – restaurant and food services – employs not only low-wage waiters, waitresses, and food preparation workers, but also middle-wage food-service managers, chefs, and head cooks, and even high-wage professionals such as accountants and auditors. Because the majority of workers in these industries have low wages, the median wage for the industry counts the high-wage professionals in these industries, such as accountants and RNs, as low-wage workers.
Workers in the same occupation, on the other hand, have similar sets of skills and receive similar wages. Some occupations such as accountants are found in a wide range of industries, while other occupations, such as dentists, are primarily found in the healthcare sector. Also, wages differ for a marketing manager at a Wall Street firm versus those for a marketing manager at a small nonprofit organization. Yet, this variation in wages is much narrower than the spectrum of wages we see when we classify jobs by industry. For example, the annual wages of registered nurses vary from $46,000 (10th percentile) to $99,000 (90th percentile) per year, while average wages for workers in hospitals range from under $25,000 per year for personal care aides to over $220,000 per year for surgeons.16 Thus, occupational analysis should be the foundation of job-quality assessment.

Good Jobs - Technical Report 5
Why do the differences between the Current Population Survey and Current Employment Statistics survey lead to different results?How researchers define and count jobs, and whom they include as workers, has a major impact on the researchers’ results. For example, if one includes teenagers in the analysis, the number of low-wage jobs reflected in the analysis will be higher than if one does not include teenagers because teenagers, for the most part, only have access to low-wage, part-time jobs. In the case of Good Jobs Are Back, since we rely on secondary data sources for our research, we are limited by the available data sources and the methodological decisions made by those who administer the surveys that produce those data sources.
As mentioned above, the Bureau of Labor Statistics provides two main sources of employment data: CPS and CES. The CPS is a sample survey that the U.S. Census Bureau administers to approximately 60,000 households each month;17 CES, sometimes referred to as the “establishment survey,” is a sample survey that the Bureau of Labor Statistics administers to 143,000 businesses and government agencies each month.18
Both data sets provide a monthly snapshot of employment in the United States, but CPS examines the employment status of adults in the civilian population, while CES focuses on jobs. More specifically, CES considers payroll jobs covered by the state Unemployment Insurance (UI) system. As a result, the populations covered by the respective surveys differ.19
The CPS covers individuals 16 years of age and older and includes self-employed workers, agricultural-sector workers, private household workers, unpaid family workers, and workers on leave without pay throughout the reference period (i.e., the time period covered by the survey). The CES, on the other hand, has no age limitations, but excludes self-employed workers, agricultural-sector workers, private household workers, unpaid family workers, and workers on leave without pay throughout the reference period. In addition, the reference period for CPS is the week that includes the 12th of the month for which the survey is conducted, whereas the reference period for CES is the pay period that includes the 12th of the month for which the survey is conducted, whether that pay period is a week, two weeks, or a month.
In several cases, these differences affect the results of job quality analyses. For example, the lack of an age limit in CES means it will capture more low-wage jobs, because teenagers for the most part only have access to low-wage, part-time jobs. Counting each job held by multiple-job holders in CES will likely move the results toward more low-wage jobs, because secondary jobs are often part-time service jobs. These jobs are also more likely to be affected by the business cycle because they are usually the first ones to go during the recession and the first to be added in the recovery. On the other hand, inclusion of agricultural workers, private household workers, and unpaid family workers in CPS will also likely capture more low-wage jobs. So, it is not obvious which data source will capture more low-wage employment. Our analysis of the change in employment by industry using the two data sources, however, shows that CES captures more job losses at the low-wage tier during labor market contraction and more job gains at that wage tier during labor market expansion.
Good Jobs - Technical Report6
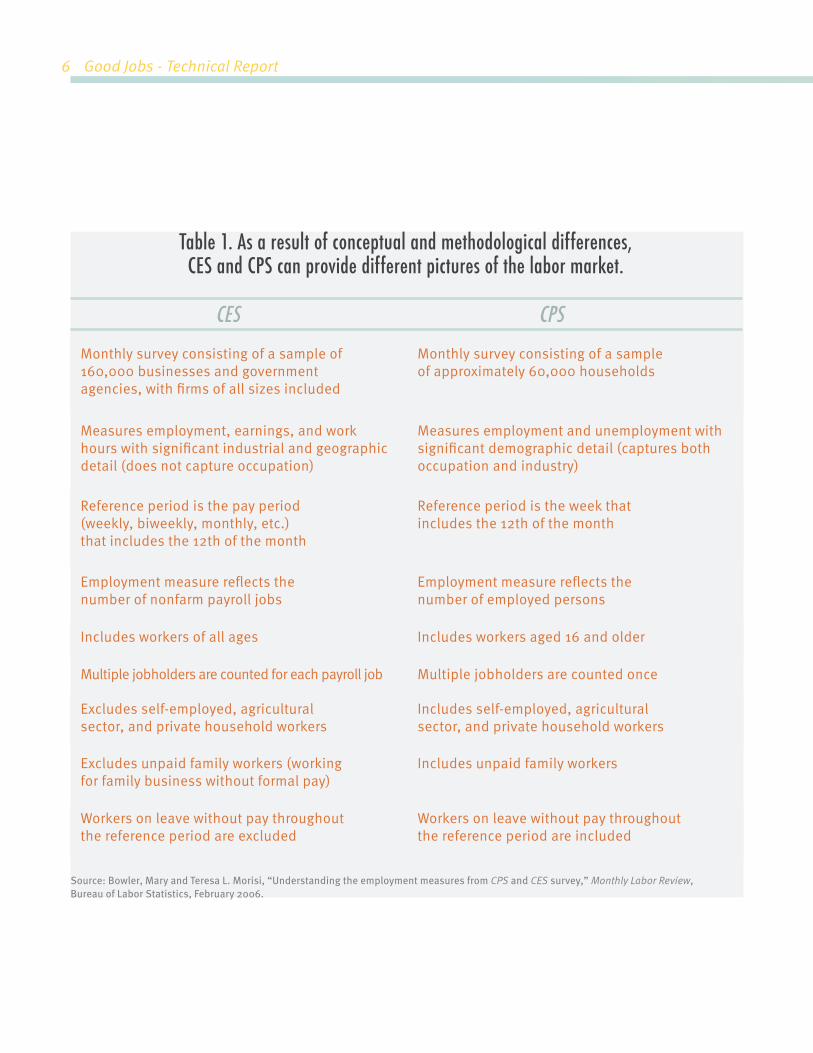
Table 1. As a result of conceptual and methodological differences,CES and CPS can provide different pictures of the labor market.
Monthly survey consisting of a sample of 160,000 businesses and government agencies, with firms of all sizes included
Monthly survey consisting of a sample of approximately 60,000 households
Employment measure reflects the number of nonfarm payroll jobs
Employment measure reflects the number of employed persons
Measures employment, earnings, and work hours with significant industrial and geographic detail (does not capture occupation)
Measures employment and unemployment with significant demographic detail (captures both occupation and industry)
Reference period is the pay period (weekly, biweekly, monthly, etc.)that includes the 12th of the month
Reference period is the week that includes the 12th of the month
CPSCES
Excludes unpaid family workers (working for family business without formal pay)
Includes unpaid family workers
Includes workers of all ages Includes workers aged 16 and older
Workers on leave without pay throughout the reference period are excluded
Workers on leave without pay throughout the reference period are included
Excludes self-employed, agricultural sector, and private household workers
Includes self-employed, agricultural sector, and private household workers
Multiple jobholders are counted for each payroll job Multiple jobholders are counted once
Source: Bowler, Mary and Teresa L. Morisi, “Understanding the employment measures from CPS and CES survey,” Monthly Labor Review, Bureau of Labor Statistics, February 2006.

Good Jobs - Technical Report 7
Because of these differences, the two surveys can give divergent pictures of what is happening with the labor market. For example, CES shows that by the end of 2014 10.9 million jobs were added in recovery compared to 8.7 million workers who CPS shows gained jobs in the recovery. Thus, these numbers are not directly comparable. In order to get comparable data and a more consistent picture of what is happening with the labor market, the CPS numbers can be adjusted to the CES concept of payroll jobs, following the methodology similar to the one employed by Bowler and Morisi, 2006 (Table 2).
Since, government workers are handled differently in CES and CPS in ways that do not allow for direct comparison, we only apply the adjustment process to
private-sector, non-governmental employment in CES and CPS. First, we take all workers who are 16 years and older in the CPS survey. As CES excludes private household workers, this group was excluded from CPS unadjusted employment totals as well. As presented in the first two rows of Table 2, CPS has an additional 21 million to 23 million workers over what is reported in CES. We make further adjustments to CPS as depicted in rows 4 through 9 of Table 2, including subtracting agricultural workers, self-employed workers, unpaid workers, and public sector workers (outside of explicitly designated government industries in CPS), and adding in multiple-job holders a second time to account for their second job. By making these adjustments we are able to reduce significantly the differences in the total employment in CES and CPS (see Table 2, rows 1 and 11).
20. Bowler and Morisi, “Understanding the employment measures from CPS and CES survey,” 2006; Abraham, Haltiwanger, Sandusky, and Spletzer, “Exploring Differences in Employment between Household and Establishment Data,” 2013; Clark “Household v. Payroll Surveys: Which Is More Reliable?,” 2005; Department of Numbers, “Comparing CES and CPS Employment,” 2010.
21. The government jobs are handled differently in CES and CPS in a way that do not make them directly comparable. In CES, all government jobs are classified under public-sector industry categories. Because CES targets employers, the precise assignment of jobs to the sector where they are located makes this a plausible approach. So, for example, public school teachers are classified under “government” in CES. CPS, on the other hand, is based on self-reported household interview data, and therefore, industry categories reflect how workers and their family members categorize the sector where they work. Thus, public school teachers are often classified under “education” in CPS.
22. The multiple-job holders with more than two jobs are counted as only having two jobs and both of them are counted as being in the same industry for the purposes of the adjustment process.

Good Jobs - Technical Report8
Source: Center on Education and the Workforce analysis of Current Employment Statistics (CES) and Current Population Survey (CPS), 2008-2014.
Note: Numbers may not sum due to rounding.
Table 2. Adjusting the CPS employment data to the non-governmental CES payroll jobs concept reduces the gap between the two surveys.
114,600,000
137,500,000
1,900,000
14,800,000
100,000
14,400,000
6,900,000
113,200,000
107,700,000
131,100,000
1,900,000
13,900,000
100,000
14,000,000
6,300,000
107,500,000
116,600,000
137,900,000
1,900,000
13,700,000
100,000
13,300,000
6,400,000
115,300,000
-6,900,000
-6,400,000
0
-900,000
0
-400,000
-600,000
-5,700,000
8,900,000
6,800,000
0
-200,000
0
-700,000
100,000
7,800,000
2,000,000
400,000
0
-1,100,000
0
-1,100,000
-500,000
2,100,000
2008 2010 2014 Change2008-2010
Change2010-2014
Change2008-2014
Non-governmental paryoll jobs (CES)
Household employment (CPS) (excluding private households and explicitly designated government industries
Less:
Plus:
Result
Adjusted nongovernmental household employment (CPS)
Agriculture
Nonagricultural self-employed
Multiple jobholders
Nonagricultural public sector workers (outside explicitly designated government activities)
Nonagricultural unpaid workers
1.
2.
3.
4.
5.
6.
7.
8.
9.
10.
11.
(a) (b) (c) (d) (e) (f)

Good Jobs - Technical Report 9
Although the total employment numbers after the adjustment are close, differences in employment change in recession and recovery remain (Table 2, columns d through f). Because the CPS and CES have different coverage, limitations, and sources of error, full reconciliation of the two surveys is not possible, especially the differences by industry sector. For example, during the recovery CES shows substantially greater job gains for consulting and business services, leisure and hospitality, and wholesale and retail trade sectors, compared to CPS.
Some factors that may contribute to the remaining differences between CES and CPS after the adjustment process include:23
• Undercoverage of poor, minorities, and other disadvantaged groups in CPS;
• Workers under 16 years of age counted in CES, but not CPS;
• Impact of undocumented immigrant workers; • Impact of foreign commuters;• Multiple-job holders with more than two jobs
counted separately for all jobs in CES, but not CPS;24
• Differences in reference periods that may result in double counting of job changers in CES;
• Prison inmates who work in jobs covered by a state’s UI outside the prison are counted in CES, but not CPS;
• U.S. military members who hold secondary civilian jobs are counted in CES, but not CPS; and
• Misidentification/miscoding of industry in the self-reported data in CPS.
CPS Basic Monthly and CPS March Supplement vs. CPS Outgoing Rotation GroupThe Current Population Survey (CPS) is the primary source of labor force statistics in the United States, and at 90 percent participation has one of the highest response rates among government surveys.25 Each month some 60,000 carefully selected households are asked a set of questions, which determine key economic statistics, such as employment trends and the unemployment rate. To maximize precision – or more formally, minimize the sample variance – the survey utilizes a 4-8-4 rotating panel structure, meaning households are interviewed for four consecutive months, ignored for eight months, and then interviewed for four more months. By design, this sample overlap generates better estimates of change over time. Moreover, since incoming households replacing their outgoing counterparts are based on similar characteristics, the survey design ensures that each monthly sample is representative of the true population.26
There is a subtle, yet significant, distinction between the household units who fall on the fourth or eighth month of each rotation. This outgoing rotational group (ORG) is asked an additional set of questions relating to earnings and hours worked, otherwise known as earner study questions.27 It is not a separate survey per se, but is rather a subset of the CPS monthly sample: each ORG represents one quarter (two of eight rotation groups) of the CPS monthly sample. Thus, while each individual ORG may not be fully representative of the workforce, when combined over a quarter, and especially over a year, these merged outgoing rotation groups (MORG) can provide unbiased estimates.
23. Bowler and Morisi, “Understanding the employment measures from CPS and CES survey,” 2006.24. Though we adjust for multiple-job holders, they are only counted twice in the adjusted CPS data. Job holders with three or more jobs are
only counted as having two jobs. Also, multiple-job holders are counted as having two jobs in the same industry, even though they actually may have jobs in different industries.
25. U.S. Census Bureau. Current Population Survey.26. U.S. Census Bureau. Design and Methodology: Current Population Survey. Technical Paper 66. 2006.27. IPUMS-CPS, “Outgoing Rotation Group/ Earner Study,” https://cps.ipums.org/cps/outgoing_rotation_notes.shtml.

Good Jobs - Technical Report10
However, several nuances between the two data sets make MORG – used in the 2012 NELP study28 – a weaker tool for comparing employment change, especially across different occupations and wage tiers:
• Wages in CPS ORG are based on weekly rather than annual earnings. The annual earnings by occupation in Good Jobs Are Back are a better reflection of workers’ income from jobs throughout the year than weekly earnings for any quarter of the year from MORG data. These annual earnings are taken from CPS Annual Social and Economic Supplement (the “March Supplement”), which is administered once a year in March29 and contains additional income and demographic information.
• CPS ORG data for any one quarter can be subject to seasonality effects. Different occupations have peak employment during different times of the year. Thus, picking any one quarter of employment data results in over-representation of some occupations and under-representation of others.
• The CPS ORG does not capture self-employed workers. Self-employed workers make up about 14 percent of total employment, a significant part of the workforce that is not included in CPS ORG data.
• The two surveys have different methods for dealing with non-response. The March Supplement employs a sequential hot-decking approach, which uses current survey responses to substitute for missing data, whereas the cell hot-decking approach is employed in CPS ORG. The latter ignores important individual characteristics, such as industry, geography, marital status, and ethnicity.
• Last, the two surveys differ in data collection methods. The ORG is conducted over the phone (hence, the lower response rate) while interviews for the March CPS are conducted in person. Since non-response is negatively related to income, the ORG is likely to see a greater share of imputed values for such individuals.
28. National Employment Labor Project (NELP), “The Low Wage Recovery and Growing Inequality,” 2012.29. March CPS yields much higher response rates relative to the ORG (80 percent vs. 60 percent).
Good Jobs - Technical Report 11
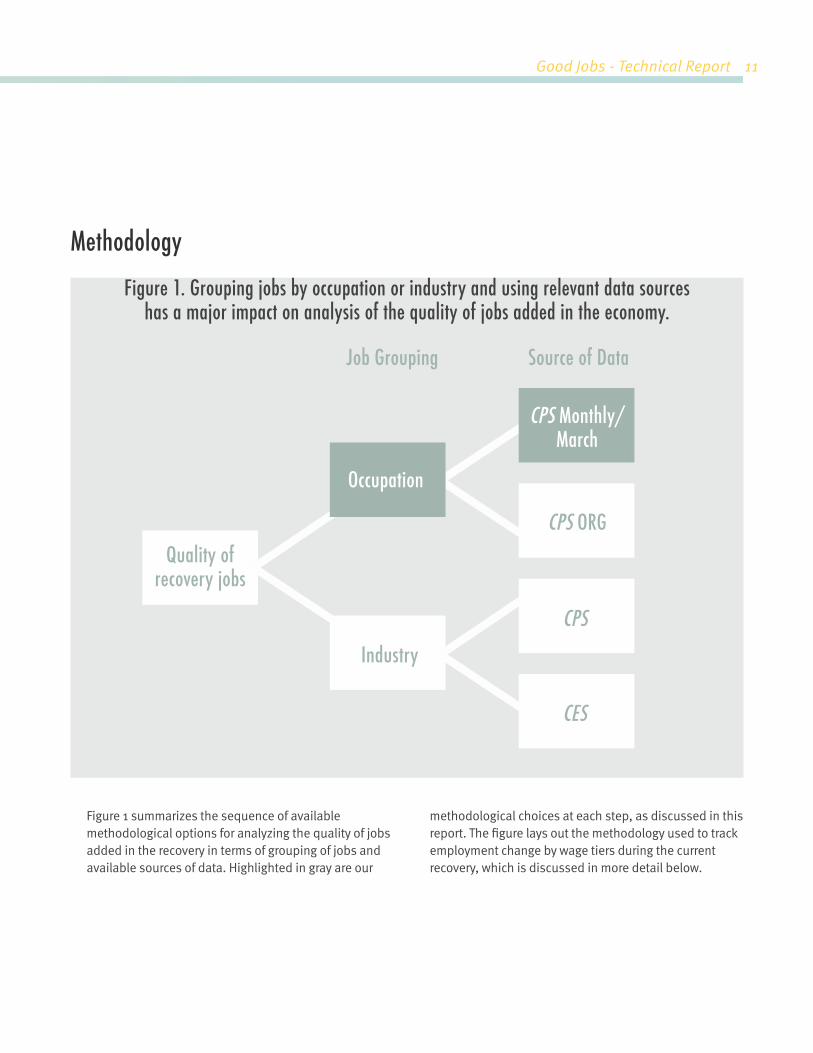
Figure 1 summarizes the sequence of available methodological options for analyzing the quality of jobs added in the recovery in terms of grouping of jobs and available sources of data. Highlighted in gray are our
methodological choices at each step, as discussed in this report. The figure lays out the methodology used to track employment change by wage tiers during the current recovery, which is discussed in more detail below.
Figure 1. Grouping jobs by occupation or industry and using relevant data sources has a major impact on analysis of the quality of jobs added in the economy.
Job Grouping Source of Data
Quality ofrecovery jobs
Industry
CPS ORG
CPS
CES
Occupation
CPS Monthly/March
Methodology

Good Jobs - Technical Report12
30. The tendency among respondents to report their wage information to the nearest hundred or thousand dollars creates lumping in the wage data. However, this did not affect cutoffs for the wage tiers in our analysis.
31. National Employment Labor Project (NELP), “The Low Wage Recovery and Growing Inequality”, 2012.
In this report, we take the following approach to track employment change by wage tiers:
• We use two data sets from the U.S. Census Bureau’s Current Population Survey in the analysis: the CPS Basic Monthly, 2008-2014, and the CPS Annual Social and Economic Supplement (CPS March Supplement), 2008-2014.
• We group jobs into 485 detailed occupations, based on the primary occupation of the worker, as reported in the 2008 CPS Basic Monthly (12-month pooled data).
• We sort these detailed occupations by median annual earnings (2008) from the 2009 CPS March Supplement.30 We then divide the detailed occupations into three equal employment tiers: good jobs, middle-wage jobs, and low-wage jobs, weighted by 2008 average monthly employment from 2008 CPS Basic Monthly (12-month pooled data).31
The median annual earnings (in 2013 dollars) for the three tiers are:
• Good jobs: more than $42,700;• Middle-wage jobs: $25,800 to $42,700; and• Low-wage jobs: less than $25,800.
The median annual earnings (in 2013 dollars) of full-time, full-year (FTFY) workers of these occupations are: • Good jobs: more than $53,000;• Middle-wage jobs: $32,000 to $53,000; and• Low-wage jobs: less than $32,000.
We use annual rather than hourly or weekly earnings because annual earnings provide a more consistent metric of pay that individuals can expect throughout the year from performing a particular type of job. Some occupations have high hourly earnings, but do not provide employment throughout the year, such as tax preparers and seasonal construction jobs. So, for example, construction laborers are middle-wage based on hourly earnings, but low-wage based on annual earnings.
We calculated the change in employment during the recent recovery (2010-2014) for the 485 detailed occupations, using annual employment averages from CPS Basic Monthly, and aggregated the employment change totals across the three wage tiers. Due to changes in occupation codes, minor recoding was necessary to maintain consistency in the analysis. Thus, we recoded all detailed occupation groups in 2009-2014 to 2008 occupation codes.
We then compared employment change by tiers from 2010 to 2014 (for good, middle-wage, and low-wage jobs).
To evaluate the quality of jobs in each wage tier on dimensions beyond earnings, we compared rates of full-time employment, employer-provided health insurance, and employer-sponsored retirement plans across the three wage tiers from CPS March Supplement.
We separated out employment in each detailed occupation group by three educational attainment levels: high school diploma or less, some college or Associate’s degree, and Bachelor’s degree or higher. We then analyzed employment change during the recovery (2010-2014) for each educational attainment level within each of the three wage tiers.

Good Jobs - Technical Report 13
Results
Our findings show that over the course of the recovery (2010-2014), the good jobs added the largest number of jobs, 2.9 million. The middle-wage jobs added the next
largest number of jobs, 1.9 million. Low-wage jobs, on the other hand, added the smallest number of jobs, 1.8 million.
Figure 2. Out of 6.6 million jobs added in the recovery, 2.9 million were in good jobs compared to just 1.8 million in low-wage jobs.
Employment change, 2010-2014
Good jobs(more than $53,000)*
Middle-wage jobs($32,000-$53,000)*
Low-wage jobs(less than $32,000)*
2,900,000
1,900,000 1,800,000
Source: Georgetown University Center on Education and the Workforce analysis of Current Population Survey (CPS) data, 2010-2014.*Note: The wages presented here are full-time, full-year (FTFY) equivalents of 2008 median annual occupational wages (in 2013 dollars). The 2008
median annual occupational wages for all workers were used in the analysis.

Good Jobs - Technical Report14
Sensitivity analysisHere we compare our results to estimates based on alternative approaches, including the approach used in the 2012 NELP study, “The Low Wage Recovery and
Growing Inequality”, and other potential alternatives that researchers may consider using in similar studies.
Good Jobs Are Back methodology: This is the methodology we use in the Good Jobs Are Back, as described in the previous section. We base our occupational wage tiers on 2008 median annual wages for detailed occupations from 2009 CPS March Supplement weighted by 2008 average monthly employment by detailed occupation groups from 2008 CPS Basic Monthly.
Alternative 1 (2014-based tiers): This alternative approach is generally similar to the approach we used, but bases the occupational wage tiers on 2013 median annual wages from the 2014 CPS March Supplement and 2014 average monthly employment from CPS Monthly
for detailed occupations. This alternative approach is based on the premise that median wages for some occupations may have changed substantially enough to move them into a different occupational wage tier, for example from high-wage occupation to middle-wage occupations, or vice versa. High-wage occupations still show the largest job gains in the recovery (2.8 million jobs), but low-wage occupations show greater job growth than in the CEW approach (2.1 million jobs v. 1.8 million), and middle-wage jobs show a little less job growth that in the CEW approach (1.8 million v. 1.9 million).
Source: Georgetown University Center on Education and the Workforce analysis of Current Population Survey (CPS) Basic Monthly and Outgoing Rotational Group (ORG) data, 2010-2014.
Table 3. Sensitivity analysis: comparing CEW approach to a number of potential alternatives.
2,900,000 2,800,000 2,100,000 2,700,000
1,800,00 2,100,000 2,200,000 1,900,000
1,900,000 1,800,000 1,400,000 1,500,000
Good Jobs Are Back methodology
Alternative 1 (2014-based tiers)
Alternative 2 (using merged CPS ORG Q1)
Alternative 3(using merged CPS
ORG annual)
Good jobs
MIddle-wage jobs
Low-wage jobs

Good Jobs - Technical Report 15
32. National Employment Labor Project (NELP), “The Low Wage Recovery and Growing Inequality”, 2012
Alternative 2 (using merged CPS ORG Q1): This alternative uses a similar approach to the one utilized by the National Employment Labor Project (NELP) 2012 study, “The Low Wage Recovery and Growing Inequality.”32 In this approach the occupational wage tiers are based on ranking of detailed occupations of median hourly occupational wages (compared to annual wages in the CEW approach) and employment of workers 18-64 years of age (compared to workers 18 and over in CEW approach). Further, this alternative excludes the self-employed in CPS Outgoing Rotation Group (ORG) files. The employment change is calculated over the recovery from 2010 Q1 to 2014 Q1. In the NELP 2012 study the final year of analysis was 2012 and therefore the end point was 2012 Q1. In order to make the outcomes of this approach comparable with our results, we extend this analysis to 2014 Q1. Specifically we use merged CPS ORG files compiled by the National Bureau of Economic Research (NBER). Unlike other approaches, this alternative does show the largest growth during the recovery to be among low-wage occupations (2.2 million jobs), but even using this approach, the gap between job growth in low-wage occupations and high-wage occupations has closed substantially since 2012. Between 2010 and 2012, this approach showed that high-wage occupations only gained around 640,000 jobs compared to low-wage occupations, which accounted for a gain of 1.2 million. By 2014, however, the gap in job growth (2010-2014) between high-wage occupations and low-wage occupations shrank to less than 100,000 jobs (2.1 million for high-wage jobs v. 2.2 million for low-wage jobs).
We argue that this approach is suboptimal because it fails to account fully for all effects of seasonality. NELP contends that picking the same time of each year (Q1) to delineate business cycles in the analysis helps address seasonality, which is a major factor in occupational employment. By doing so, it associates employment change in occupation to job growth rather than seasonal variation. However, this approach only addresses part of the seasonality issue. Occupational mix is still affected by the time of the year chosen. So choosing Q1 will reflect growth in occupations whose employment peaks in Q1, but not necessarily the occupations whose employment peaks at other times of the year.
Alternative 3 (using merged CPS ORG annual): Alternative 3 uses a similar approach to alternative 2, but corrects for the seasonality issue. In this alternative, we use all 12 months of the merged CPS ORG files instead of just Q1. We estimate average monthly occupational employment and median hourly occupational wages using all 12 months of data for 2010 and 2014. By using the full annual data, rather than just one quarter, this approach captures job growth across all occupations regardless of when each experiences an employment peak or employment slump during the year. So, occupations that may look like they have experienced no growth when using one quarter of data, because their off-season employment is similar regardless of the business cycle, may reflect growth (or decline) using annual data. Unlike alternative 2, which only uses Q1 data, this approach, similarly to the Good Jobs are Back methodology, shows that good jobs grew the most jobs during the recovery (2.7 million v. 1.9 million for low-wage occupations). This supports the claim that using only one quarter of data can lead to skewed employment change estimates due to seasonality of jobs.

Good Jobs - Technical Report16
Abraham, Katharine G., John Haltiwanger, Kristin Sandusky, and James R. Spletzer, “Exploring Differences in Employment between Household and Establishment Data,” Journal of Labor Economics 31, (2013 ): S129-S172.
Bowler, Mary and Teresa L. Morisi. “Understanding the Employment Measures from the CPS and CES Survey.” Monthly Labor Review (2006).
Carnevale, Anthony, Tamara Jayasundera, and Ban Cheah. The College Advantage. Washington, D.C.: Georgetown University Center on Education and the Workforce, 2012.
Carnevale, Anthony, Tamara Jayasundera, and Dmitri Repnikov. The Online College Labor Market. Washington, D.C.: Georgetown University Center on Education and the Workforce, 2014.
Casselman, Ben. “College Grads May Be Stuck in Low-Skill Jobs.” The Wall Street Journal, March 26, 2013,http://www.wsj.com/news/articles/SB10001424127887323466204578382753004333838.
Casselman, Ben. “There Are Lots of Jobs Available, But Are They Good Jobs?” Five Thirty Eight, March 10, 2015, http://fivethirtyeight.com/datalab/there-are-lots-of-jobs-available-but-are-they-good-jobs/.
Clark, Hope. “Household v. Payroll Surveys: Which Is More Reliable?” InContext 6 (2005), 15-16.Cohn, Emily. “Next Time Someone Says Fast Food Isn’t a Real Job, Remember This.” Huffington Post, Oct. 27, 2014.
http://www.huffingtonpost.com/2014/10/27/fast-food-jobs-real_n_6028404.html.Department of Numbers, “Comparing CES and CPS Employment.” (2010), http://www.deptofnumbers.com/
blog/2010/05/cps-ces-employment-comparison/.IPUMS-CPS. “Outgoing Rotation Group/ Earner Study,” https://CPS.ipums.org/CPS/outgoing_rotation_notes.shtml.Lowrey, Annie. “Recovery Has Created Far More Low-Wage Jobs Than Better-Paid Ones.” The New York Times, April
27, 2014, http://www.nytimes.com/2014/04/28/business/economy/recovery-has-created-far-more-low-wage-jobs-than-better-paid-ones.html?_r=0.
Mancuso, Whitney. “Are Shifts in Industry Composition Holding Back Wage Growth?” Federal Reserve Bank of Atlanta, Feb. 26, 2015, http://macroblog.typepad.com/macroblog/2015/02/are-shifts-in-industry-composition-holding-back-wage-growth.html.
National Employment Law Project (NELP). “The Low-Wage Recovery: Industry, Employment and Wages Four Years Into Recovery.” Last modified April 2014, http://www.nelp.org/page/content/lowwagerecovery2014.
National Employment Labor Project (NELP). “The Low Wage Recovery and Growing Inequality,” 2012, http://nelp.org/content/uploads/2015/03/LowWageRecovery2012.pdf.
Pitts, Melinda, John Robertson, and Ellyn Terry. “Reasons for the Decline in Prime-Age Labor Force Participation,” Federal Reserve Bank of Atlanta Macroblog, April 10, 2014, http://macroblog.typepad.com/macroblog/2014/04/reasons-for-the-decline-in-prime-age-labor-force-participation-.html.
Scott, Amy. “A Degree in Hand, but a Slow Start.” The New York Times, March 24, 2014, http://www.nytimes.com/2014/03/25/your-money/a-degree-in-hand-but-a-slow-start-up-the-career-ladder.html.
Schmidtt, John, and Janelle Jones. Where Have All the Good Jobs Gone? Washington, D.C.: Center for Economic Policy and Research, 2012.
U.S. Bureau of Labor Statistics. Current Employment Statistics (CES), 2014, http://www.bls.gov/ces/.U.S. Bureau of Labor Statistics. Occupational Employment Statistics (OES), 2014, http://www.bls.gov/oes/.U.S. Bureau of Labor Statistics Occupational Outlook Handbook, 2014-15 Edition. 2014, http://www.bls.gov/ooh/
about/glossary.htm.
References

Good Jobs - Technical Report 17
U.S. Census Bureau. “Current Population Survey.” http://www.census.gov/CPS/about/faq.html.U.S. Census Bureau. “Design and Methodology: Current Population Survey. Technical Paper 66.” 2006, http://
www.census.gov/prod/2006pubs/tp-66.pdf.U.S. Census Bureau and Bureau of Labor Statistics. Current Population Survey (Basic Monthly). 2008-2014
U.S. Department of Labor Occupational Information Network (O*Net) OnLine. “Summary Report: 11-9199.00 - Managers, All Other,” https://www.onetonline.org/link/summary/11-9199.00.
Weissman, Jordan. “Our Low-Wage Recovery: How McJobs Have Replaced Middle Class Jobs.” The Atlantic, August 31, 2012, http://www.theatlantic.com/business/archive/2012/08/our-low-wage-recovery-how-mcjobs-have-replaced-middle-class-jobs/261839/.
Williams, Byron. “Jobs or Quality Jobs?” The Huffington Post, March 4, 2015. http://www.huffingtonpost.com/byron-williams/jobs-or-quality-jobs_b_6799748.html.
Wolfers, Justin. “A Low-Wage Recovery? The Evidence Isn’t There.” The New York Times, April 28, 2014, http://www.nytimes.com/2014/04/29/upshot/a-low-wage-recovery-the-evidence-isnt-there.html?abt=0002&abg=1.
Yellen, Janet. “A Painfully Slow Recovery for America’s Workers: Causes, Implications, and the Federal Reserve’s Response.” Remarks at “A Trans-Atlantic Agenda for Shared Prosperity” conference, Washington, D.C., February 2013.

Good Jobs - Technical Report18

Good Jobs - Technical Report 19Good Jobs Are Back comprises a full report and a technical report.Both can be accessed online at cew.georgetown.edu/goodjobs
3300 Whitehaven St. NWSuite 3200Washington, D.C. 20007cew.georgetown.edu
Centeron Education
and the Workforce
McCourt School of Public Policy
Good Jobs Are Back comprises a full report and a technical report.Both can be accessed online at cew.georgetown.edu/goodjobs
3300 Whitehaven St. NWSuite 3200Washington, D.C. 20007cew.georgetown.edu
Centeron Education
and the Workforce
McCourt School of Public Policy
areback