good bank international limited - ey · good bank (international) limited i contents introduction
TRANSCRIPT
Good Bank (International) LimitedInternational GAAP®
����������� ���������������������� the year ended 31 December 2010
Based on International Financial Reporting Standards in issue at 31 August 2010
®

Good Bank
(International) Limited International GAAP ®
Illustrative financial statements for the year ended 31 December 2010 Based on International Financial Reporting Standards in issue at 31 August 2010
Good Bank (International) Limited i
Contents Introduction ........................................................................................................................................................ 1�Basis of preparation and presentation ................................................................................................................... 2�Abbreviations and key ......................................................................................................................................... 4�General information............................................................................................................................................. 6�Independent auditors’ report to the shareholders of Good Bank (International) Limited ............................................. 7�Consolidated income statement ............................................................................................................................ 8�Consolidated statement of comprehensive income ................................................................................................. 9�Consolidated statement of financial position ........................................................................................................ 10�Consolidated statement of changes in equity ....................................................................................................... 11�Consolidated statement of cash flows .................................................................................................................. 12�Notes to the consolidated financial statements .................................................................................................... 13�
1. Corporate information ................................................................................................................................ 13�2. Accounting policies .................................................................................................................................... 13�2.1 Basis of preparation ................................................................................................................................. 13�2.2 Significant accounting judgments, estimates and assumptions ..................................................................... 14�2.3 Changes in accounting policy and disclosures ............................................................................................. 15�2.4 Summary of significant accounting policies ................................................................................................ 15�2.5. Standards issued but not yet effective ...................................................................................................... 31�3. Segment information ................................................................................................................................. 32�4. Interest and similar income ......................................................................................................................... 36�5. Interest and similar expense ....................................................................................................................... 36�6. Net fees and commission income ................................................................................................................. 37�7. Net trading income .................................................................................................................................... 37�8. Net gain or (loss) on financial instruments designated at fair value through profit or loss .................................. 38�9. Other operating income .............................................................................................................................. 38�10. Credit loss expense .................................................................................................................................. 38�11. Impairment losses on financial investments ................................................................................................ 39�12. Personnel expenses ................................................................................................................................. 39�13. Other operating expenses ......................................................................................................................... 39�14. Income tax .............................................................................................................................................. 39�15. Earnings per share ................................................................................................................................... 41�16. Components of other comprehensive income ............................................................................................. 42�17. Income tax effects relating to comprehensive income .................................................................................. 42�18. Dividends paid and proposed ..................................................................................................................... 42�19. Cash and balances with central banks ........................................................................................................ 43�20. Due from banks ....................................................................................................................................... 43�21. Cash collateral on securities borrowed/lent and reverse repurchase/repurchase agreements ......................... 44�22. Derivative financial instruments ................................................................................................................ 45�23. Other financial assets and financial liabilities at fair value through profit or loss ............................................. 48�24. Loans and advances to customers ............................................................................................................. 49�25. Financial investments ............................................................................................................................... 51�26. Other assets ............................................................................................................................................ 52�27. Property and equipment ........................................................................................................................... 52�28. Goodwill and other intangible assets .......................................................................................................... 53�29. Due to banks ........................................................................................................................................... 55�30. Due to customers ..................................................................................................................................... 55�31. Debt issued and other borrowed funds ....................................................................................................... 55�32. Other liabilities ........................................................................................................................................ 56�33. Provisions ............................................................................................................................................... 57�34. Retirement benefit plan ............................................................................................................................ 57�35. Issued capital and reserves ....................................................................................................................... 60�

I I
36. Fair value of financial instruments ............................................................................................................. 61�37. Securitisation and asset management activities .......................................................................................... 74�38. Share–based payment .............................................................................................................................. 78�39. Additional cash flow information ............................................................................................................... 79�40. Maturity analysis of assets and liabilities .................................................................................................... 81�41. Contingent liabilities, commitments and leasing arrangements ..................................................................... 82�42. Related party disclosures .......................................................................................................................... 83�43. Events after the statement of financial position date ................................................................................... 85�44. Risk management .................................................................................................................................... 85�44.1 Introduction .......................................................................................................................................... 85�44.2 Credit risk ............................................................................................................................................. 87�44.3 Liquidity risk and funding management .................................................................................................... 99�44.4 Market risk .......................................................................................................................................... 103�44.5 Operational risk ................................................................................................................................... 108�45. Capital .................................................................................................................................................. 108�

1
Introduction The purpose of this publication is to provide a practical working model of consolidated financial statements prepared in accordance with IFRS, for a fictitious banking entity, Good Bank (International) Limited (Good Bank) and its subsidiaries (the bank), incorporated and listed in Goodland, with a reporting date of 31 December 2010. Goodland is a fictitious country, whose currency is the Goodland dollar ($), which is also the bank’s functional and presentation currency.
IFRS references are shown on each page of the financial statements, indicating the specific IFRS paragraph that outlines the actual accounting treatment or disclosure adopted for that particular line item or block of narrative.
These financial statements should not be relied upon as a substitute for detailed advice concerning individual situations or for reference to the relevant IFRS. These illustrative financial statements are not intended to satisfy country or stock market regulations in any given jurisdiction and may have to be significantly altered to meet such requirements. In case of doubt as to the requirements, it is essential to refer to the relevant IFRS guidance and, where necessary, seek appropriate professional advice.
These model financial statements will need to be tailored to reflect the circumstances of an actual bank. The narrative given here will in practice also need to be extended to provide more detail in order to meet the various disclosure requirements.
A supplement on the early adoption of the first phase of IFRS 9 Financial Instruments: Classification and Measurement by Good Bank will be released in due course.
These illustrative financial statements do not attempt to include every disclosure that banks may need to provide. For instance, it is assumed that the bank does not engage in a portfolio fair value hedge of interest rate risk (in accordance with IAS 39) and so the required disclosures are not given.
This edition of Good Bank (International) Limited reflects professional pronouncements issued as at 31 August 2010.
International Financial Reporting Standards (IFRS) The abbreviation ‘IFRS’ is defined in paragraph 5 of the preface to IFRS to include “the standards and interpretations approved by the International Accounting Standards Board (IASB), and International Accounting Standards (IAS) and Standing Interpretation Committee (SIC) interpretations issued under previous constitutions.” This is also noted in IAS 1.7 and IAS 8.5. Thus, when financial statements are described as complying with IFRS, this means that they comply with the entire hierarchy of pronouncements sanctioned by the IASB including International Accounting Standards, International Financial Reporting Standards and Interpretations originated by the IFRS Interpretations Committee (formerly the International Financial Reporting Interpretations Committee, IFRIC) or the former Standing Interpretations Committee.
For the purposes of this publication, the abbreviation IFRS is used for both reference to IFRS and to the other standards and interpretations approved by the IASB.
Commentary The consolidated financial statements of Good Bank have been prepared in accordance with IFRS as issued by the IASB. Certain entities within the EU are required to adopt IFRS as adopted by the EU. There may be differences between IFRS as issued by the IASB and EU adopted IFRS if at any time new or amended IFRS have not been adopted by the EU. As Goodland is not part of the EU, Good Bank is not required to adopt IFRS as adopted by the EU.
Financial review by management Many entities present a financial review by management that does not form part of the financial statements. The financial review is not an IFRS requirement, although IAS 1.9 gives a brief outline of what it may include. As the content of a financial review by management is often determined by local market requirements or issues specific to a particular jurisdiction, a financial review by management has not been included in the illustrative financial statements of Good Bank.

2
Basis of preparation and presentation The bank’s consolidated annual financial statements are presented to illustrate consolidated (1) annual financial statements produced in accordance with IFRS and, where applicable, interpretations issued by the Interpretations Committee.
Disclosures have not been illustrated for a number of IFRS standards which are either not relevant to the financial services industry or not applicable to the bank’s circumstances. A list of IFRS standards for which disclosures have been illustrated (or, alternatively, within our illustrative financial statements for Good Group) is set out below:
Goo
d B
ank
Goo
d G
roup
IFRS 1 First-time Adoption of International Financial Reporting Standards � �IFRS 2 Share-based Payment �� ��IFRS 3 Business Combinations (2005) for acquisition completed before 1 January 2010 �� ��IFRS 3 Business Combinations (Revised in 2008) � ��IFRS 4 Insurance Contracts � �IFRS 5 Non-current Assets Held for Sale and Discontinued Operations � ��IFRS 6 Exploration for and Evaluation of Mineral Resources � �IFRS 7 Financial Instruments: Disclosures �� ��IFRS 8 Operating Segments �� ��IFRS 9 Financial Instruments: Classification and Measurement(2) � �IAS 1 Presentation of Financial Statements �� ��IAS 2 Inventories � ��IAS 7 Statement of Cash Flows �� ��IAS 8 Accounting Policies, Changes in Accounting Estimates and Errors �� ��IAS 10 Events after the Reporting Period �� ��IAS 11 Construction Contracts � �IAS 12 Income Taxes �� ��IAS 16 Property, Plant and Equipment �� ��IAS 17 Leases �� ��IAS 18 Revenue �� ��IAS 19 Employee Benefits �� ��IAS 20 Accounting for Government Grants and Disclosure of Government Assistance � ��IAS 21 The Effects of Changes in Foreign Exchange Rates �� ��IAS 23 Borrowing Costs � ��IAS 24 Related Party Disclosures �� ��IAS 26 Accounting and Reporting by Retirement Benefit Plans � �IAS 27 Consolidated and Separate Financial Statements (Revised in 2008) �� ��IAS 28 Investments in Associates � ��IAS 29 Financial Reporting in Hyperinflationary Economies IAS 31 Interests in Joint Ventures � ��IAS 32 Financial Instruments: Presentation �� ��IAS 33 Earnings per Share �� ��IAS 34 Interim Financial Reporting � �IAS 36 Impairment of Assets �� ��IAS 37 Provisions, Contingent Liabilities and Contingent Assets �� ��IAS 38 Intangible Assets �� ��IAS 39 Financial Instruments: Recognition and Measurement �� ��IAS 40 Investment Property � ��IAS 41 Agriculture � �
(1) The consolidated financial statements do not include the stand alone disclosures for the parent. In certain jurisdictions, IFRS may apply to the parent entity and hence disclosures should also be made for the parent.
(2) IFRS 9 Financial Instruments: Classification and Measurement is illustrated in the Supplement to Good Bank.

3
Goo
d B
ank
Goo
d G
roup
IFRIC 1 Changes in Existing Decommissioning, Restoration and Similar Liabilities � ��IFRIC 2 Members’ Shares in Co-operative Entities and Similar Instruments � �IFRIC 4 Determining whether an Arrangement Contains a Lease � ��IFRIC 5 Rights to Interests arising from Decommissioning, Restoration and Environmental Rehabilitation
Funds � �
IFRIC 6 Liabilities arising from Participating in a Specific Market – Waste Electrical and Electronic Equipment � ��IFRIC 7 Applying the Restatement Approach under IAS 29 Financial Reporting in Hyperinflationary
Economies � �
IFRIC 9 Reassessment of Embedded Derivatives � ��IFRIC 10 Interim Financial Reporting and Impairment � ��IFRIC 12 Service Concession Arrangements � �IFRIC 13 Customer Loyalty Programmes � ��IFRIC 14 IAS 19 – The Limit on a Defined Benefit Asset, Minimum Funding Requirements and their Interaction �� ��IFRIC 15 Agreements for the Construction of Real Estate � �IFRIC 16 Hedges of a Net Investment in a Foreign Operation � ��IFRIC 17 Distributions of Non-cash Assets to Owners � �IFRIC 18 Transfers of Assets from Customers � �IFRIC 19 Extinguishing Financial Liabilities with Equity Instruments � �SIC 7 Introduction of the Euro � �SIC 10 Government Assistance – No Specific Relation to Operating Activities � �SIC 12 Consolidation – Special Purpose Entities �� ��SIC 13 Jointly Controlled Entities – Non-Monetary Contributions by Venturers � ��SIC 15 Operating Leases – Incentives ��SIC 21 Income Taxes – Recovery of Revalued Non-Depreciable Assets ��SIC 25 Income Taxes – Changes in the Tax Status of an Entity or its Shareholders �SIC 27 Evaluating the Substance of Transactions Involving the Legal Form of a Lease ��SIC 29 Service Concession Arrangements: Disclosures �SIC 31 Revenue – Barter Transactions Involving Advertising Services �SIC 32 Intangible Assets – Web Site Costs �
All standards and interpretations listed above incorporate all amendments effective 1 January 2010, unless otherwise stated.
This set of illustrative statements is one of many prepared by Ernst & Young to assist you in preparing your own financial statements. Refer to:
� Good Group (International) Limited for other non-bank specific disclosures (e.g, investment property)
� Good Investment Fund (International) Limited for disclosures relating to asset management companies
� Good Insurance (International) Limited for illustrative disclosures relating to the insurance industry.
Other model accounts currently available are:
� Good Petroleum
� Good Mining
� Good Real Estate Group (International) Limited
� Good Group (International) Limited - Illustrative interim condensed consolidated financial statements.
Look for other industry specific illustrative financial statements to be added in the future.

4
Abbreviations and key The following styles of abbreviation are used in these International GAAP® Illustrative Financial Statements:
IAS 33.41 International Accounting Standard No. 33, paragraph 41
IAS 1.BC13 International Accounting Standard No. 1, Basis for Conclusions, paragraph 13
IFRS 2.44 International Financial Reporting Standard No. 2, paragraph 44
SIC 29.6 Standing Interpretations Committee Interpretation No. 29, paragraph 6
IFRIC 4.6 IFRS Interpretations Committee (Formerly IFRIC) Interpretation No. 4, paragraph 6
IAS 39.IG.G2 IAS 39 Financial Instruments: Recognition and Measurement – Guidance on Implementing IAS 39 Section G: Other, paragraph G2
IAS 39.AG71 IAS 39 Financial Instruments: Recognition and Measurement – Appendix A – Application Guidance, paragraph AG71
IFRS 7.IG21 IFRS 7 Financial Instruments: Disclosure – Guidance on Implementing, paragraph 21
IFRS 7.BC54 IFRS 7 Financial Instruments: Disclosure – Basis for Conclusions, paragraph 54
IFRS 7.B11 IFRS 7 Financial Instruments: Disclosure – Appendix B – Application Guidance, paragraph B11
IAS 18.Appx14 Appendix to International Accounting Standard No. 18, paragraph 14
GAAP Generally Accepted Accounting Principles/Practice
IASB International Accounting Standards Board
Advisory Panel The IASB Expert Advisory Panel report: Measuring and disclosing the fair value of financial instruments in markets that are no longer active
ED IFRS 7 Interpretations Committee
Exposure Draft: Improving Disclosures about Financial Instruments, Proposed amendments to IFRS 7 IFRS Interpretations Committee (formerly International Financial Reporting Interpretations Committee, IFRIC)

5
Good Bank (International) Limited
Consolidated Financial Statements 31 December 2010

6
General information
Directors T. C. Ford (Chairman)
T.M. Henry (Chief Executive)
S.R. Ividya (CFO)
P. Khatun
C. K. Night
I. Akan
N. Haroon
L. P Viswanathan
G. van Lof
D.W. Stein
Company Secretary D.A. Pacey
Registered Office Currency House 29 Hedge Street Goodville
Solicitors Solicitors & Co. 7 Scott Street Goodville
Auditors Chartered Accountants & Co. 17 Goodville Square Goodville
7
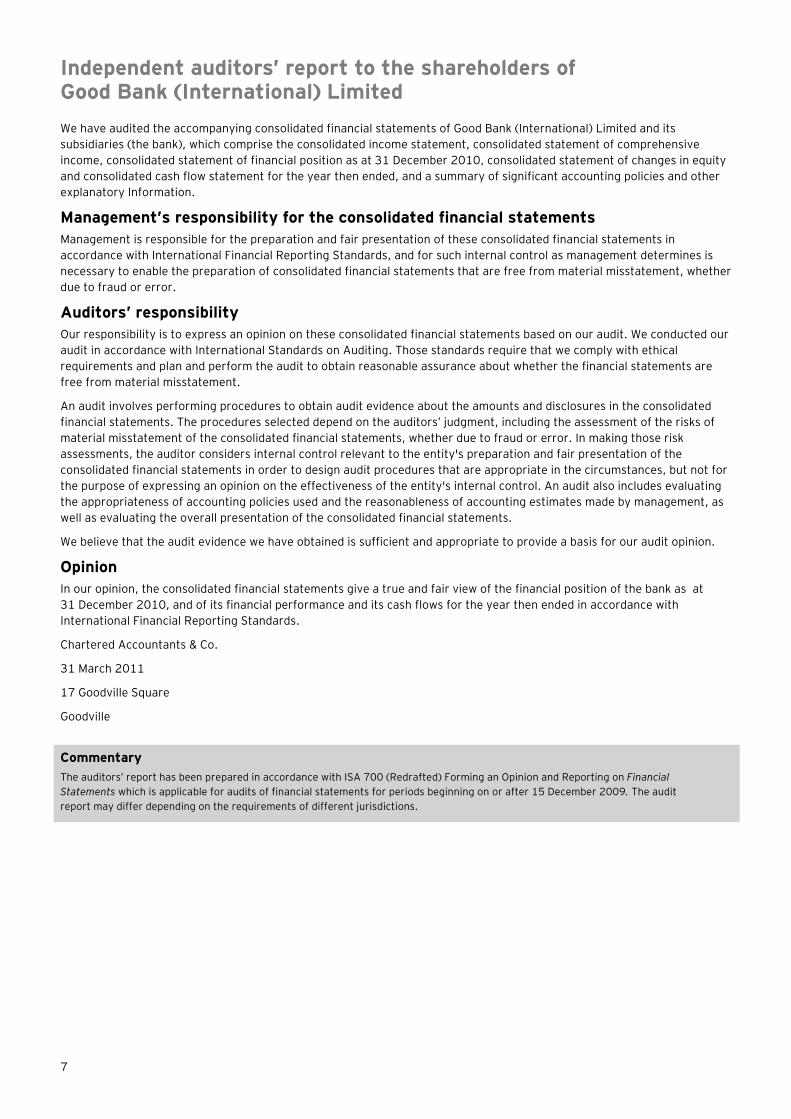
Independent auditors’ report to the shareholders of Good Bank (International) Limited We have audited the accompanying consolidated financial statements of Good Bank (International) Limited and its subsidiaries (the bank), which comprise the consolidated income statement, consolidated statement of comprehensive income, consolidated statement of financial position as at 31 December 2010, consolidated statement of changes in equity and consolidated cash flow statement for the year then ended, and a summary of significant accounting policies and other explanatory Information.
Management’s responsibility for the consolidated financial statements Management is responsible for the preparation and fair presentation of these consolidated financial statements in accordance with International Financial Reporting Standards, and for such internal control as management determines is necessary to enable the preparation of consolidated financial statements that are free from material misstatement, whether due to fraud or error.
Auditors’ responsibility Our responsibility is to express an opinion on these consolidated financial statements based on our audit. We conducted our audit in accordance with International Standards on Auditing. Those standards require that we comply with ethical requirements and plan and perform the audit to obtain reasonable assurance about whether the financial statements are free from material misstatement.
An audit involves performing procedures to obtain audit evidence about the amounts and disclosures in the consolidated financial statements. The procedures selected depend on the auditors’ judgment, including the assessment of the risks of material misstatement of the consolidated financial statements, whether due to fraud or error. In making those risk assessments, the auditor considers internal control relevant to the entity's preparation and fair presentation of the consolidated financial statements in order to design audit procedures that are appropriate in the circumstances, but not for the purpose of expressing an opinion on the effectiveness of the entity's internal control. An audit also includes evaluating the appropriateness of accounting policies used and the reasonableness of accounting estimates made by management, as well as evaluating the overall presentation of the consolidated financial statements.
We believe that the audit evidence we have obtained is sufficient and appropriate to provide a basis for our audit opinion.
Opinion In our opinion, the consolidated financial statements give a true and fair view of the financial position of the bank as at 31 December 2010, and of its financial performance and its cash flows for the year then ended in accordance with International Financial Reporting Standards.
Chartered Accountants & Co.
31 March 2011
17 Goodville Square
Goodville
Commentary The auditors’ report has been prepared in accordance with ISA 700 (Redrafted) Forming an Opinion and Reporting on Financial Statements which is applicable for audits of financial statements for periods beginning on or after 15 December 2009. The audit report may differ depending on the requirements of different jurisdictions.

8
Consolidated income statement
for the year ended 31 December 2010
IAS 1.9(b), IAS 1.51(c),(d),(e) IAS 1.29, IAS 1.32
2010 2009 IAS 8.28
Notes $ million $ million IAS 1.46, IAS 1.45
IAS 1.104
Interest and similar income 4 4,748 4,655 IFRS 7.20(b)
Interest and similar expense 5 (2,001) (1,982) IFRS 7.20(b), IAS 1.82(b)
Net interest income 2,747 2,673
Fee and commission income 6 1,277 1,215 IFRS 7.20(c)(i)
Fee and commission expense 6 (133) (110) IFRS 7.20(c)(i)
Net fee and commission income 6 1,144 1,105
Net trading income 7 387 346 IFRS 7.20(a)(i)
Net loss on financial assets and liabilities designated at fair value through profit or loss 8 (37) (10) IFRS 7.20(a)(i)
Other operating income 9 92 82 IFRS 7.20(a)
Total operating income 4,333 4,196 IAS 1.85
Credit loss expense 10 (667) (910) IFRS 7.20(e)
Impairment losses on financial investments 11 (60) (110) IFRS 7.20(e)
Net operating income 3,606 3,176 IAS 1.82(a)
Personnel expenses 12 1,204 1,200 IAS 1.99
Depreciation of property and equipment 27 103 106 IAS 1.99
Amortisation of intangible assets 28 37 35 IAS 38.118(d)
Other operating expenses 13 972 958 IAS 1.99
Total operating expenses 2,316 2,299 IAS 1.85
Profit before tax 1,290 877 IAS 1.85
Income tax expense 14 368 223 IAS 1.82(d), IAS 12.77
Profit for the year 922 654 IAS 1.82(f)
Attributable to:
Equity holders of the parent 913 647 IAS 1.83(a)
Non Controlling Interest 9 7 IAS 1.83(a), IAS 27.33
922 654
Earnings per share Equity shareholders of the parent for the year:
$ $
Basic earnings per share 15 1.353 1.009 IAS 33.66
Diluted earnings per share 15 1.330 1.004 IAS 33.66
Commentary IAS 1.86 requires expenses to be analysed by their nature or by their function within the entity, whichever provides information that is reliable and more relevant. The bank has presented the analysis of expenses by nature.
9
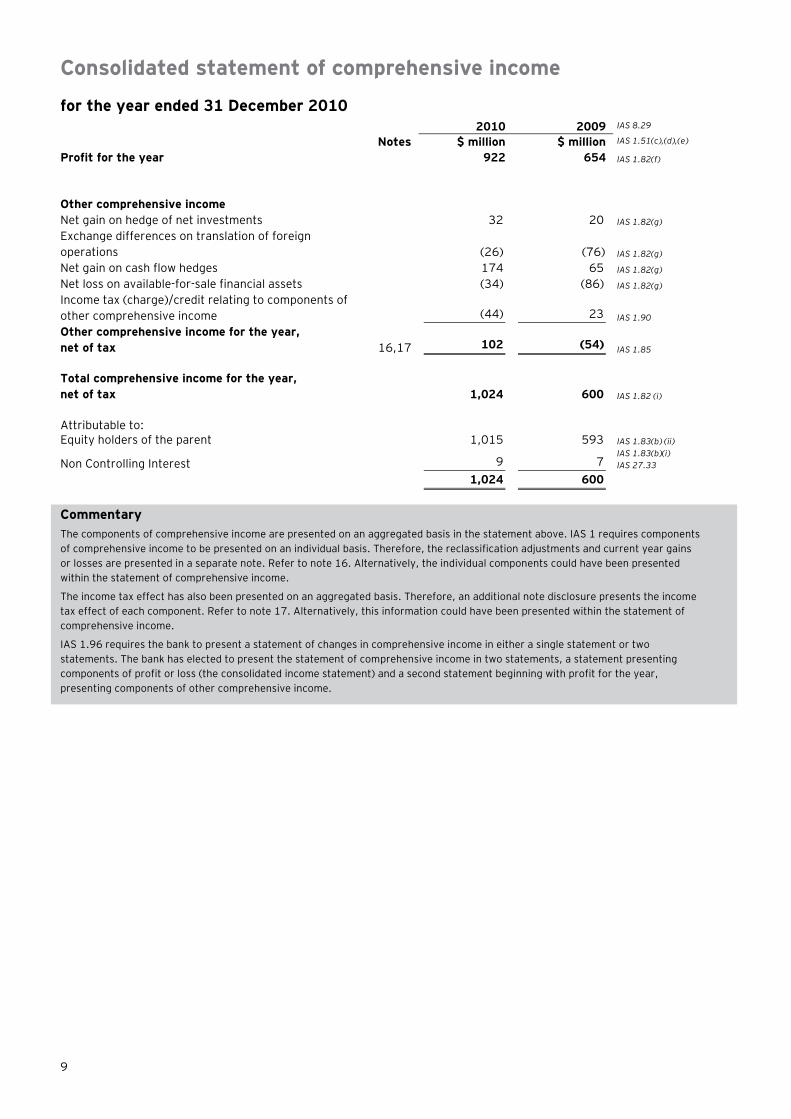
Consolidated statement of comprehensive income
for the year ended 31 December 2010 2010 2009 IAS 8.29
Notes $ million $ million IAS 1.51(c),(d),(e)
Profit for the year 922 654 IAS 1.82(f)
Other comprehensive income
Net gain on hedge of net investments 32 20 IAS 1.82(g)
Exchange differences on translation of foreign operations (26) (76) IAS 1.82(g)
Net gain on cash flow hedges 174 65 IAS 1.82(g)
Net loss on available-for-sale financial assets (34) (86) IAS 1.82(g)
Income tax (charge)/credit relating to components of other comprehensive income (44) 23 IAS 1.90
Other comprehensive income for the year, net of tax 16,17 102 (54) IAS 1.85
Total comprehensive income for the year, net of tax 1,024 600 IAS 1.82 (i)
Attributable to:
Equity holders of the parent 1,015 593 IAS 1.83(b) (ii)
Non Controlling Interest 9 7 IAS 1.83(b)(i) IAS 27.33
1,024 600
Commentary The components of comprehensive income are presented on an aggregated basis in the statement above. IAS 1 requires components of comprehensive income to be presented on an individual basis. Therefore, the reclassification adjustments and current year gains or losses are presented in a separate note. Refer to note 16. Alternatively, the individual components could have been presented within the statement of comprehensive income.
The income tax effect has also been presented on an aggregated basis. Therefore, an additional note disclosure presents the income tax effect of each component. Refer to note 17. Alternatively, this information could have been presented within the statement of comprehensive income.
IAS 1.96 requires the bank to present a statement of changes in comprehensive income in either a single statement or two statements. The bank has elected to present the statement of comprehensive income in two statements, a statement presenting components of profit or loss (the consolidated income statement) and a second statement beginning with profit for the year, presenting components of other comprehensive income.

1 0
Consolidated statement of financial position
as at 31 December 2010
IAS 1.9(a), IAS 51(c),(d),(e) IAS 1.29, IAS 1.32
2010 2009 IAS 1.54
Notes $ million $ million IAS 1.51(d),(e)
Assets
Cash and balances with central banks 19 2,750 2,702 IAS 1.54(i)
Due from banks 20 10,604 10,489 IAS 1.54(d), IFRS 7.8(c)
Cash collateral on securities borrowed and reverse repurchase agreements
21 7,628 7,673 IAS 1.54(d), IFRS 7.8(c )
Derivative financial instruments 22 7,473 7,144 IAS 1.54(d), IFRS 7.8(a)
Other financial assets held-for-trading 23 6,392 6,365 IAS 1.54(d), IFRS 7.8(a)
Financial assets held-for-trading pledged as collateral 21,23 4,020 4,003 IAS 1.54(d), IAS 39.37(a)
Financial assets designated at fair value through profit or loss 23 1,266 1,241 IAS 1.54(d), IFRS 7.8(a)
Loans and advances to customers 24 47,924 47,163 IAS 1.54(d), IFRS 7.8(c)
Financial investments – available-for-sale 25 8,148 8,316 IAS 1.54(d), IFRS 7.8(d)
Financial investments – available-for-sale pledged as collateral
21,25 3,919 3,988 IAS 1.54(d), IAS 39.37(a)
Financial investments – held-to-maturity 25 141 127 IAS 1.54(d), IFRS 7.8(b)
Other assets 26 1,018 1,003 IAS 1.55
Property and equipment 27 990 1,006 IAS 1.54(a)
Goodwill and other intangible assets 28 58 78 IAS 1.54(c)
Deferred tax assets 14 257 237 IAS 1.54(n), IAS 1.70
Total assets 102,588 101,535
Liabilities and equity
Due to banks 29 3,222 3,174 IAS 1.54(m), IFRS 7.8(f)
Cash collateral on securities lent and repurchase agreements
21 15,169 15,214 IAS 1.54(m)
Derivative financial instruments 22 8,065 7,826 IAS 1.54(m), IFRS 7.8(e)
Other financial liabilities held-for-trading 23 4,160 4,078 IAS 1.54(m), IFRS 7.8(e)
Financial liabilities designated at fair value through profit or loss
23 3,620 3,549 IAS 1.54(m), IFRS 7.8(e)
Due to customers 30 53,143 53,177 IAS 1.54(m), IFRS 7.8(f)
Debt issued and other borrowed funds 31 5,310 5,179 IAS 1.54(m), IFRS 7.8(f)
Current tax liabilities 137 160 IAS 1.54(m)
Other liabilities 32 2,072 2,032 IAS 1.54(n), IAS 1.70
Provisions 33 86 76 IAS 1.54(k)
Deferred tax liabilities 14 505 546 IAS 1.55
Total liabilities 95,489 95,011
Equity attributable to equity holders of parent
Issued capital 35 675 675 IAS 1.78(e), IAS 1.79
Treasury shares 35 (22) (19) IAS 1.7, IAS 32.33
Share premium 1,160 1,160 IAS 1.7
Retained earnings 4,479 4,011 IAS 1.7
Available-for-sale reserve 35 152 176 IAS 1.7
Cash flow hedge reserve 35 450 328 IAS 1.7
Foreign currency translation reserve 35 55 51 IAS 1.7
Other capital reserve 35 102 102 IAS 1.7
7,051 6,484
Non Controlling Interest 48 40 IAS 27.33
Total equity 7,099 6,524
Total liabilities and equity 102,588 101,535
Commentary IAS 1.60 requires entities to present assets and liabilities in order of their liquidity (rather than split between current and non-current) when this presentation is reliable and more relevant, as will usually be the case for a bank. It is not necessary to show each category of financial instrument on the face of the statement of financial position. This information may be shown in the notes to the financial statements. The bank has not provided a restated comparative set of financial position for the earliest comparative period, as it has not adopted any new accounting policies retrospectively, or has made a retrospective restatement, or retrospectively reclassified items in the financial statements.

1 1
Consolidated statement of changes in equity
for the year ended 31 December 2010 Attributable to equity holders of the parent
IAS 1.51 (a), (b), (c)
Issued capital
Share premium
Treasury shares
Retained earnings
Other reserves
(Note 35) Total
Non Controlling
Interest Total
equity
IAS 8.28 IAS 1.106
$ million $ million $ million $ million $ million $ million $ million $ million IAS 1.51(d),(e)
At 1 January 2009
642 1,135 (15) 3,779 711 6,252 34 6,386 IAS 1.106(d)
Total comprehensive income – – – 647 (54) 593 7 600 IAS 1.106(a)
Issue of share capital 33 – – – – 33 – 33
Share-based payments – 25 – 3 – 28 – 28 IFRS 2.50
Dividends – – – (418) – (418) – (418) IAS 1.107
Net purchase of treasury shares – – (4) – – (4) – (4)
Dividends of subsidiaries – – – – – – (1) (1)
At 31 December 2009 675 1,160 (19) 4,011 657 6,484 40 6,524
Total comprehensive income – – – 913 102 1,015 9 1,024 IAS 1.106(a)
Share-based payments – – – 7 – 7 – 7 IFRS 2.50
Dividends – – – (452) – (452) – (452) IAS 1.107
Net purchase of treasury shares – – (3) – – (3) – (3)
Dividends of subsidiaries – – – – – – (1) (1)
At 31 December 2010 675 1,160 (22) 4,479 759 7,051 48 7,099

1 2
Consolidated statement of cash flows
for the year ended 31 December 2010
IAS 1.10(d) IAS 7.10 IAS 7.18(b)
2010 2009
Notes $ million $ million IAS 1.51(d),(e)
IAS 7.25
Operating activities
Profit before tax 1,290 877
Adjustments for:
Change in operating assets 39 (495) (2,302) IAS 7.20(a)
Change in operating liabilities 39 430 2,106 IAS 7.20(a)
Non-cash items included in profit before tax 39 140 141 IAS 7.20(b)
Net loss from investing activities 154 208 IAS 7.20(c)
Income tax paid (391) (303) IAS 7.35
Net cash flows from operating activities 1,128 727
Investing activities IAS 7.21, IAS 7.43
Purchase of property and equipment 27 (99) (90) IAS 7.16(a)
Proceeds from sale of property and equipment 18 15 IAS 7.16(b)
Purchase of intangible assets 28 (15) (16) IAS 7.16(a)
Purchase of financial investments (3,285) (3,010) IAS 7.16(c)
Proceeds from sale of financial investments 3,401 2,603 IAS 7.16(d)
Net cash flows from/(used in) investing activities 20 (498)
Financing activities IAS 7.21, IAS 7.43
Proceeds from exercise of options - 33 IAS 7.17(a)
Purchase of treasury shares 35 (5) (7) IAS 7.17(b)
Proceeds from sale of treasury shares 35 2 3 IAS 7.17(a)
Dividends paid to equity holders of the parent 18 (452) (418) IAS 7.31, IAS 7.34
Net cash flows used in financing activities (455) (389)
Net increase in cash and cash equivalents 693 (160)
Net foreign exchange difference (116) 24 IAS 7.28
Cash and cash equivalents at 1 January 4,121 4,257
Cash and cash equivalents at 31 December 39 4,698 4,121 IAS 7.45
Operational cash flows from interest and dividends
Interest paid 2,101 2,005 IAS 7.31
Interest received 4,520 4,431 IAS 7.31
Dividend received 15 13 IAS 7.31
Commentary IAS 7.18 allows entities to report cash flows from operating activities using either the direct method (in which the major classes of gross cash payments and receipts are disclosed) or the indirect method whereby the profit or loss is adjusted to derive the cash flow from operating activities). The bank presents its cash flows using the indirect method.
IAS 7.31 requires the cash flows from interest and dividends received and paid to be disclosed separately. These disclosures are included in a separate table because, for a bank, reporting its cash flow statement using the indirect method, most of these cash flows are part of the cash flows from operating activities.
IAS 7 does not specify which profit or loss figure should be used in the indirect method. Good Bank (International) Limited has reconciled from profit before tax to the net cash flow from operating activities. However, use of alternative profit or loss subtotals would be permissible.

1 3
Notes to the consolidated financial statements IAS 1.10(e) IAS 1.112 IAS 1.113
1. Corporate information IAS 1.10(e) IAS 1.112 IAS 1.113
Good Bank (International) Limited (Good Bank) together with its subsidiaries (the bank) provides retail, corporate banking, investment banking and asset management services in various parts of the world. Good Bank is the ultimate parent of the group. The principal activities of the bank are described in Note 3.
IAS 1.138(b)
Good Bank is a limited liability company incorporated and domiciled in Goodland. Its registered office is at Currency House, 29 Hedge Street, Goodville, Goodland. The bank has a primary listing on the Goodland Stock Exchange.
IAS 1.138(a)
The consolidated financial statements for the year ended 31 December 2010 were authorised for issue in accordance with a resolution of the directors on 31 March 2011.
IAS 10.17
Commentary The accounting policies of Good Bank are for illustrative purposes. In practice, the disclosure will need to be more detailed and tailored to the bank’s specific policies.
2. Accounting policies IAS 1.10(e)
2.1 Basis of preparation
The consolidated financial statements have been prepared on a historical cost basis, except for available–for–sale investments, derivative financial instruments, other financial assets and liabilities held for trading, financial assets and liabilities designated at fair value through profit or loss and liabilities for cash–settled share–based payments, which have all been measured at fair value. The carrying values of recognised assets and liabilities that are hedged items in fair value hedges, and otherwise carried at amortised cost, are adjusted to record changes in fair value attributable to the risks that are being hedged. The consolidated financial statements are presented in Goodland dollars ($) and all values are rounded to the nearest million dollars, except when otherwise indicated.
IAS 1.112(a) IAS 1.117(a),(b) IAS 1.51(d),(e)
Statement of compliance
The consolidated financial statements of the bank have been prepared in accordance with IFRS as issued by the IASB.
IAS 1.6
Presentation of financial statements
The bank presents its statement of financial position broadly in order of liquidity. An analysis regarding recovery or settlement within 12 months after the statement of financial position date (current) and more than 12 months after the statement of financial position date (non–current) is presented in note 40.
IAS 1.60, 61
Financial assets and financial liabilities are offset and the net amount reported in the statement of financial position only when there is a legally enforceable right to offset the recognised amounts and there is an intention to settle on a net basis, or to realise the assets and settle the liability simultaneously. Income and expense is not offset in the consolidated income statement unless required or permitted by any accounting standard or interpretation, and as specifically disclosed in the accounting policies of the bank.
IAS 32.42 IAS 1.32
Basis of consolidation IAS 27.12
The consolidated financial statements comprise the financial statements of the bank and its subsidiaries for the year ended 31 December. The financial statements of the bank’s subsidiaries (including special purpose entities that the bank consolidates) are prepared for the same reporting year as Good Bank, using consistent accounting policies
IAS 27.22 IAS 27.24
All intra–group balances, transactions, income and expenses are eliminated in full. IAS 27.20 IAS 27.21
Subsidiaries are fully consolidated from the date on which control is transferred to the bank. Control is achieved where the bank has the power to govern the financial and operating policies of an entity so as to obtain benefits from its activities. Losses within a subsidiary are attributed to the non-controlling interest even if that results in a deficit balance.
The bank sponsors the formation of special purpose entities (SPEs), primarily for the purpose of facilitation of investments by the bank’s clients, asset securitisation transactions, structured debt issuance, and to accomplish certain narrow and well defined objectives. The bank consolidates those SPEs if the substance of its relationship with them indicates that it has control over them.
IAS 27.26
IAS 27.24 SIC 12.10
Notes to the consolidated financial statements
1 4
2. Accounting policies (cont’d)
2.1 Basis of preparation (cont’d)
Basis of consolidation (cont’d) IAS 27.12
Non-controlling Interests represent the portion of profit or loss and net assets of subsidiaries not owned, directly or indirectly, by Good Bank.
Non-controlling interests are presented separately in the consolidated income statement and within equity in the consolidated statement of financial position, separately from parent shareholders’ equity. Any losses applicable to the non-controlling Interests in excess of the non-controlling Interests are allocated against the interests of the non-controlling interest even if this results in the non-controlling interest having a deficit balance. Acquisitions of non-controlling Interests are accounted for using the parent entity extension method, whereby the difference between the consideration and the fair value of the share of the net assets acquired is recognised as equity.
IAS 27.27 IAS 27.28 IAS 27.30
2.2 Significant accounting judgments, estimates and assumptions
In the process of applying the bank's accounting policies, management has exercised judgment and estimates in determining the amounts recognised in the financial statements. The most significant uses of judgment and estimates are as follows:
IAS 1.122 IAS 1.125
Going concern
The bank’s management has made an assessment of the bank’s ability to continue as a going concern and is satisfied that the bank has the resources to continue in business for the foreseeable future. Furthermore, management is not aware of any material uncertainties that may cast significant doubt upon the bank’s ability to continue as a going concern. Therefore, the financial statements continue to be prepared on the going concern basis.
IAS 1.25–26 IAS 10.14–16
Fair value of financial instruments
Where the fair values of financial assets and financial liabilities recorded on the statement of financial position cannot be derived from active markets, they are determined using a variety of valuation techniques that include the use of mathematical models. The inputs to these models are derived from observable market data where possible, but where observable market data are not available, judgment is required to establish fair values. The judgments include considerations of liquidity and model inputs such as volatility for longer dated derivatives and discount rates, prepayment rates and default rate assumptions for asset backed securities. The valuation of financial instruments is described in more detail in Note 36.
IAS 39.AG74
Impairment losses on loans and advances
The bank reviews its individually significant loans and advances at each statement of financial position date to assess whether an impairment loss should be recorded in the income statement. In particular, management judgment is required in the estimation of the amount and timing of future cash flows when determining the impairment loss. These estimates are based on assumptions about a number of factors and actual results may differ, resulting in future changes to the allowance.
Loans and advances that have been assessed individually and found not to be impaired and all individually insignificant loans and advances are then assessed collectively, in groups of assets with similar risk characteristics, to determine whether provision should be made due to incurred loss events for which there is objective evidence but whose effects are not yet evident. The collective assessment takes account of data from the loan portfolio (such as levels of arrears, credit utilisation, loan to collateral ratios, etc.), and judgments to the effect of concentrations of risks and economic data (including levels of unemployment, real estate prices indices, country risk and the performance of different individual groups).
The impairment loss on loans and advances is disclosed in more detail in Note 10 and Note 24.
IAS 39.59
Impairment of available–for–sale investments
The bank reviews its debt securities classified as available–for–sale investments at each statement of financial position date to assess whether they are impaired. This requires similar judgment as applied to the individual assessment of loans and advances.
The bank also records impairment charges on available–for–sale equity investments when there has been a significant or prolonged decline in the fair value below their cost. The determination of what is ‘significant’ or ‘prolonged’ requires judgment. In making this judgment, the bank evaluates, among other factors, historical share price movements and duration and extent to which the fair value of an investment is less than its cost.
IAS 39.61

Notes to the consolidated financial statements
1 5
2. Accounting policies (cont’d) 2.2 Significant accounting judgments, estimates and assumptions (cont’d)
Deferred tax assets
Deferred tax assets are recognised in respect of tax losses to the extent that it is probable that taxable profit will be available against which the losses can be utilised. Judgment is required to determine the amount of deferred tax assets that can be recognised, based upon the likely timing and level of future taxable profits, together with future tax planning strategies.
IAS 12.34
Consolidation of special purpose entities (SPEs)
The bank sponsors the formation of SPEs, which may or may not be directly or indirectly owned subsidiaries. The bank consolidates those SPEs it controls. In assessing and determining if the bank controls SPEs, judgment is exercised to determine whether the activities of the SPE are being conducted on behalf of the bank to obtain benefits from the SPE’s operation; whether the bank has the decision–making powers to control or to obtain control of the SPE or its assets; whether the bank has rights to obtain the majority of the benefits of the SPE’s activities; and whether the bank retains the majority of the risks related to the SPE or its assets in order to obtain benefits from its activities. The bank’s involvement with SPEs is detailed in Note 37.
SIC 12.10
Pensions obligation
The cost of the defined benefit pension plan is determined using an actuarial valuation. The actuarial valuation involves making assumptions about discount rates, expected rates of return on assets, future salary increases, mortality rates and future pension increases. Due to the long–term nature of these plans, such estimates are subject to significant uncertainty. See Note 34 for the assumptions used.
IAS 19.63
2.3 Changes in accounting policy and disclosures
New and amended standards and interpretations
The accounting policies adopted are consistent with those of the previous financial year.
Amendments resulting from Improvements to IFRSs to the following standards did not have any impact on the accounting policies, financial position or performance of the Bank: � IFRS 2 Share-based payment: Group Cash-settled Share-based Payment Transactions effective 1 January 2010 � IFRS 3 Business Combinations (Revised) and IAS 27 Consolidated and Separate Financial Statements
(Amended) effective 1 July 2009, including consequential amendments to IFRS 2, IFRS 5, IFRS 7, IAS 7, IAS 21, IAS 28, IAS 31 and IAS 39
� IAS 39 Financial Instruments: Recognition and Measurement – Eligible Hedged Items effective 1 July 2009 � IFRIC 17 Distributions of Non-cash Assets to Owners effective 1 July 2009 Improvements to IFRSs Issued in May 2008 � IFRS 5 Non-current Assets Held for Sale and Discontinued Operations effective 1 January 2010 Issued in April 2009 � IFRS 2 Share-based Payment � IAS 1 Presentation of Financial Statements � IAS 17 Leases � IAS 38 Intangible Assets � IAS 39 Financial Instruments: Recognition and Measurement � IFRIC 9 Reassessment of Embedded Derivatives
Commentary In some jurisdictions, the adoption of IFRS for reporting purposes may be subject to a specific legal process (e.g., in the European Union or Australia). In those jurisdictions, the effective dates may therefore be different from the IASB's effective date. Nevertheless, all new standards and interpretations must be considered for disclosure, irrespective of whether the legal process referred to above has been completed. 2.4 Summary of significant accounting policies
(1) Foreign currency translation
The consolidated financial statements are presented in Goodland dollars ($). Each entity in the group determines its own functional currency and items included in the financial statements of each entity are measured using that functional currency.

Notes to the consolidated financial statements
1 6
2. Accounting policies (cont’d)
2.4 Summary of significant accounting policies (cont’d)
(1) Foreign currency translation (cont’d)
(i) Transactions and balances
Transactions in foreign currencies are initially recorded at the functional currency rate of exchange ruling at the date of the transaction.
IAS 21.21
Monetary assets and liabilities denominated in foreign currencies are retranslated at the functional currency rate of exchange at the statement of financial position date. All differences arising on non–trading activities are taken to ‘Other operating income’ in the income statement, with the exception of differences on foreign currency borrowings that provide an effective hedge against a net investment in a foreign entity. These differences are taken directly to equity until the disposal of the net investment, at which time they are recognised in the income statement. Tax charges and credits attributable to exchange differences on those borrowings are also recorded in equity.
IAS 21.23(a) IAS 21.28 IAS 39.102
Non–monetary items that are measured in terms of historical cost in a foreign currency are translated using the exchange rates as at the dates of the initial transactions. Non–monetary items measured at fair value in a foreign currency are translated using the exchange rates at the date when the fair value was determined. Any goodwill arising on the acquisition of a foreign operation and any fair value adjustments to the carrying amounts of assets and liabilities arising on the acquisition are treated as assets and liabilities of the foreign operations and translated at closing rate.
IAS 21.32 IAS 21.23(b) IAS 21.23(c)
(ii) Group companies
As at the reporting date, the assets and liabilities of subsidiaries and overseas branches are translated into the bank’s presentation currency at the rate of exchange as at the statement of financial position date, and their income statements are translated at the weighted average exchange rates for the year. Exchange differences arising on translation are taken directly to a separate component of equity. On disposal of a foreign entity, the deferred cumulative amount recognised in equity relating to that particular foreign operation is recognised in the income statement in ‘Other operating expenses’ or ‘Other operating income’.
IAS 21.39 IAS 21.48
(2) Financial instruments – initial recognition and subsequent measurement IFRS 7.21
(i) Date of recognition
All financial assets and liabilities are initially recognised on the trade date, i.e., the date that the bank becomes a party to the contractual provisions of the instrument. This includes “regular way trades”: purchases or sales of financial assets that require delivery of assets within the time frame generally established by regulation or convention in the market place.
IAS 39.38 IFRS 7.B5(c) IAS 39.14
(ii) Initial measurement of financial instruments
The classification of financial instruments at initial recognition depends on the purpose and the management’s intention for which the financial instruments were acquired and their characteristics. All financial instruments are measured initially at their fair value plus transaction costs, except in the case of financial assets and financial liabilities recorded at fair value through profit or loss.
IAS 39.9 IAS 39.43
(iii) Derivatives recorded at fair value through profit or loss
The bank uses derivatives such as interest rate swaps and futures, credit default swaps, cross currency swaps, forward foreign exchange contracts and options on interest rates, foreign currencies and equities. Derivatives are recorded at fair value and carried as assets when their fair value is positive and as liabilities when their fair value is negative. Changes in the fair value of derivatives are included in ‘Net trading income’.
IAS 39.46 IAS 39.47(a) IAS 39.55(a)
Derivatives embedded in other financial instruments, such as the conversion option in an acquired convertible bond, are treated as separate derivatives and recorded at fair value if their economic characteristics and risks are not closely related to those of the host contract, and the host contract is not itself held–for–trading or designated at fair value through profit or loss. The embedded derivatives separated from the host are carried at fair value in the trading portfolio with changes in fair value recognised in the income statement.
IAS 39.10 IAS 39.11
Notes to the consolidated financial statements
1 7
2. Accounting policies (cont’d) 2.4 Summary of significant accounting policies (cont’d) (2) Financial instruments – initial recognition and subsequent measurement (cont’d) IFRS 7.21
(iv) Financial assets or financial liabilities held–for–trading IAS 39.9 IAS 39.45(a)
Financial assets or financial liabilities held–for–trading are recorded in the statement of financial position at fair value. Changes in fair value are recognised in ‘Net trading income’. Interest and dividend income or expense is recorded in ‘Net trading income’ according to the terms of the contract, or when the right to the payment has been established.
Included in this classification are debt securities, equities and short positions and customer loans that have been acquired principally for the purpose of selling or repurchasing in the near term.
IAS 39.46 IAS 39.47(a) IAS 39.55 IAS 18.30(c) IAS 39.AG14
(v) Financial assets and financial liabilities designated at fair value through profit or loss IAS 39.9 IAS 39.45(a)
Financial assets and financial liabilities classified in this category are those that have been designated by management on initial recognition. Management may only designate an instrument at fair value through profit or loss upon initial recognition when the following criteria are met, and designation is determined on an instrument by instrument basis:
� The designation eliminates or significantly reduces the inconsistent treatment that would otherwise arise from measuring the assets or liabilities or recognising gains or losses on them on a different basis.
IAS 39.AG4D–4G
� The assets and liabilities are part of a group of financial assets, financial liabilities or both which are managed and their performance evaluated on a fair value basis, in accordance with a documented risk management or investment strategy.
IAS 39.AG4H–4K
� The financial instrument contains one or more embedded derivatives which significantly modify the cash flows that otherwise would be required by the contract.
IAS 39.11A
Financial assets and financial liabilities at fair value through profit or loss are recorded in the statement of financial position at fair value. Changes in fair value are recorded in ‘Net gain or loss on financial assets and liabilities designated at fair value through profit or loss’. Interest is earned or incurred is accrued in ‘Interest income’ or ‘Interest expense’, respectively, using the effective interest rate (EIR), while dividend income is recorded in ‘Other operating income’ when the right to the payment has been established.
Included in this classification are loans and advances to customers which are economically hedged by credit derivatives and do not qualify for hedge accounting, as well as notes issued which are managed on a fair value basis.
IAS 39.46 IAS 39.47(a) IAS 39.55(a) IAS 18.30(c) IFRS 7.B5(e)
Commentary There are no specific requirements in IFRS as to where in the income statement the interest on financial instruments recorded at fair value through profit or loss should be recorded. Possibilities include both ‘Interest and similar income or expense’ and ‘Net trading income’ (or ‘Net gain or loss on financial assets and liabilities designated at fair value through profit or loss’). IFRS 7 does require the location to be disclosed. To illustrate the two approaches, interest on trading activities is recorded by Good Bank in ‘Net trading income’, while interest earned or incurred from financial assets and financial liabilities designated at fair value through profit or loss is recorded in ‘Interest and similar income or expense’.
In the case of interest on trading activities, the interest has been recorded on a simple accruals basis as there is no requirement to apply an EIR for items in this category. However, if the interest is recorded in ‘Interest and similar income or expense’, the interest should be recorded based on the EIR. (vi) ‘Day 1’ profit or loss IAS 39.AG76A
When the transaction price differs from the fair value of other observable current market transactions in the same instrument or based on a valuation technique whose variables include only data from observable markets, the bank immediately recognises the difference between the transaction price and fair value (a ‘Day 1’ profit or loss) in ‘Net trading income’. In cases where fair value is determined using data which is not observable, the difference between the transaction price and model value is only recognised in the income statement when the inputs become observable, or when the instrument is derecognised.
IFRS 7.28(a)
Commentary Day 1 profit or loss may only be recognised to the extent that it arises from a change in a factor (including time) that market participants would consider in setting a price. Good Bank’s accounting policy is to recognise Day 1 profit or loss only when the inputs become observable, or when the instrument is derecognised. In practice, many banks also amortise the difference over time on an appropriate basis.
Notes to the consolidated financial statements
1 8
2. Accounting policies (cont’d) 2.4 Summary of significant accounting policies (cont’d) (2) Financial instruments – initial recognition and subsequent measurement (cont’d) IFRS 7.21
(vii) Available–for–sale financial investments IAS 39.9 IAS 39.45(d)
Available–for–sale investments include equity and debt securities. Equity investments classified as available–for –sale are those which are neither classified as held–for–trading nor designated at fair value through profit or loss. Debt securities in this category are those which are intended to be held for an indefinite period of time and which may be sold in response to needs for liquidity or in response to changes in the market conditions.
The bank has not designated any loans or receivables as available–for–sale.
After initial measurement, available–for–sale financial investments are subsequently measured at fair value.
IFRS 7.B5(b)
Unrealised gains and losses are recognised directly in equity (other comprehensive income) in the ‘Available–for–sale reserve’. When the investment is disposed of, the cumulative gain or loss previously recognised in equity is recognised in the income statement in ‘Other operating income’. Where the bank holds more than one investment in the same security they are deemed to be disposed of on a first–in first–out basis. Interest earned whilst holding available–for–sale financial investments is reported as interest income using the EIR. Dividends earned whilst holding available–for–sale financial investments are recognised in the income statement as ‘Other operating income’ when the right of the payment has been established. The losses arising from impairment of such investments are recognised in the income statement in ‘Impairment losses on financial investments’ and removed from the ‘Available–for–sale reserve’.
IAS 39.46 IAS 39.55(b) IAS 39.AG5–8 IAS 18.30(a),(c)
(viii) Held–to–maturity financial investments IAS 39.9 IAS 39.45(b)
Held–to–maturity financial investments are non–derivative financial assets with fixed or determinable payments and fixed maturities, which the bank has the intention and ability to hold to maturity. After initial measurement, held–to–maturity financial investments are subsequently measured at amortised cost using the EIR, less impairment. Amortised cost is calculated by taking into account any discount or premium on acquisition and fees that are an integral part of the EIR. The amortisation is included in ‘Interest and similar income’ in the income statement. The losses arising from impairment of such investments are recognised in the income statement line ‘Credit loss expense’.
If the bank were to sell or reclassify more than an insignificant amount of held–to–maturity investments before maturity (other than in certain specific circumstances), the entire category would be tainted and would have to be reclassified as available–for–sale. Furthermore, the bank would be prohibited from classifying any financial asset as held to maturity during the following two years.
IAS 39.46(b) IAS 39.AG5–8 IAS 39.56
IAS 39.9
(ix) Due from banks and loans and advances to customers IAS 39.9 IAS 39.45(c)
‘Due from banks’ and ‘Loans and advances to customers’, include non–derivative financial assets with fixed or determinable payments that are not quoted in an active market, other than:
� Those that the bank intends to sell immediately or in the near term and those that the bank upon initial recognition designates as at fair value through profit or loss.
� Those that the bank, upon initial recognition, designates as available for sale.
� Those for which the bank may not recover substantially all of its initial investment, other than because of credit deterioration.
IAS 39.46(a)
After initial measurement, amounts ‘Due from banks’ and ‘Loans and advances to customers' are subsequently measured at amortised cost using the EIR, less allowance for impairment. Amortised cost is calculated by taking into account any discount or premium on acquisition and fees and costs that are an integral part of the EIR. The amortisation is included in ‘Interest and similar income’ in the income statement. The losses arising from impairment are recognised in the income statement in ‘Credit loss expense’.
The bank may enter into certain lending commitments where the loan, on drawdown, is expected to be classified as held–for–trading because the intent is to sell the loans in the short term. These commitments to lend are recorded as derivatives and measured at fair value through profit or loss.
Where the loan, on drawdown, is expected to be retained by the bank, and not sold in the short term, the commitment is recorded only when the commitment is an onerous contract and it is likely to give rise to a loss (for example, due to a counterparty credit event).
IAS 39.56
IAS 39.4
IAS 39.2(h)

Notes to the consolidated financial statements
1 9
2. Accounting policies (cont’d) 2.4 Summary of significant accounting policies (cont’d) (2) Financial instruments – initial recognition and subsequent measurement (cont’d) IFRS 7.21
(x) Debt issued and other borrowed funds
Financial instruments issued by the bank, that are not designated at fair value through profit or loss, are classified as liabilities under ‘Debt issued and other borrowed funds’, where the substance of the contractual arrangement results in the bank having an obligation either to deliver cash or another financial asset to the holder, or to satisfy the obligation other than by the exchange of a fixed amount of cash or another financial asset for a fixed number of own equity shares.
IAS 39.9 IAS 32.11 IAS 32.16
After initial measurement, debt issued and other borrowings are subsequently measured at amortised cost using the EIR. Amortised cost is calculated by taking into account any discount or premium on the issue and costs that are an integral part of the EIR.
IAS 39.47 IAS 39.AG5–8
A compound financial instrument which contains both a liability and an equity component is separated at the issue date. A portion of the net proceeds of the instrument is allocated to the debt component on the date of issue based on its fair value (which is generally determined based on the quoted market prices for similar debt instruments). The equity component is assigned the residual amount after deducting from the fair value of the instrument as a whole the amount separately determined for the debt component. The value of any derivative features (such as a call option) embedded in the compound financial instrument other than the equity component is included in the debt component.
An analysis of the bank’s issued debt is disclosed in Note 31.
IAS 32.28
IAS 32.31
(xi) Reclassification of financial assets
Effective from 1 July 2008, the bank was permitted to reclassify, in certain circumstances, non–derivative financial assets out of the ‘Held–for–trading’ category and into the ‘Available–for–sale’, ‘Loans and receivables’, or ’Held–to–maturity’ categories. From this date it was also permitted to reclassify, in certain circumstances, financial instruments out of the ‘Available–for–sale’ category and into the ’Loans and receivables’ category. Reclassifications are recorded at fair value at the date of reclassification, which becomes the new amortised cost.
For a financial asset reclassified out of the ’Available–for–sale’ category, any previous gain or loss on that asset that has been recognised in equity is amortised to profit or loss over the remaining life of the investment using the EIR. Any difference between the new amortised cost and the expected cash flows is also amortised over the remaining life of the asset using the EIR. If the asset is subsequently determined to be impaired then the amount recorded in equity is recycled to the income statement.
The bank may reclassify a non–derivative trading asset out of the ‘Held–for–trading’ category and into the ‘Loans and receivables’ category if it meets the definition of loans and receivables and the bank has the intention and ability to hold the financial asset for the foreseeable future or until maturity. If a financial asset is reclassified, and if the bank subsequently increases its estimates of future cash receipts as a result of increased recoverability of those cash receipts, the effect of that increase is recognised as an adjustment to the EIR from the date of the change in estimate.
Reclassification is at the election of management, and is determined on an instrument by instrument basis. The bank does not reclassify any financial instrument into the fair value through profit or loss category after initial recognition. An analysis of reclassified financial assets is disclosed in Note 37 (B).
IAS 39.50–50F
IAS 39.AG8

Notes to the consolidated financial statements
2 0
2. Accounting policies (cont’d) 2.4 Summary of significant accounting policies (cont’d) (3) Derecognition of financial assets and financial liabilities IFRS 7.21
(i) Financial assets
A financial asset (or, where applicable a part of a financial asset or part of a group of similar financial assets) is derecognised when:
� The rights to receive cash flows from the asset have expired.
� The bank has transferred its rights to receive cash flows from the asset or has assumed an obligation to pay the received cash flows in full without material delay to a third party under a ‘pass–through’ arrangement; and either: � the bank has transferred substantially all the risks and rewards of the asset, or � the bank has neither transferred nor retained substantially all the risks and rewards of the asset, but has
transferred control of the asset.
When the bank has transferred its rights to receive cash flows from an asset or has entered into a pass–through arrangement, and has neither transferred nor retained substantially all the risks and rewards of the asset nor transferred control of the asset, the asset is recognised to the extent of the bank’s continuing involvement in the asset. In that case, the bank also recognises an associated liability. The transferred asset and the associated liability are measured on a basis that reflects the rights and obligations that the bank has retained.
Continuing involvement that takes the form of a guarantee over the transferred asset is measured at the lower of the original carrying amount of the asset and the maximum amount of consideration that the bank could be required to repay.
IAS 39.17(a) IAS 39.17(b) IAS 39.18(b) IAS 39.20(a) IAS 39.20(c)(i) IAS 39.20(c)(ii) IAS 39.30(a)
(ii) Financial liabilities
A financial liability is derecognised when the obligation under the liability is discharged or cancelled or expires. Where an existing financial liability is replaced by another from the same lender on substantially different terms, or the terms of an existing liability are substantially modified, such an exchange or modification is treated as a derecognition of the original liability and the recognition of a new liability. The difference between the carrying value of the original financial liability and the consideration paid is recognised in profit or loss.
IAS 39.39 IAS 39.40 IAS 39.41
(4) Repurchase and reverse repurchase agreements
Securities sold under agreements to repurchase at a specified future date are not derecognised from the statement of financial position as the bank retains substantially all the risks and rewards of ownership. The corresponding cash received is recognised in the consolidated statement of financial position as an asset with a corresponding obligation to return it, including accrued interest as a liability within ‘Cash collateral on securities lent and repurchase agreements’, reflecting the transaction’s economic substance as a loan to the bank. The difference between the sale and repurchase prices is treated as interest expense and is accrued over the life of agreement using the EIR. When the counterparty has the right to sell or repledge the securities, the bank reclassifies those securities in its statement of financial position to ‘Financial assets held–for–trading pledged as collateral’ or to ‘Financial investments available–for–sale pledged as collateral’, as appropriate.
Conversely, securities purchased under agreements to resell at a specified future date are not recognised in the statement of financial position. The consideration paid, including accrued interest, is recorded in the statement of financial position, within ‘Cash collateral on securities borrowed and reverse repurchase agreements’, reflecting the transaction’s economic substance as a loan by the bank. The difference between the purchase and resale prices is recorded in ‘Net interest income’ and is accrued over the life of the agreement using the EIR.
If securities purchased under agreement to resell are subsequently sold to third parties, the obligation to return the securities is recorded as a short sale within ‘Financial liabilities held–for–trading’ and measured at fair value with any gains or losses included in ‘Net trading income’.
IFRS 7.13(b) IAS 39.AG40(a) IAS 39.AG51 (a)–(c) IAS 39.IG D.1.1 IAS 39.37 IAS 39.AG50 IAS 39.AG15(b) IAS 39.IG D.1.1 IAS 18.30(a)
(5) Securities lending and borrowing
Securities lending and borrowing transactions are usually collateralised by securities or cash. The transfer of the securities to counterparties is only reflected on the statement of financial position if the risks and rewards of ownership are also transferred. Cash advanced or received as collateral is recorded as an asset or liability.
Securities borrowed are not recognised on the statement of financial position, unless they are then sold to third parties, in which case the obligation to return the securities is recorded as a trading liability and measured at fair value with any gains or losses included in ‘Net trading income’.
IFRS 7.13(b) IAS 39.AG40(b) IAS 39.AG51(a)–(c) IAS 39.IG D.1.1 IAS39.37
Notes to the consolidated financial statements
2 1
2. Accounting policies (cont’d) 2.4 Summary of significant accounting policies (cont’d) (6) Determination of fair value IAS 39.48
The fair value for financial instruments traded in active markets at the statement of financial position date is based on their quoted market price or dealer price quotations (bid price for long positions and ask price for short positions), without any deduction for transaction costs.
For all other financial instruments not traded in an active market, the fair value is determined by using appropriate valuation techniques. Valuation techniques include the discounted cash flow method, comparison to similar instruments for which market observable prices exist, options pricing models, credit models and other relevant valuation models.
IAS 39.AG72 IAS 39.AG74 IAS 39.48A
Certain financial instruments are recorded at fair value using valuation techniques in which current market transactions or observable market data are not available. Their fair value is determined using a valuation model that has been tested against prices or inputs to actual market transactions and using the bank’s best estimate of the most appropriate model assumptions. Models are adjusted to reflect the spread for bid and ask prices to reflect costs to close out positions, credit and debit valuation adjustments, liquidity spread and limitations in the models. Also, profit or loss calculated when such financial instruments are first recorded (‘Day 1’ profit or loss) is deferred and recognised only when the inputs become observable or on derecognition of the instrument (see Note 2.4 (2) (vi)).
An analysis of fair values of financial instruments and further details as to how they are measured are provided in Note 36.
(7) Impairment of financial assets The bank assesses at each statement of financial position date whether there is any objective evidence that a financial asset or a group of financial assets is impaired. A financial asset or a group of financial assets is deemed to be impaired if, and only if, there is objective evidence of impairment as a result of one or more events that has occurred after the initial recognition of the asset (an incurred ‘loss event’) and that loss event (or events) has an impact on the estimated future cash flows of the financial asset or the group of financial assets that can be reliably estimated.
Evidence of impairment may include indications that the borrower or a group of borrowers is experiencing significant financial difficulty, the probability that they will enter bankruptcy or other financial reorganisation, default or delinquency in interest or principal payments and where observable data indicates that there is a measurable decrease in the estimated future cash flows, such as changes in arrears or economic conditions that correlate with defaults.
IAS 39.58 IAS 39.59 IFRS 7.B5(f)
(i) Financial assets carried at amortised cost For financial assets carried at amortised cost (such as amounts due from banks, loans and advances to customers as well as held–to–maturity investments), the bank first assesses individually whether objective evidence of impairment exists for financial assets that are individually significant, or collectively for financial assets that are not individually significant. If the bank determines that no objective evidence of impairment exists for an individually assessed financial asset, it includes the asset in a group of financial assets with similar credit risk characteristics and collectively assesses them for impairment. Assets that are individually assessed for impairment and for which an impairment loss is, or continues to be, recognised are not included in a collective assessment of impairment.
IAS 39.64 IFRS 7.37(b)
If there is objective evidence that an impairment loss has been incurred, the amount of the loss is measured as the difference between the asset’s carrying amount and the present value of estimated future cash flows (excluding future expected credit losses that have not yet been incurred). The carrying amount of the asset is reduced through the use of an allowance account and the amount of the loss is recognised in the income statement. Interest income continues to be accrued on the reduced carrying amount and is accrued using the rate of interest used to discount the future cash flows for the purpose of measuring the impairment loss. The interest income is recorded as part of ‘Interest and similar income’. Loans together with the associated allowance are written off when there is no realistic prospect of future recovery and all collateral has been realised or has been transferred to the bank. If, in a subsequent year, the amount of the estimated impairment loss increases or decreases because of an event occurring after the impairment was recognised, the previously recognised impairment loss is increased or reduced by adjusting the allowance account. If a future write–off is later recovered, the recovery is credited to the ’Credit loss expense’.
IAS 39.63 IAS 39.AG93 IFRS 7.16 IFRS 7.B5(d)(i) IFRS 7.B5(d)(ii) IAS 39.65

Notes to the consolidated financial statements
2 2
2. Accounting policies (cont’d) 2.4 Summary of significant accounting policies (cont’d) (7) Impairment of financial assets (cont’d) (i) Financial assets carried at amortised cost (cont’d) The present value of the estimated future cash flows is discounted at the financial asset’s original EIR. If a loan has a variable interest rate, the discount rate for measuring any impairment loss is the current EIR. If the bank has reclassified trading assets to loans and advances, the discount rate for measuring any impairment loss is the new EIR (Refer Note 2.4(1)(xi) above) determined at the reclassification date. The calculation of the present value of the estimated future cash flows of a collateralised financial asset reflects the cash flows that may result from foreclosure less costs for obtaining and selling the collateral, whether or not foreclosure is probable.
IAS 39.AG84
For the purpose of a collective evaluation of impairment, financial assets are grouped on the basis of the Bank’s internal credit grading system, that considers credit risk characteristics such as asset type, industry, geographical location, collateral type, past–due status and other relevant factors.
IAS 39.AG87
Future cash flows on a group of financial assets that are collectively evaluated for impairment are estimated on the basis of historical loss experience for assets with credit risk characteristics similar to those in the group. Historical loss experience is adjusted on the basis of current observable data to reflect the effects of current conditions on which the historical loss experience is based and to remove the effects of conditions in the historical period that do not exist currently. Estimates of changes in future cash flows reflect, and are directionally consistent with, changes in related observable data from year to year (such as changes in unemployment rates, property prices, commodity prices, payment status, or other factors that are indicative of incurred losses in the group and their magnitude). The methodology and assumptions used for estimating future cash flows are reviewed regularly to reduce any differences between loss estimates and actual loss experience.
IAS 39.AG89
See Note 10 for details of impairment losses on financial assets carried at amortised cost, Note 24 for an analysis of the impairment allowance on loans and advances by class and Note 25 for details of impairment losses on held–to–maturity investments.
(ii) Available–for–sale financial investments
For available–for–sale financial investments, the bank assesses at each statement of financial position date whether there is objective evidence that an investment is impaired.
In the case of debt instruments classified as available–for–sale, the bank assesses individually whether there is objective evidence of impairment based on the same criteria as financial assets carried at amortised cost. However, the amount recorded for impairment is the cumulative loss measured as the difference between the amortised cost and the current fair value, less any impairment loss on that investment previously recognised in the income statement. Future interest income is based on the reduced carrying amount and is accrued using the rate of interest used to discount the future cash flows for the purpose of measuring the impairment loss. The interest income is recorded as part of ‘Interest and similar income’. If, in a subsequent period, the fair value of a debt instrument increases and the increase can be objectively related to a credit event occurring after the impairment loss was recognised in the income statement, the impairment loss is reversed through the income statement.
In the case of equity investments classified as available–for–sale, objective evidence would also include a ‘significant’ or ‘prolonged’ decline in the fair value of the investment below its cost. The bank treats ‘significant’ generally as 20% and ‘prolonged’ generally as greater than six months. Where there is evidence of impairment, the cumulative loss measured as the difference between the acquisition cost and the current fair value, less any impairment loss on that investment previously recognised in the income statement – is removed from equity and recognised in the income statement. Impairment losses on equity investments are not reversed through the income statement; increases in the fair value after impairment are recognised in other comprehensive income.
IAS 39.58
IAS 39.AG93
IAS 39.70
IAS 39.65
IAS 39.61 IAS 39.67 IAS 39.68 IAS 39.69
Commentary In our view, an entity must clearly disclose for each type of security, the basis for determining what is considered significant or prolonged. The quantitative indicators used by Good Bank are for illustrative purposes only. Each entity should determine its own application by taking into account the characteristics of the market and applying judgment. The basis for determining what is considered significant or prolonged must be applied consistently within a financial period as well as from period to period.
See Note 11 for details of impairment losses on financial investments–available–for–sale.
Notes to the consolidated financial statements
2 3
2. Accounting policies (cont’d) 2.4 Summary of significant accounting policies (cont’d) (7) Impairment of financial assets (cont’d) (iii) Renegotiated loans
Where possible, the bank seeks to restructure loans rather than to take possession of collateral. This may involve extending the payment arrangements and the agreement of new loan conditions. Once the terms have been renegotiated any impairment is measured using the original EIR as calculated before the modification of terms and the loan is no longer considered past due. Management continually reviews renegotiated loans to ensure that all criteria are met and that future payments are likely to occur. The loans continue to be subject to an individual or collective impairment assessment, calculated using the loan’s original EIR.
IFRS 7.B5(g) IAS 39.AG84 IFRS 7.IG27
(8) Hedge accounting
The bank makes use of derivative instruments to manage exposures to interest rate, foreign currency and credit risks, including exposures arising from forecast transactions and firm commitments. In order to manage particular risks, the bank applies hedge accounting for transactions which meet specified criteria.
At inception of the hedge relationship, the bank formally documents the relationship between the hedged item and the hedging instrument, including the nature of the risk, the objective and strategy for undertaking the hedge and the method that will be used to assess the effectiveness of the hedging relationship.
IAS 39.88(a)
Also at the inception of the hedge relationship, a formal assessment is undertaken to ensure the hedging instrument is expected to be highly effective in offsetting the designated risk in the hedged item. Hedges are formally assessed each quarter. A hedge is expected to be highly effective if the changes in fair value or cash flows attributable to the hedged risk during the period for which the hedge is designated are expected to offset in a range of 80% to 125%. For situations where that hedged item is a forecast transaction, the bank assesses whether the transaction is highly probable and presents an exposure to variations in cash flows that could ultimately affect the income statement.
IAS 39.88(b),(d),(e) IAS 39.AG105 IAS 39.88(c)
(i) Fair value hedges IAS 39.86(a)
For designated and qualifying fair value hedges, the change in the fair value of a hedging derivative is recognised in the income statement in ‘Net trading income’. Meanwhile, the change in the fair value of the hedged item attributable to the risk hedged is recorded as part of the carrying value of the hedged item and is also recognised in the income statement in ‘Net trading income’.
If the hedging instrument expires or is sold, terminated or exercised, or where the hedge no longer meets the criteria for hedge accounting, the hedge relationship is terminated. For hedged items recorded at amortised cost, the difference between the carrying value of the hedged item on termination and the face value is amortised over the remaining term of the original hedge using the EIR. If the hedged item is derecognised, the unamortised fair value adjustment is recognised immediately in the income statement.
IAS 39.89 IAS 39.91 IAS 39.92
(ii) Cash flow hedges IAS 39.86(b)
For designated and qualifying cash flow hedges, the effective portion of the gain or loss on the hedging instrument is initially recognised directly in equity in the ‘Cash flow hedge’ reserve. The ineffective portion of the gain or loss on the hedging instrument is recognised immediately in ‘Net trading income’.
When the hedged cash flow affects the income statement, the gain or loss on the hedging instrument is recorded in the corresponding income or expense line of the income statement. When a hedging instrument expires, or is sold, terminated, exercised, or when a hedge no longer meets the criteria for hedge accounting, any cumulative gain or loss existing in other comprehensive income at that time remains in other comprehensive income and is recognised when the hedged forecast transaction is ultimately recognised in the income statement. When a forecast transaction is no longer expected to occur, the cumulative gain or loss that was reported in other comprehensive income is immediately transferred to the income statement.
IAS 39.95 IAS 39.101
(iii) Hedge of a net investments IAS 39.86(c)
Hedges of net investments in a foreign operation, including a hedge of a monetary item that is accounted for as part of the net investment, are accounted for in a way similar to cash flow hedges. Gains or losses on the hedging instrument relating to the effective portion of the hedge are recognised in other comprehensive income while any gains or losses relating to the ineffective portion are recognised in the income. On disposal of the foreign operation, the cumulative value of any such gains or losses recognised in other comprehensive income is transferred to the income statement.
IAS 39.102

Notes to the consolidated financial statements
2 4
2. Accounting policies (cont’d) 2.4 Summary of significant accounting policies (cont’d) (9) Offsetting financial instruments
Financial assets and financial liabilities are offset and the net amount reported in the statement of financial position if, and only if, there is a currently enforceable legal right to offset the recognised amounts and there is an intention to settle on a net basis, or to realise the asset and settle the liability simultaneously. This is not generally the case with master netting agreements, therefore, the related assets and liabilities are presented gross in statement of financial position.
IAS 32.42
(10) Leasing
The determination of whether an arrangement is a lease, or it contains a lease, is based on the substance of the arrangement and requires an assessment of whether the fulfilment of the arrangement is dependent on the use of a specific asset or assets and the arrangement conveys a right to use the asset.
Bank as a lessee
Leases which do not transfer to the bank substantially all the risks and benefits incidental to ownership of the leased items are operating leases. Operating lease payments are recognised as an expense in the income statement on a straight line basis over the lease term. Contingent rental payable are recognised as an expense in the period in which they are incurred.
Bank as a lessor
Leases where the bank does not transfer substantially all the risk and benefits of ownership of the asset are classified as operating leases. Initial direct costs incurred in negotiating operating leases are added to the carrying amount of the leased asset and recognised over the lease term on the same basis as rental income. Contingent rents are recognised as revenue in the period in which they are earned.
IFRIC 4.6 IAS 17.8 IAS 17.33 IAS 17.8 IAS 17.49 IAS 17.50 IAS 17.52
(11) Recognition of income and expenses IAS 18.35(a)
Revenue is recognised to the extent that it is probable that the economic benefits will flow to the bank and the revenue can be reliably measured. The following specific recognition criteria must also be met before revenue is recognised.
(i) Interest and similar income and expense
For all financial instruments measured at amortised cost, interest bearing financial assets classified as available–for–sale and financial instruments designated at fair value through profit or loss, interest income or expense is recorded using the EIR, which is the rate that exactly discounts estimated future cash payments or receipts through the expected life of the financial instrument or a shorter period, where appropriate, to the net carrying amount of the financial asset or financial liability. The calculation takes into account all contractual terms of the financial instrument (for example, prepayment options) and includes any fees or incremental costs that are directly attributable to the instrument and are an integral part of the EIR, but not future credit losses.
The carrying amount of the financial asset or financial liability is adjusted if the bank revises its estimates of payments or receipts. The adjusted carrying amount is calculated based on the original EIR and the change in carrying amount is recorded as ’Other operating income’. However, for a reclassified financial asset (see Note 2.4.2 (xi)) for which the bank subsequently increases its estimates of future cash receipts as a result of increased recoverability of those cash receipts, the effect of that increase is recognised as an adjustment to the EIR from the date of the change in estimate.
IAS 18.30(a) IAS 39.9 IAS 18.Appx14(a)
IAS 39.AG5–AG8
Once the recorded value of a financial asset or a group of similar financial assets has been reduced due to an impairment loss, interest income continues to be recognised using the rate of interest used to discount the future cash flows for the purpose of measuring the impairment loss.
IAS 39.AG93

Notes to the consolidated financial statements
2 5
2. Accounting policies (cont’d) 2.4 Summary of significant accounting policies (cont’d) (11) Recognition of income and expenses (cont’d) IAS 18.35(a)
(ii) Fee and commission income
The bank earns fee and commission income from a diverse range of services it provides to its customers. Fee income can be divided into the following two categories:
Fee income earned from services that are provided over a certain period of time IAS 18.35(a)
Fees earned for the provision of services over a period of time are accrued over that period. These fees include commission income and asset management, custody and other management and advisory fees.
Loan commitment fees for loans that are likely to be drawn down and other credit related fees are deferred (together with any incremental costs) and recognised as an adjustment to the EIR on the loan. When it is unlikely that a loan will be drawn down, the loan commitment fees are recognised over the commitment period on a straight line basis.
IAS 18.Appx14(b) IAS 18.Appx14(a)
Fee income from providing transaction services
Fees arising from negotiating or participating in the negotiation of a transaction for a third party, such as the arrangement of the acquisition of shares or other securities or the purchase or sale of businesses, are recognised on completion of the underlying transaction. Fees or components of fees that are linked to a certain performance are recognised after fulfilling the corresponding criteria.
IAS 18.Appx14(c)
(iii) Dividend income
Dividend income is recognised when the bank’s right to receive the payment is established. IAS 18.30(c)
(iv) Net trading income
Results arising from trading activities include all gains and losses from changes in fair value and related interest income or expense and dividends for financial assets and financial liabilities ‘held–for–trading’. This includes any ineffectiveness recorded in hedging transactions.
IAS 39.55(a)
(v) Customer loyalty programmes
Award credits under customer loyalty programmes are accounted for as a separately identifiable component of the transaction in which they are granted. The fair value of the consideration received in respect of the initial sale is allocated between the award credits and the other components of the sale. Income generated from customer loyalty programmes is recognised in ‘Other operating income’.
IFRIC 13.5 IFRIC 13.6
(12) Cash and cash equivalents
Cash and cash equivalents as referred to in the cash flow statement comprises cash on hand, non–restricted current accounts with central banks and amounts due from banks on demand or with an original maturity of three months or less.
IAS 7.6 IAS 7.46
(13) Property and equipment
Property and equipment (including equipment under operating leases where the bank is the lessor) is stated at cost excluding the costs of day–to–day servicing, less accumulated depreciation and accumulated impairment in value. Changes in the expected useful life are accounted for by changing the amortisation period or method, as appropriate, and treated as changes in accounting estimates.
Depreciation is calculated using the straight–line method to write down the cost of property and equipment to their residual values over their estimated useful lives. Land is not depreciated. The estimated useful lives are as follows:
� Buildings 25 to 40 years
� Computer hardware 2 years
� Other furniture and equipment 2 to 4 years
IAS 16.12 IAS 16.30 IAS 16.73(a)
IAS 16.73(b) IAS 16.73(c)
Property and equipment is derecognised on disposal or when no future economic benefits are expected from its use. Any gain or loss arising on derecognition of the asset (calculated as the difference between the net disposal proceeds and the carrying amount of the asset) is recognised in ‘Other operating income' in the income statement in the year the asset is derecognised.
IAS 16.67 IAS 16.71

Notes to the consolidated financial statements
2 6
2. Accounting policies (cont’d) 2.4 Summary of significant accounting policies (cont’d) (14) Business combinations and goodwill
Business combinations are accounted for using the purchase method of accounting. This involves recognising identifiable assets (including previously unrecognised intangible assets) and liabilities (including contingent liabilities but excluding future restructuring) of the acquired business at fair value. Any excess of the cost of acquisition over the fair values of the identifiable net assets acquired is recognised as goodwill. If the cost of acquisition is less than the fair values of the identifiable net assets acquired, the discount on acquisition is recognised directly in the income statement in the year of acquisition.
IFRS 3.4 IFRS 3.5 IFRS 3.6 IFRS 3.7 IFRS 3.8 IFRS 3.9
Goodwill acquired in a business combination is initially measured at cost, being the excess of the cost of the business combination over the bank’s interest in the net fair value of the identifiable assets, liabilities and contingent liabilities acquired.
Following initial recognition, goodwill is measured at cost less any accumulated impairment losses. Goodwill is reviewed for impairment annually, or more frequently, if events or changes in circumstances indicate that the carrying value may be impaired. For the purpose of impairment testing, goodwill acquired in a business combination is, from the acquisition date, allocated to each of the bank’s cash–generating units (CGUs) or group of CGUs, which are expected to benefit from the synergies of the combination, irrespective of whether other assets or liabilities of the acquiree are assigned to those units. Each unit to which the goodwill is allocated represents the lowest level within the bank at which the goodwill is monitored for internal management purposes, and is not larger than an operating segment in accordance with IFRS 8 Operating Segments.
IFRS 3.7
IAS 36.80
Where goodwill forms part of a CGU (or group of CGUs) and part of the operation within that unit is disposed of, the goodwill associated with the operation disposed of is included in the carrying amount of the operation when determining the gain or loss on disposal of the operation. Goodwill disposed of in this circumstance is measured based on the relative values of the operation disposed of and the portion of the CGU retained.
IAS 36.86
When subsidiaries are sold, the difference between the selling price and the net assets plus cumulative translation differences and goodwill is recognised in the income statement.
(15) Intangible assets
The bank’s other intangible assets include the value of computer software and customer core deposits acquired in business combinations.
An intangible asset is recognised only when its cost can be measured reliably and it is probable that the expected future economic benefits that are attributable to it will flow to the bank.
Intangible assets acquired separately are measured on initial recognition at cost. The cost of intangible assets acquired in a business combination is their fair value as at the date of acquisition. Following initial recognition, intangible assets are carried at cost less any accumulated amortisation and any accumulated impairment losses.
IAS 38.21 IAS 38.24 IAS 38.33 IAS 38.74
The useful lives of intangible assets are assessed to be either finite or indefinite. Intangible assets with finite lives are amortised over the useful economic life. The amortisation period and the amortisation method for an intangible asset with a finite useful life are reviewed at least at each financial year–end. Changes in the expected useful life or the expected pattern of consumption of future economic benefits embodied in the asset are accounted for by changing the amortisation period or method, as appropriate, and treated as changes in accounting estimates. The amortisation expense on intangible assets with finite lives is recognised in the income statement in the expense category consistent with the function of the intangible asset.
IAS 38.88 IAS 38.118(b) IAS 38.104 IAS 38.118(d)
Amortisation is calculated using the straight–line method to write down the cost of intangible assets to their residual values over their estimated useful lives as follows:
� Computer software 2 years
� Core deposits 5 years
IAS 38.118(a)

Notes to the consolidated financial statements
2 7
2. Accounting policies (cont’d) 2.4 Summary of significant accounting policies (cont’d) (16) Impairment of non–financial assets
The bank assesses at each reporting date whether there is an indication that an asset may be impaired. If any indication exists, or when annual impairment testing for an asset is required, the bank estimates the asset’s recoverable amount. An asset’s recoverable amount is the higher of an asset’s or cash–generating unit’s (CGU) fair value less costs to sell and its value in use. Where the carrying amount of an asset or CGU exceeds its recoverable amount, the asset is considered impaired and is written down to its recoverable amount. In assessing value in use, the estimated future cash flows are discounted to their present value using a pre–tax discount rate that reflects current market assessments of the time value of money and the risks specific to the asset. In determining fair value less costs to sell, an appropriate valuation model is used. These calculations are corroborated by valuation multiples, quoted share prices for publicly traded subsidiaries or other available fair value indicators.
IAS 36.9 IAS 36.90 IAS 36.6 IAS 36.66 IAS 36.59 IAS 36.30 IAS 36.55 IAS 36.25
For assets excluding goodwill, an assessment is made at each reporting date as to whether there is any indication that previously recognised impairment losses may no longer exist or may have decreased. If such indication exists, the bank estimates the asset’s or CGU’s recoverable amount. A previously recognised impairment loss is reversed only if there has been a change in the assumptions used to determine the asset’s recoverable amount since the last impairment loss was recognised. The reversal is limited so that the carrying amount of the asset does not exceed its recoverable amount, nor exceeds the carrying amount that would have been determined, net of depreciation, had no impairment loss been recognised for the asset in prior years. Such reversal is recognised in the income statement.
IAS 36.110 IAS 36.114 IAS 36.117 IAS 36.119
Impairment losses relating to goodwill cannot be reversed in future periods. IAS 36.124
(17) Financial guarantees
In the ordinary course of business, the bank gives financial guarantees, consisting of letters of credit, guarantees and acceptances. Financial guarantees are initially recognised in the financial statements (within ‘Other liabilities’) at fair value, being the premium received. Subsequent to initial recognition, the bank’s liability under each guarantee is measured at the higher of the amount initially recognised less, when appropriate, cumulative amortisation recognised in the income statement, and the best estimate of expenditure required to settle any financial obligation arising as a result of the guarantee.
Any increase in the liability relating to financial guarantees is recorded in the income statement in ‘Credit loss expense’. The premium received is recognised in the income statement in ‘Net fees and commission income’ on a straight line basis over the life of the guarantee.
IAS 39.9 IAS 39.43 IAS 39.AG4 IAS 39.47(c)
(18) Pension benefits
(i) Defined benefit pension plan
The bank operates a defined benefit pension plan, which requires contributions to be made to a separately administered fund. The cost of providing benefits under the defined benefit plan is determined separately using the projected unit credit actuarial valuation method. Actuarial gains and losses are recognised as income or expense when the net cumulative unrecognised actuarial gains and losses at the end of the previous reporting year exceed 10% of the higher of the defined benefit obligation and the fair value of plan assets at that date. These gains or losses are recognised over the expected average remaining working lives of the employees participating in the plan.
IAS 19.120A(b) IAS 19.64 IAS 19.120A(a) IAS 19.92 IAS 19.93
Past service cost is recognised as an expense on a straight–line basis over the average period until the benefits become vested. If the benefits vest immediately following the introduction of, or changes to, a pension plan, the past service cost is recognised immediately.
IAS 19.96
The defined benefit asset or liability comprises the present value of the defined benefit obligation less past service costs not yet recognised and less the fair value of plan assets out of which the obligations are to be settled directly, less actuarial losses not yet recognised. The value of any asset is restricted to the sum of any actuarial losses and past service cost not yet recognised and the present value of any economic benefits available in the form of refunds from the plan or reductions in the future contributions to the plan.
IAS 19.54 IAS 19.58

Notes to the consolidated financial statements
2 8
2. Accounting policies (cont’d) 2.4 Summary of significant accounting policies (cont’d) (18) Pension benefits (cont’d)
(ii) Defined contribution pension plan
The bank also operates a defined contribution pension plan. The contribution payable to a defined contribution plan is in proportion to the services rendered to the bank by the employees and is recorded as an expense under ‘Personnel expenses’. Unpaid contributions are recorded as a liability.
IAS 19.44
(19) Provisions
Provisions are recognised when the bank has a present obligation (legal or constructive) as a result of a past event, and it is probable that an outflow of resources embodying economic benefits will be required to settle the obligation and a reliable estimate can be made of the amount of the obligation. The expense relating to any provision is presented in the income statement net of any reimbursement.
IAS 37.14
(20) Share–based payment transactions
Employees (including senior executives) of the bank receive remuneration in the form of share–based payment transactions, whereby employees render services as consideration for equity instruments (‘equity–settled transactions’). Employees working in the business development group are granted share appreciation rights, which can only be settled in cash (‘cash–settled transactions’).
IFRS 2.44
(i) Equity–settled transactions
The cost of equity–settled transactions is recognised, together with a corresponding increase in equity, over the period in which the performance and/or service conditions are fulfilled, ending on the date on which the relevant employees become fully entitled to the award (‘the vesting date’). The cumulative expense recognised for equity–settled transactions at each reporting date until the vesting date reflects the extent to which the vesting period has expired and the bank’s best estimate of the number of equity instruments that will ultimately vest. The income statement expense or credit for a period is recorded in ‘Personnel expenses’ and represents the movement in cumulative expense recognised as at the beginning and end of that period.
IFRS 2.15
Where the terms of an equity–settled award are modified, the minimum expense recognised in ‘Personnel expenses’ is the expense as if the terms had not been modified. An additional expense is recognised for any modification which increases the total fair value of the share–based payment arrangement, or is otherwise beneficial to the employee as measured at the date of modification.
Where an equity–settled award is cancelled, it is treated as if it had vested on the date of cancellation, and any expense not yet recognised for the award is recognised immediately. This includes any award where non–vesting conditions within the control of either the entity or the counterparty are not met. However, if a new award is substituted for the cancelled award, and designated as a replacement award on the date that it is granted, the cancelled and new awards are treated as if they were a modification of the original award, as described in the previous paragraph.
IFRS 2.27 IFRS 2.28
The dilutive effect of outstanding options is reflected as additional share dilution in the computation of diluted earnings per share (Note 15).
IAS 33.45

Notes to the consolidated financial statements
2 9
2. Accounting policies (cont’d) 2.4 Summary of significant accounting policies (cont’d) (20) Share–based payment transactions (cont’d)
(ii) Cash–settled transactions
The cost of cash–settled transactions is measured initially at fair value at the grant date using a binomial pricing model, taking into account the terms and conditions upon which the instruments were granted (Note 37).
This fair value is expensed in ‘Personnel expenses’ over the period until vesting with recognition of a corresponding liability. The liability is remeasured to fair value at each statement of financial position date up to and including the settlement date, with changes in fair value recognised in the income statement in ‘Personnel expenses’.
IFRS 2.30 IFRS 2.32
IFRS 2.33
The bank has taken advantage of the transitional provisions of IFRS 2 in respect of equity–settled awards and has applied IFRS 2 only to equity–settled awards granted after 7 November 2002 that had not vested before 1 January 2005.
IFRS 2.53
(21) Taxes
(i) Current tax IAS 12.46
Current tax assets and liabilities for the current and prior years are measured at the amount expected to be recovered from or paid to the taxation authorities. The tax rates and tax laws used to compute the amount are those that are enacted or substantively enacted by the statement of financial position date.
(ii) Deferred tax
Deferred tax is provided on temporary differences at the statement of financial position date between the tax bases of assets and liabilities and their carrying amounts for financial reporting purposes. Deferred tax liabilities are recognised for all taxable temporary differences, except:
� Where the deferred tax liability arises from the initial recognition of goodwill or of an asset or liability in a transaction that is not a business combination and, at the time of the transaction, affects neither the accounting profit nor taxable profit or loss.
� In respect of taxable temporary differences associated with investments in subsidiaries, where the timing of the reversal of the temporary differences can be controlled and it is probable that the temporary differences will not reverse in the foreseeable future.
IAS 12.15 IAS 12.39
Deferred tax assets are recognised for all deductible temporary differences, carry forward of unused tax credits and unused tax losses, to the extent that it is probable that taxable profit will be available against which the deductible temporary differences, and the carry forward of unused tax credits and unused tax losses can be utilised except:
� Where the deferred tax asset relating to the deductible temporary difference arises from the initial recognition of an asset or liability in a transaction that is not a business combination and, at the time of the transaction, affects neither the accounting profit nor taxable profit or loss.
� In respect of deductible temporary differences associated with investments in subsidiaries, deferred tax assets are recognised only to the extent that it is probable that the temporary differences will reverse in the foreseeable future and taxable profit will be available against which the temporary differences can be utilised.
IAS 12.24 IAS 12.44
The carrying amount of deferred tax assets is reviewed at each statement of financial position date and reduced to the extent that it is no longer probable that sufficient taxable profit will be available to allow all or part of the deferred tax asset to be utilised. Unrecognised deferred tax assets are reassessed at each statement of financial position date and are recognised to the extent that it has become probable that future taxable profit will allow the deferred tax asset to be recovered.
IAS 12.56 IAS 12.37
Deferred tax assets and liabilities are measured at the tax rates that are expected to apply in the year when the asset is realised or the liability is settled, based on tax rates (and tax laws) that have been enacted or substantively enacted at the statement of financial position date.
IAS 12.47

Notes to the consolidated financial statements
3 0
2. Accounting policies (cont’d) 2.4 Summary of significant accounting policies (cont’d) (21) Taxes (cont’d)
(ii) Deferred tax (cont’d)
Current tax and deferred tax relating to items recognised directly in equity are also recognised in equity and not in the income statement.
IAS 12.61A
Deferred tax assets and deferred tax liabilities are offset if a legally enforceable right exists to set off current tax assets against current tax liabilities and the deferred taxes relate to the same taxable entity and the same taxation authority.
IAS 12.74
(22) Treasury shares and contracts on own shares
Own equity instruments of Good Bank which are acquired by it or by any of its subsidiaries (treasury shares) are deducted from equity and accounted for at weighted average cost. Consideration paid or received on the purchase, sale, issue or cancellation of the bank’s own equity instruments is recognised directly in equity. No gain or loss is recognised in profit or loss on the purchase, sale, issue or cancellation of own equity instruments.
When the bank holds own equity instruments on behalf of its clients, those holdings are not included in the bank’s statement of financial position.
IAS 32.33
IAS 32.AG36
Contracts on own shares that require physical settlement of a fixed number of own shares for a fixed consideration are classified as equity and added to or deducted from equity. Contracts on own shares that require net cash settlement or provide a choice of settlement are classified as trading instruments and changes in the fair value are reported in the income statement in ‘Net trading income’.
IAS 32.AG27
(23) Fiduciary assets
The bank provides trust and other fiduciary services that result in the holding or investing of assets on behalf of its clients. Assets held in a fiduciary capacity are not reported in the financial statements, as they are not the assets of the bank.
(24) Dividends on ordinary shares
Dividends on ordinary shares are recognised as a liability and deducted from equity when they are approved by the bank’s shareholders. Interim dividends are deducted from equity when they are declared and no longer at the discretion of the bank.
Dividends for the year that are approved after the statement of financial position date are disclosed as an event after the statement of financial position date.
IAS 10.12–13
(25) Equity reserves IAS 1.79(b)
The reserves recorded in equity (other comprehensive income) on the bank’s statement of financial position include:
‘Available–for–sale’ reserve which comprises changes in fair value of available–for–sale investments.
‘Cash flow hedge reserve’ which comprises the portion of the gain or loss on a hedging instrument in a cash flow hedge that is determined to be an effective hedge.
‘Foreign currency translation reserve’ which is used to record exchange differences arising from the translation of the net investment in foreign operations, net of the effects of hedging.
‘Other capital reserve’ which includes the portions of compound financial liabilities that qualify for treatment as equity (Note 31).
(26) Segment reporting
The bank’s segmental reporting is based on the following operating segments: Retail banking, Corporate banking, Investment banking, Asset management and Group functions.
IFRS 8.5–10
Notes to the consolidated financial statements
3 1
2. Accounting policies (cont’d) 2.5. Standards issued but not yet effective Standards issued but not yet effective up to the date of issuance of the bank’s financial statements are listed below. This listing is of standards and interpretations issued, which the bank reasonably expects to be applicable at a future date. The bank intends to adopt those standards when they become effective.
IAS 24 Related Party Disclosures (Amendment)
The amended standard is effective for annual periods beginning on or after 1 January 2011. It clarified the definition of a related party to simplify the identification of such relationships and to eliminate inconsistencies in its application. The revised standard introduces a partial exemption of disclosure requirements for government-related entities. The bank does not expect any impact on its financial position or performance. Early adoption is permitted for either the partial exemption for government-related entities or for the entire standard.
IAS 32 Financial Instruments: Presentation – Classification of Rights Issues
The amendment to IAS 32 is effective for annual periods beginning on or after 1 February 2010 and amended the definition of a financial liability in order to classify rights issues (and certain options or warrants) as equity instruments in cases where such rights are given pro rata to all of the existing owners of the same class of an entity’s non-derivative equity instruments, or to acquire a fixed number of the entity’s own equity instruments for a fixed amount in any currency. This amendment will have no impact on the bank after initial application.
IFRS 9 Financial Instruments: Classification and Measurement
IFRS 9 as issued reflects the first phase of the IASBs work on the replacement of IAS 39 and applies to classification and measurement of financial assets and liabilities as defined in IAS 39. The standard is effective for annual periods beginning on or after 1 January 2013. In subsequent phases, the Board will address impairment and hedge accounting. The completion of this project is expected in mid 2011. The adoption of the first phase of IFRS 9 will primarily have an effect on the classification and measurement of the bank’s financial assets. The bank is currently assessing the impact of adopting IFRS 9, however, the impact of adoption depends on the assets held by the bank at the date of adoption, it is not practical to quantify the effect.
IFRIC 14 Prepayments of a minimum funding requirement (Amendment)
The amendment to IFRIC 14 is effective for annual periods beginning on or after 1 January 2011 with retrospective application. The amendment provides guidance on assessing the recoverable amount of a net pension asset. The amendment permits an entity to treat the prepayment of a minimum funding requirement as an asset. The amendment is expected to have no impact on the financial statements of the bank.
IFRIC 19 Extinguishing Financial Liabilities with Equity Instruments
IFRIC 19 is effective for annual periods beginning on or after 1 July 2010. The interpretation clarifies that equity instruments issued to a creditor to extinguish a financial liability qualify as consideration paid. The equity instruments issued are measured at their fair value. In case this cannot be reliably measured, they are measured at the fair value of the liability extinguished. Any gain or loss is recognised immediately in profit or loss. The adoption of this interpretation will have no effect on the financial statements of the bank.
Improvements to IFRSs (issued in May 2010)
The IASB issued Improvements to IFRSs, an omnibus of amendments to its IFRS standards. The amendments have not been adopted as they become effective for annual periods on or after either 1 July 2010 or 1 January 2011. The amendments are listed below.
� IFRS 3 Business Combinations � IFRS 7 Financial Instruments: Disclosures � IAS 1 Presentation of Financial Statements � IAS 27 Consolidated and Separate Financial Statements � IFRIC 13 Customer Loyalty Programmes The bank, however, expects no impact from the adoption of the amendments on its financial position or performance. Commentary IAS 8.30 requires disclosure of those standards that have been issued which are not yet effective and that provide known or reasonably estimable information to enable users to assess the possible impact of the application of such IFRS on an entity’s financial statements. Therefore, the Group has listed standards and interpretations that are not yet effective, which it reasonably expects to be applicable at a future date (i.e., omitting to list amendments that have no impact, such as IFRS 1 or IAS 34).

Notes to the consolidated financial statements
3 2
3. Segment information
For management purposes, the bank is organised into five operating segments based on products and services as follows:
IFRS 8.22 (a) IFRS 8.22 (b)
Retail banking � Individual customers’ deposits and consumer loans, overdrafts, credit card facilities and funds transfer facilities.
Corporate banking � Loans and other credit facilities and deposit and current accounts for corporate and institutional customers.
Investment banking � Investment banking services including corporate finance, merger and acquisitions advice, specialised financial advice and trading.
Asset management � Investment products and services to institutional investors and intermediaries.
Group function � Treasury and finance and other central functions.
Management monitors the operating results of its business units separately for the purpose of making decisions about resource allocation and performance assessment. Segment performance is evaluated based on operating profit or loss which in certain respects is measured differently from operating profit or loss in the consolidated financial statements. Income taxes are managed on a group basis and are not allocated to operating segments.
Interest income is reported net as management primarily relies on net interest revenue as a performance measure, not the gross income and expense.
Transfer prices between operating segments are on an arm’s length basis in a manner similar to transactions with third parties.
No revenue from transactions with a single external customer or counterparty amounted to 10% or more of the bank’s total revenue in 2010 or 2009.
IFRS 8.27 (a) IFRS 8.23, IFRS 8.IG3 IFRS 8.34

Notes to the consolidated financial statements
3 3
3. Segment information (cont’d) The following table presents income and profit and certain asset and liability information regarding the bank’s operating segments.
Retail
Banking Corporate
Banking Investment
Banking Asset
Management Group
Functions Unallocated Total
2010 2010 2010 2010 2010 2010 2010
$ million $ million $ million $ million $ million $ million $ million
Income
Third party 1,838 1,122 1,132 263 (22) � 4,333 IFRS 8.23(a),
Inter–segment (112) (387) (175) – 674 � � IFRS 8.23(b)
Total operating income
1,726 735 957 263 652 – 4,333
Credit loss expense (480) (184) (3) � � � (667) IFRS 8.23(f)
Impairment losses on financial investments (6) (11) (43) � � � (60) IFRS 8.23(f)
Net operating income 1,240 540 911 263 652 – 3,606
Results
Interest and similar income 3,060 1,123 598 � (33) � 4,748
Interest and similar expense (1,289) (473) (252) � 13 � (2,001)
IFRS 8.23(d)
Net interest income (expense) 1,771 650 346 � (20) � 2,747
Fee and commission income 284 382 388 223 � � 1,277
IFRS 8.23(c)
Fee and commission expense (30) (40) (40) (23) � � (133)
Net fees and commission income 254 342 348 200 � � 1,144 IFRS 8.23(f)
Net trading income � � 387 � � � 387 IFRS 8.23(f)
Depreciation of property and equipment 18 20 15 48 2 � 103 IFRS 8.23(e)
Amortisation of intangible assets 37 � � � � � 37 IFRS 8.23(e)
Segment profit (loss) 521 241 449 223 (26) (118) 1,290 IFRS 8.23
Income tax expense (368) (368) IFRS 8.23(h)
Profit for the year 922 IFRS 8.23 Assets
Capital expenditures IFRS 8.24(b)
Property and equipment 46 23 26 3 1 � 99
Other intangible assets 8 4 1 2 � � 15
Total assets 33,719 24,729 30,556 12,318 1,058 208 102,588 IFRS 8.23 Total liabilities 31,166 22,568 28,192 11.131 1,696 736 95,489 IFRS 8.23

Notes to the consolidated financial statements
3 4
3. Segment information (cont’d)
Retail
Banking Corporate
Banking Investment
Banking Asset
Management Group
Functions Unallocated Total
2009 2009 2009 2009 2009 2009 2009
$ million $ million $ million $ million $ million $ million $ million
Income
Third party 1,831 869 1,276 241 (21) � 4,196 IFRS 8.23(a),
Inter–segment (136) (402) (166) � 704 � � IFRS 8.23(b)
Total operating income 1,695 467 1,110 241 683 � 4,196
Credit loss expense (643) (265) (2) � � � (910) IFRS 8.23(f)
Impairment losses on financial investments (4) (28) (78) � � � (110) IFRS 8.23(f)
Net operating income 1,048 174 1,030 241 683 � 3,176
Results
Interest and similar income 2,995 1,033 667 � (40) � 4,655
Interest and similar expense (1,275) (440) (284) � 17 � (1,982)
Net interest income (expense) 1,720 593 383 � (23) � 2,673
Fee and commission income 289 353 339 234 � � 1,215 IFRS 8.23(c)
Fee and commission expense (26) (32) (31) (21) � � (110) IFRS 8.23(d)
Net fees and commission income 263 321 308 213 � � 1,105 IFRS 8.23(f)
Net trading income � � 346 � � � 346 IFRS 8.23(f)
Depreciation of property and equipment 15 28 17 46 � � 106 IFRS 8.23(e)
Amortisation of intangible assets 35 � � � � � 35 IFRS 8.23(e)
Segment profit (loss) 390 101 328 107 (9) (40) 877 IFRS 8.23
Income tax expense (223) (223) IFRS 8.23(h)
Profit for the year 654 IFRS 8.23
Assets
Capital expenditures IFRS 8.24(b)
Property and equipment 35 33 15 7 - � 90
Other intangible assets 3 9 � 4 � � 16
Total assets 33,325 24,132 30,292 12,175 1,442 170 101,535 IFRS 8.23
Total liabilities 30,861 22,348 27,916 11,274 1,574 1,037 95,011 IFRS 8.23

Notes to the consolidated financial statements
3 5
3. Segment information (cont’d) Geographic information
The bank operates in four geographic markets: Goodland (Domestic), Europe, Americas and Asia Pacific. The following tables show the distribution of the bank’s external net operating income and non–current assets allocated based on the location of the customers and assets respectively for the years ended 31 December 2010 and 2009:
IFRS 8.33(a) IFRS 8.33(b)
Domestic
2010 Europe
2010 Americas
2010 Asia Pacific
2010 Total 2010
$ million $ million $ million $ million $ million
Total external operating income 1,524 806 1,229 774 4,333
Credit loss expense (157) (141) (210) (159) (667)
Impairment losses on financial investments (13) (11) (32) (4) (60)
Total external net operating income
1,354 654 987 611 3,606 IFRS 8.33(a)
Non–current assets 494 177 350 27 1,048 IFRS 8.33(b)
Domestic Europe Americas Asia Pacific Total
2009 2009 2009 2009 2009
$ million $ million $ million $ million $ million
Total external operating income 1,650 759 1,052 735 4,196
Credit loss expense (218) (224) (248) (220) (910)
Impairment losses on financial investments (28) (17) (58) (7) (110)
Total external net operating income
1,404 518 746 508 3,176 IFRS 8.33(a)
Non–current assets 433 155 342 154 1,084 IFRS 8.33(b)
Non–current assets consist of property, equipment and intangible assets. Commentary In accordance with IFRS 8.33(b) the geographical allocation of the non–current assets should be based on where the assets are located. In accordance with IFRS 8.33(a) the geographical allocation of the revenues from external customers can be based on any (reasonable) criterion but that basis shall be disclosed. Good Bank’s internal reporting is set up to report internally in accordance with IFRS. These segment disclosures could be significantly more extensive if internal reports had been prepared on a basis other than IFRS. In that case, a reconciliation between the internally reported items and the externally communicated items needs to be prepared.
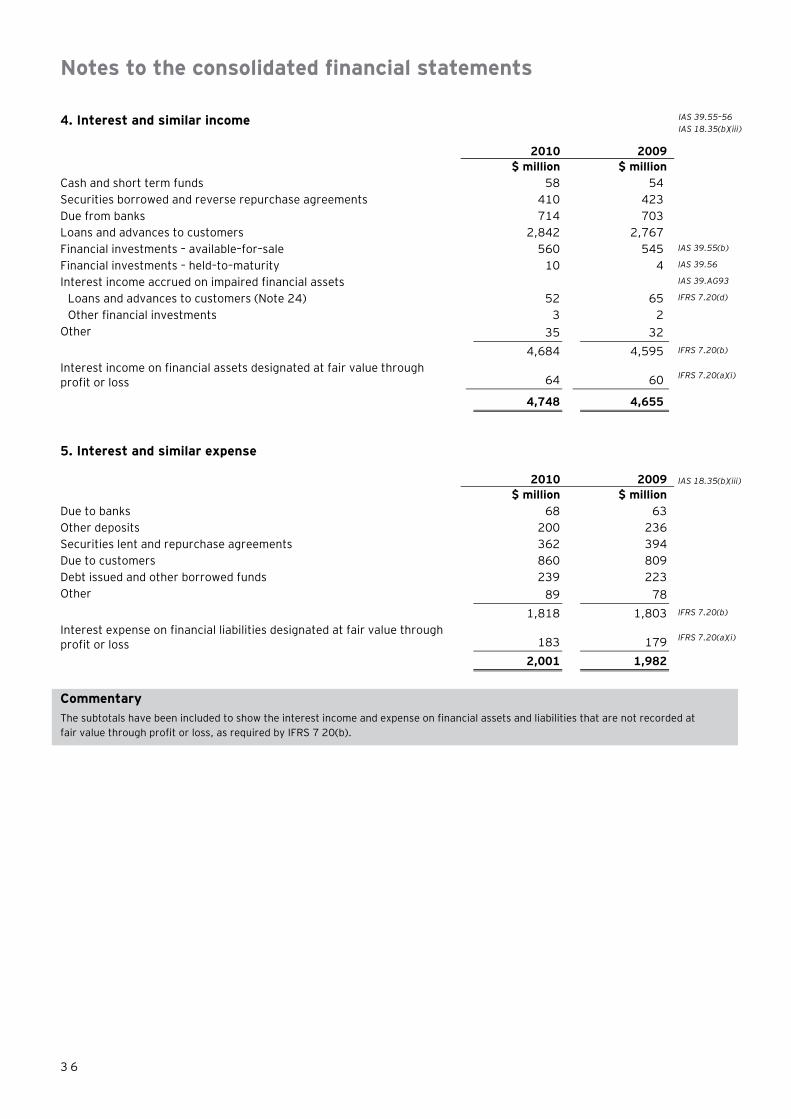
Notes to the consolidated financial statements
3 6
4. Interest and similar income IAS 39.55–56 IAS 18.35(b)(iii)
2010 2009
$ million $ million
Cash and short term funds 58 54
Securities borrowed and reverse repurchase agreements 410 423
Due from banks 714 703
Loans and advances to customers 2,842 2,767
Financial investments – available–for–sale 560 545 IAS 39.55(b)
Financial investments – held–to–maturity 10 4 IAS 39.56
Interest income accrued on impaired financial assets IAS 39.AG93
Loans and advances to customers (Note 24) 52 65 IFRS 7.20(d)
Other financial investments 3 2
Other 35 32
4,684 4,595 IFRS 7.20(b)
Interest income on financial assets designated at fair value through profit or loss 64 60 IFRS 7.20(a)(i)
4,748 4,655
5. Interest and similar expense
2010 2009 IAS 18.35(b)(iii)
$ million $ million
Due to banks 68 63
Other deposits 200 236
Securities lent and repurchase agreements 362 394
Due to customers 860 809
Debt issued and other borrowed funds 239 223
Other 89 78
1,818 1,803 IFRS 7.20(b)
Interest expense on financial liabilities designated at fair value through profit or loss 183 179 IFRS 7.20(a)(i)
2,001 1,982
Commentary The subtotals have been included to show the interest income and expense on financial assets and liabilities that are not recorded at fair value through profit or loss, as required by IFRS 7 20(b).

Notes to the consolidated financial statements
3 7
6. Net fees and commission income
2010 2009
$ million $ million IAS 18.35(b)(ii)
Fees and commission income
Portfolio and other management fees 346 333
Credit related fees and commissions 310 297
Corporate finance fees 98 92
Brokerage fees 379 358
Underwriting fees 135 127
Other fees received 9 8
1,277 1,215
Fees and commission expenses
Brokerage fees (123) (104)
Other fees (10) (6)
(133) (110)
Net fees and commission income 1,144 1,105 IFRS 7.20(c)(i)
Included in ‘Portfolio and other management fees’ is $107 million (2009: $94 million) in respect of fee income relating to trust and other fiduciary activities.
IFRS 7.20(c)(ii)
Commentary The reported credit related fees and commissions are those which are not regarded as part of the EIR on loans.
7. Net trading income
2010 2009
$ million $ million
Equities 190 175
Debt securities 18 (12)
Other interest rate instruments 102 128
Foreign exchange 65 60
Other 12 (5)
387 346 IFRS 7.20(a)(i)
‘Equities’ income includes the results of buying and selling, and changes in the fair value of equity securities, liabilities for equity securities sold–short and equity–linked derivatives. ‘Debt securities’ income includes the results of buying and selling and changes in the fair value of, debt securities and debt securities sold short as well as the related interest income and expense. The results of trading money market instruments, interest rate swaps, options and other derivatives are recorded under ‘Other interest rate instruments’.
‘Foreign exchange’ income includes gains and losses from spot and forward contracts and other currency derivatives. ‘Other’ net trading income includes the impact of fair value changes due to movement in the fair value of asset backed securities recorded as held–for–trading.

Notes to the consolidated financial statements
3 8
8. Net gain or (loss) on financial instruments designated at fair value through profit or loss
2010 2009
$ million $ million
Financial assets designated at fair value through profit or loss 9 18
Financial liabilities designated at fair value through profit or loss (46) (28)
(37) (10) IFRS 7.20(a)(i)
Commentary Profits from trading and from revaluation of financial assets designated at fair value through profit or loss are presented net, as permitted by paragraph 35 of IAS 1. However, the standard requires gains and losses to be reported separately if material.
9. Other operating income
2010 2009
$ million $ million
Dividend income 15 13 IAS 18.35(b)(v)
Gains/(losses) from sales of available–for–sale financial investments (13) 14 IFRS 7.20(a)(ii)
Gains from sales of loans and receivables 6 3 IFRS 7.20(a)(iv)
Non–trading foreign exchange 71 40 IAS 21.52(a)
Operating lease income 5 6
Other 8 6
92 82
Included in ‘Gains from sales of available–for–sale financial investments’ are the amounts transferred from equity to the income statement on the derecognition of available–for–sale investments.
10. Credit loss expense
2010 2009
$ million $ million
Due from banks (Note 20)
Placements with other banks 7 5
Loans and advances 6 4
13 9
Loans and advances to customers (Note 24)
Corporate lending 118 207
Small business lending 32 99
Consumer lending 247 286
Residential mortgages 164 207
561 799 IFRS 7.20(e)
Financial guarantee contracts 93 102 IFRS 7.20(e)
667 910

Notes to the consolidated financial statements
3 9
11. Impairment losses on financial investments
2010 2009
$ million $ million
Financial investments – available–for–sale
Debt securities
Quoted 5 8
Unquoted 54 100
Equities
Unquoted 1 2
60 110 IFRS 7.20(e)
12. Personnel expenses
2010 2009 $ million $ million Wages and salaries 980 978 Social security costs 86 85 Pension costs – Defined contribution plan 31 30 IAS 19.46
Pension costs – Defined benefit plan (Note 34) 102 101 IAS 19.120A
Share–based payments (Note 38) 5 6 1,204 1,200
Share–based payments includes $3 million (2009: $3 million) relating to the expense arising from transactions accounted for as equity–settled share–based payment transactions (see Note 38).
IFRS 2.51(a)
13. Other operating expenses
2010 2009
$ million $ million
Advertising and marketing 162 163
Administrative 453 448
Professional fees 139 135
Rental charges payable under operating leases 149 148 IAS 17.35(c)
Non–trading foreign exchange 10 9 IAS 21.52(a)
Other 59 55
972 958
Professional fees includes fees payable to the auditor in relation to the statutory audit of $10 million (2009: $10 million).
‘Other’ includes $4 million (2009: $1 million) relating to development costs of software for internal use.
IAS 1.1.104 IAS 38.126
14. Income tax
The components of income tax expense for the years ended 31 December 2010 and 2009 are: IAS 12.79
2010 2009
$ million $ million
Current tax
Current income tax 391 261 IAS 12.80(a)
Adjustment in respect of current income tax of prior years (3) 2 IAS 12.80(b)
Deferred tax
Relating to origination and reversal of temporary differences (20) (40) IAS 12.80(c)
368 223

Notes to the consolidated financial statements
4 0
14. Income tax (cont’d) Reconciliation of the total tax charge
A reconciliation between the tax expense and the accounting profit multiplied by Goodland’s domestic tax rate for the years ended 31 December 2010 and 2009 is as follows:
IAS 12.81(c)(i)
2010 2009
$ million $ million
Accounting profit before tax 1,290 877
At Goodland’s statutory income tax rate of 30% (2009: 30%) 388 263
Adjustment in respect of current income tax of prior years (3) 2
Effect of different tax rates in other countries (25) (32)
Income not subject to tax (10) (15)
Non–deductible expenses 18 5
Income tax expense reported in the consolidated income statement 368 223
The effective income tax rate for 2010 is 28% (2009: 25%).
Deferred tax
The following table shows deferred tax recorded on the statement of financial position in other assets and other liabilities and changes recorded in the income tax expense:
Deferred
tax assets Deferred tax
liabilities Income
statement Deferred
tax assets Deferred tax
liabilities Income
statement IAS 12.81(g)(i)
2010 2010 2010 2009 2009 2009 IAS 12.81(g)(ii)
$ million $ million $ million $ million $ million $ million
Provisions 54 (29) 15 45 (33) (36)
Pensions 21 (16) (2) 24 (18) 1
Impairment allowance for loans and advances to customers 54 (37) 10 51 (40) 6
Fair value of financial instruments held–for–trading 93 (91) 3 89 (84) (3)
Revaluation of cash flow hedges 5 (140) (12) 4 (102) 4
Revaluation of financial investments – available–for–sale 2 (48) (14) 3 (56) 6
Foreign currency translation reserve � (17) � � (15) �
Compound financial instruments � (102) (2) � (130) (3)
Other temporary differences 28 (25) (18) 21 (68) (15)
257 (505) (20) 237 (546) (40)

Notes to the consolidated financial statements
4 1
15. Earnings per share
Basic earnings per share is calculated by dividing the net profit for the year attributable to ordinary equity holders of Good Bank by the weighted average number of ordinary shares outstanding during the year.
IAS 33.10
Diluted earnings per share is calculated by dividing the net profit attributable to ordinary equity holders of Good Bank (after adjusting for interest on the convertible preference shares and interest on the convertible bond, in each case net of tax) by the weighted average number of ordinary shares outstanding during the year plus the weighted average number of ordinary shares that would be issued on the conversion of all the dilutive potential ordinary shares into ordinary shares.
IAS 33.31
IAS 33.32
The following table shows the income and share data used in the basic and diluted earnings per share calculations:
2010 2009
$ million $ million
Net profit attributable to ordinary equity holders of the parent 913 647 IAS 33.70(a)
Interest on preference shares 5 5
Interest on convertible bond 26 27 IAS 33.33(b)
Net profit attributable to ordinary equity holders of the parent adjusted for the effect of dilution 944 679 IAS 33.70(a)
2010 2009
$million $million
Weighted average number of ordinary shares for basic earnings per share 675 641 IAS 33.70(b)
Effect of dilution:
Convertible bonds (Note 31) 30 30
Convertible preference shares (Note 31) 4 4
Share options 1 �
Weighted average number of ordinary shares adjusted for the effect of dilution 710 675 IAS 33.70(b)
Earnings per share Equity shareholders of the parent for the year: $ $ Basic earnings per share 1.353 1.009 IAS 33.66
Diluted earnings per share 1.330 1.004 There have been no transactions involving ordinary shares or potential ordinary shares between the reporting date and the date of the completion of these financial statements which would require the restatement of earnings per share.
IAS 33.70(d)
IAS 33.70(c)
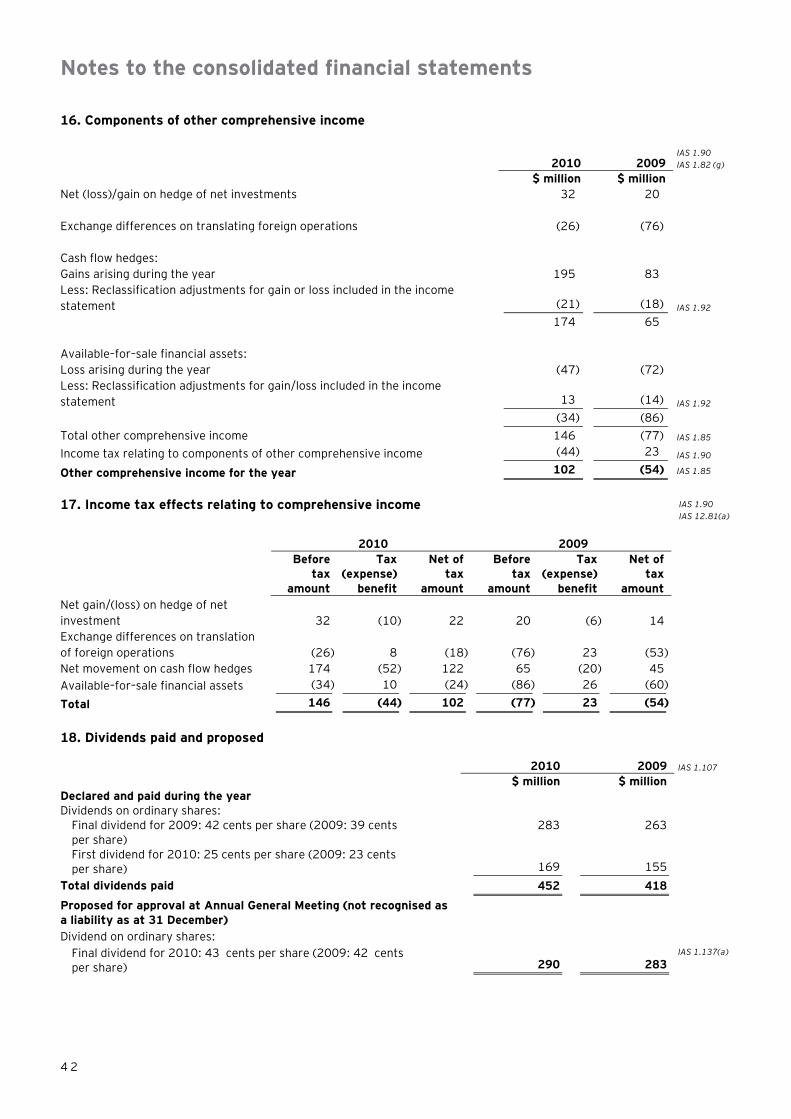
Notes to the consolidated financial statements
4 2
16. Components of other comprehensive income
2010 2009 IAS 1.90 IAS 1.82 (g)
$ million $ million Net (loss)/gain on hedge of net investments 32 20
Exchange differences on translating foreign operations (26) (76)
Cash flow hedges:
Gains arising during the year 195 83
Less: Reclassification adjustments for gain or loss included in the income statement (21) (18) IAS 1.92
174 65
Available–for–sale financial assets: Loss arising during the year (47) (72) Less: Reclassification adjustments for gain/loss included in the income statement 13 (14) IAS 1.92
(34) (86)
Total other comprehensive income 146 (77) IAS 1.85
Income tax relating to components of other comprehensive income (44) 23 IAS 1.90
Other comprehensive income for the year 102 (54) IAS 1.85
17. Income tax effects relating to comprehensive income IAS 1.90
IAS 12.81(a)
2010 2009
Before
tax amount
Tax (expense)
benefit
Net of tax
amount
Before tax
amount
Tax (expense)
benefit
Net of tax
amount
Net gain/(loss) on hedge of net investment 32 (10) 22 20 (6) 14
Exchange differences on translation of foreign operations (26) 8 (18) (76) 23 (53)
Net movement on cash flow hedges 174 (52) 122 65 (20) 45
Available–for–sale financial assets (34) 10 (24) (86) 26 (60)
Total 146 (44) 102 (77) 23 (54)
18. Dividends paid and proposed
2010 2009 IAS 1.107
$ million $ million
Declared and paid during the year
Dividends on ordinary shares:
Final dividend for 2009: 42 cents per share (2009: 39 cents per share)
283 263
First dividend for 2010: 25 cents per share (2009: 23 cents per share) 169 155
Total dividends paid 452 418
Proposed for approval at Annual General Meeting (not recognised as a liability as at 31 December)
Dividend on ordinary shares:
Final dividend for 2010: 43 cents per share (2009: 42 cents per share) 290 283
IAS 1.137(a)
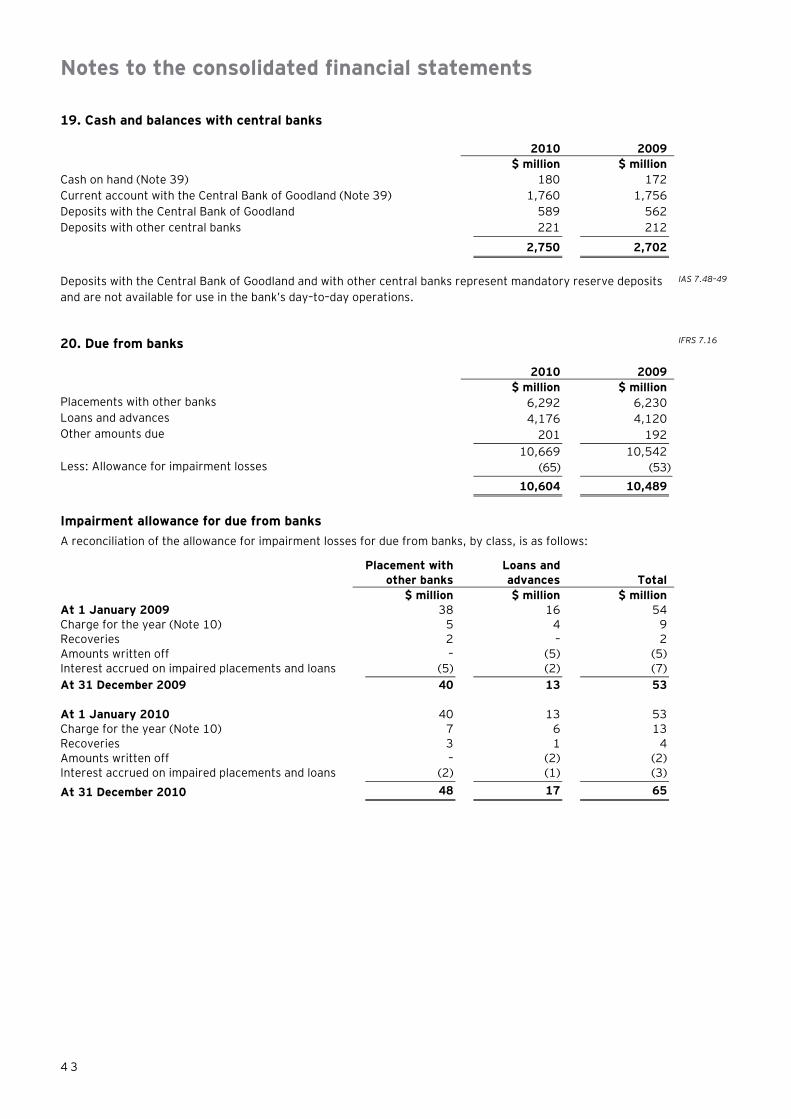
Notes to the consolidated financial statements
4 3
19. Cash and balances with central banks
2010 2009
$ million $ million
Cash on hand (Note 39) 180 172
Current account with the Central Bank of Goodland (Note 39) 1,760 1,756
Deposits with the Central Bank of Goodland 589 562
Deposits with other central banks 221 212
2,750 2,702
Deposits with the Central Bank of Goodland and with other central banks represent mandatory reserve deposits and are not available for use in the bank’s day–to–day operations.
IAS 7.48–49
20. Due from banks IFRS 7.16
2010 2009
$ million $ million
Placements with other banks 6,292 6,230
Loans and advances 4,176 4,120
Other amounts due 201 192
10,669 10,542
Less: Allowance for impairment losses (65) (53)
10,604 10,489
Impairment allowance for due from banks
A reconciliation of the allowance for impairment losses for due from banks, by class, is as follows: Placement with
other banks Loans and advances Total
$ million $ million $ million
At 1 January 2009 38 16 54
Charge for the year (Note 10) 5 4 9
Recoveries 2 – 2
Amounts written off – (5) (5)
Interest accrued on impaired placements and loans (5) (2) (7)
At 31 December 2009 40 13 53
At 1 January 2010 40 13 53
Charge for the year (Note 10) 7 6 13
Recoveries 3 1 4
Amounts written off – (2) (2)
Interest accrued on impaired placements and loans (2) (1) (3)
At 31 December 2010 48 17 65
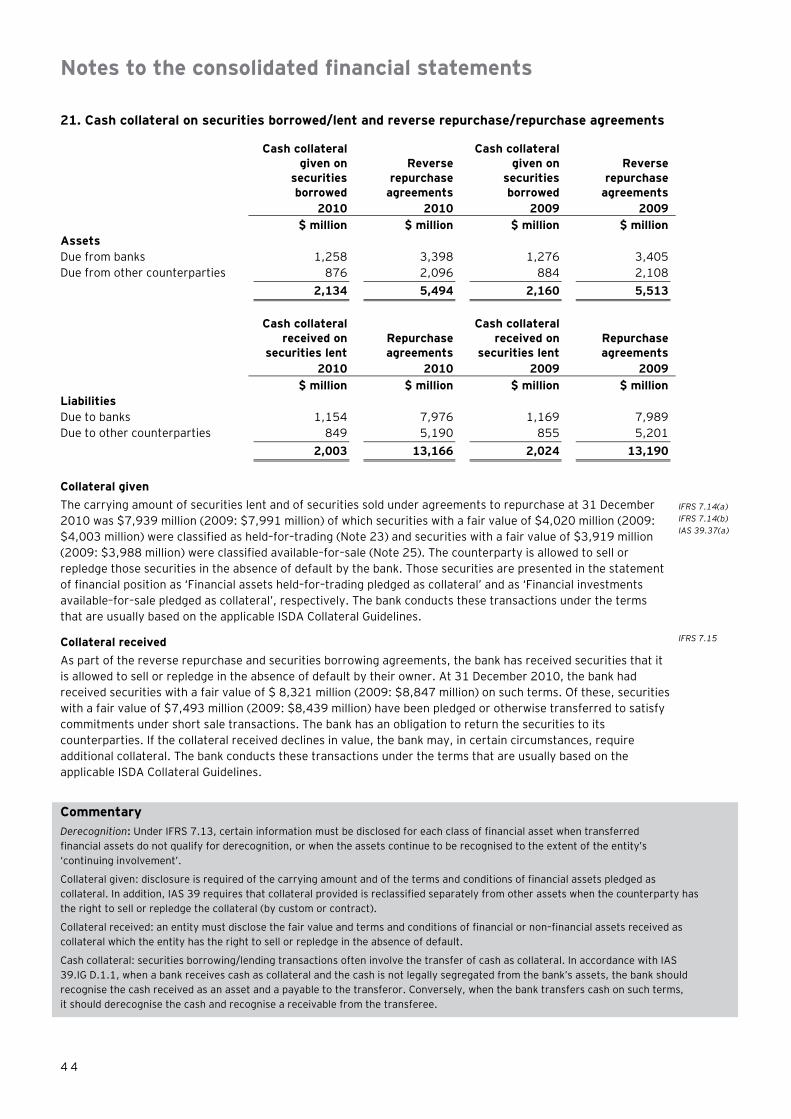
Notes to the consolidated financial statements
4 4
21. Cash collateral on securities borrowed/lent and reverse repurchase/repurchase agreements
Cash collateral given on
securities borrowed
Reverse repurchase
agreements
Cash collateral given on
securities borrowed
Reverse repurchase
agreements
2010 2010 2009 2009
$ million $ million $ million $ million
Assets
Due from banks 1,258 3,398 1,276 3,405
Due from other counterparties 876 2,096 884 2,108
2,134 5,494 2,160 5,513
Cash collateral
received on securities lent
Repurchase agreements
Cash collateral received on
securities lent Repurchase agreements
2010 2010 2009 2009
$ million $ million $ million $ million
Liabilities
Due to banks 1,154 7,976 1,169 7,989
Due to other counterparties 849 5,190 855 5,201
2,003 13,166 2,024 13,190
Collateral given The carrying amount of securities lent and of securities sold under agreements to repurchase at 31 December 2010 was $7,939 million (2009: $7,991 million) of which securities with a fair value of $4,020 million (2009: $4,003 million) were classified as held–for–trading (Note 23) and securities with a fair value of $3,919 million (2009: $3,988 million) were classified available–for–sale (Note 25). The counterparty is allowed to sell or repledge those securities in the absence of default by the bank. Those securities are presented in the statement of financial position as ‘Financial assets held–for–trading pledged as collateral’ and as ‘Financial investments available–for–sale pledged as collateral’, respectively. The bank conducts these transactions under the terms that are usually based on the applicable ISDA Collateral Guidelines.
IFRS 7.14(a) IFRS 7.14(b) IAS 39.37(a)
Collateral received As part of the reverse repurchase and securities borrowing agreements, the bank has received securities that it is allowed to sell or repledge in the absence of default by their owner. At 31 December 2010, the bank had received securities with a fair value of $ 8,321 million (2009: $8,847 million) on such terms. Of these, securities with a fair value of $7,493 million (2009: $8,439 million) have been pledged or otherwise transferred to satisfy commitments under short sale transactions. The bank has an obligation to return the securities to its counterparties. If the collateral received declines in value, the bank may, in certain circumstances, require additional collateral. The bank conducts these transactions under the terms that are usually based on the applicable ISDA Collateral Guidelines.
IFRS 7.15
Commentary Derecognition: Under IFRS 7.13, certain information must be disclosed for each class of financial asset when transferred financial assets do not qualify for derecognition, or when the assets continue to be recognised to the extent of the entity’s ‘continuing involvement’.
Collateral given: disclosure is required of the carrying amount and of the terms and conditions of financial assets pledged as collateral. In addition, IAS 39 requires that collateral provided is reclassified separately from other assets when the counterparty has the right to sell or repledge the collateral (by custom or contract).
Collateral received: an entity must disclose the fair value and terms and conditions of financial or non–financial assets received as collateral which the entity has the right to sell or repledge in the absence of default.
Cash collateral: securities borrowing/lending transactions often involve the transfer of cash as collateral. In accordance with IAS 39.IG D.1.1, when a bank receives cash as collateral and the cash is not legally segregated from the bank’s assets, the bank should recognise the cash received as an asset and a payable to the transferor. Conversely, when the bank transfers cash on such terms, it should derecognise the cash and recognise a receivable from the transferee.

Notes to the consolidated financial statements
4 5
22. Derivative financial instruments
The table below shows the fair values of derivative financial instruments, recorded as assets or liabilities, together with their notional amounts. The notional amount, recorded gross, is the amount of a derivative’s underlying asset, reference rate or index and is the basis upon which changes in the value of derivatives are measured. The notional amounts indicate the volume of transactions outstanding at the year end and are indicative of neither the market risk nor the credit risk.
Assets Liabilities Notional amount Assets Liabilities
Notional amount
2010 2010 2010 2009 2009 2009
$ million $ million $ million $ million $ million $ million
Derivatives held–for–trading
Interest rate swaps 965 (2,187) 32,490 816 (2,109) 30,157
Currency swaps 953 (743) 11,480 913 (705) 8,954
Forward foreign exchange contracts
760 (1,195) 45,909 752 (1,183) 24,938
Interest rate futures 6 (5) 4,122 3 (8) 3,975
Interest rate options 920 (990) 8,718 910 (990) 6,802
Credit default swaps 418 (18) 2,994 405 (21) 1,264
Equity swaps and options – (11) 2,027 – (12) 2,108
4,022 (5,149) 107,740 3,799 (5,028) 78,198
Derivatives used as fair value hedges
IFRS 7.22(b)
Interest rate swaps 2,290 (2,001) 26,096 2,263 (1,951) 23,261
Currency swaps 475 (846) 4,672 453 (792) 4,596
Interest rate futures 7 (11) 4,181 5 (3) 2,380
2,772 (2,858) 34,949 2,721 (2,746) 30,237
Derivatives used as cash flow hedges
IFRS 7.22(b)
Interest rate swaps 603 (48) 1,384 562 (45) 1,301
Currency swaps 76 (10) 2,008 62 (7) 1,917
679 (58) 3,392 624 (52) 3,218
7,473 (8,065) 146,082 7,144 (7,826) 111,652
Derivatives often involve at their inception only a mutual exchange of promises with little or no transfer of consideration. However, these instruments frequently involve a high degree of leverage and are very volatile. A relatively small movement in the value of the asset, rate or index underlying a derivative contract may have a significant impact on the profit or loss of the bank.
Over–the–counter derivatives may expose the bank to the risks associated with the absence of an exchange market on which to close out an open position.
The bank’s exposure under derivative contracts is closely monitored as part of the overall management of the bank’s market risk (see also Note 44).
IFRS 7.33 IFRS 7.B10(b)
Forwards and futures Forward and futures contracts are contractual agreements to buy or sell a specified financial instrument at a specific price and date in the future. Forwards are customised contracts transacted in the over–the–counter market. Futures contracts are transacted in standardised amounts on regulated exchanges and are subject to daily cash margin requirements.
The main differences in the risk associated with forward and futures contracts are credit risk and liquidity risk. The bank has credit exposure to the counterparties of forward contracts. The credit risk related to future contracts is considered minimal because the cash margin requirements of the exchange help ensure that these contracts are always honoured. Forward contracts are settled gross and are, therefore, considered to bear a higher liquidity risk than the futures contracts which are settled on a net basis. Both types of contracts result in market risk exposure.
IFRS 7.B11F(i)
Notes to the consolidated financial statements
4 6
22. Derivative financial instruments (cont’d) Swaps Swaps are contractual agreements between two parties to exchange streams of payments over time based on specified notional amounts, in relation to movements in a specified underlying index such as an interest rate, foreign currency rate or equity index.
Interest rate swaps relate to contracts taken out by the bank with other financial institutions in which the bank either receives or pays a floating rate of interest in return for paying or receiving, respectively, a fixed rate of interest. The payment flows are usually netted against each other, with the difference being paid by one party to the other.
In a currency swap, the bank pays a specified amount in one currency and receives a specified amount in another currency. Currency swaps are mostly gross–settled.
Credit default swaps are contractual agreements between two parties to make payments with respect to defined credit events, based on specified notional amounts. The bank purchases credit default swaps from monoline insurers and banks in order to mitigate the risk of default by the counterparty on the underlying security referenced by the swap.
Options Options are contractual agreements that convey the right, but not the obligation, for the purchaser either to buy or sell a specific amount of a financial instrument at a fixed price, either at a fixed future date or at any time within a specified period.
The bank purchases and sells options through regulated exchanges and in the over–the–counter markets. Options purchased by the bank provide the bank with the opportunity to purchase (call options) or sell (put options) the underlying asset at an agreed–upon value either on or before the expiration of the option. The bank is exposed to credit risk on purchased options only to the extent of their carrying amount, which is their fair value.
Options written by the bank provide the purchaser the opportunity to purchase from or sell to the bank the underlying asset at an agreed–upon value either on or before the expiration of the option.
The change in fair value of the derivative instruments attributable to changes in the bank’s credit risk amounts to a loss for the year of $4 million (2009: gain of $6 million). The change in fair value attributable to changes in credit risk has been calculated by incorporating the bank’s current observable credit spread into the valuation techniques used to value derivative instruments.
Advisory panel
Commentary IFRS 7 does not mandate disclosure of the effect of changes in the fair value of derivative instruments that is attributable to changes in the entity’s own credit risk. However, the publication issued by the IASB Expert Advisory Panel on Measuring and Disclosing the Fair Value of Financial Instruments in Markets that are no longer active recommended the disclosure.
Derivative financial instruments held or issued for trading purposes
Most of the bank’s derivative trading activities relate to deals with customers that are normally offset by transactions with other counterparties. The bank may also take positions with the expectation of profiting from favourable movements in prices, rates or indices. Also included under this heading are any derivatives entered into for hedging purposes that do not meet the IAS 39 hedge accounting criteria.
IFRS 7.31
Derivative financial instruments held or issued for hedging purposes
As part of its asset and liability management, the bank uses derivatives for hedging purposes in order to reduce its exposure to credit and market risks. This is achieved by hedging specific financial instruments, portfolios of fixed rate financial instruments and forecast transactions as well as strategic hedging against overall financial position exposures.
IFRS 7.31
The accounting treatment, explained in Note 2.4 (8) ‘Hedge accounting’, depends on the nature of the item hedged and compliance with the IAS 39 hedge accounting criteria.
Commentary It has been assumed that the credit default swaps do not meet the requirements for hedge accounting.

Notes to the consolidated financial statements
4 7
22. Derivative financial instruments (cont’d) Fair value hedges IAS 39.89
Fair value hedges are used by the bank to protect it against changes in the fair value of financial assets and financial liabilities due to movements in exchange rates and interest rates. The financial instruments hedged for interest rate risk include loans, available–for–sale debt securities, debt issued and other borrowed funds. The bank uses currency swaps to hedge against specifically identified currency risks, and interest rate swaps and interest rate futures to hedge interest rate risk.
IFRS 7.22(a) IFRS 7.22(c)
For the year ended 31 December 2010, the bank recognised a net loss of $596 million (2009: gain of $793 million), on the hedging instruments. The total net gain on hedged items attributable to the hedged risks amounted to $547 million (2009: loss of $854 million).
IFRS 7.24(a)(i) IFRS 7.24(a)(ii)
Cash flow hedges
The bank is exposed to variability in future interest cash flows on non–trading assets and liabilities which bear interest at a variable rate. The bank uses interest rate swaps as cash flow hedges of these interest rate risks. Also, as a result of firm commitments in foreign currencies, such as its issued foreign currency debt, the bank is exposed to foreign exchange and interest rate risks which are hedged with cross currency interest rate swaps. Below is a schedule indicating as at 31 December 2010, the periods when the hedged cash flows are expected to occur and when they are expected to affect profit or loss:
IFRS 7.22(a) IFRS 7.22(c)
2010 Within 1 year 1–3 years 3–8 years Over 8 years IFRS 7.23(a)
$ million $ million $ million $ million
Cash inflows (assets) 208 590 447 103
Cash outflows (liabilities) (70) (147) (92) (46)
Net cash inflow 138 443 355 57
2009 Within 1 year 1–3 years 3–8 years Over 8 years IFRS 7.23(a)
$ million $ million $ million $ million
Cash inflows (assets) 176 561 391 101
Cash outflows (liabilities) (50) (101) (94) (48)
Net cash inflow 126 460 297 53
Cash flow hedges IAS 39.95
The net loss on cash flow hedges reclassified to the income statement during the year was as follows:
2010 2009 IFRS 7.23(c)
$ million $ million IFRS 7.23(d)
Interest income 5 3
Interest expense (27) (26)
Other operating expenses (8) (2)
(30) (25)
Taxation 9 7
Net gain on cash flow hedges reclassified to the income statement (Note 35) (21) (18)
In 2010, a loss of $2 million (2009: $3 million) was recognised in the income statement due to hedge ineffectiveness from cash flow hedges.
IFRS 7.24(b)
The bank decreased its estimate of its highly probable forecast foreign currency cash flows in 2010. The discontinuation of hedge accounting resulted in a reclassification of the associated cumulative gains of $9 million from equity to the income statement (2009: $Nil), included in the above numbers.
IFRS 7.23(b)
Commentary Disclosure of the discontinuation of hedge accounting, because the forecast transaction is no longer expected to occur, is required by IFRS 7. However, a history of discontinuation of cash flow hedges potentially taints the entity’s ability to demonstrate that future cash flows on forecast transactions will be highly probable.

Notes to the consolidated financial statements
4 8
22. Derivative financial instruments (cont’d) Hedge of net investment in foreign operations IAS 39.102
Included in ‘Debt issued and other borrowed funds’ at 31 December 2010 was a borrowing of US$ 335 million (equivalent to approximately $322 million), which has been designated as a hedge of the bank’s net investment in its United States subsidiaries, and is being used to hedge the bank’s exposure to foreign exchange risk on those investments. Gains or losses on the retranslation of this borrowing are transferred to equity to offset any gains or losses on translation of the net investments in the subsidiaries. No ineffectiveness from hedges of net investments in foreign operations was recognised in profit or loss during the year (2009: Nil).
IFRS 7.22(a) IFRS 7.22(c) IFRS 7.24(c)
23. Other financial assets and financial liabilities at fair value through profit or loss
Financial assets at fair value through profit or loss
2010 2009
$ million $ million
Other financial assets held–for–trading
Government debt securities 3,131 3,121
Debt securities issued by banks 798 806
Asset backed securities 598 587
Other debt securities 460 453
Quoted equities 1,405 1,398
6,392 6,365 IFRS 7.8(a)(ii)
Financial assets held–for–trading pledged as collateral
Government debt securities 2,449 2,453
Debt securities issued by banks 524 518
Other debt securities 257 245
Quoted equities 790 787
4,020 4,003 IAS 39.37(a)
Financial assets designated at fair value through profit or loss
Loans and advances to customers 1,266 1,241
11,678 11,609 IFRS 7.8(a)(i)
Loans and advances to customers
Included in financial assets at fair value through profit or loss (designated at initial recognition) is a portfolio of variable rate corporate loans which is economically hedged by credit derivatives. The hedges do not achieve the criteria for hedge accounting and the loans are recorded at fair value to avoid an accounting mismatch. The maximum credit exposure of the loans and advances to customers amounts to $1,266 million (2009: $1,241 million). The cumulative change in fair value of the loans attributable to changes in credit risk amounts to a loss of $35 million (2009: loss of $32 million) and the change for the current year is a loss of $3 million (2009: loss $2 million).
IFRS 7.B5(a)(i) IFRS 7.B5(a)(ii) IFRS 7.9(a) IFRS 7.9(c)
The notional value of the credit derivatives is $1,334 million (2009: $978 million). The change in fair value of the credit derivatives attributable to changes in credit risk since the loans were first designated amounts to a gain of $30 million (2009: gain of $27 million) and the change for the current year is a gain of $3 million (2009: gain of $2 million).
IFRS 7.9(b) IFRS 7.9(d)
The changes in fair value of the designated loans attributable to changes in credit risk have been calculated by determining the changes in credit spread implicit in the fair value of bonds issued by entities with similar credit characteristics.
IFRS 7.11(a)

Notes to the consolidated financial statements
4 9
23. Financial assets and financial liabilities at fair value through profit or loss (cont’d) Financial liabilities at fair value through profit or loss
2010 2009
$ million $ million
Other financial liabilities held–for–trading
Short position in quoted equities 2,897 2,765
Short position in quoted debt securities 1,263 1,313
4,160 4,078 IFRS 7.8(e)(ii)
Financial liabilities designated at fair value through profit or loss
Structured notes 3,620 3,549
7,780 7,627 IFRS 7.8(e)(i)
Structured notes
On 10 January 2003, the bank issued 10–year notes with a par value of $3,600 million and an annual fixed coupon of 5 per cent, including a call option on the Goodland Top 100 index at a level of 197.3. The structured notes issued by the bank form part of a group of financial instruments that together are managed on a fair value basis.
IFRS 7.B5(a)(i) IFRS 7.B5(a)(ii)
The change in fair value of the structured notes attributable to changes in the bank’s credit risk amounts to a loss for the year of $24 million (2009: gain of $32 million). The change in fair value attributable to changes in credit risk has been calculated by reference to the change in the credit spread implicit in the market value of the bank's senior notes, i.e., the spread in excess of the risk free rate. The amount that the bank would contractually be required to pay at maturity (based on the current intrinsic value of the call options) is $34 million more than the carrying amount. The cumulative balance at the year end was $23 million credit (2009: $47 million credit).
IFRS 7.10(a) IFRS 7.11(a) IFRS 7.10(b)
Commentary IFRS 7 requires that entities include the effect of changes in own credit risk when determining the carrying amounts of liabilities measured at fair value. The default method set out in the standard assumes that this is any gain or loss not attributable to movements in the risk free rate. However, most banks calculate the effect of own credit risk by examining the credit spreads implied by the values of their bonds or by credit derivatives traded in the market since, for most of the banks, such market data is available.
IFRS 7 does not specifically mandate disclosing the source of inputs used to calculate the movements in fair value due to own credit risk, although it is probably captured under the general IFRS 7 requirements to show how fair value is calculated. Moreover, the publication issued by the IASB Expert Advisory Panel publication on Measuring and Disclosing the Fair Value of Financial Instruments in Markets that are no longer active encourages disclosing the source of inputs to provide greater transparency.
24. Loans and advances to customers
2010 2009
$ million $ million
Corporate lending 12,654 12,452
Small business lending 4,712 4,752
Consumer lending 18,213 17,883
Residential mortgages 13,278 12,951
Financial assets previously reclassified (Note 36) 135 124
48,992 48,162
Less: Allowance for impairment losses (1,068) (999) IFRS 7.16
47,924 47,163 IFRS 7.8(c)

Notes to the consolidated financial statements
5 0
24. Loans and advances to customers (cont’d) Impairment allowance for loans and advances to customers
A reconciliation of the allowance for impairment losses for loans and advances, by class, is as follows:
Corporate lending
Small business
lending Consumer
lending Residential mortgages Total
2010 2010 2010 2010 2010
$ million $ million $ million $ million $ million IFRS 7.16
At 1 January 2010 280 155 345 219 999
Charge for the year (Note 10) 118 32 247 164 561
Recoveries 26 18 35 10 89
Amounts written off (117) (40) (207) (165) (529)
Interest accrued on impaired loans and advances (Note 4) (11) (3) (23) (15) (52)
At 31 December 2010 296 162 397 213 1,068
Individual impairment 95 48 125 60 328
Collective impairment 201 114 272 153 740
296 162 397 213 1,068 IFRS 7.IG29(b)
Gross amount of loans, individually determined to be impaired, before deducting the individually assessed impairment allowance 305 180 514 268 1,267
IFRS 7.37(b) IFRS 7.IG29(a)
Corporate lending
Small business
lending Consumer
lending Residential mortgages Total
2009 2009 2009 2009 2009
$ million $ million $ million $ million $ million IFRS 7.16
At 1 January 2009 186 66 261 181 694
Charge for the year (Note 10) 207 99 286 207 799
Recoveries 33 24 45 14 116
Amounts written off (129) (29) (221) (166) (545)
Interest accrued on impaired loans and advances (Note 4) (17) (5) (26) (17) (65)
At 31 December 2009 280 155 345 219 999 Individual impairment 99 48 125 68 340
Collective impairment 181 107 220 151 659
280 155 345 219 999 IFRS 7.IG29(b)
Gross amount of loans individually determined to be impaired, before deducting the individually assessed impairment allowance 415 208 481 302 1,406
IFRS 7.37(b) IFRS 7.IG29(a)

Notes to the consolidated financial statements
5 1
24. Loans and advances to customers (cont’d) Commentary IFRS 7.16 require a reconciliation of the impairment allowance account to be disclosed. However, the IASB decided not to specify the components of the reconciliation. This allows entities flexibility in determining the most appropriate format for their needs. The separate disclosure of individual and collective impairment is normal practice for a bank. Reference should be made to the accounting policy on Loans and advances for the criteria for writing off amounts charged to the allowance account, as required by IFRS 7.B5(d)(ii).
IFRS 7 requires many of its disclosures to be given by ‘class’ of financial instrument, which is defined as a level of detail that is appropriate to the nature of the information disclosed and the characteristics of the instruments (IFRS 7.6). A class is a lower level of aggregation than a category (such as available–for–sale, held–to–maturity, etc.). In practice, banks vary in the number and types of classes into which they have subdivided their loans and advances, so there is no current industry standard view of what a class is.
Good Bank has distinguished between its major forms of lending when disclosing classes of loans and receivables. However, some banks have extended this, for example, by also distinguishing between geographical regions.
Good Bank could have analysed its exposures further analysed by risk characteristics for each category. For example, Corporate lending might have been divided into loans to retailers and to utility companies.
Collateral repossessed
During the year, the bank took possession of an industrial building with a carrying value of $2.6 million at the year end, which the bank is in the process of selling.
IFRS 7.38(a)
Derecognition of a loan portfolio
In December 2009, the bank sold the rights to 100% of the cash flows arising on a portfolio of fixed rate loans previously recorded at $190 million, with a fair value of $197 million, to a third party for a payment of $220 million, which includes a payment of $3 million in return for the bank agreeing to absorb the first $20 million of default losses on the portfolio. The bank has determined that substantially all the risks and rewards of the portfolio have been retained and consequently, the loans were not derecognised. The bank accounted for the transaction as a collateralised borrowing and recorded the cash received as a financial liability (Note 32).
IFRS 7.13
25. Financial investments
Available–for–sale investments
2010 2009
$ million $ million
Quoted investments IAS 39.AG71–73
Government debt securities 2,432 2,613
Other debt securities 1,567 1,632
Equities 298 311
4,297 4,556
Quoted investments pledged as collateral IAS 39.37(a),(d)
Government debt securities 3,712 3,798
Other debt securities 29 23
Equities 178 167
3,919 3,988
Unquoted investments IAS 39.AG74–79
Debt securities 3,702 3,614 IAS 39.AG80–81
Equities 149 146
3,851 3,760
12,067 12,304 IFRS 7.8(d)

Notes to the consolidated financial statements
5 2
25. Financial investments (cont’d) All unquoted available–for–sale equities are recorded at fair value except for the bank’s investment of $10 million in Goodland Stock Exchange Ltd, which is recorded at cost since its fair value cannot be reliably estimated (2009: the same). There is no market for this investment and the bank intends to hold it for the long term.
Held–to–maturity investments
2010 2009
$ million $ million
Quoted investments
Government debt securities 47 41 Other debt securities 23 19 70 60
Unquoted investments
Debt securities 75 71
145 131
Collective impairment (4) (4)
141 127 IFRS 7.8(b)
26. Other assets
2010 2009
$ million $ million IAS 1.77
Accrued income 445 440
Prepayments 408 459
Retirement benefit asset (Note 34) 165 104
1,018 1,003
27. Property and equipment IAS 1.78(a)
Land and buildings
Computer hardware
Other furniture and equipment Total
$ million $ million $ million $ million IAS 16.73(d)
Cost: At 1 January 2009
1,590
69
114
1,773
Additions – 34 56 90 IAS 16.73(e)(i)
Disposals – (26) (29) (55) IAS 16.73(e)(ix)
Exchange adjustment 2 1 1 4 IAS 16.73(e)(viii)
At 31 December 2009 1,592 78 142 1,812
Additions – 34 65 99 IAS 16.73(e)(i)
Disposals – (25) (28) (53) IAS 16.73(e)(ix)
Exchange adjustment 3 1 2 6 IAS 16.73(e)(viii)
At 31 December 2010 1,595 88 181 1,864
Depreciation and impairment: At 1 January 2009
620
50
70
740
Disposals – (23) (17) (40) IAS 16.73(e)(ix)
Depreciation charge for the year 51 26 29 106 IAS 16.73(e)(vii)
At 31 December 2009 671 53 82 806 Disposals – (20) (15) (35) IAS 16.73(e)(ix)
Depreciation charge for the year 50 25 28 103 IAS 16.73(e)(vii)
At 31 December 2010 721 58 95 874
Net book value:
At 1 January 2009 970 19 44 1,033 IAS 16.73(d)
At 31 December 2009 921 25 60 1,006 IAS 16.73(d)
At 31 December 2010 874 30 86 990 IAS 16.73(d)
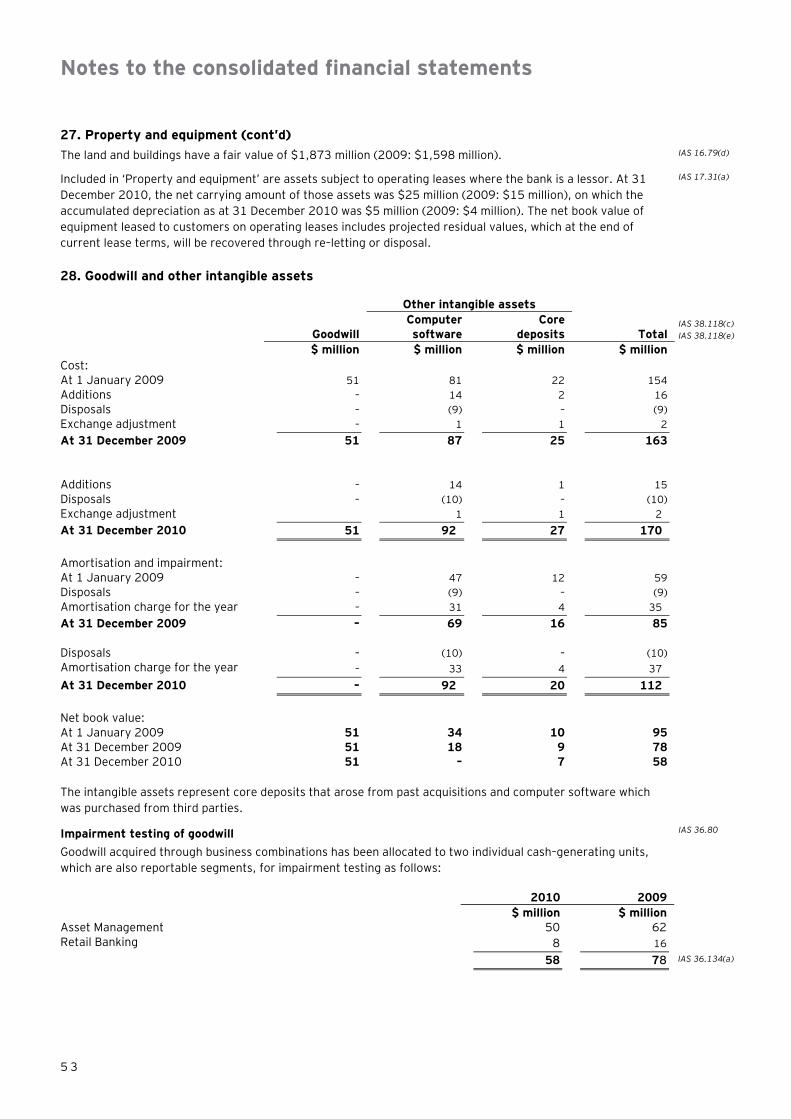
Notes to the consolidated financial statements
5 3
27. Property and equipment (cont’d) The land and buildings have a fair value of $1,873 million (2009: $1,598 million). IAS 16.79(d)
Included in ‘Property and equipment’ are assets subject to operating leases where the bank is a lessor. At 31 December 2010, the net carrying amount of those assets was $25 million (2009: $15 million), on which the accumulated depreciation as at 31 December 2010 was $5 million (2009: $4 million). The net book value of equipment leased to customers on operating leases includes projected residual values, which at the end of current lease terms, will be recovered through re–letting or disposal.
IAS 17.31(a)
28. Goodwill and other intangible assets Other intangible assets
Goodwill Computer software
Core deposits Total
IAS 38.118(c) IAS 38.118(e)
$ million $ million $ million $ million
Cost: At 1 January 2009
51
81
22
154
Additions – 14 2 16
Disposals – (9) – (9)
Exchange adjustment – 1 1 2
At 31 December 2009 51 87 25 163
Additions – 14 1 15
Disposals – (10) – (10)
Exchange adjustment 1 1 2
At 31 December 2010 51 92 27 170
Amortisation and impairment: At 1 January 2009
–
47
12
59
Disposals – (9) – (9)
Amortisation charge for the year – 31 4 35
At 31 December 2009 – 69 16 85
Disposals – (10) – (10)
Amortisation charge for the year – 33 4 37
At 31 December 2010 – 92 20 112
Net book value:
At 1 January 2009 51 34 10 95
At 31 December 2009 51 18 9 78
At 31 December 2010 51 – 7 58
The intangible assets represent core deposits that arose from past acquisitions and computer software which was purchased from third parties.
Impairment testing of goodwill IAS 36.80
Goodwill acquired through business combinations has been allocated to two individual cash–generating units, which are also reportable segments, for impairment testing as follows:
2010 2009
$ million $ million
Asset Management 50 62
Retail Banking 8 16
58 78 IAS 36.134(a)
Notes to the consolidated financial statements
5 4
28. Goodwill and other intangible assets (cont’d) Key assumptions used in value in use calculations
The recoverable amount of the Asset Management and the Retail Banking units have been determined based on value in use calculations, using cash flow projections based on financial budgets approved by senior management covering a five–year period. The following rates are used by the bank:
IAS 36.134(c) IAS 36.134(d)(iii) IAS 36.134(d)(iv)
Asset Management Retail Banking
2010 2009 2010 2009
% % % %
Discount rate 10.4 10.1 8.8 8.5 IAS 36.134(d)(v)
Projected growth rate 3.4 3.5 3.3 3.6 IAS 36.134(d)(iv)
The calculation of value in use for both Asset Management and Retail Banking units is most sensitive to interest margin, discount rates, market share during the budget period, projected growth rates used to extrapolate cash flows beyond the budget period, current local gross domestic product (GDP) and local inflation rates.
Interest margins
Interest margins are based on current fixed–interest yields. IAS 36.134(d)(i) IAS 36.134(d)(ii)
Discount rates
Discount rates reflect the current market assessment of the risk specific to each cash generating unit. The discount rate was estimated based on the average percentage of a weighted average cost of capital for the banking industry, determined on a pre-tax basis. This rate was further adjusted to reflect the market assessment of any risks specific to the cash generating unit for which future estimates of cash flows have not been adjusted.
IAS 36.134(d)(i) IAS 36.134(d)(ii)
Market share assumptions
These assumptions are important because, as well as using industry data for growth rates, management assesses how the unit’s relative position to its competitors might change over the budget period. Management expects the bank’s share of the Retail Banking and Asset Management markets, including customer deposits, to be stable over the budget period.
IAS 36.134(d)(i) IAS 36.134(d)(ii)
Projected growth rates, GDP and local inflation rates
Assumptions are based on published industry research. IAS 36.134(d)(i) IAS 36.134(d)(ii)
Sensitivity to changes in assumptions
Management believes that no reasonably possible change in any of the above key assumptions would cause the carrying value of the units to exceed their recoverable amount.
IAS 36.134(f)
Commentary More extensive disclosure covering impairment of goodwill, appropriate to when the amounts are more material, are given in Good Group (International) Limited Illustrative financial statements
Notes to the consolidated financial statements
5 5
29. Due to banks
2010 2009
$ million $ million
Deposits from other banks 2,905 2,865
Items in the course of collection 317 309
3,222 3,174 IFRS 7.8(f)
30. Due to customers
2010 2009
$ million $ million
Large corporate customers:
Current accounts 10,965 11,052
Term deposits 15,083 14,820
Small and medium–sized customers:
Current accounts 4,485 4,465
Term deposits 11,879 11,876
Retail customers:
Current/saving accounts 2,406 2,494
Term deposits 8,325 8,470
53,143 53,177 IFRS 7.8(f)
Included in ‘Due to customers’ were deposits of $85 million (2009: $72 million) held as collateral for irrevocable commitments under import letters of credit.
IFRS 7.15
31. Debt issued and other borrowed funds IFRS 7.8(f) Carrying value Carrying value
2010 2009
$ million $ million
Senior notes
$750 million fixed rate notes due 2013 741 738
$1,000 million fixed rate notes due 2011/2013 998 995
GBP 400 million floating rate notes due 2016* 586 537
Fixed rate commercial paper issued by GoodSIV (Note 37) 473 450
Fixed rate medium term notes issued by GoodSIV (Note 37) 53 47
2,851 2,767
Subordinated notes
USD 335 million fixed rate notes due 2013 issued by Credit Card Inc**. 322 311
$1 billion fixed rate notes due 2013/2017 998 989
$250 million floating rate notes due 2015/2020 246 243
1,566 1,543
Convertible financial liabilities
Convertible preference shares 115 107
Convertible bonds 778 762
893 869
5,310 5,179 IFRS 7.8(f)
* The notes are payable on demand upon a downgrade of the credit rating of Good Bank below BBB. IFRS 7.B11F(f)
** The bank may elect to settle the principal amount of the notes by either delivering cash or by delivering as many of Good Bank ‘s ordinary shares as are equal in value to the principal amount outstanding.
IFRS 7.B11F(h)
Commentary The disclosure of the nominal amount and due date of the issuances of senior and subordinated notes is provided voluntarily as it is not specifically required by IFRS. All the liabilities were issued by Good Bank (International) Limited except when otherwise indicated.
Notes to the consolidated financial statements
5 6
31. Debt issued and other borrowed funds (cont’d)
The bank has not repurchased any of its own debt during the year (2009: Nil). IFRS 7.20(a)(v)
The bank has not had any defaults of principal, interest or other breaches with regard to all liabilities during 2010 or 2009.
IFRS 7.18
Convertible preference shares
On 15 February 2006, the bank issued 12 million convertible preference shares. Each share has a nominal value of $10 per share and is convertible at the discretion of the shareholders into ordinary shares on 1 January 2017, on the basis of one ordinary share for three preference shares held. The preference shares are redeemable at the discretion of the shareholders for a price of $12 per preference share on 1 January 2017 Any preference shares not converted will be redeemed on 31 December 2025 at a price of $12 per share. The preference shares carry a dividend of 4.0% per annum, payable half yearly in arrears on 30 June and 31 December. If the bank is unable to pay a dividend because of insufficient profits, the dividend accumulates. The convertible preference shares rank ahead of the ordinary shares in the event of liquidation.
The equity component of the convertible preference shares is recorded in the Other Capital reserve (Note 35).
IAS 32.15 IAS 1.79(a)(v)
Convertible bonds On 15 January 2007, the bank issued 900 million 3.7% convertible bonds at a nominal value of $1 per bond. The contractual interest rate on the bonds is 3.7% but, excluding the equity conversion option, the EIR is 5.3%. The bonds mature 25 years from the issue date at the nominal value unless converted into the bank’s ordinary shares at the holder’s option at the rate of 1 share per $30. The convertible bonds are callable at the option of the bank at par any time after 2015 provided that the holders have not already exercised their conversion option. The equity component of the convertible bonds is recorded in the Other Capital reserve (Note 35).
During the year, the effective interest on the bond recorded in Interest expense was $ 37 million (2009: $ 37 million). The actual interest paid during the year was $ 33 million (2009: $ 33 million).
IAS 32.15 IFRS 7.17
32. Other liabilities
2010 2009
$ million $ million IAS 1.77
Interest payable 578 561
Collateralised borrowing (Note 24) 220 215
Accounts payable and sundry creditors 1,192 1,180
Obligations under financial guarantees 82 76 IAS 37.84
2,072 2,032
The movement in ‘Obligations under financial guarantees’ during 2010 is as follows:
2010 2009
$ million $ million
At 1 January 76 84 IAS 37.84(a)) Arising during the year 15 6 IAS 37.84(b)
Utilised (10) (15) IAS 37.84(c)
Discount rate adjustment 1 1 IAS 37.84(e)
At 31 December 82 76 IAS 37.84(a)
Notes to the consolidated financial statements
5 7
33. Provisions
The movement in provisions during 2010 and an analysis as current or non–current is as follows:
Restructuring Other Total
2010 2010 2010
$ million $ million $ million
At 1 January 55 21 76 IAS 37.84(a)
Arising during the year 20 15 35 IAS 37.84(b)
Utilised (19) (9) (28) IAS 37.84(c)
Discount rate adjustment 2 1 3 IAS 37.84(e)
At 31 December 58 28 86 IAS 37.84(a)
Current (less than one year) 58 28 86 IAS 1.69
Non–current (more than one year) � � �
At 31 December 58 28 86
Restructuring provision
The restructuring provision was created in 2009 for a fundamental reorganisation of the bank’s back office system and processes associated with its major outsourcing programme. Some of the restructuring took place during 2010 and it is expected to be completed by July 2011.
IAS 37.85(a)
Other provisions
Other provisions include allocated amounts for social security contribution on share options and onerous contracts for the cancellation of various global tradeshows and roadshows. It is expected that the costs will be incurred over the next six months.
34. Retirement benefit plan
Defined contribution plan
A defined contribution plan is a pension plan under which the bank pays fixed contributions; there is no legal or constructive obligation to pay further contributions. The assets of the plan are held separately from those of the bank in a fund under the control of trustees.
The total expense charged to income of $31million (2009: $30 million) represents contributions payable to these plans by the bank at rates specified in the rules of the plan.
IAS 19.46
Defined benefit plan
A defined benefit plan is a pension plan that defines an amount of pension benefit that an employee is entitled to receive on retirement, dependent on one or more factors such as age, years of service and salary. A full actuarial valuation by a qualified independent actuary is carried out every year.
IAS 19.120 IAS 19.120A(b)
The plan liability is measured on an actuarial basis using the projected unit credit method, adjusted for unrecognised actuarial gains and losses. The defined benefit plan liability is discounted using rates equivalent to the market yields at the statement of financial position date of high–quality corporate bonds that are denominated in the currency in which benefits will be paid, and that have a maturity approximating to the terms of the related pension liability. Actuarial gains and losses arising from experience adjustments and changes in actuarial assumptions are not recognised unless the net cumulative unrecognised gains or losses at the end of the previous reporting year exceeded the greater of either 10% of the fair value of plan assets or the present value of defined benefit obligation. In these circumstances, the excess is charged or credited to the income statement over the employees’ expected average remaining working lives (2010: 10 years, 2009: 10 years).
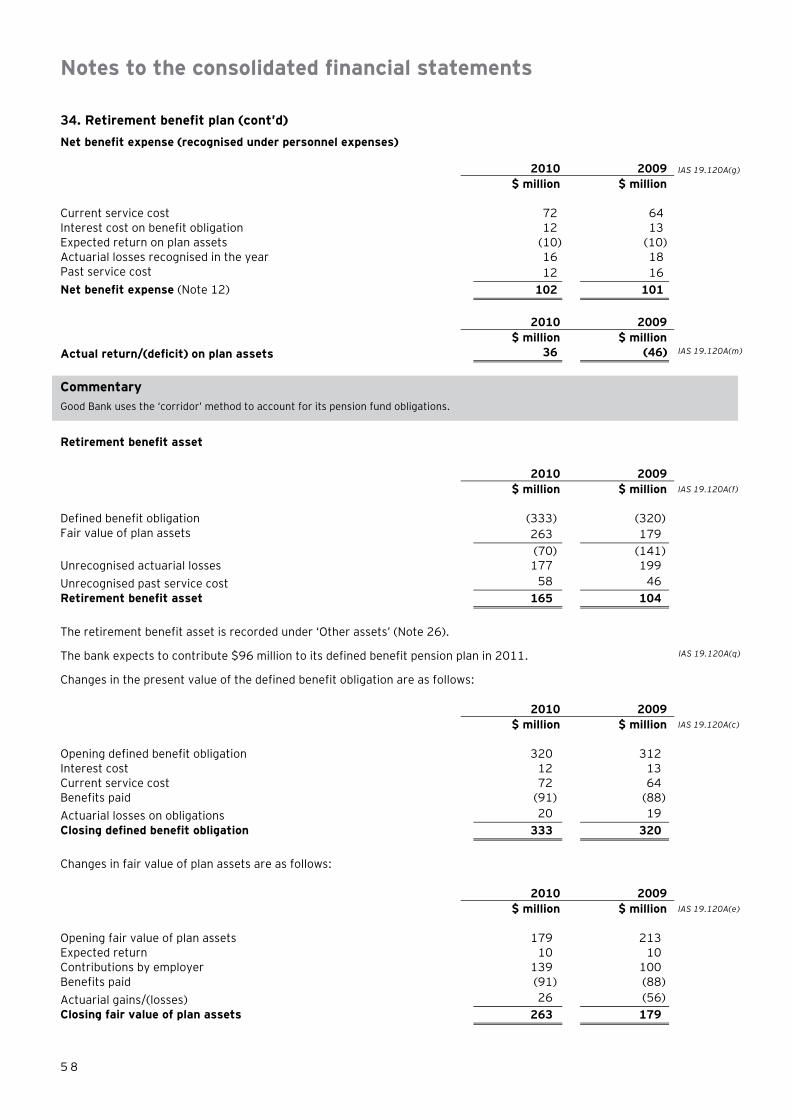
Notes to the consolidated financial statements
5 8
34. Retirement benefit plan (cont’d) Net benefit expense (recognised under personnel expenses)
2010 2009 IAS 19.120A(g)
$ million $ million
Current service cost 72 64
Interest cost on benefit obligation 12 13
Expected return on plan assets (10) (10)
Actuarial losses recognised in the year 16 18
Past service cost 12 16
Net benefit expense (Note 12) 102 101
2010 2009
$ million $ million
Actual return/(deficit) on plan assets 36 (46) IAS 19.120A(m)
Commentary Good Bank uses the ‘corridor’ method to account for its pension fund obligations.
Retirement benefit asset
2010 2009
$ million $ million IAS 19.120A(f)
Defined benefit obligation (333) (320)
Fair value of plan assets 263 179
(70) (141)
Unrecognised actuarial losses 177 199
Unrecognised past service cost 58 46
Retirement benefit asset 165 104
The retirement benefit asset is recorded under ‘Other assets’ (Note 26).
The bank expects to contribute $96 million to its defined benefit pension plan in 2011. IAS 19.120A(q)
Changes in the present value of the defined benefit obligation are as follows:
2010 2009
$ million $ million IAS 19.120A(c)
Opening defined benefit obligation 320 312
Interest cost 12 13
Current service cost 72 64
Benefits paid (91) (88)
Actuarial losses on obligations 20 19
Closing defined benefit obligation 333 320
Changes in fair value of plan assets are as follows:
2010 2009
$ million $ million IAS 19.120A(e)
Opening fair value of plan assets 179 213
Expected return 10 10
Contributions by employer 139 100
Benefits paid (91) (88)
Actuarial gains/(losses) 26 (56)
Closing fair value of plan assets 263 179

Notes to the consolidated financial statements
5 9
34. Retirement benefit costs (cont’d) The pension plan holds shares in the bank with a fair value of $2.7 million (2009: $1.9 million). The plan assets also include property occupied by the bank with a fair value of $4.1 million (2009: $3.9 million).
IAS 19.120A(k)
The major categories of plan assets as a percentage of the fair value of total plan assets are as follows: IAS 19.120A(j)
2010 2009
% %
Equity instruments 73 78
Debt instruments 18 12
Property 7 9
Other assets 2 1
The overall expected rates of return on assets is determined based on the market prices including published brokers’ forecasts prevailing on the date of valuation, applicable to the period over which the obligation is to be settled. There has been a significant change in the expected rate of return on assets due to the diminution in the equity outlook.
IAS 19.120A(l)
The principal assumptions used in determining pension obligations for the bank’s plan are shown below: IAS 19.120A(n)
2010 2009
% %
Discount rate 5.3 5.5
Expected rate of return on assets 5.8 5.9
Future salary increases 3.5 4.0
Future pension increases 2.1 2.1
It has been assumed that the average life expectancy beyond the retirement age of 65 is 17 years for men (2009: 16 years) and 23 years for women (2009: 23 years).
IAS 19.120A (n)(vi)
The most recent actuarial valuations of plan assets and the present value of the defined benefit obligation were carried out on behalf of the bank at 31 December 2010. The present value of the defined benefit obligation, the related current service cost and past service cost were measured using the projected unit credit method.
IAS 19.120A(n)
Amounts for the current and previous four years are as follows:
2010 2009 2008 2007 2006
$ million $ million $ million $ million $ million IAS 19.120A(p)
Defined benefit obligation (333) (320) (312) (302) (297)
Plan assets 263 179 213 174 213
Deficit (70) (141) (99) (128) (84)
Experience adjustments on plan liabilities (24) (16) 24 (16) 34
Experience adjustments on plan assets (52) (56) (72) (56) (51)

Notes to the consolidated financial statements
6 0
35. Issued capital and reserves IAS 1.78(e)
Authorised 2010 2009 IAS 1.79(a)(i)
No. thousand No. thousand
Ordinary shares of $1 each 740,000 740,000 IAS 1.79(a)(iii)
4% Convertible preference shares of $10 each (Note 31) 12,000 12,000
752,000 752,000
Ordinary shares
Issued and fully paid No. thousand $ million IAS 1.79(a)(ii)
IAS 1.79(a)(iv)
At 1 January 2009 641,592 642 IAS 1.106(d)
Issued on 1 December 2009 for cash on exercise of share options (Note 38) 33,000 33
At 31 December 2009 674,592 675
At 31 December 2010 674,592 675
Treasury shares
No. thousand $ million IAS 1.79(a)(vi)
At 1 January 2009 2,620 15
Purchase of treasury shares 1,186 7
Sale of treasury shares (536) (3)
At 31 December 2009 3,270 19
Purchase of treasury shares 806 5
Sale of treasury shares (308) (2)
At 31 December 2010 3,768 22
The treasury shares are bought and sold as part of the bank’s Investment Banking operations.
Share option schemes
The bank has three share option schemes under which options to subscribe for the bank’s shares have been granted to certain executives and senior employees (Note 38).
IFRS 2.44

Notes to the consolidated financial statements
6 1
35. Issued capital and reserves (cont’d) Other reserves
Available–for–sale reserve
Cash flow hedge
reserve
Foreign currency
translation reserve
Other capital
reserve Total IAS 1.78(e)
$ million $ million $ million $ million $ million
At 1 January 2009 236 283 90 102 711
Net unrealised losses on available–for–sale financial investments
(127) – – – (127) IFRS 7.20(a),(ii)
Net realised gains on available–for–sale financial investments reclassified to the income statement
(10) – – – (10) IFRS 7.20(a),(ii)
Net unrealised gains on cash flow hedges – 63 – – 63 IFRS 7.23(c)
Net gains on cash flow hedges reclassified to the income statement
– (18) – – (18) IFRS 7.23(d)
Foreign currency translation – – (53) – (53) IAS 21.39(c)
Net change on hedge of net investment – – 14 – 14
Reversal of impairment of available-for-sale financial investments 77 – – – 77
At 31 December 2009 176 328 51 102 657
Net unrealised losses on available–for–sale financial investments
(75) – – – (75) IFRS 7.20(a)(ii)
Net realised losses on available–for–sale financial investments reclassified to the income statement
9 – – – 9
IFRS 7.20(a)(ii)
Net unrealised gains on cash flow hedges – 143 – – 143 IFRS 7.23(c)
Net gains on cash flow hedges reclassified to the income statement
– (21) – – (21) IFRS 7.23(d)
Foreign currency translation – – (18) – (18) IAS 21.39(c)
Net change on hedge of net investment – – 22 – 22
Reversal of impairment of available-for-sale financial investments
42 – – – 42
At 31 December 2010 152 450 55 102 759
36. Fair value of financial instruments
A. Determination of fair value and fair value hierarchy
The bank uses the following hierarchy for determining and disclosing the fair value of financial instruments by valuation technique:
Level 1: quoted (unadjusted) prices in active markets for identical assets or liabilities;
Level 2: other techniques for which all inputs which have a significant effect on the recorded fair value are observable, either directly or indirectly;
Level 3: techniques which use inputs which have a significant effect on the recorded fair value that are not based on observable market data.
IFRS 7.27A
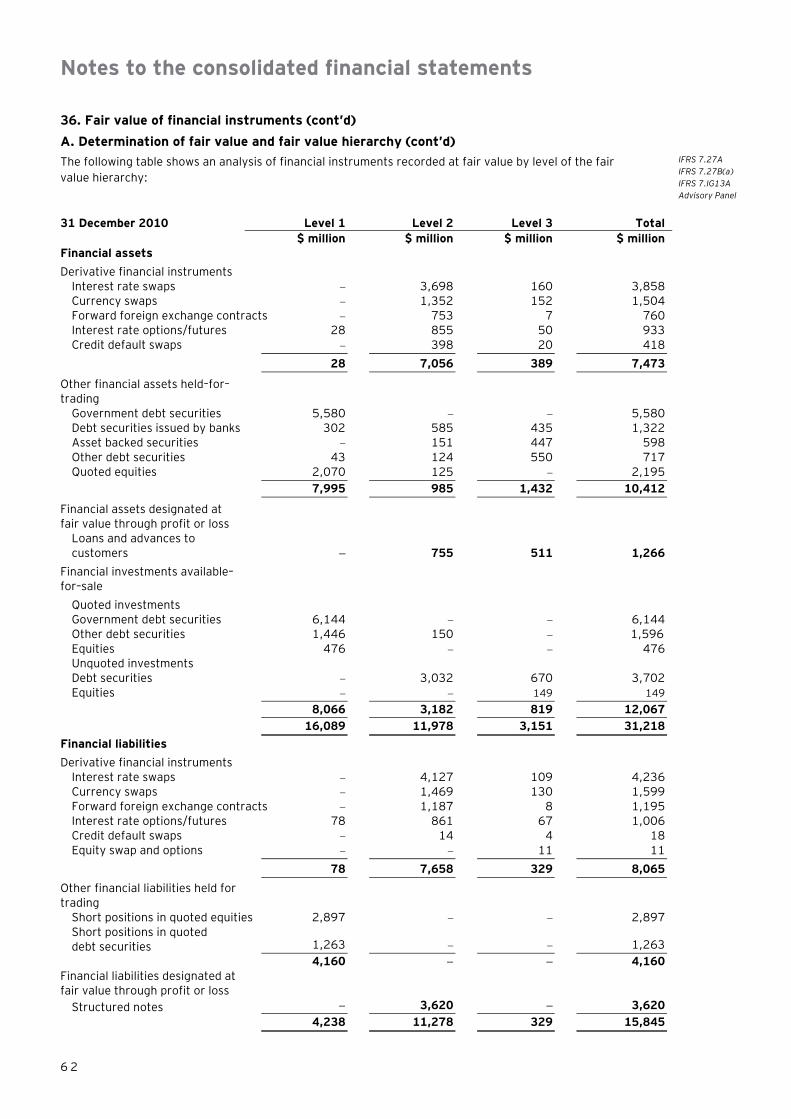
Notes to the consolidated financial statements
6 2
36. Fair value of financial instruments (cont’d) A. Determination of fair value and fair value hierarchy (cont’d)
The following table shows an analysis of financial instruments recorded at fair value by level of the fair value hierarchy:
IFRS 7.27A IFRS 7.27B(a) IFRS 7.IG13A Advisory Panel
31 December 2010 Level 1 Level 2 Level 3 Total $ million $ million $ million $ million Financial assets
Derivative financial instruments
Interest rate swaps � 3,698 160 3,858 Currency swaps � 1,352 152 1,504 Forward foreign exchange contracts � 753 7 760 Interest rate options/futures 28 855 50 933 Credit default swaps � 398 20 418
28 7,056 389 7,473
Other financial assets held–for–trading
Government debt securities 5,580 � � 5,580 Debt securities issued by banks 302 585 435 1,322 Asset backed securities � 151 447 598 Other debt securities 43 124 550 717 Quoted equities 2,070 125 � 2,195 7,995 985 1,432 10,412
Financial assets designated at fair value through profit or loss
Loans and advances to customers � 755 511 1,266
Financial investments available–for–sale
Quoted investments Government debt securities 6,144 � � 6,144 Other debt securities 1,446 150 � 1,596 Equities 476 � � 476 Unquoted investments Debt securities � 3,032 670 3,702 Equities � � 149 149 8,066 3,182 819 12,067 16,089 11,978 3,151 31,218 Financial liabilities Derivative financial instruments Interest rate swaps � 4,127 109 4,236 Currency swaps � 1,469 130 1,599 Forward foreign exchange contracts � 1,187 8 1,195 Interest rate options/futures 78 861 67 1,006 Credit default swaps � 14 4 18 Equity swap and options � � 11 11
78 7,658 329 8,065
Other financial liabilities held for trading
Short positions in quoted equities 2,897 � � 2,897 Short positions in quoted debt securities 1,263 � � 1,263 4,160 � � 4,160 Financial liabilities designated at fair value through profit or loss
Structured notes � 3,620 � 3,620
4,238 11,278 329 15,845

Notes to the consolidated financial statements
6 3
36. Fair value of financial instruments (cont’d) IFRS 7.27A
A. Determination of fair value and fair value hierarchy (cont’d) IFRS 7.27B(a)
31 December 2009 Level 1 Level 2 Level 3 Total IFRS 7.1913A
$ million $ million $ million $ million Advisory Panel
Financial assets
Derivative financial instruments
Interest rate swaps � 3,641 � 3,641
Currency swaps 67 1,361 � 1,428
Forward foreign exchange contracts � 752 � 752
Interest rate options/futures 16 864 38 918
Credit default swaps � � 405 405
83 6,618 443 7,144
Other financial assets held–for–trading
Government debt securities 5,319 255 � 5,574 Debt securities issued by banks 726 408 190 1,324 Asset backed securities � 377 210 587 Other debt securities 65 162 471 698 Quoted equities 1,574 611 � 2,185
7,684 1,813 871 10,368 Financial assets designated at fair value through profit or loss
Loans and advances to customers � 1,233 8 1,241
Financial investments available–for–sale
Quoted investments Government debt securities 6,411 � � 6,411
Other debt securities 1,555 100 � 1,655
Equities 478 � � 478
Unquoted investments Debt securities � 3,438 180 3,614
Equities � 118 28 146
8,444 3,652 208 12,304
16,211 13,316 1,530 31,057
Financial liabilities Derivative financial instruments
Interest rate swaps � 4,105 � 4,105
Currency swaps 175 1,329 � 1,504
Forward foreign exchange contracts � 1,183 � 1,183
Interest rate options/futures � 983 18 1,001
Credit default swaps � 16 5 21
Equity swap and options � � 12 12
175 7,616 35 7,826
Other financial liabilities held for trading
Short positions in quoted equities 2,765 � � 2,765 Short positions in quoted debt securities 1,313 � � 1,313
4,078 � � 4,078 Financial liabilities designated at fair value through profit or loss
Structured notes � 3,549 � 3,549
4,253 11,165 35 15,453

Notes to the consolidated financial statements
6 4
36. Fair value of financial instruments (cont’d) A. Determination of fair value and fair value hierarchy (cont’d) Financial instruments recorded at fair value IFRS 7.27
The following is a description of how fair values are determined for financial instruments that are recorded at fair value using valuation techniques. These incorporate the bank’s estimate of assumptions that a market participant would make when valuing the instruments.
Derivatives
Derivative products valued using a valuation technique with market observable inputs are mainly interest rate swaps and options, currency swaps and forward foreign exchange contracts. The most frequently applied valuation techniques include forward pricing and swap models, using present value calculations. The models incorporate various inputs including the credit quality of counterparties, foreign exchange spot and forward rates and interest rate curves.
Derivative products valued using a valuation technique with significant non–market observable inputs are long dated contracts (interest rate swaps, currency swaps, forwards foreign exchange contracts, option contracts and certain credit default swaps). These derivatives are valued using models that calculate the present value such as credit models (e.g., default rate models or credit spread models) and the binomial model for options. The models incorporate various non–observable assumptions that include the credit spread of the reference asset for credit default swaps, and market rate volatilities.
A Credit Valuation Adjustment (CVA) is applied to the bank’s over-the-counter derivative exposures to take into account the counterparty’s risk of default when measuring the fair value of the derivative. CVA is the mark-to-market cost of protection required to hedge credit risk from counterparties in the Bank’s over-the-counter derivatives portfolio. CVA is calculated by multiplying the probability of default (PD), the loss given default (LGD) and the expected exposure (EE) at the time of default.
The bank calculates EE using a Monte Carlo simulation at a counter-party level. The model inputs include market values from current market data and model parameters implied from quoted market prices. These are updated at each measurement date. Collateral and netting arrangements are taken into account where applicable. PDs and LGDs are derived from a credit spread simulation based on a deterministic model or a Monte-Carlo model that incorporates rating migration and market observable data where available.
CVAs are also applied to the bank’s credit derivative exposures with monoline insurers. The expected exposure is derived by simulating default scenarios using market observable parameters, forecast information and the monoline’s credit rating.
Due to recent turmoil in global markets, in the current year the bank has applied CVA to derivatives with highly rated sovereign or government counterparties.
A Debit Valuation Adjustment (DVA) is applied to incorporate the bank’s own credit risk in the fair value of derivatives (that is, the risk that the bank might default on its contractual obligations), using the same methodology as for CVA.
The following table summarises the total CVA and DVA adjustments applied to derivative instruments:
$ million 2010 2009 CVA Derivative counterparties 299 400 CVA Monoline counterparties 608 951 907 1,351 DVA 34 56

Notes to the consolidated financial statements
6 5
36. Fair value of financial instruments (cont’d) A. Determination of fair value and fair value hierarchy (cont’d) Financial investments – available–for–sale
Available–for–sale financial assets valued using valuation techniques or pricing models primarily consist of unquoted equities and debt securities.
These assets are valued using models that use both observable and un–observable data. The non–observable inputs to the models include assumptions regarding the future financial performance of the investee, its risk profile, and economic assumptions regarding the industry and geographical jurisdiction in which the investee operates.
Other trading assets Other trading assets valued using a valuation technique consists of certain debt securities and asset–backed securities. The bank values the securities using discounted cash flow valuation models which incorporate observable and un–observable data. Observable inputs include assumptions regarding current rates of interest and broker statements. Unobservable inputs include assumptions regarding expected future default rates, prepayment rates and market liquidity discounts.
Loans and receivables designated at fair value through profit or loss
For loans and receivables designated at fair value through profit or loss, a discounted cash flow model is used based on various assumptions, including current and expected future credit losses, market rates of interest, prepayment rates and assumptions regarding market liquidity, where relevant.
Other liabilities designated at fair value through profit or loss
For unquoted notes issued, a discounted cash flow model is used based on a current interest rate yield curve appropriate for the remaining term to maturity adjusted for market liquidity and credit spreads.
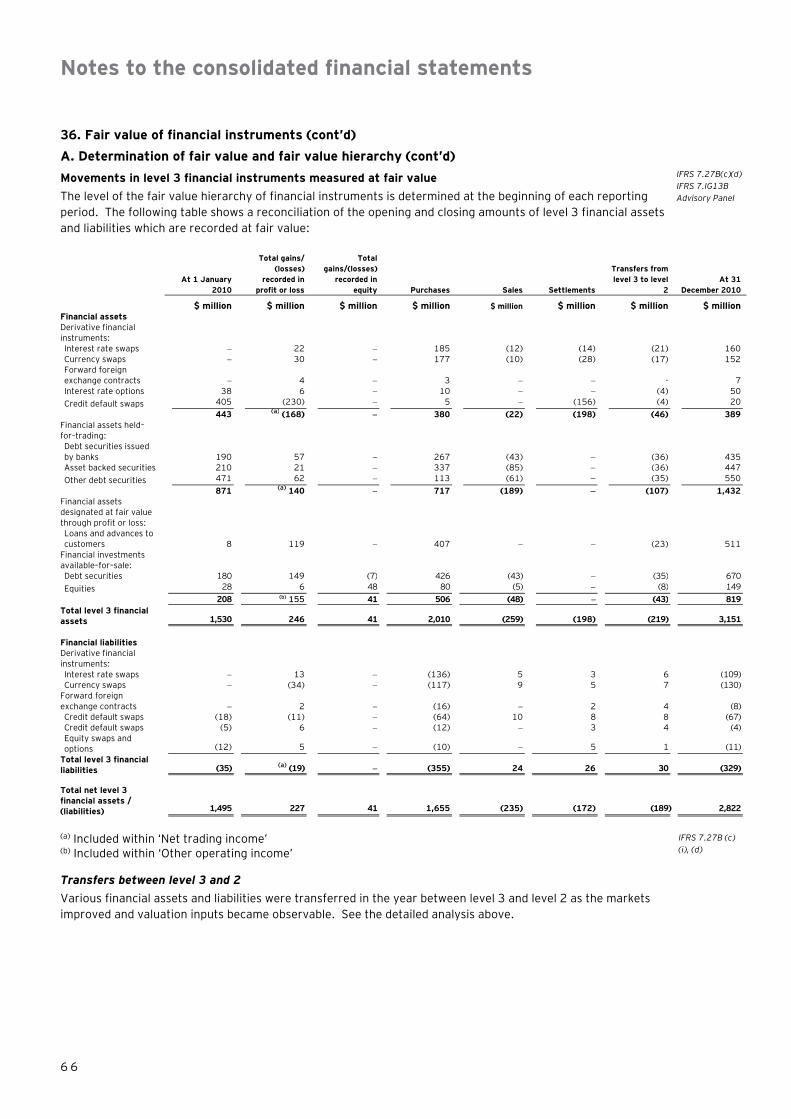
Notes to the consolidated financial statements
6 6
36. Fair value of financial instruments (cont’d) A. Determination of fair value and fair value hierarchy (cont’d) Movements in level 3 financial instruments measured at fair value The level of the fair value hierarchy of financial instruments is determined at the beginning of each reporting period. The following table shows a reconciliation of the opening and closing amounts of level 3 financial assets and liabilities which are recorded at fair value:
IFRS 7.27B(c)(d) IFRS 7.IG13B Advisory Panel
At 1 January
2010
Total gains/ (losses)
recorded in profit or loss
Total gains/(losses)
recorded in equity Purchases Sales Settlements
Transfers from level 3 to level
2 At 31
December 2010 $ million $ million $ million $ million $ million $ million $ million $ million Financial assets Derivative financial instruments: Interest rate swaps � 22 � 185 (12) (14) (21) 160 Currency swaps � 30 � 177 (10) (28) (17) 152 Forward foreign exchange contracts � 4 � 3 � � - 7 Interest rate options 38 6 � 10 � � (4) 50 Credit default swaps 405 (230) � 5 � (156) (4) 20
443 (a) (168) � 380 (22) (198) (46) 389 Financial assets held–for–trading: Debt securities issued by banks 190 57 � 267 (43) � (36) 435 Asset backed securities 210 21 � 337 (85) � (36) 447 Other debt securities 471 62 � 113 (61) � (35) 550
871 (a) 140 � 717 (189) � (107) 1,432 Financial assets designated at fair value through profit or loss: Loans and advances to customers 8 119 � 407 � � (23) 511
Financial investments available–for–sale: Debt securities 180 149 (7) 426 (43) � (35) 670 Equities 28 6 48 80 (5) � (8) 149
208 (b) 155 41 506 (48) � (43) 819 Total level 3 financial assets 1,530 246 41 2,010 (259) (198) (219) 3,151 Financial liabilities Derivative financial instruments: Interest rate swaps � 13 � (136) 5 3 6 (109) Currency swaps � (34) � (117) 9 5 7 (130)
Forward foreign exchange contracts � 2 � (16) � 2 4 (8) Credit default swaps (18) (11) � (64) 10 8 8 (67) Credit default swaps (5) 6 � (12) � 3 4 (4) Equity swaps and options (12) 5 � (10) � 5 1 (11)
Total level 3 financial liabilities (35) (a) (19) � (355) 24 26 30 (329) Total net level 3 financial assets / (liabilities) 1,495 227 41 1,655 (235) (172) (189) 2,822
(a) Included within ‘Net trading income’ (b) Included within ‘Other operating income’
IFRS 7.27B (c) (i), (d)
Transfers between level 3 and 2
Various financial assets and liabilities were transferred in the year between level 3 and level 2 as the markets improved and valuation inputs became observable. See the detailed analysis above.

Notes to the consolidated financial statements
6 7
36. Fair value of financial instruments (cont’d) IFRS
7.27B(c),(d)
A. Determination of fair value and fair value hierarchy (cont’d) IFRS 7.161.3B Advisory Panel
At 1 January
2009
Total gains/ (losses)
recorded in profit or loss
Total gains/(losses)
recorded in equity Purchases Sales Settlements
Transfers from level 1 and
level 2 At 31 December
2009 $ million $ million $ million $ million $ million $ million $ million $ million Derivative financial instruments: Interest rate options 5 6 � 13 (5) (21) 40 38 Credit default swaps 368 2 � 22 (17) (7) 37 405
373 8 � 35 (22) (28) 77 443 Financial assets held–for–trading: Debt securities issued by banks 137 (39) � 117 (53) � 28 190 Asset backed securities 285 (116) � 13 (32) � 60 210 Other debt securities 459 (109) � 168 (99) � 52 471
881 (a) (264) � 298 (184) � 140 871 Financial assets designated at fair value through profit or loss: Loans and advances to customers 10 (b)1 � � (3) � � 8
Financial investments available–for–sale: Unquoted investments Debt securities 60 (10) 6 10 (46) � 160 180 Equities 5 (5) 7 4 (9) � 26 28
65 (b) (15) 13 14 (55) � 186 208 Total level 3 financial assets 1,329 (270) 13 347 (264) (28) 403 1,530 Financial liabilities Derivative financial instruments: Interest rate options (19) (7) � � � 8 � (18) Credit default swaps (4) (2) � � � 1 � (5) Equity swaps and options (13) (9) � � � 10 � (12)
Total level 3 financial liabilities (36) (a) (18) � � � 19 � (35) Total net level 3 financial assets / (liabilities) 1,293 (288) 13 347 (264) (9) 403 1,495
(a) Included within ‘Net trading income’ (b) Included within ‘Other operating income’
IFRS 7.2
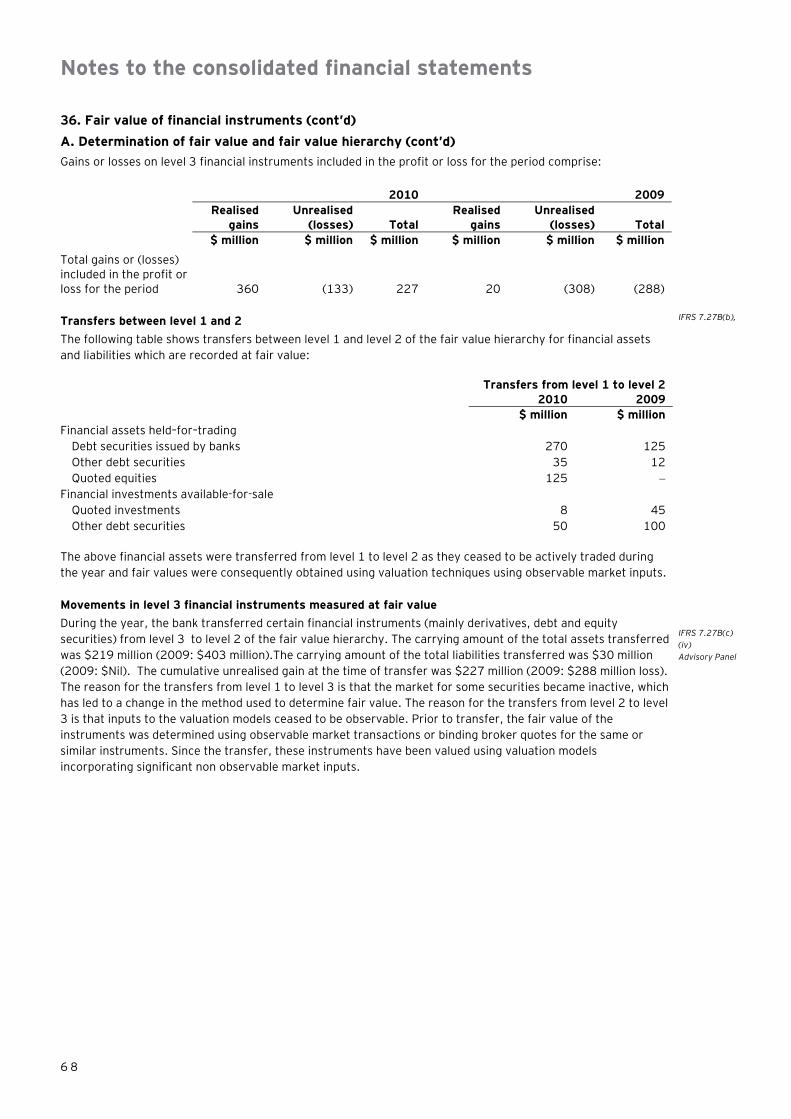
Notes to the consolidated financial statements
6 8
36. Fair value of financial instruments (cont’d) A. Determination of fair value and fair value hierarchy (cont’d) Gains or losses on level 3 financial instruments included in the profit or loss for the period comprise:
2010 2009 Realised
gains Unrealised
(losses) Total Realised
gains Unrealised
(losses) Total
$ million $ million $ million $ million $ million $ million
Total gains or (losses) included in the profit or loss for the period 360 (133) 227 20 (308) (288)
Transfers between level 1 and 2 The following table shows transfers between level 1 and level 2 of the fair value hierarchy for financial assets and liabilities which are recorded at fair value:
IFRS 7.27B(b),
Transfers from level 1 to level 2 2010 2009 $ million $ million Financial assets held–for–trading Debt securities issued by banks 270 125 Other debt securities 35 12 Quoted equities 125 � Financial investments available-for-sale Quoted investments 8 45 Other debt securities 50 100 The above financial assets were transferred from level 1 to level 2 as they ceased to be actively traded during the year and fair values were consequently obtained using valuation techniques using observable market inputs.
Movements in level 3 financial instruments measured at fair value
During the year, the bank transferred certain financial instruments (mainly derivatives, debt and equity securities) from level 3 to level 2 of the fair value hierarchy. The carrying amount of the total assets transferred was $219 million (2009: $403 million).The carrying amount of the total liabilities transferred was $30 million (2009: $Nil). The cumulative unrealised gain at the time of transfer was $227 million (2009: $288 million loss). The reason for the transfers from level 1 to level 3 is that the market for some securities became inactive, which has led to a change in the method used to determine fair value. The reason for the transfers from level 2 to level 3 is that inputs to the valuation models ceased to be observable. Prior to transfer, the fair value of the instruments was determined using observable market transactions or binding broker quotes for the same or similar instruments. Since the transfer, these instruments have been valued using valuation models incorporating significant non observable market inputs.
IFRS 7.27B(c) (iv) Advisory Panel

Notes to the consolidated financial statements
6 9
36. Fair value of financial instruments (cont’d)
A. Determination of fair value and fair value hierarchy (cont’d)
Impact on fair value of level 3 financial instruments measured at fair value of changes to key assumptions IFRS 7.27B(e )
The following table shows the impact on the fair value of level 3 instruments of using reasonably possible alternative assumptions by class of instrument. The positive and negative effects are approximately the same.
31 December 2010 31 December 2009
Carrying amount
Effect of reasonably possible alternative
assumptions Carrying amount
Effect of reasonably possible alternative
assumptions
$ million $ million $ million $ million
Financial assets Derivative financial instruments
Interest rate swaps 167 - - - Currency swaps 152 6 � � Forward foreign exchange contracts 7 5 � � Interest rate options 43 � 38 � Credit default swaps 20 3 405 3 Debt securities held–for–trading 435 7 190 1 Asset backed securities 447 57 210 29 Debt securities issued by banks and other debt securities 550 45 471 29
Financial assets designated at fair value through profit or loss
Loans and advances to customers 511 26 8 1 Financial investments – available–for–sale
Unquoted investments Debt securities 670 24 180 10 Equities 149 7 28 5
Financial liabilities Derivative financial instruments
Interest rate swaps (120) 7 � � Credit swaps (130) 11 � � Forward foreign exchange contracts (8) 3 � �
Interest rate options (56) 16 (18) 3 Credit default swaps (4) � (5) 1 Equity swaps and options (11) 2 (12) 1
In order to determine reasonably possible alternative assumptions the bank adjusted key unobservable models inputs as follows:
� For interest rate swaps and options, currency swaps, forward foreign exchange contracts and equity swaps and options, the bank adjusted the probability of default and loss given default assumptions used to calculate the credit valuation adjustment. The adjustment made was to increase and decrease the assumptions within a range of between seven and ten per cent, depending on the individual characteristics of the derivative instrument.
� For credit default swaps and loans and advances to customers designated at fair value through profit or loss, the bank adjusted the probability of default and loss given default assumptions by increasing and decreasing the assumptions by five per cent, which is a range that is consistent with the bank’s internal credit risk ratings for the counterparties.
� For other unobservable inputs (those inputs for which there is little or no current observable date available), the bank may use consensus pricing from brokers, from industry publications and other industry materials. These inputs are adjusted to increase or decrease by 10%.
IFRS 7.27B(e )
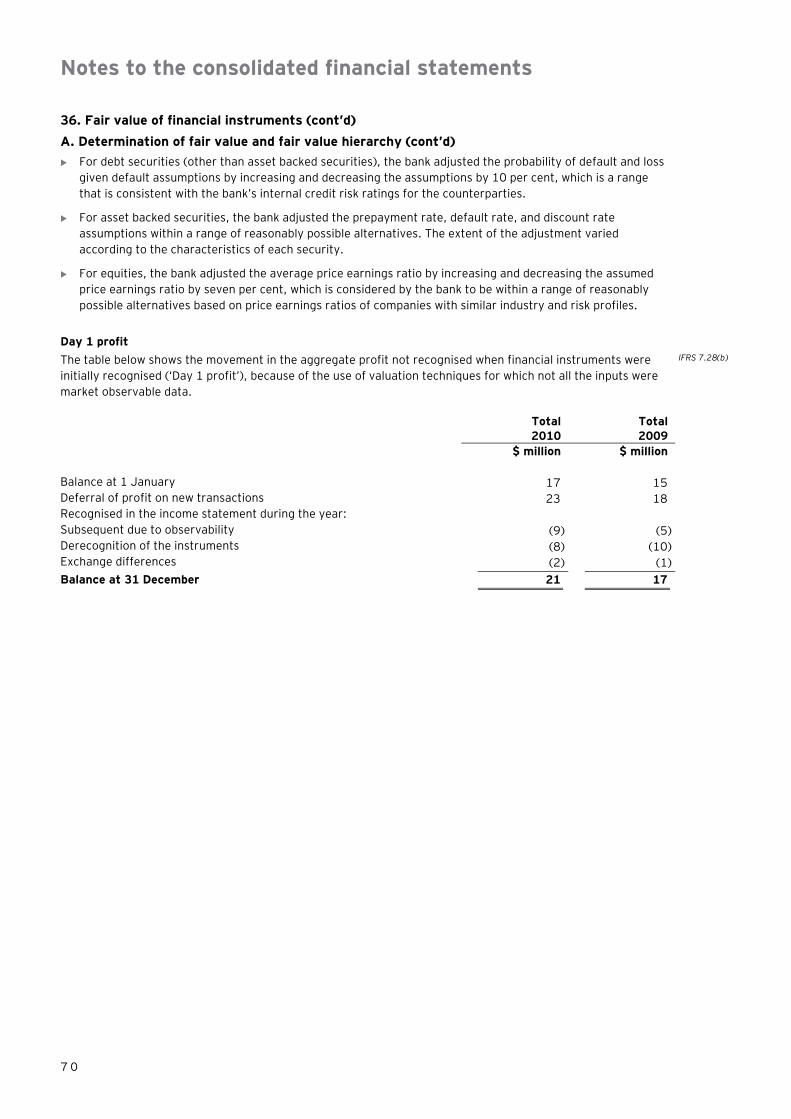
Notes to the consolidated financial statements
7 0
36. Fair value of financial instruments (cont’d)
A. Determination of fair value and fair value hierarchy (cont’d)
� For debt securities (other than asset backed securities), the bank adjusted the probability of default and loss given default assumptions by increasing and decreasing the assumptions by 10 per cent, which is a range that is consistent with the bank’s internal credit risk ratings for the counterparties.
� For asset backed securities, the bank adjusted the prepayment rate, default rate, and discount rate assumptions within a range of reasonably possible alternatives. The extent of the adjustment varied according to the characteristics of each security.
� For equities, the bank adjusted the average price earnings ratio by increasing and decreasing the assumed price earnings ratio by seven per cent, which is considered by the bank to be within a range of reasonably possible alternatives based on price earnings ratios of companies with similar industry and risk profiles.
Day 1 profit
The table below shows the movement in the aggregate profit not recognised when financial instruments were initially recognised (‘Day 1 profit’), because of the use of valuation techniques for which not all the inputs were market observable data.
IFRS 7.28(b)
Total Total
2010 2009
$ million $ million
Balance at 1 January 17 15
Deferral of profit on new transactions 23 18
Recognised in the income statement during the year:
Subsequent due to observability (9) (5)
Derecognition of the instruments (8) (10)
Exchange differences (2) (1)
Balance at 31 December 21 17

Notes to the consolidated financial statements
7 1
36. Fair value of financial instruments (cont’d)
A. Determination of fair value and fair value hierarchy (cont’d)
Set out below is a comparison, by class, of the carrying amounts and fair values of the bank’s financial instruments that are not carried at fair value in the financial statements. This table does not include the fair values of non–financial assets and non–financial liabilities.
2010 2009
Carrying amount
Fair value
Carrying amount
Fair value
$ million $ million $ million $ million IFRS 7.25 IFRS 7.26
Financial assets
Cash and balances with central bank 2,750 2,750 2,702 2,702
Due from banks
Placement with other banks 6,244 6,013 6,190 5,616
Loans and advances 4,159 3,886 4,107 3,634
Other amounts due 201 189 192 140
10,604 10,088 10,489 9,390
Cash collateral on securities borrowed and reverse repurchase agreements 7,628 7,510 7,673 7,459
Loans and advances to customers
Corporate lending 12,493 11,621 12,296 10,669
Small business lending 4,550 4,313 4,597 4,369
Consumer lending 17,816 16,894 17,538 16,298
Residential mortgages 13,065 11,861 12,732 10,941
47,924 44,689 47,163 42,277
Financial investments – held–to–maturity 141 112 127 100
69,047 65,149 68,154 61,928
Financial liabilities
Due to banks 3,222 3,194 3,174 3,131
Cash collateral on securities lent and repurchase agreements 15,169 14,849 15,214 15,201
Due to customers 53,143 53,111 53,177 53,150
Debt issued and other borrowed funds 5,310 5,260 5,179 5,128
Other financial liabilities 2,097 2,092 2,057 2,049
78,941 78,506 78,801 78,659
Fair value of financial assets and liabilities not carried at fair value IFRS 7.25
The following describes the methodologies and assumptions used to determine fair values for those financial instruments which are not already recorded at fair value in the financial statements:
IFRS 7.26 IFRS 7.27
Assets for which fair value approximates carrying value IFRS 7.29(a)
For financial assets and financial liabilities that have a short term maturity (less than three months) it is assumed that the carrying amounts approximate to their fair value. This assumption is also applied to demand deposits, and savings accounts without a specific maturity.
Fixed rate financial instruments
The fair value of fixed rate financial assets and liabilities carried at amortised cost are estimated by comparing market interest rates when they were first recognised with current market rates for similar financial instruments. The estimated fair value of fixed interest bearing deposits is based on discounted cash flows using prevailing money–market interest rates for debts with similar credit risk and maturity. For quoted debt issued the fair values are determined based on quoted market prices. For those notes issued where quoted market prices are not available, a discounted cash flow model is used based on a current interest rate yield curve appropriate for the remaining term to maturity and credit spreads. For other variable rate instruments an adjustment is also made to reflect the change in required credit spread since the instrument was first recognised.

Notes to the consolidated financial statements
7 2
36. Fair value of financial instruments (cont’d)
B. Reclassification of financial assets
Following the amendments to IAS 39 and IFRS 7 Reclassification of Financial Assets (effective from 1 July 2008), the bank undertook a review of assets that were classified as held–for–trading. Where it was determined that the market for an asset is no longer active, and the bank no longer intends to trade, management reviewed the instrument to determine whether it was appropriate to reclassify it to ‘Loans and Receivables’.
The following tables shows the carrying amount and fair value of financial assets reclassified from ‘Held–for–Trading’ to the ‘Loans and Receivables’ category, as at the date of reclassification and as at the reporting date. All transfers occurred on 1 July 2008. 2009 and 2010 have seen improvements in global market conditions and accordingly there have been no reclassifications in those years.
Commentary IFRS 7.12A(c) requires, for a financial asset that was reclassified in accordance with IAS 39.50B, a disclosure of the “rare” situation, and of the facts and circumstances indicating that the situation was rare.
This disclosure is not provided in these financial statements since the bank has only reclassified assets that would have met the definition of loans and receivables, and so can be reclassified even in non–rare situations.
MBS super senior
notes MBS senior notes MBS junior notes IFRS 7.12A(a)(b)
Carrying amount Fair value
Carrying amount Fair value
Carrying amount Fair value
$ million $ million $ million $ million $ million $ million
Financial assets previously reclassified as at 31 December 2010 92 86 27 17 16 7
Financial assets previously reclassified as at 31 December 2009 85 74 25 15 14 5
MBS super senior notes
MBS senior notes
MBS junior notes Total
$ million $ million $ million $ million
Expected undiscounted cash recoveries, as assessed at the date of reclassification 120 13 5 138 IFRS 7.12A(f)
% % %
Anticipated average EIR over the remaining life of the assets 8 10 14 IFRS 7.12A(f)
The following table shows the total fair value gains or losses and net interest income that would have been recognised during the period subsequent to reclassification if the bank had not reclassified financial assets from the ‘Held–for–Trading’ to the ‘Loans and Receivables’ category. This disclosure is provided for information purposes only; it does not reflect what has actually been recorded in the financial statements of the bank.
IFRS 7.12A(e)
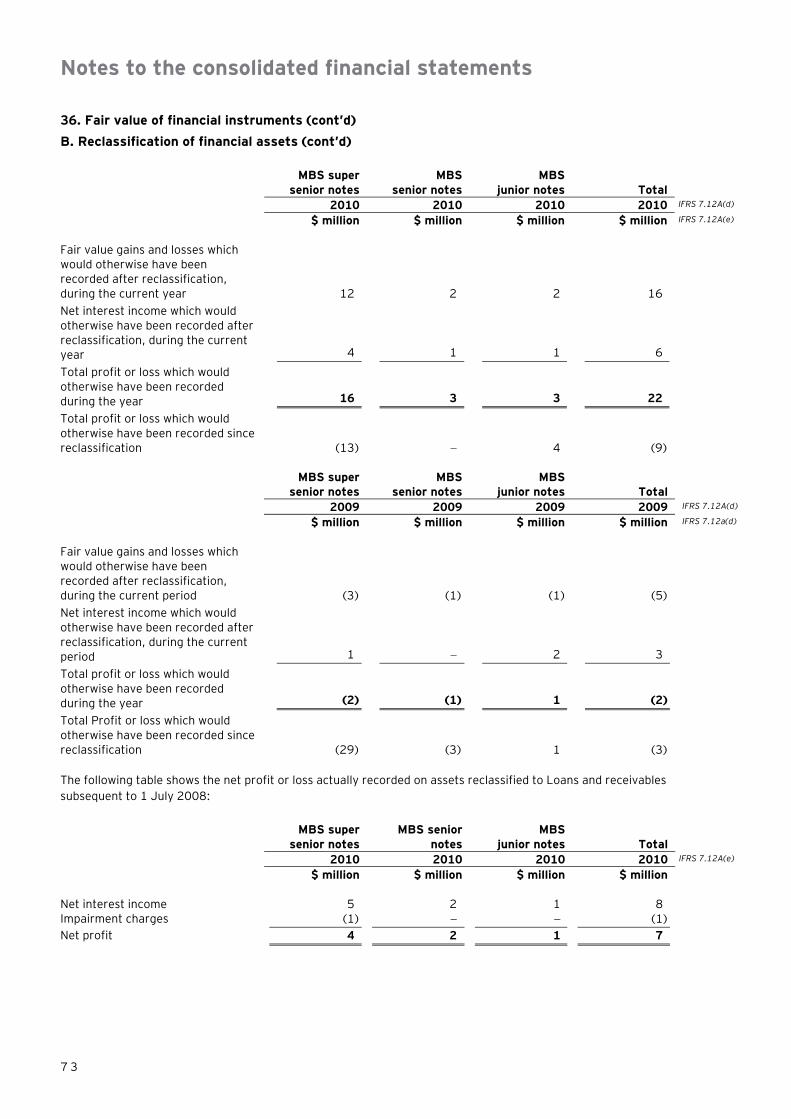
Notes to the consolidated financial statements
7 3
36. Fair value of financial instruments (cont’d) B. Reclassification of financial assets (cont’d)
MBS super senior notes
MBS senior notes
MBS junior notes Total
2010 2010 2010 2010 IFRS 7.12A(d)
$ million $ million $ million $ million IFRS 7.12A(e)
Fair value gains and losses which would otherwise have been recorded after reclassification, during the current year 12 2 2 16
Net interest income which would otherwise have been recorded after reclassification, during the current year 4 1 1 6
Total profit or loss which would otherwise have been recorded during the year 16 3 3 22
Total profit or loss which would otherwise have been recorded since reclassification (13) � 4 (9)
MBS super senior notes
MBS senior notes
MBS junior notes Total
2009 2009 2009 2009 IFRS 7.12A(d)
$ million $ million $ million $ million IFRS 7.12a(d)
Fair value gains and losses which would otherwise have been recorded after reclassification, during the current period (3) (1) (1) (5)
Net interest income which would otherwise have been recorded after reclassification, during the current period 1 � 2 3
Total profit or loss which would otherwise have been recorded during the year (2) (1) 1 (2)
Total Profit or loss which would otherwise have been recorded since reclassification (29) (3) 1 (3)
The following table shows the net profit or loss actually recorded on assets reclassified to Loans and receivables subsequent to 1 July 2008:
MBS super senior notes
MBS senior notes
MBS junior notes Total
2010 2010 2010 2010 IFRS 7.12A(e)
$ million $ million $ million $ million
Net interest income 5 2 1 8
Impairment charges (1) � � (1)
Net profit 4 2 1 7
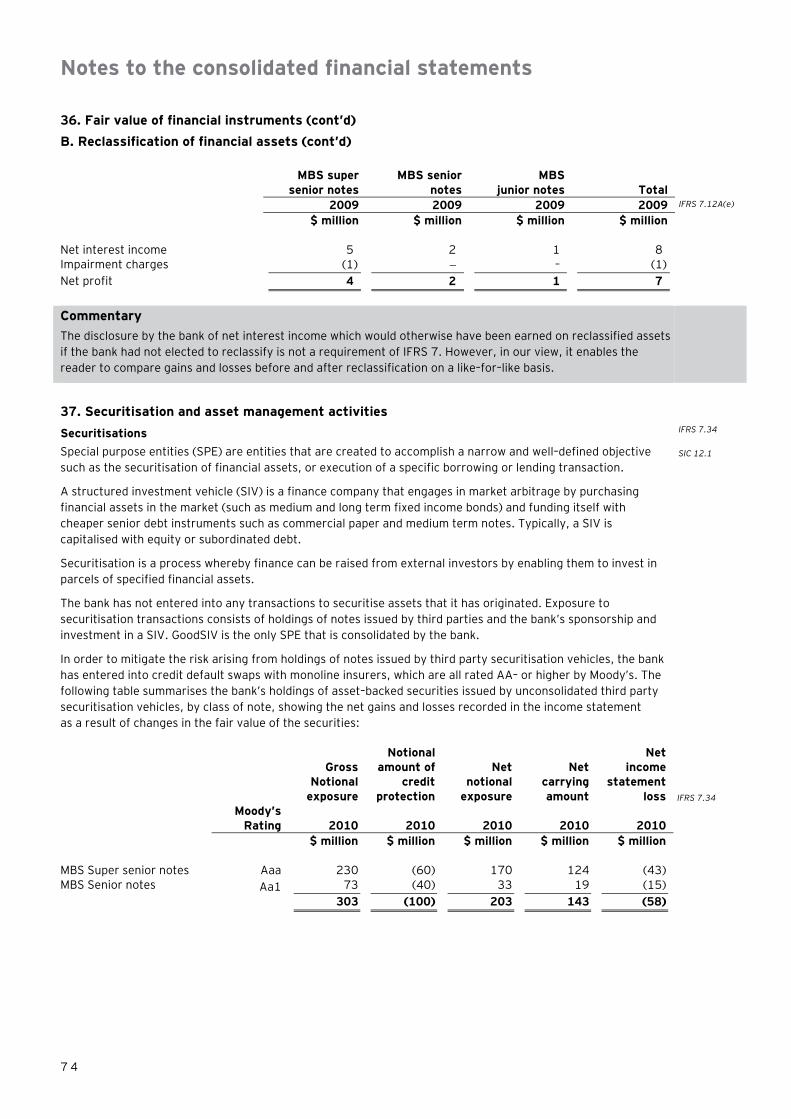
Notes to the consolidated financial statements
7 4
36. Fair value of financial instruments (cont’d)
B. Reclassification of financial assets (cont’d)
MBS super senior notes
MBS senior notes
MBS junior notes Total
2009 2009 2009 2009 IFRS 7.12A(e)
$ million $ million $ million $ million
Net interest income 5 2 1 8
Impairment charges (1) � – (1)
Net profit 4 2 1 7
Commentary
The disclosure by the bank of net interest income which would otherwise have been earned on reclassified assets if the bank had not elected to reclassify is not a requirement of IFRS 7. However, in our view, it enables the reader to compare gains and losses before and after reclassification on a like–for–like basis.
37. Securitisation and asset management activities
Securitisations Special purpose entities (SPE) are entities that are created to accomplish a narrow and well–defined objective such as the securitisation of financial assets, or execution of a specific borrowing or lending transaction.
A structured investment vehicle (SIV) is a finance company that engages in market arbitrage by purchasing financial assets in the market (such as medium and long term fixed income bonds) and funding itself with cheaper senior debt instruments such as commercial paper and medium term notes. Typically, a SIV is capitalised with equity or subordinated debt.
IFRS 7.34 SIC 12.1
Securitisation is a process whereby finance can be raised from external investors by enabling them to invest in parcels of specified financial assets.
The bank has not entered into any transactions to securitise assets that it has originated. Exposure to securitisation transactions consists of holdings of notes issued by third parties and the bank’s sponsorship and investment in a SIV. GoodSIV is the only SPE that is consolidated by the bank.
In order to mitigate the risk arising from holdings of notes issued by third party securitisation vehicles, the bank has entered into credit default swaps with monoline insurers, which are all rated AA– or higher by Moody’s. The following table summarises the bank’s holdings of asset–backed securities issued by unconsolidated third party securitisation vehicles, by class of note, showing the net gains and losses recorded in the income statement as a result of changes in the fair value of the securities:
Gross Notional
exposure
Notional amount of
credit protection
Net notional
exposure
Net carrying amount
Net income
statement loss IFRS 7.34
Moody’s Rating 2010 2010 2010 2010 2010
$ million $ million $ million $ million $ million
MBS Super senior notes Aaa 230 (60) 170 124 (43)
MBS Senior notes Aa1 73 (40) 33 19 (15)
303 (100) 203 143 (58)

Notes to the consolidated financial statements
7 5
37. Securitisation and asset management activities (cont’d)
Gross Notional
exposure
Notional amount of
credit protection
Net notional
exposure
Net carrying amount
Net income
statement loss IFRS 7.34
Moody’s Rating 2009 2009 2009 2009 2009
$ million $ million $ million $ million $ million
MBS Super senior notes Aaa 270 (75) 195 159 (34)
MBS Senior notes Aa1 50 (15) 35 24 (7)
320 (90) 230 183 (41)
The following table shows the bank’s holdings of asset–backed securities issued by unconsolidated third party securitisation vehicles, by type of underlying collateral:
IFRS 7.34
Gross notional
exposure
Notional amount of
credit protection
Net notional
exposure
Net carrying amount
Net income
statement loss
2010 2010 2010 2010 2010
$ million $ million $ million $ million $ million
US sub–prime mortgage–related assets 42 (42) � � �
US Alt–A mortgage–related assets 80 (14) 66 15 (10)
Commercial mortgage–related assets 72 (10) 62 59 (31)
Other prime mortgage–related assets 109 (34) 75 69 (17)
303 (100) 203 143 (58)
Gross notional
exposure
Notional amount of
credit protection
Net notional
exposure
Net carrying amount
Net income
statement loss
2009 2009 2009 2009 2009
$ million $ million $ million $ million $ million
US sub–prime mortgage–related assets 40 (40) � � �
US Alt–A mortgage–related assets 110 (20) 90 40 (19)
Commercial mortgage–related assets 40 (5) 35 43 (9)
Other prime mortgage–related assets 130 (25) 105 100 (13)
320 (90) 230 183 (41)
The gross notional exposure shown in the table above includes both mortgage–related assets that are protected by credit default swaps and those that are not protected. In order to show the net risk position of the bank, the net carrying amounts and net notional exposures disclosed include only those positions that are not economically hedged through credit default swaps that are referenced to individual securities.
Except for certain securities which were reclassified during the year (see Note 37(B)), all notes are classified as ‘Held–for–trading’ at 31 December 2010, with gains and losses recorded in ‘Net trading income’. The bank does not hold any asset–backed securities where the underlying loan collateral is not held by the entity issuing the security.
The following table shows the credit protection obtained by the bank and the level of credit risk adjustments made against the protection to reflect the counterparty risk to the provider of that protection.

Notes to the consolidated financial statements
7 6
37. Securitisation and asset management activities (cont’d)
Notional Amount
Carrying amount of protected
assets
Carrying amount of derivative before
credit risk adjustments
Cumulative credit risk
adjustments
Carrying amount after
credit risk adjustments
$ million $ million $ million $ million $ million
At 31 December 2010 100 80 75 (44) 31
At 31 December 2009 90 87 43 (22) 21
Commentary The disclosure concerning special purpose entities is not specifically a requirement of IFRS 7, but it provides enhanced disclosures for key credit markets exposures, as is recommended by bodies such as the Financial Stability Forum. In practice, entities will need to assess the extent of their exposures emanating from the recent market turmoil and tailor their disclosures accordingly.
Structured investment vehicle
During 2006, the bank sponsored the formation of a structured investment vehicle (SIV), GoodSIV Ltd (GoodSIV). GoodSIV holds a range of investment grade asset–backed securities that were originated from third party entities. GoodSIV has sourced its funding by issuing securities to the bank and to external investors. The bank has extended liquidity facilities to GoodSIV to support any short term liquidity requirements. The bank has concluded that the combination of its holdings of securities issued by GoodSIV, together with the provision of the liquidity facility, indicates that it has control over GoodSIV. Therefore, GoodSIV is consolidated by the bank.
SIC 12.10
37. Securitisation and asset management activities (cont’d)
The following table summarises GoodSIV’s funding:
Held by
third parties Held by
the bank Total IFRS 7.34
Moody’s Rating
2010 2010 2010
$ million $ million $ million
Commercial paper Aaa 450 50 500
Medium term notes A1 39 51 90
Capital notes Baa2 � 40 40
489 141 630
Held by
third parties Held by
the bank
Total
Moody’s Rating
2009 2009 2009
$ million $ million $ million
Commercial paper Aaa 450 50 500
Medium term notes A1 20 61 81
Capital notes Baa2 � 46 46
470 157 627
The following table shows GoodSIV’s assets and profit or loss recorded during the year, by type of asset. These positions have been included in the bank’s consolidated financial statements in the ‘Asset–backed securities’ class:
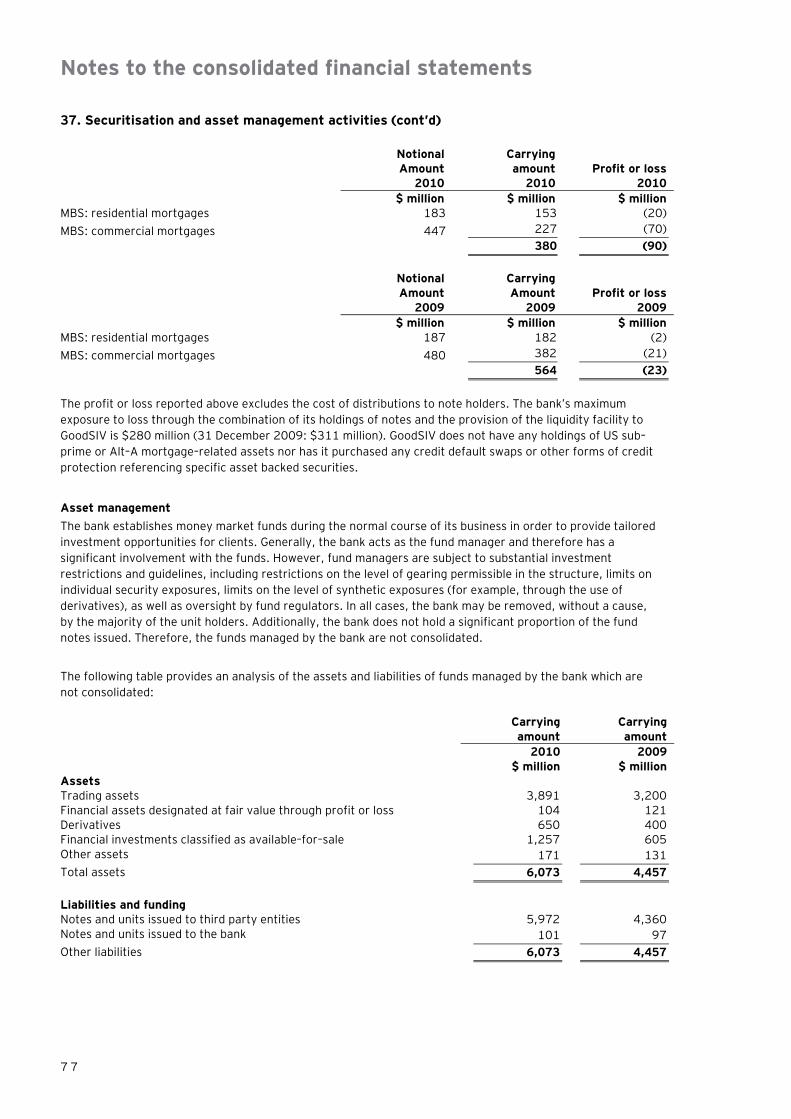
Notes to the consolidated financial statements
7 7
37. Securitisation and asset management activities (cont’d)
Notional
Amount Carrying amount Profit or loss
2010 2010 2010
$ million $ million $ million
MBS: residential mortgages 183 153 (20)
MBS: commercial mortgages 447 227 (70)
380 (90)
Notional
Amount Carrying Amount Profit or loss
2009 2009 2009
$ million $ million $ million
MBS: residential mortgages 187 182 (2)
MBS: commercial mortgages 480 382 (21)
564 (23)
The profit or loss reported above excludes the cost of distributions to note holders. The bank’s maximum exposure to loss through the combination of its holdings of notes and the provision of the liquidity facility to GoodSIV is $280 million (31 December 2009: $311 million). GoodSIV does not have any holdings of US sub–prime or Alt–A mortgage–related assets nor has it purchased any credit default swaps or other forms of credit protection referencing specific asset backed securities.
Asset management
The bank establishes money market funds during the normal course of its business in order to provide tailored investment opportunities for clients. Generally, the bank acts as the fund manager and therefore has a significant involvement with the funds. However, fund managers are subject to substantial investment restrictions and guidelines, including restrictions on the level of gearing permissible in the structure, limits on individual security exposures, limits on the level of synthetic exposures (for example, through the use of derivatives), as well as oversight by fund regulators. In all cases, the bank may be removed, without a cause, by the majority of the unit holders. Additionally, the bank does not hold a significant proportion of the fund notes issued. Therefore, the funds managed by the bank are not consolidated.
The following table provides an analysis of the assets and liabilities of funds managed by the bank which are not consolidated:
Carrying
amount Carrying amount
2010 2009
$ million $ million
Assets
Trading assets 3,891 3,200
Financial assets designated at fair value through profit or loss 104 121
Derivatives 650 400
Financial investments classified as available–for–sale 1,257 605
Other assets 171 131
Total assets 6,073 4,457
Liabilities and funding
Notes and units issued to third party entities 5,972 4,360
Notes and units issued to the bank 101 97
Other liabilities 6,073 4,457

Notes to the consolidated financial statements
7 8
38. Share–based payment
The expense recognised for employee services received during the year is shown in the following table:
2010 2009
$ million $ million
Expense arising from equity–settled share–based payment transactions 7 3
Expense arising from cash–settled share–based payment transactions 2 3
Forfeiture reserve (4) �
Total expense arising from share–based payment transactions (see Note 12) 5 6
IFRS 2.51(a)
The share–based payment plans are described below. There have been no cancellations or modifications to any of the plans during 2010 or 2009.
Senior executive plan IFRS 2.45(a)
Share options are granted to senior executives with more than 12 months service at the date of grant. The exercise price of the options is equal to the market price of the shares on the date of grant. The options vest if and when the bank’s earnings per share amount increases by 12% within three years from the date of grant. If this increase is not met within three years from the date of grant the options lapse. The contractual life of each option granted is five years. There are no cash settlement alternatives.
The fair value of the options is estimated at the grant date using a binomial pricing model, taking into account the terms and conditions upon which the instruments were granted.
IFRS 2.46
General employee share–option plan IFRS 2.45(a)
All other employees are entitled to a grant of options once they have been in service for two years. The options will vest if the employee remains in service for a period of three years from the date of grant and the share price attains an average increase of 5% per year during the three–year period from the date of grant. The exercise price of the options is equal to the market price of the shares less 1% on the date of grant. The contractual life of the options is five years and there are no cash settlement alternatives.
The fair value of the options is estimated at the grant date using a binomial pricing model, taking into account the terms and conditions upon which the instruments were granted.
IFRS 2.46
Share appreciation rights Employees in the business development group are granted share appreciation rights (SARs), which can only be settled in cash. These will vest when a specified target number of new accounts are closed. The contractual life of the SARs is six years. The fair value of the SARs is measured at the grant date using a Black–Scholes–Merton option pricing model, taking into account the terms and conditions upon which the instruments were granted.
IFRS 2.45(a)
IFRS 2.46
Movements in the year IFRS 2.45(b)
The following table illustrates the number (No.) and weighted average exercise prices (WAEP) of, and movements in, share options during the year.
2010 2009
No. WAEP $ No. WAEP $
Outstanding at the beginning of the year 10,213,000 2.42 1,713,000 3.23
Granted during the year 750,000 3.47 420,000 2.89
Exercised during the year – 2.10 (330,000) (1) 2.67 IFRS 2.45(c)
Expired during the year (350,000) 3.02 (500,000) 2.52
Outstanding at the end of the year 10,613,000 2.90 1,303,000 2.42
Exercisable at the end of the year 1,050,000 950,000 IFRS 2.45(d)
(1) The weighted average share price at the date of exercise for the options exercised was $3.10.
IFRS 2.45(d)

Notes to the consolidated financial statements
7 9
38. Share–based payment (cont’d)
The weighted average remaining contractual life for the share options outstanding at 31 December 2010 was 2.60 years (2009: 2.30 years).
IFRS 2.45(d)
The weighted average fair value of options granted during the year was $2.60 (2009: $2.75).
The range of exercise prices for options outstanding at the end of the year was $2.40 to $3.47 (2009: $2.52 to $3.23).
IFRS 2.45(d)
The fair value of equity–settled share options granted is estimated as at the date of grant using a binomial model, taking into account the terms and conditions upon which the options were granted.
The fair value of the cash–settled options is measured at the grant date using the Black–Scholes–Merton option pricing model, taking into account the terms and conditions upon which the instruments were granted. The services received and a liability to pay for those services is recognised over the expected vesting period. Until the liability is settled, it is remeasured at each reporting date with changes in fair value recognised in the income statement. The carrying amount of the liability relating to the cash–settled options at 31 December 2010 is $11.4 million (2009: $13.4 million). No cash–settled options had vested at 31 December 2010 (2009: Nil).
IFRS 2.51(b)
The following table lists the inputs to the model used for equity–settled and cash–settled options for the years ended 31 December 2010 and 31 December 2009.
IFRS 2.47(a)(i)
2010 2009
Equity–settled
Cash–settled Equity–settled
Cash–settled
Dividend yield (%) 3.10 3.10 3.13 3.13 Expected volatility (%) 16.00 16.00 15.00 16.00 Risk–free interest rate (%) 2.50 2.50 2.50 2.50 Expected life of option (years) 4.25 6.00 4.25 6.00 Weighted average share price ($) 2.76 2.76 2.30 2.30 The expected life of the options is based on historical data and is not necessarily indicative of exercise patterns that may occur. The expected volatility reflects the assumption that the historical volatility is indicative of future trends, which may also not necessarily be the actual outcome. No other features of options grants were incorporated into the measurement of fair value.
IFRS 2.47(a)(ii)
Commentary In order to keep the share based payment disclosures reasonably simple, we have assumed no modifications of the share based schemes, although it is likely in the current market environment that many entities will modify their schemes.
39. Additional cash flow information
Cash and cash equivalents
2010 2009
$ million $ million
Cash on hand (Note 19) 180 172
Current account with the Central Bank of Goodland (Note 19) 1,760 1,756
Due from banks 2,758 2,193
4,698 4,121 IAS 7.45
The deposits with the Central Bank of Goodland and with other central banks are not available to finance the bank’s day–to–day operations and therefore are not part of cash and cash equivalents.
IAS 7.48–49

Notes to the consolidated financial statements
8 0
39. Additional cash flow information (cont’d)
Change in operating assets IAS 7.22
2010 2009
$ million $ million
Net change in balances with central bank 549 (354)
Net change in financial assets held–for–trading (44) 3
Net change in due from and to banks (67) (251)
Net change in reverse repurchase agreements and cash collateral on securities borrowed 45 (163)
Net change in derivative financial instruments (329) (9)
Net change in financial assets designated at fair value through profit or loss (25) 25
Net change in loans and advances to customers (761) (1,535)
Net change in other assets (35) (27)
Movement in other comprehensive income 172 9
(495) (2,302) IAS 7.20(a)
Change in operating liabilities IAS 7.22
2010 2009 IAS 7.22
$ million $ million
Net change in repurchase agreements and cash collateral on securities lent (45) (132)
Net change in financial liabilities held–for–trading 82 119
Net change in financial liabilities designated at fair value through profit or loss 71 (36)
Net change in due to customers (34) 1,690
Net change in derivative financial instruments 239 110
Net change in other liabilities 117 355
430 2,106 IAS 7.20(a)
Non–cash items included in profit before tax IAS 7.20(b)
2010 2009
$ million $ million
Depreciation of property and equipment 103 106
Amortisation of other intangible assets 37 35
140 141

Notes to the consolidated financial statements
8 1
40. Maturity analysis of assets and liabilities
The table below shows an analysis of assets and liabilities analysed according to when they are expected to be recovered or settled.
IAS 1.61
As at 31 December 2010
Less than 12 months
Over 12 months Total
$ million $ million $ million Assets Cash and balances with central bank 2,750 � 2,750 Due from banks 10,604 � 10,604 Cash collateral on securities borrowed and reverse repurchase agreements 7,628 � 7,628
Financial assets held–for–trading 6,392 � 6,392 Derivative financial instruments 4,347 3,126 7,473 Financial assets held–for–trading pledged as collateral 2,898 1,122 4,020 Financial assets designated at fair value through profit or loss 929 337 1,266 Loans and advances to customers 9,656 38,268 47,924 Financial investments – available–for–sale 4,505 3,643 8,148 Financial investments – available–for–sale pledged as collateral 3,919 � 3,919 Financial investments – held–to–maturity 24 117 141 Property and equipment � 990 990 Goodwill and other intangible assets � 58 58 Deferred tax assets � 257 257 Other assets 492 526 1,018 Total assets 54,144 48,444 102,588 Liabilities Due to banks 3,222 � 3,222 Cash collateral on securities lent and repurchase agreements 12,883 2 ,286 15,169 Financial liabilities held–for–trading 2,750 1,410 4,160 Derivative financial instruments 4,605 3,460 8,065 Financial liabilities designated at fair value through profit or loss 2,408 1,212 3,620 Due to customers 6,012 47,131 53,143 Debt issued and other borrowed funds 3,396 1,914 5,310 Current tax liabilities 137 � 137 Deferred tax liabilities � 505 505 Provisions 83 3 86 Other liabilities 1,226 846 2,072 Total liabilities 36,722 58,767 95,489 Net 17,422 (10,323) 7,099 Commentary IAS 1.52 requires disclosure of the two sub totals (less than and greater than 12 months), of expected maturities in addition to the contractual maturity table required by IFRS 7.39 (Note 44.3)

Notes to the consolidated financial statements
8 2
40. Maturity analysis of assets and liabilities (cont’d)
As at 31 December 2009 Less than 12 months
Over 12 months Total
IAS 1.61
$ million $ million $ million Assets Cash and balances with central bank 2,702 � 2,702 Due from banks 10,489 � 10,489 Cash collateral on securities borrowed and reverse repurchase agreements 1,252 6,421 7,673
Financial assets held–for–trading 4,855 1,510 6,365 Derivative financial instruments 2,586 4,558 7,144 Financial assets held–for–trading pledged as collateral 1,858 2,145 4,003 Financial assets designated at fair value through profit or loss 825 416 1,241 Loans and advances to customers 39,134 8,029 47,163 Financial investments – available–for–sale 6,342 1,974 8,316 Financial investments – available–for–sale pledged as collateral 3,988 � 3,988 Financial investments – held–to–maturity 62 65 127 Property and equipment � 1,006 1006 Goodwill and other intangible assets � 78 78 Deferred tax assets � 237 237 Other assets 362 641 1003 Total assets 74,455 27,080 101,535 Liabilities Due to banks 3,174 � 3174 Cash collateral on securities lent and repurchase agreements 14,085 1,129 15,214 Financial liabilities held–for–trading 3,286 792 4,078 Derivative financial instruments 2,728 5,098 7,826 Financial liabilities designated at fair value through profit or loss
2,200 1,349 3,549
Due to customers 5,972 47,205 53,177 Debt issued and other borrowed funds 3,316 1863 5,179 Current tax liabilities 160 � 160 Deferred tax liabilities � 546 546 Provisions 76 � 76 Other liabilities 1,364 668 2,032 Total liabilities 36,359 58,652 95,011 Net 38,096 (31,572) 6,524 41. Contingent liabilities, commitments and leasing arrangements
To meet the financial needs of customers, the bank enters into various irrevocable commitments and contingent liabilities. These consist of financial guarantees, letters of credit and other undrawn commitments to lend.
Even though these obligations may not be recognised on the statement of financial position, they do contain credit risk and are therefore part of the overall risk of the bank (see Note 44.2).
Letters of credit and guarantees (including standby letters of credit) commit the bank to make payments on behalf of customers in the event of a specific act, generally related to the import or export of goods. Guarantees and standby letters of credit carry a similar credit risk to loans.
Legal claims IAS 37.86
Litigation is a common occurrence in the banking industry due to the nature of the business undertaken. The bank has formal controls and policies for managing legal claims. Once professional advice has been obtained and the amount of loss reasonably estimated, the bank makes adjustments to account for any adverse effects which the claims may have on its financial standing. At year end, the bank had several unresolved legal claims.
The only significant legal claim against the bank is in respect of a single customer who has alleged that certain investment advice provided by the bank has resulted in the client suffering financial loss. A trial date has not yet been set and therefore it is not practical to state the timing of any payment. The bank has been advised by its legal advisor that it is possible, but not probable, that the action will succeed. Accordingly, no provision for any claims has been made in these financial statements.
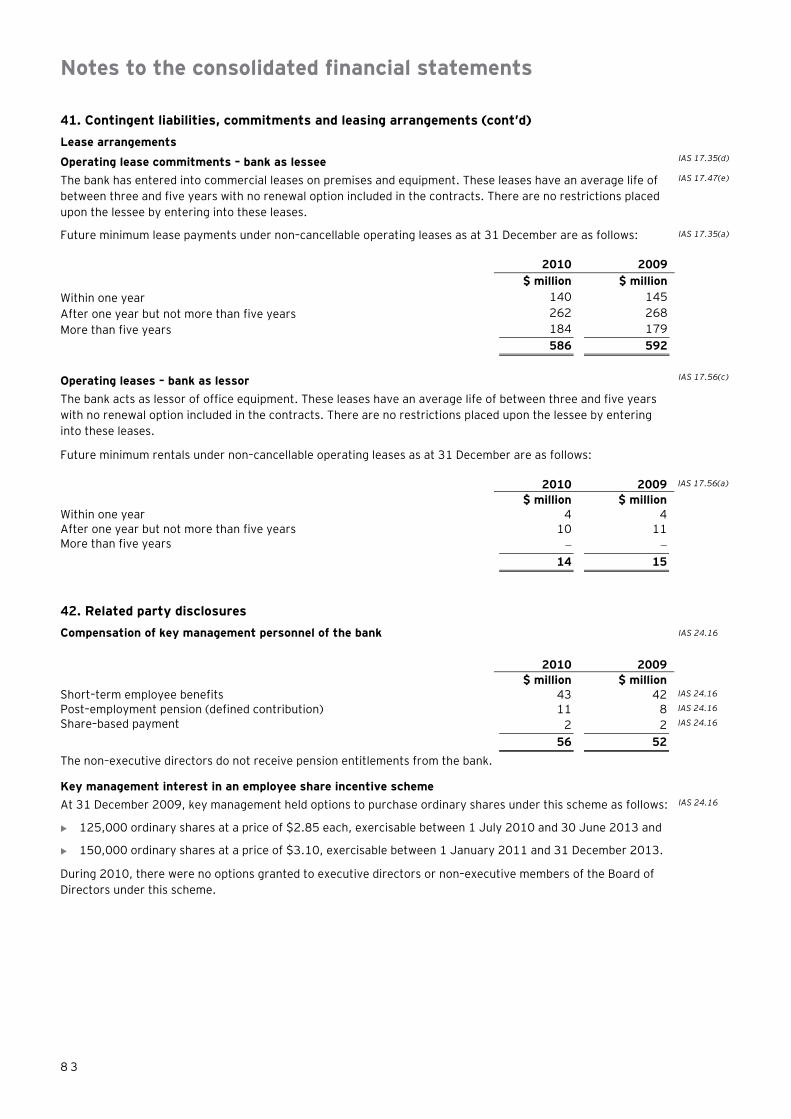
Notes to the consolidated financial statements
8 3
41. Contingent liabilities, commitments and leasing arrangements (cont’d)
Lease arrangements
Operating lease commitments – bank as lessee IAS 17.35(d)
The bank has entered into commercial leases on premises and equipment. These leases have an average life of between three and five years with no renewal option included in the contracts. There are no restrictions placed upon the lessee by entering into these leases.
IAS 17.47(e)
Future minimum lease payments under non–cancellable operating leases as at 31 December are as follows: IAS 17.35(a)
2010 2009 $ million $ million Within one year 140 145 After one year but not more than five years 262 268 More than five years 184 179 586 592 Operating leases – bank as lessor IAS 17.56(c)
The bank acts as lessor of office equipment. These leases have an average life of between three and five years with no renewal option included in the contracts. There are no restrictions placed upon the lessee by entering into these leases.
Future minimum rentals under non–cancellable operating leases as at 31 December are as follows:
2010 2009 IAS 17.56(a)
$ million $ million
Within one year 4 4
After one year but not more than five years 10 11
More than five years � �
14 15
42. Related party disclosures
Compensation of key management personnel of the bank IAS 24.16
2010 2009
$ million $ million
Short–term employee benefits 43 42 IAS 24.16
Post–employment pension (defined contribution) 11 8 IAS 24.16
Share–based payment 2 2 IAS 24.16
56 52
The non–executive directors do not receive pension entitlements from the bank.
Key management interest in an employee share incentive scheme
At 31 December 2009, key management held options to purchase ordinary shares under this scheme as follows:
� 125,000 ordinary shares at a price of $2.85 each, exercisable between 1 July 2010 and 30 June 2013 and
� 150,000 ordinary shares at a price of $3.10, exercisable between 1 January 2011 and 31 December 2013.
IAS 24.16
During 2010, there were no options granted to executive directors or non–executive members of the Board of Directors under this scheme.

Notes to the consolidated financial statements
8 4
42. Related party disclosures (cont’d)
Transactions with key management personnel of the bank
The bank enters into transactions, arrangements and agreements involving directors, senior management and their related concerns in the ordinary course of business at commercial interest and commission rates.
IAS 24.17
The following table provides the total amount of transactions, which have been entered into with related parties for the relevant financial year.
Maximum balance
during the year
Balance as at
31 December Income
Maximum balance
during the year
Balance as at
31 December Income IAS 24.17(a)–(b)
2010 2010 2010 2009 2009 2009
$ thousand $ thousand $ thousand $ thousand $ thousand $ thousand
Key management personnel of the bank:
Residential mortgages 16,050 15,743 732 17,122 16,632 882
Credit cards and other loans 157 143 6 135 129 4
Deposits 1,433 1,342 34 1,253 1,122 24
Guarantees 1,650 1,568 8 1,410 1,325 3
Transactions with other related parties IAS 24.17
In addition to transactions with key management, the bank enters into transactions with entities with significant influence over the bank. The following table shows the outstanding balance and the corresponding interest during the year.
Amounts owed by
related parties Amounts owed to
related parties IAS 24.22
Interest from related
parties
Interest to
related parties
Balance as at 31
December
Maximum balance
during the year
Balance as at 31
December
Maximum balance
during the year
$ million $ million $ million $ million $ million $ million
Entities with significant influence over the bank:
2010 250 10 3,221 3,411 195 200
2009 85 5 1,514 1,623 80 81
Terms and conditions of transactions with related parties
The above mentioned outstanding balances arose from the ordinary course of business. The interest charged to and by related parties are at normal commercial rates. Outstanding balances at the year–end are unsecured. There have been no guarantees provided or received for any related party receivables or payables. For the year ended 31 December 2010, the bank has not made any provision for doubtful debts relating to amounts owed by related parties (2009: Nil).
IAS 24.21 IAS 24.17(b)
IAS 24.17(c)(d)
Commentary Disclosure that related party transactions were made on terms equivalent to those that prevail in arm’s length transactions should be made only if such terms can be substantiated (IAS 24.21).

Notes to the consolidated financial statements
8 5
42. Related party disclosures (cont’d)
Consolidated subsidiaries
The consolidated financial statements include the financial statements of Good Bank (International) Limited and the subsidiaries in the following table.
IAS 24.12
Name of subsidiary Country of incorporation % equity interest
% equity interest
2010 2009 IAS 24.12
Atm Ltd Goodland 90 90
Credit Card Inc. USA 100 100
Finance Ltd Goodland 85 85
Offshore Inc USA 100 100
United Bank Ltd United Kingdom 100 �
GoodSIV Ltd Goodland � �
The bank sponsored the formation of GoodSIV Ltd a structured investment vehicle. 100% of the issued share capital of GoodSIV Ltd is held by TRST Ltd, an unrelated trust company. However, due to the combination of activities and arrangements mentioned in Note 37, management determined that, in substance, the bank controls this entity. Consequently, GoodSIV Ltd is included in the bank’s consolidated financial statements.
43. Events after the statement of financial position date
On 17 January 2010, the bank announced its intention to acquire AK Asset Management Company Ltd for a consideration of $170 million. The transaction has still to be approved by the bank’s shareholders and regulator. The acquisition is expected to be completed by the end of April 2011.
IAS 10.21
44. Risk management
Commentary The risk management disclosures included in these illustrative financial statements provide relatively condensed information. In practice, more detailed information might be necessary to reflect the circumstances of each bank. In addition, further narrative may be required to explain changes in risks and risk management processes compared to the previous year.
Banks are strongly recommended to keep the description of their risk management processes factual, and not to make assertions as to their ability to meet their risk management objectives. The provision of an assertion would entail a process of evaluation and testing, which would be a challenge to introduce and carry out.
44.1 Introduction
Risk is inherent in the bank’s activities but is managed through a process of ongoing identification, measurement and monitoring, subject to risk limits and other controls. This process of risk management is critical to the bank’s continuing profitability and each individual within the bank is accountable for the risk exposures relating to his or her responsibilities. The bank is exposed to credit risk, liquidity risk and market risk, the latter being subdivided into trading and non–trading risks. It is also subject to various operating risks.
IAS 1.114(d)(ii) IFRS 7.31–34 IFRS 7.IG15(b)(i)
The independent risk control process does not include business risks such as changes in the environment, technology and industry. The bank's policy is to monitor those business risks through the bank’s strategic planning process.
Risk management structure
The Board of Directors is responsible for the overall risk management approach and for approving the risk management strategies and principles.
The Board has appointed the Supervisory Board which has the responsibility to monitor the overall risk process within the bank.
The Risk Committee has the overall responsibility for the development of the risk strategy and implementing principles, frameworks, policies and limits. The Risk Committee is responsible for managing risk decisions and monitoring risk levels and reports on a weekly basis to the Supervisory Board.

Notes to the consolidated financial statements
8 6
44. Risk management (cont’d)
The Risk Management Unit is responsible for implementing and maintaining risk related procedures to ensure an independent control process is maintained. The unit works closely with the Risk Committee to ensure that procedures are compliant with the overall framework.
The Risk Controlling Unit is responsible for monitoring compliance with risk principles, policies and limits across the bank. Each business group has its own unit which is responsible for the independent control of risks, including monitoring the risk of exposures against limits and the assessment of risks of new products and structured transactions. This unit also ensures the complete capture of the risks in risk measurement and reporting systems. Exceptions are reported on a daily basis, where necessary, to the Risk Committee, and the relevant actions are taken to address exceptions and any areas of weakness.
IFRS 7.IG15(c)
Bank Treasury is responsible for managing the bank’s assets and liabilities and the overall financial structure. It is also primarily responsible for the funding and liquidity risks of the bank.
The bank’s policy is that risk management processes throughout the bank are audited annually by the Internal Audit function, which examines both the adequacy of the procedures and the bank’s compliance with the procedures. Internal Audit discusses the results of all assessments with management, and reports its findings and recommendations to the Audit Committee.
Commentary IFRS 7 requires an entity to make both qualitative and quantitative disclosures of the risk arising from its financial instruments. The qualitative disclosures include the types of risk to which the entity is exposed and how they arise, the entity’s objectives, policies and processes for managing the risk, the methods used to measure the risks, and any changes from the previous period . The quantitative disclosures include summary data about the exposure to risk as at the reporting date. These disclosures must be given either in the financial statements or incorporated by cross–reference from the financial statements to other disclosed information, such as a management documentary or risk report, that is available to users of the financial statements on the same terms as the financial statements and at the same time.
If, for example, the information is provided in the risk report, then the reporting entity should clarify, in the financial statements, which sections of the risk report form an integral part of the financial statements.
Risk measurement and reporting systems IFRS 7.IG15(b)(ii)
The bank’s risks are measured using a method which reflects both the expected loss likely to arise in normal circumstances and unexpected losses, which are an estimate of the ultimate actual loss based on statistical models. The models make use of probabilities derived from historical experience, adjusted to reflect the economic environment. The bank also runs worst case scenarios that would arise in the event that extreme events which are unlikely to occur do, in fact, occur.
Monitoring and controlling risks is primarily performed based on limits established by the bank. These limits reflect the business strategy and market environment of the bank as well as the level of risk that the bank is willing to accept, with additional emphasis on selected industries. In addition, the bank’s policy is to measure and monitor the overall risk bearing capacity in relation to the aggregate risk exposure across all risk types and activities.

Notes to the consolidated financial statements
8 7
44. Risk management (cont’d) Risk measurement and reporting systems (cont’d)
Information compiled from all the businesses is examined and processed in order to analyse, control and identify risks on a timely basis. This information is presented and explained to the Board of Directors, the Risk Committee, and the head of each business division. The report includes aggregate credit exposure, credit metric forecasts, hold limit exceptions, Value at Risk (VaR), liquidity ratios and risk profile changes. On a monthly basis, detailed reporting of industry, customer and geographic risks takes place. Senior management assesses the appropriateness of the allowance for credit losses on a monthly basis. The Supervisory Board receives a comprehensive risk report once a quarter which is designed to provide all the necessary information to assess and conclude on the risks of the bank.
For all levels throughout the bank, specifically tailored risk reports are prepared and distributed in order to ensure that all business divisions have access to extensive, necessary and up–to–date information.
A daily briefing is given to the Board of Managing Directors and all other relevant members of the bank on the utilisation of market limits, analysis of VaR, proprietary investments and liquidity, plus any other risk developments.
Risk mitigation
As part of its overall risk management, the bank uses derivatives and other instruments to manage exposures resulting from changes in interest rates, foreign currencies, equity risks, credit risks, and exposures arising from forecast transactions.
IFRS 7.IG15(b)(iii)
In accordance with the bank’s policy, the risk profile of the bank is assessed before entering into hedge transactions, which are authorised by the appropriate level of seniority within the bank. The effectiveness of hedges is assessed by the Risk Controlling Unit (based on economic considerations rather than the IFRS hedge accounting regulations). The effectiveness of all the hedge relationships is monitored by the Risk Controlling Unit monthly. In situations of ineffectiveness, the bank will enter into a new hedge relationship to mitigate risk on a continuous basis.
IFRS 7.IG15(b)(iv)
The bank actively uses collateral to reduce its credit risks (see below).
Excessive risk concentration
Concentrations arise when a number of counterparties are engaged in similar business activities, or activities in the same geographical region, or have similar economic features that would cause their ability to meet contractual obligations to be similarly affected by changes in economic, political or other conditions. Concentrations indicate the relative sensitivity of the bank’s performance to developments affecting a particular industry or geographical location.
IFRS 7.IG15(c)
In order to avoid excessive concentrations of risk, the bank’s policies and procedures include specific guidelines to focus on maintaining a diversified portfolio. Identified concentrations of credit risks are controlled and managed accordingly. Selective hedging is used within the bank to manage risk concentrations at both the relationship and industry levels.
44.2 Credit risk
Credit risk is the risk that the bank will incur a loss because its customers or counterparties fail to discharge their contractual obligations. The bank manages and controls credit risk by setting limits on the amount of risk it is willing to accept for individual counterparties and for geographical and industry concentrations, and by monitoring exposures in relation to such limits.
IFRS 7.33(a),(b)
The bank has established a credit quality review process to provide early identification of possible changes in the creditworthiness of counterparties, including regular collateral revisions. Counterparty limits are established by the use of a credit risk classification system, which assigns each counterparty a risk rating. Risk ratings are subject to regular revision. The credit quality review process aims to allow the bank to assess the potential loss as a result of the risks to which it is exposed and take corrective action.
Commentary In practice, a more detailed explanation of the credit methodology or process applied by the entity is required than is given here.

Notes to the consolidated financial statements
8 8
44. Risk management (cont’d) Derivative financial instruments Credit risk arising from derivative financial instruments is, at any time, limited to those with positive fair values, as recorded on the statement of financial position. In the case of credit derivatives, the bank is also exposed to or protected from the risk of default of the underlying entity referenced by the derivative.
With gross–settled derivatives, the bank is also exposed to a settlement risk, being the risk that the bank honours its obligation but the counterparty fails to deliver the counter–value.
Credit–related commitments risks IFRS 7.B10(c)–(d)
The bank makes available to its customers guarantees which may require that the bank makes payments on their behalf and enters into commitments to extend credit lines to secure their liquidity needs. Letters of credit and guarantees (including standby letters of credit) commit the bank to make payments on behalf of customers in the event of a specific act, generally related to the import or export of goods. Such commitments expose the bank to similar risks to loans and are mitigated by the same control processes and policies.
Risk concentrations: maximum exposure to credit risk without taking account of any collateral and other credit enhancements
The bank’s concentrations of risk are managed by client/counterparty, by geographical region and by industry sector. The maximum credit exposure to any client or counterparty as of 31 December 2010 was $452 million (2009: $473 million) before taking account of collateral or other credit enhancements and $127 million (2009: $142 million) net of such protection.
IFRS 7.IG18(d) IFRS 7.36(b) IFRS 7.B8
The following table shows the maximum exposure to credit risk for the components of the statement of financial position, including derivatives, by geography of counterparty and by industry before the effect of mitigation through the use of master netting and collateral agreements. Where financial instruments are recorded at fair value, the amounts shown represent the current credit risk exposure but not the maximum risk exposure that could arise in the future as a result of changes in values.
Commentary IFRS 7.36(a) requires information per class of financial instruments. In these illustrative financial statements, risk information is disclosed for the main asset lines of the statement of financial position, with greater detail being included where appropriate.
IFRS 7.36(a)

Notes to the consolidated financial statements
8 9
44. Risk management (cont’d)
Geographical analysis
31 December 2010
Goodland UK Other
Europe North
America South
America Asia Pacific
Rim Total IFRS 7.36(a)
Financial assets $ million $ million $ million $ million $ million $ million $ million $ million
Cash and balances with central bank 2,190 54 115 275 74 30 12 2,750
Due from banks Placement with other banks 2,497 1249 938 562 188 498 312 6,244 Loans and advances 1,664 831 623 374 125 334 208 4,159 Other amounts due 80 41 30 18 6 16 10 201
4,241 2,121 1,591 954 319 848 530 10,604
Cash collateral on securities borrowed and reverse purchase agreements 3,051 1,525 1,145 687 228 610 382 7,628
Derivative financial instruments
Interest rate swaps 1,546 772 580 348 116 309 187 3,858 Currency swaps 602 301 226 136 45 120 74 1,504 Forward foreign exchange contracts 303 152 114 69 23 61 38 760
Interest rate options 370 185 138 83 28 74 55 933 Credit default swaps 167 84 62 38 12 33 22 418
2,988 1,494 1,120 674 224 597 376 7,473
Other financial assets held–for–trading
Government debt securities 2,471 1,236 927 556 185 494 309 6,178
Debt securities issued by banks 529 264 199 119 39 106 66 1,322
Other debt securities 287 143 108 65 22 57 35 717
3,287 1,643 1,234 740 246 657 410 8,217
Financial assets designated at fair value through profit or loss
Loans and advances to customers 506 254 190 114 38 101 63 1,266
Loans and advances to customers
Corporate lending
4,997
2,498 1,874 1,125 375 1,000 624 12,493
Small business lending
1,820 910 682 410 137 364 227 4,550
Consumer lending 7,127 3,563 2,672 1,603 535 1,426 890 17,816 Residential mortgages 5,226 2,613 1,959 1,174 393 1,047 653 13,065
19,170 9,584 7,187 4,312 1,440 3,837 2,394 47,924
Financial investments available–for–sale
Government debt securities
2,458 1,229 922 553 184 491 307 6,144
Other debt securities 2,119 1,059 795 476 159 424 266 5,298
4,577 2,288 1,717 1,029 343 915 572 11,442
Financial investments held–to–maturity 57 28 21 13 4 11 7 141
40,067 18,991 14,320 8,798 2,916 7,606 4,747
97,445

Notes to the consolidated financial statements
9 0
44. Risk management (cont’d)
Geographical analysis (cont’d)
31 December 2009
Goodland UK Other
Europe North
America South
America Asia Pacific
Rim Total IFRS 7.36(a)
Financial assets $ million $ million $ million $ million $ million $ million $ million $ million
Cash and balances with central bank 2,317 36 50 270 14 10 5 2702
Due from banks Placement with other banks 2,476 1,238 929 557 186 495 309 6,190
Loans and advances 1,641 821 616 371 124 328 206 4,107 Other amounts due 77 38 29 17 6 15 10 192
4,194 2,097 1,574 945 316 838 525 10,489
Cash collateral on securities borrowed and reverse purchase agreements 3,069 1,534 1,151 691 231 614 383 7,673
Derivative financial instruments
Interest rate swaps 1459 730 547 328 108 291 178 3,641 Currency swaps 571 286 214 129 43 114 71 1,428 Forward foreign exchange contracts 301 150 113 68 23 60 37 752
Interest rate options 365 183 139 82 29 72 48 918 Credit default swaps 169 68 67 34 � 33 34 405
2,865 1,417 1,080 641 203 570 368 7,144
Other financial assets held–for–trading
Government debt securities 2,465 1,232 924 554 185 493 308 6,161
Debt securities issued by banks 529 264 199 119 40 106 67 1,324
Other debt securities 279 140 105 62 21 56 35 698
3,273 1,636 1,228 735 246 655 410 8,183 Financial assets designated at fair value through profit or loss
Loans and advances to customers 495 247 187 112 38 99 63 1,241
Loans and advances to customers
Corporate lending 4,918 2,459 1,844 1,107 369 984 615 12,296 Small business lending 1,839 919 689 414 138 368 230 4,597 Consumer lending 7015 3,507 2,631 1,579 526 1,403 877 17,538 Residential mortgages 5,094 2,549 1,910 1,146 382 1,017 634 12,732
18,866 9,434 7,074 4,246 1,415 3,772 2,356 47,163
Financial investments available–for–sale
Government debt securities 2,565 1,282 961 577 192 513 321 6,411
Other debt securities 2,141 1,071 803 481 160 429 268 5,353
4,706 2,353 1,764 1,058 352 942 589 11,764 Financial investments held–to–maturity 51 25 19 11 4 10 7 127
39,836 18,779 14,127 8,709 2,819 7,510 4,706 96,486

Notes to the consolidated financial statements
9 1
44. Risk management (cont’d)
Industry analysis
31 December 2010 Financial
Services Government Consumers Retail and Wholesale1
Construction and Materials2
Manufacturing and Petroleum Services3 Total IFRS 7.36(a)
$ million $ million $ million $ million $ million $ million $ million $ million
Financial assets
Cash and balances with central bank � 2,750 � � � � � 2,750
Due from banks
Placement with other banks 6,244 � � � � � � 6,244
Loans and advances 4,159 � � � � � � 4,159
Other amounts due 201 � � � � � � 201
10,604 � � � � � � 10,604
Cash collateral on securities borrowed and reverse purchase agreements 6,102 1,526 � � � � � 7,628
Derivative financial instruments
Interest rate swaps 3.086 � � � 232 463 77 3,858
Currency swaps 1,203 � � � 90 181 30 1,504
Forward foreign exchange contracts 760 � � � � � � 760
Interest rate options/futures 933 � � � � � � 933
Credit default swaps 418 � � � � � � 418
6,400 � � � 322 644 107 7,473
Other financial assets held–for–trading
Government debt securities � 6,178 � � � � � 6,178
Debt securities issued by banks 1,322 � � � � � � 1,322
Other debt securities 431 � � � � 286 � 717
1,753 6,178 � � � 286 � 8217
Financial assets designated at fair value through profit or loss
Loans and advances to customers 1,139 � � � � 127 � 1,266
Loans and advances to customers
Corporate lending 624 � � � 6,247 3,748 1,874 12,493
Small business lending 227 � � 3,187 272 455 409 4550
Consumer lending 1,782 � 16,034 � � � � 17,816
Residential mortgages 1,306 � 11,759 � � � � 13,065
Other
3,938 � 27,793 3,187 6,519 4,203 2,283 47,924
Financial investments available–for–sale
Government debt securities � 6,144 � � � � � 6,144
Other debt securities 5,033 � � 265 � � � 5,298
5,033 6,144 � 265 � � � 11,442
Financial investments held–to–maturity 113 � � � � 28 � 141
35,083 16,598 27,793 3,452 6,841 5,288 2,390 97,445
1 Retail & Wholesale includes Beverages 2 Construction & Materials includes Aerospace & Defense 3 Services includes Telecommunication, Media, Electricity, Consumers, IT, Health Care and Other
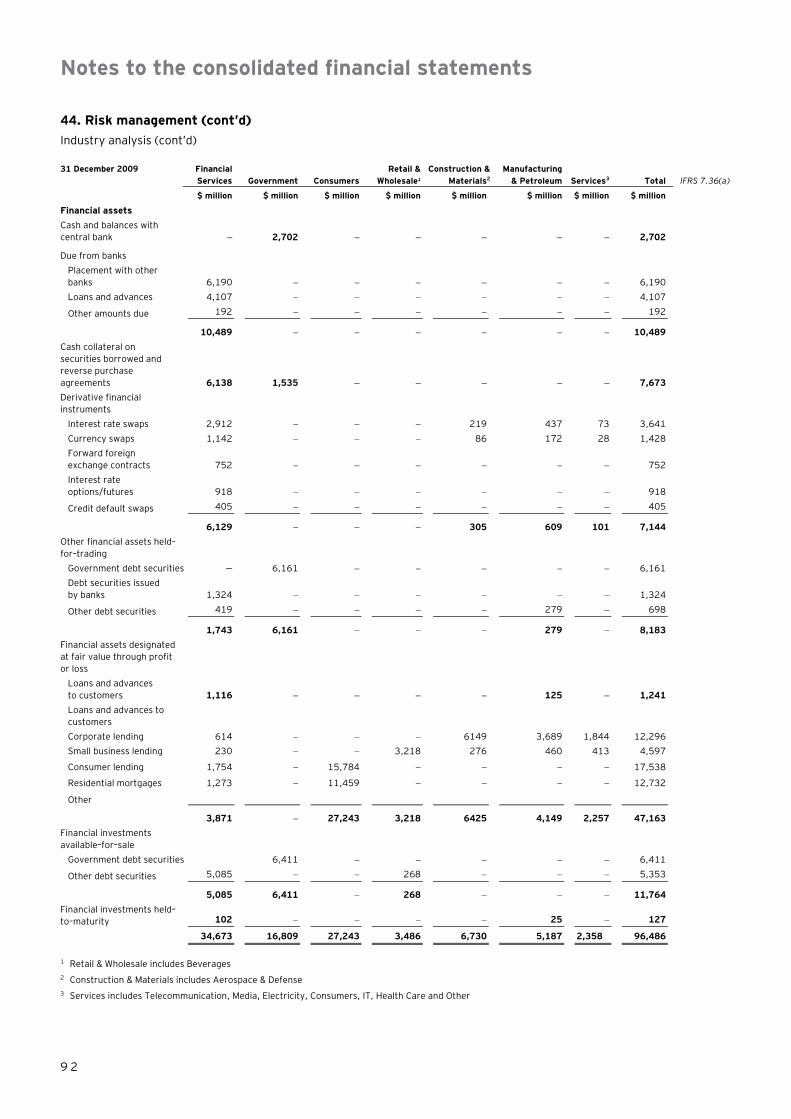
Notes to the consolidated financial statements
9 2
44. Risk management (cont’d)
Industry analysis (cont’d)
31 December 2009 Financial
Services Government Consumers Retail &
Wholesale1 Construction &
Materials2 Manufacturing
& Petroleum Services3 Total IFRS 7.36(a)
$ million $ million $ million $ million $ million $ million $ million $ million
Financial assets
Cash and balances with central bank � 2,702 � � � � � 2,702
Due from banks
Placement with other banks 6,190 � � � � � � 6,190
Loans and advances 4,107 � � � � � � 4,107
Other amounts due 192 � � � � � � 192
10,489 � � � � � � 10,489
Cash collateral on securities borrowed and reverse purchase agreements 6,138 1,535 � � � � � 7,673
Derivative financial instruments
Interest rate swaps 2,912 � � � 219 437 73 3,641
Currency swaps 1,142 � � � 86 172 28 1,428
Forward foreign exchange contracts 752 � � � � � � 752
Interest rate options/futures 918 � � � � � � 918
Credit default swaps 405 � � � � � � 405
6,129 � � � 305 609 101 7,144
Other financial assets held–for–trading
Government debt securities � 6,161 � � � � � 6,161
Debt securities issued by banks 1,324 � � � � � � 1,324
Other debt securities 419 � � � � 279 � 698
1,743 6,161 � � � 279 � 8,183
Financial assets designated at fair value through profit or loss
Loans and advances to customers 1,116 � � � � 125 � 1,241
Loans and advances to customers
Corporate lending 614 � � � 6149 3,689 1,844 12,296
Small business lending 230 � � 3,218 276 460 413 4,597
Consumer lending 1,754 � 15,784 � � � � 17,538
Residential mortgages 1,273 � 11,459 � � � � 12,732
Other
3,871 � 27,243 3,218 6425 4,149 2,257 47,163
Financial investments available–for–sale
Government debt securities 6,411 � � � � � 6,411
Other debt securities 5,085 � � 268 � � � 5,353
5,085 6,411 � 268 � � � 11,764
Financial investments held–to–maturity 102 � � � � 25 � 127
34,673 16,809 27,243 3,486 6,730 5,187 2,358 96,486
1 Retail & Wholesale includes Beverages 2 Construction & Materials includes Aerospace & Defense 3 Services includes Telecommunication, Media, Electricity, Consumers, IT, Health Care and Other

Notes to the consolidated financial statements
9 3
44. Risk management (cont’d)
Commentary The general requirement in IFRS 7.34(a) is that the quantitative data on risk exposures should be based on information provided internally to key management personnel.
The quantitative data in the risk management disclosure as at the reporting date is assumed to be representative for the bank’s exposure to risk during the period. Therefore, the disclosures on unrepresentative exposure to risk during the period required by IFRS 7.35 are not included, except for VaR.
Collateral and other credit enhancements
The amount and type of collateral required depends on an assessment of the credit risk of the counterparty. Guidelines are implemented regarding the acceptability of types of collateral and valuation parameters.
IFRS 7.36(b)
The main types of collateral obtained are as follows: IFRS 7.IG22(b)
� For securities lending and reverse repurchase transactions, cash or securities
� For commercial lending, charges over real estate properties, inventory and trade receivables
� For retail lending, mortgages over residential properties
The bank also obtains guarantees from parent companies for loans to their subsidiaries. IFRS 7.IG22(c)
Management monitors the market value of collateral, requests additional collateral in accordance with the underlying agreement, and monitors the market value of collateral obtained during its review of the adequacy of the allowance for impairment losses.
IFRS 7.IG22(a)
It is the bank’s policy to dispose of repossessed properties in an orderly fashion. The proceeds are used to reduce or repay the outstanding claim. In general, the bank does not occupy repossessed properties for business use.
IFRS 7.38(b)
The bank also makes use of master netting agreements with counterparties with whom a significant volume of transactions are undertaken. Such an arrangement provides for a single net settlement of all financial instruments covered by the agreement in the event of default on any one contract. Master netting arrangements do not normally result in an offset of balance–sheet assets and liabilities unless certain conditions for offsetting under IAS 32 apply.
IFRS 7.IG22(b) IFRS 7.B11F IAS 32.50
Although master netting arrangements may significantly reduce credit risk, it should be noted that:
� Credit risk is eliminated only to the extent that amounts due to the same counterparty will be settled after the assets are realised;
� The extent to which overall credit risk is reduced may change substantially within a short period because the exposure is affected by each transaction subject to the arrangement.
At 31 December 2010, master netting arrangements reduced the credit risk on favourable contracts that have a fair value of $3 billion (2009: $2.8 billion).
IFRS 7.36(b)
The bank reduces the settlement risk on gross settled foreign exchange derivatives by using a foreign exchange clearing house which allows transactions to be settled on a delivery versus payment basis. During the year, 54% (2009: 60%) of the transaction volume was settled in this way.
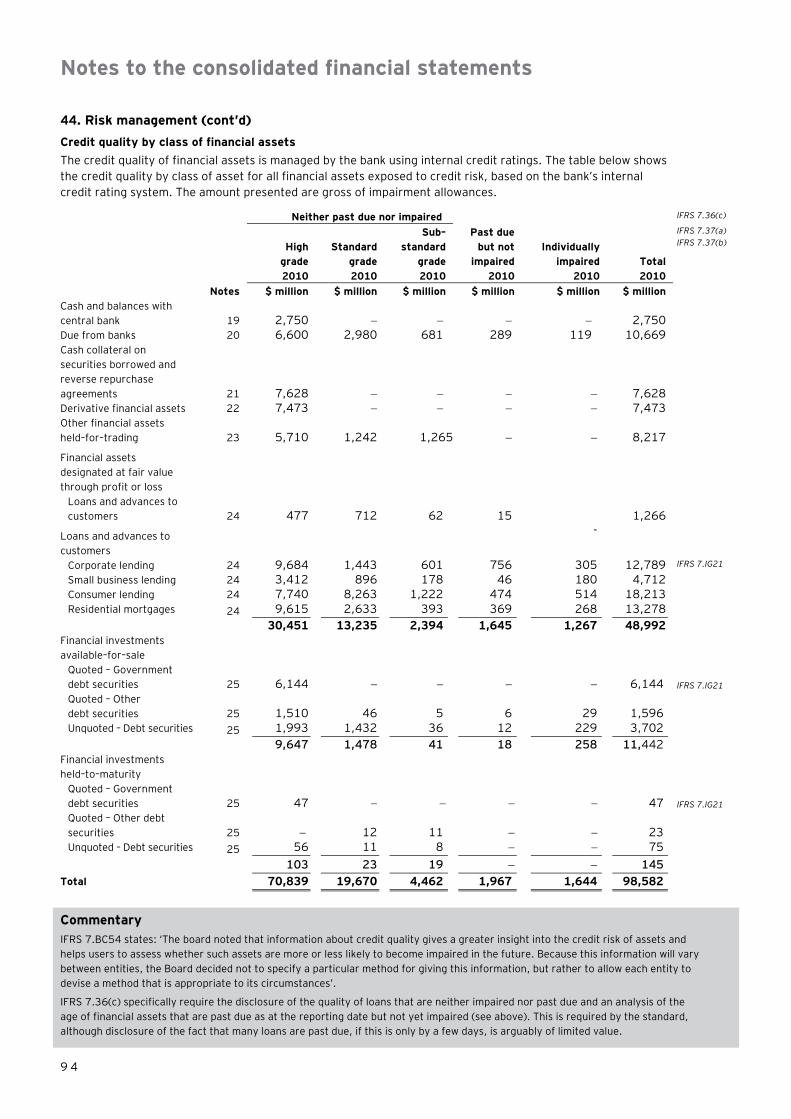
Notes to the consolidated financial statements
9 4
44. Risk management (cont’d)
Credit quality by class of financial assets
The credit quality of financial assets is managed by the bank using internal credit ratings. The table below shows the credit quality by class of asset for all financial assets exposed to credit risk, based on the bank’s internal credit rating system. The amount presented are gross of impairment allowances.
Neither past due nor impaired IFRS 7.36(c)
High
grade Standard
grade
Sub–standard
grade
Past due but not
impaired Individually
impaired Total
IFRS 7.37(a) IFRS 7.37(b)
2010 2010 2010 2010 2010 2010
Notes $ million $ million $ million $ million $ million $ million
Cash and balances with central bank 19 2,750 � � � � 2,750
Due from banks 20 6,600 2,980 681 289 119 10,669
Cash collateral on securities borrowed and reverse repurchase agreements 21 7,628 � � � � 7,628
Derivative financial assets 22 7,473 � � � � 7,473
Other financial assets held–for–trading 23 5,710 1,242 1,265 � � 8,217
Financial assets designated at fair value through profit or loss
Loans and advances to customers 24 477 712 62 15
1,266
Loans and advances to customers
-
Corporate lending 24 9,684 1,443 601 756 305 12,789 IFRS 7.IG21
Small business lending 24 3,412 896 178 46 180 4,712
Consumer lending 24 7,740 8,263 1,222 474 514 18,213
Residential mortgages 24 9,615 2,633 393 369 268 13,278
30,451 13,235 2,394 1,645 1,267 48,992
Financial investments available–for–sale
Quoted – Government debt securities 25 6,144 � � � � 6,144 IFRS 7.IG21
Quoted – Other debt securities 25 1,510 46 5 6
29 1,596
Unquoted – Debt securities 25 1,993 1,432 36 12 229 3,702
9,647 1,478 41 18 258 11,442
Financial investments held–to–maturity
Quoted – Government debt securities 25 47 � � � � 47 IFRS 7.IG21
Quoted – Other debt securities 25 � 12 11 � � 23
Unquoted – Debt securities 25 56 11 8 � � 75
103 23 19 � � 145
Total 70,839 19,670 4,462 1,967 1,644 98,582
Commentary IFRS 7.BC54 states: ‘The board noted that information about credit quality gives a greater insight into the credit risk of assets and helps users to assess whether such assets are more or less likely to become impaired in the future. Because this information will vary between entities, the Board decided not to specify a particular method for giving this information, but rather to allow each entity to devise a method that is appropriate to its circumstances’.
IFRS 7.36(c) specifically require the disclosure of the quality of loans that are neither impaired nor past due and an analysis of the age of financial assets that are past due as at the reporting date but not yet impaired (see above). This is required by the standard, although disclosure of the fact that many loans are past due, if this is only by a few days, is arguably of limited value.
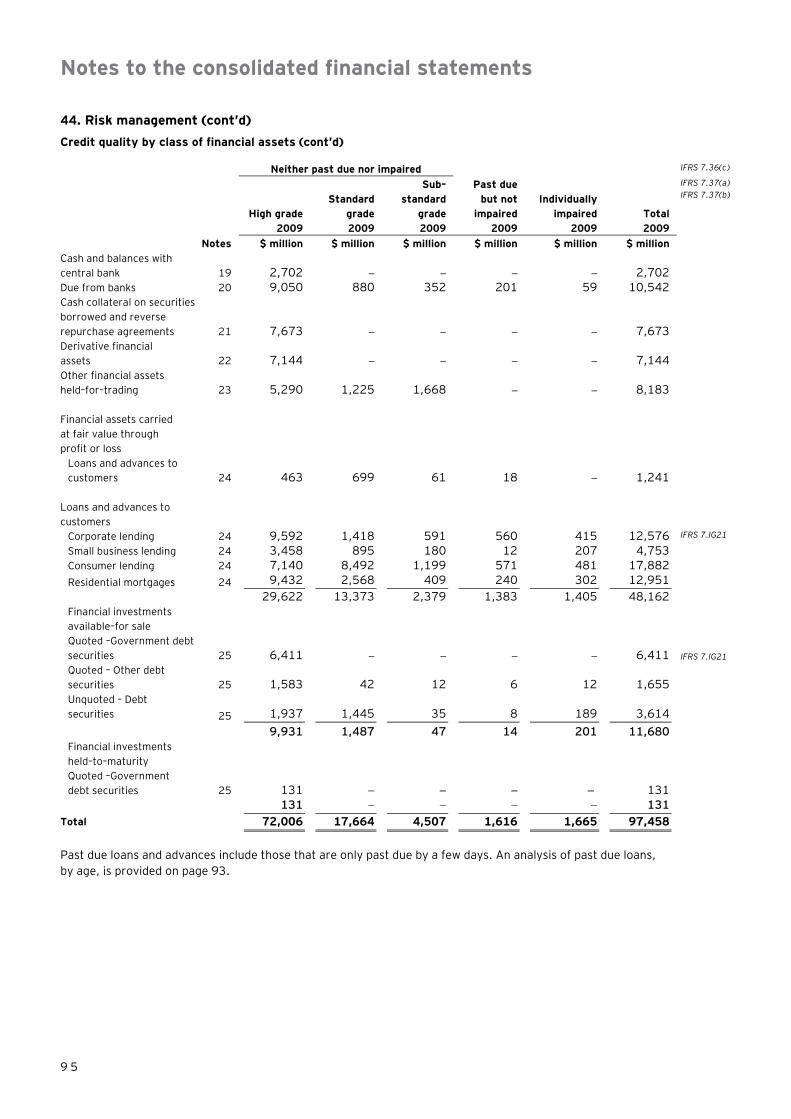
Notes to the consolidated financial statements
9 5
44. Risk management (cont’d)
Credit quality by class of financial assets (cont’d)
Neither past due nor impaired IFRS 7.36(c)
High grade Standard
grade
Sub–standard
grade
Past due but not
impaired Individually
impaired Total
IFRS 7.37(a) IFRS 7.37(b)
2009 2009 2009 2009 2009 2009
Notes $ million $ million $ million $ million $ million $ million
Cash and balances with central bank 19 2,702 � � �
� 2,702
Due from banks 20 9,050 880 352 201 59 10,542
Cash collateral on securities borrowed and reverse repurchase agreements 21 7,673 � � � � 7,673
Derivative financial assets 22 7,144 � � � � 7,144
Other financial assets held–for–trading 23 5,290 1,225 1,668 � � 8,183
Financial assets carried at fair value through profit or loss
Loans and advances to customers 24 463 699 61 18
� 1,241
Loans and advances to customers
Corporate lending 24 9,592 1,418 591 560 415 12,576 IFRS 7.IG21
Small business lending 24 3,458 895 180 12 207 4,753
Consumer lending 24 7,140 8,492 1,199 571 481 17,882
Residential mortgages 24 9,432 2,568 409 240 302 12,951
29,622 13,373 2,379 1,383 1,405 48,162
Financial investments available–for sale Quoted –Government debt securities 25 6,411
�
� �
� 6,411 IFRS 7.IG21
Quoted – Other debt securities 25 1,583 42 12 6
12 1,655
Unquoted – Debt securities 25 1,937 1,445 35 8
189 3,614
9,931 1,487 47 14 201 11,680
Financial investments held–to–maturity Quoted –Government debt securities 25 131 � � �
� 131
131 � � � � 131
Total 72,006 17,664 4,507 1,616 1,665 97,458
Past due loans and advances include those that are only past due by a few days. An analysis of past due loans, by age, is provided on page 93.

Notes to the consolidated financial statements
9 6
44. Risk management (cont’d) Credit risk exposure for each internal credit risk rating
Bank’s internal credit rating
Moody’s equivalent
grades Historical
default rates Total Historical
default rates Total
2010 2009 2009
% $ million % $ million IFRS 7.IG23
IFRS 7.IG24
High grade
Risk rating class 1 Aaa 0.01 8,221 0.01 8,121
Risk rating class 2 Aa1 – A3 0.03 17,954 0.02 15,687
Risk rating class 3 Baa1 – Baa2 0.07 23,344 0.06 21,768
Risk rating class 4 Baa3 0.12 21,320 0.13 26,430
Standard grade
Risk rating class 5 Ba1 0.22 7,856 0.20 7,621
Risk rating class 6 Ba2 – Ba3 0.42 6,776 0.38 5,405
Risk rating class 7 B1 – B2 1.29 5,038 1.1 4,638
Sub–standard grade
Risk rating class 8 B3 – 5.89 4,462 5.45 4,507
Risk rating class 9 Caa – C 18.00 1,967 17.24 1,616
Impaired
Risk rating class 10 D 89.00 1,644 91.2 1,665
98,582 97,458
It is the bank’s policy to maintain accurate and consistent risk ratings across the credit portfolio. This facilitates focused management of the applicable risks and the comparison of credit exposures across all lines of business, geographic regions and products. The rating system is supported by a variety of financial analytics, combined with processed market information to provide the main inputs for the measurement of counterparty risk. All internal risk ratings are tailored to the various categories and are derived in accordance with the bank’s rating policy. The attributable risk ratings are assessed and updated regularly. The Moody’s equivalent grades are relevant only for certain of the exposures in each risk rating class.
IFRS 7.IG25(a)
Commentary If the credit quality analysis is based on external credit grading systems the entity is recommended to disclose the credit exposure for each external credit grade, the rating agencies used, the value of the entity’s rated and unrated credit exposures and the relationship between internal and external ratings (IFRS 7.IG24).

Notes to the consolidated financial statements
9 7
44. Risk management (cont’d)
Aging analysis of past due but not impaired loans by class of financial assets
Less than
30 days 31 to 60
days 61 to 90
days More than
91 days Total IFRS 7.37(a)
2010 2010 2010 2010 2010 IFRS 7.IG28
$ million $ million $ million $ million $ million
Due from banks 275 � � � 275
Financial assets designated at fair value through profit or loss
Loans and advances to customers 15 � � � 15 Loans and advances to customers
Corporate lending 418 161 47 109 735 IFRS 7.6
Small business lending 39 68 19 21 147
Consumer lending 361 129 37 88 615
Residential mortgages 106 36 55 113 310
924 394 158 331 1,807
Financial investments
Quoted – Other debt securities � � � 6 6
Unquoted – Debt securities � � � 12 12
� � � 18 18
1,214 394 158 349 2,115
Less than
30 days 31 to 60
days 61 to 90
days More than
91 days Total IFRS 7.37(a)
2009 2009 2009 2009 2009 IFRS 7.IG28
$ million $ million $ million $ million $ million
Due from banks 180 � � � 180
Financial assets designated at fair value through profit or loss
Loans and advances to customers 14 � � � 14
Loans and advances to customers
Corporate lending 312 121 47 79 559 IFRS 7.6
Small business lending 39 41 19 21 120
Consumer lending 342 129 37 88 596
Residential mortgages 77 26 25 64 192
770 317 128 252 1,467
Financial investments
Quoted – Other debt securities 7 7
Unquoted – Debt securities � � � 11 11
� � � 18 18
964 317 128 270 1,679
See Note 24 for more detailed information on the allowance for impairment losses on loans and advances to customers.
At 31 December 2010 the fair value of collateral that the bank holds relating to loans individually determined to be impaired amounts to $502 million (2009: $495 million). The collateral consists of cash, securities, letters of guarantee and properties.
IFRS 7.37(c )
Collateral repossessed
During the year, the bank took possession of an industrial building with a carrying value of $2.6 million at the statement of financial position date, which the bank is in the process of selling.
IFRS 7.38(a)
Commentary IFRS 7.37(c) requires the disclosure of the fair value of the collateral held against past–due or impaired loans, unless it is impracticable to do so. This exemption was included because it can be difficult to provide information that is not misleading. If fair values are disclosed in aggregate, individual loans may be over or under–collateralised and so the bank’s true exposure would not be apparent (IFRS 7. BC 51 & 52).
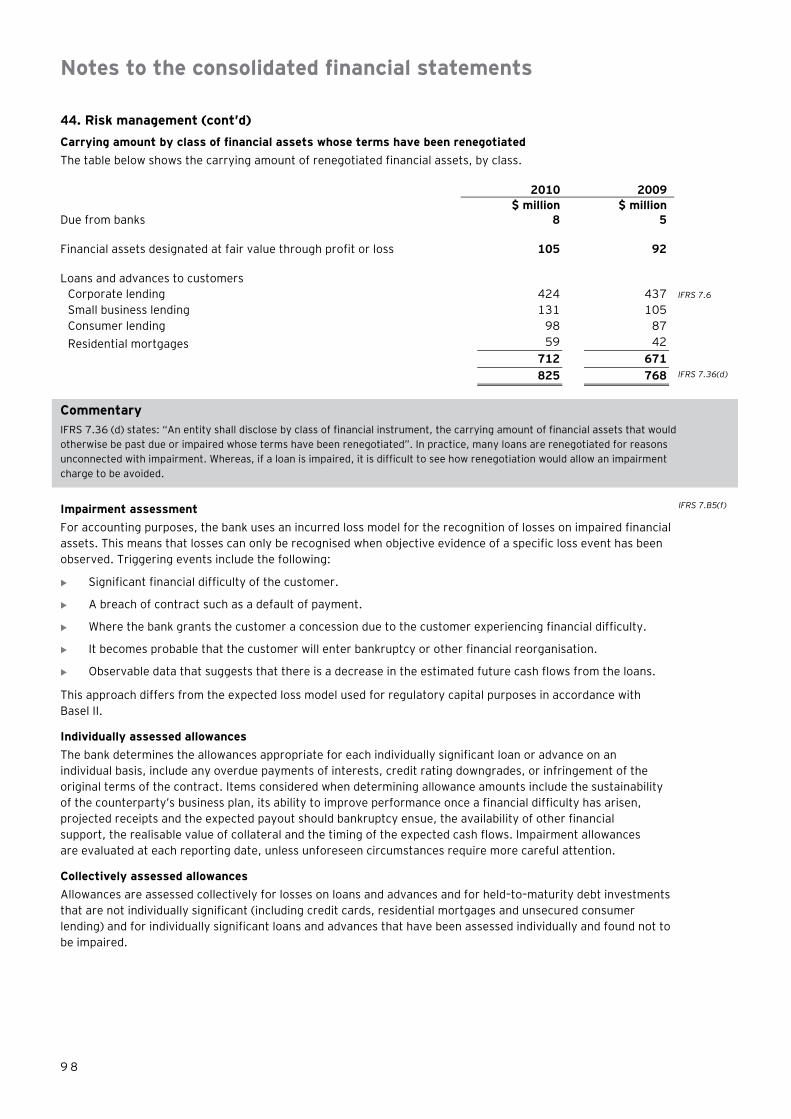
Notes to the consolidated financial statements
9 8
44. Risk management (cont’d)
Carrying amount by class of financial assets whose terms have been renegotiated
The table below shows the carrying amount of renegotiated financial assets, by class.
2010 2009
$ million $ million
Due from banks 8 5
Financial assets designated at fair value through profit or loss 105 92
Loans and advances to customers
Corporate lending 424 437 IFRS 7.6
Small business lending 131 105
Consumer lending 98 87
Residential mortgages 59 42
712 671
825 768 IFRS 7.36(d)
Commentary IFRS 7.36 (d) states: “An entity shall disclose by class of financial instrument, the carrying amount of financial assets that would otherwise be past due or impaired whose terms have been renegotiated”. In practice, many loans are renegotiated for reasons unconnected with impairment. Whereas, if a loan is impaired, it is difficult to see how renegotiation would allow an impairment charge to be avoided.
Impairment assessment IFRS 7.B5(f)
For accounting purposes, the bank uses an incurred loss model for the recognition of losses on impaired financial assets. This means that losses can only be recognised when objective evidence of a specific loss event has been observed. Triggering events include the following:
� Significant financial difficulty of the customer.
� A breach of contract such as a default of payment.
� Where the bank grants the customer a concession due to the customer experiencing financial difficulty.
� It becomes probable that the customer will enter bankruptcy or other financial reorganisation.
� Observable data that suggests that there is a decrease in the estimated future cash flows from the loans.
This approach differs from the expected loss model used for regulatory capital purposes in accordance with Basel II.
Individually assessed allowances
The bank determines the allowances appropriate for each individually significant loan or advance on an individual basis, include any overdue payments of interests, credit rating downgrades, or infringement of the original terms of the contract. Items considered when determining allowance amounts include the sustainability of the counterparty’s business plan, its ability to improve performance once a financial difficulty has arisen, projected receipts and the expected payout should bankruptcy ensue, the availability of other financial support, the realisable value of collateral and the timing of the expected cash flows. Impairment allowances are evaluated at each reporting date, unless unforeseen circumstances require more careful attention.
Collectively assessed allowances
Allowances are assessed collectively for losses on loans and advances and for held–to–maturity debt investments that are not individually significant (including credit cards, residential mortgages and unsecured consumer lending) and for individually significant loans and advances that have been assessed individually and found not to be impaired.

Notes to the consolidated financial statements
9 9
44. Risk management (cont’d)
The bank generally bases its analyses on historical experience. However, when there are significant market developments, regional and/or global, such as the market turmoil in 2007/2008, the bank would include macro-economic factors within its assessments. These factors include, depending on the characteristics of the individual or collective assessment: unemployment rates, current levels of bad debts, changes in laws, changes in regulations, bankruptcy trends, and other consumer data. The bank may use the aforementioned factors as appropriate to adjust the impairment allowances.
Allowances are evaluated separately at each reporting date with each portfolio.
The collective assessment is made for groups of assets with similar risk characteristics, in order to determine whether provision should be made due to incurred loss events for which there is objective evidence, but the effects of which are not yet evident in the individual loans assessments. The collective assessment takes account of data from the loan portfolio (such as historical losses on the portfolio, levels of arrears, credit utilisation, loan to collateral ratios and expected receipts and recoveries once impaired) or economic data (such as current economic conditions, unemployment levels and local or industry–specific problems). The approximate delay between the time a loss is likely to have been incurred and the time it will be identified as requiring an individually assessed impairment allowance is also taken into consideration. Local management is responsible for deciding the length of this period which can extend for as long as one year. The impairment allowance is then reviewed by credit management to ensure alignment with the bank’s overall policy.
Financial guarantees and letters of credit are assessed and provisions are made in a similar manner as for loans.
Commitments and guarantees
To meet the financial needs of customers, the bank enters into various irrevocable commitments and contingent liabilities. Even though these obligations may not be recognised on the statement of financial position, they do contain credit risk and are therefore part of the overall risk of the bank.
The table below shows the bank’s maximum credit risk exposure for commitments and guarantees.
The maximum exposure to credit risk relating to a financial guarantee is the maximum amount the bank could have to pay if the guarantee is called upon. The maximum exposure to credit risk relating to a loan commitment is the full amount of the commitment. In both cases, the maximum risk exposure is significantly greater than the amount recognised as a liability in the statement of financial position.
IAS 37.86 IFRS 7.B10(c)–(d)
2010 2009 $ million $ million Financial guarantees 3,260 3,084 Letters of credit 523 589 Other undrawn commitments to lend 13,314 13,022 Other commitments and guarantees 884 718 17,981 17,413 44.3 Liquidity risk and funding management IFRS 7.33(a),(b)
Liquidity risk is defined as the risk that the bank will encounter difficulty in meeting obligations associated with financial liabilities that are settled by delivering cash or another financial asset. Liquidity risk arises because of the possibility that the bank might be unable to meet its payment obligations when they fall due under both normal and stress circumstances. To limit this risk, management has arranged diversified funding sources in addition to its core deposit base, and adopted a policy of managing assets with liquidity in mind and of monitoring future cash flows and liquidity on a daily basis. The bank has developed internal control processes and contingency plans for managing liquidity risk. This incorporates an assessment of expected cash flows and the availability of high grade collateral which could be used to secure additional funding if required.
IFRS 7.39(c) IFRS 7.B11F(c) IFRS 7.11F(e)

Notes to the consolidated financial statements
1 0 0
44. Risk management (cont’d)
The bank maintains a portfolio of highly marketable and diverse assets that assumed to be easily liquidated in the event of an unforeseen interruption of cash flow. The bank also has committed lines of credit that it can access to meet liquidity needs. In addition, the bank maintains a statutory deposit with the Central Bank of Goodland equal to 7% of customer deposits. In accordance with the bank’s policy. the liquidity position is assessed and managed under a variety of scenarios, giving due consideration to stress factors relating to both the market in general and specifically to the bank. The most important of these is to maintain limits on the ratio of net liquid assets to customer liabilities, to reflect market conditions. Net liquid assets consist of cash, short–term bank deposits and liquid debt securities available for immediate sale, less deposits for banks and other issued securities and borrowings due to mature within the next month. The ratios during the year were as follows:
IFRS 7.B11F(a) IFRS 7.B11F(b)
Liquidity ratios 2010 2009 Advances to deposit ratios Year–end Maximum Minimum Average
88.8% 94.1% 80.2% 86.5%
86.0% 93.2% 79.9% 82.4%
The bank stresses the importance of current accounts and savings accounts as sources of funds to finance lending to customers. They are monitored using the advances to deposit ratio, which compares loans and advances to customers as a percentage of core customer current and savings accounts, together with term funding with a remaining term to maturity in excess of one year. Loans to customers that are part of reverse repurchase arrangements, and where the bank receives securities which are deemed to be liquid, are excluded from the advances to deposits ratio.
Net liquid assets to customer liabilities ratios Year–end Maximum Minimum Average
2010 17.5% 24.3% 15.2% 20.2%
2009 17.6% 26.7% 17.5% 21.4%
Net liquid assets are liquid assets less all funds maturing in the next 30 days from wholesale market sources and from customers who are deemed to be professional. The bank defines liquid assets for the purposes of the liquidity ratio as cash balances, short–term interbank deposits and highly rated debt securities available for immediate sale and for which a liquid market exists.
Commentary Disclosure of liquidity ratios should be given if this is the way the bank manages its liquidity risk. If a bank manages liquidity risk on the basis of expected maturity dates, it might disclose a maturity analysis of the expected maturity dates of both financial liabilities and financial assets. IFRS 7.34 also requires disclosure of quantitative data about concentrations of risk, if applicable.
Any other central bank liquidity requirements should be described, if applicable.
Analysis of financial assets and liabilities by remaining contractual maturities
The table below summarises the maturity profile of the undiscounted cash flows of the bank’s financial assets and liabilities as at 31 December. Trading derivatives are shown at fair value in a separate column. All derivatives used for hedging purposes are shown by maturity, based on their contractual undiscounted repayment obligations. Gross settled, non trading derivatives are shown separately, by contractual maturity at the foot of the note.
Repayments which are subject to notice are treated as if notice were to be given immediately. However, the bank expects that many customers will not request repayment on the earliest date the bank could be required to pay and the table does not reflect the expected cash flows indicated by the bank’s deposit retention history.
IFRS 7.B11D
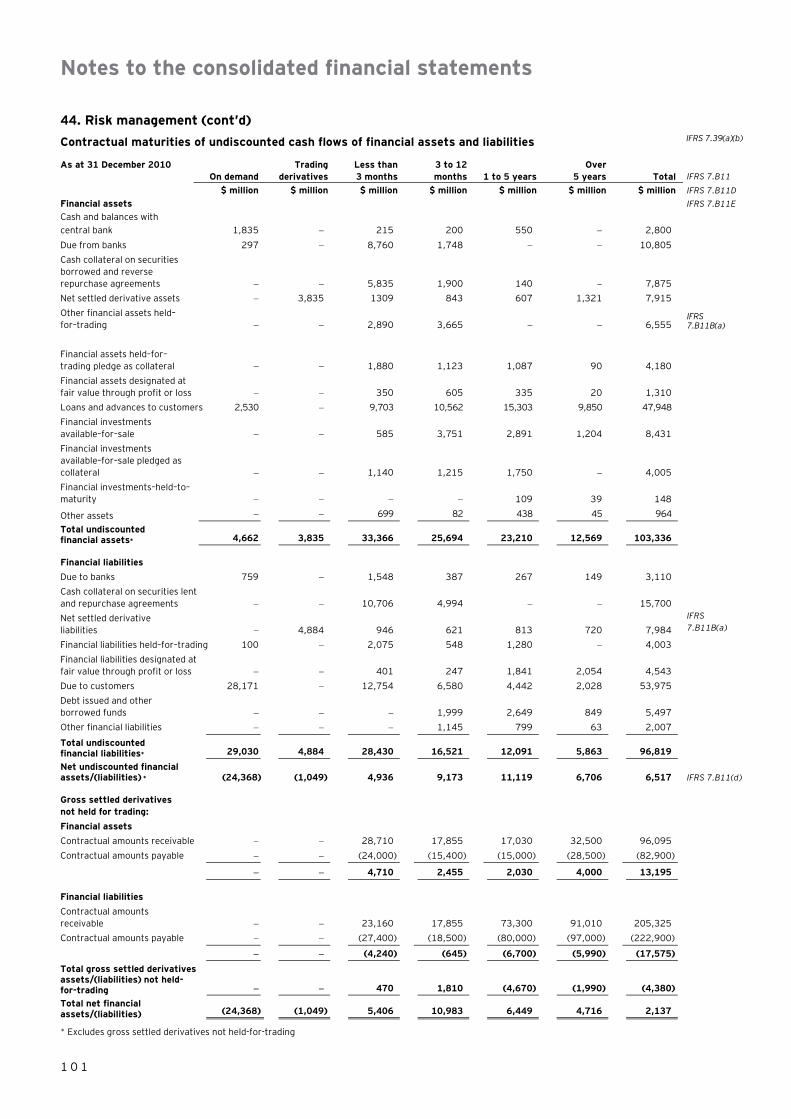
Notes to the consolidated financial statements
1 0 1
44. Risk management (cont’d)
Contractual maturities of undiscounted cash flows of financial assets and liabilities IFRS 7.39(a)(b)
As at 31 December 2010
On demand Trading
derivatives Less than 3 months
3 to 12 months 1 to 5 years
Over 5 years Total IFRS 7.B11
$ million $ million $ million $ million $ million $ million $ million IFRS 7.B11D Financial assets IFRS 7.B11E Cash and balances with central bank 1,835 � 215 200 550 � 2,800
Due from banks 297 � 8,760 1,748 � � 10,805
Cash collateral on securities borrowed and reverse repurchase agreements � � 5,835 1,900 140 � 7,875
Net settled derivative assets � 3,835 1309 843 607 1,321 7,915
Other financial assets held–for–trading � � 2,890 3,665 � � 6,555
IFRS 7.B11B(a)
Financial assets held–for–trading pledge as collateral � � 1,880 1,123 1,087 90 4,180
Financial assets designated at fair value through profit or loss � � 350 605 335 20 1,310
Loans and advances to customers 2,530 � 9,703 10,562 15,303 9,850 47,948
Financial investments available–for–sale � � 585 3,751 2,891 1,204 8,431
Financial investments available–for–sale pledged as collateral � � 1,140 1,215 1,750 � 4,005
Financial investments–held–to–maturity � � � � 109 39 148
Other assets � � 699 82 438 45 964 Total undiscounted financial assets* 4,662 3,835 33,366 25,694 23,210 12,569 103,336 Financial liabilities
Due to banks 759 � 1,548 387 267 149 3,110
Cash collateral on securities lent and repurchase agreements � � 10,706 4,994 � � 15,700
Net settled derivative liabilities � 4,884 946 621 813 720 7,984
IFRS 7.B11B(a)
Financial liabilities held–for–trading 100 � 2,075 548 1,280 � 4,003
Financial liabilities designated at fair value through profit or loss � � 401 247 1,841 2,054 4,543
Due to customers 28,171 � 12,754 6,580 4,442 2,028 53,975
Debt issued and other borrowed funds � � � 1,999 2,649 849 5,497
Other financial liabilities � � � 1,145 799 63 2,007
Total undiscounted financial liabilities* 29,030 4,884 28,430 16,521 12,091 5,863 96,819
Net undiscounted financial assets/(liabilities) * (24,368) (1,049) 4,936 9,173 11,119 6,706 6,517 IFRS 7.B11(d) Gross settled derivatives not held for trading:
Financial assets
Contractual amounts receivable � � 28,710 17,855 17,030 32,500 96,095
Contractual amounts payable � � (24,000) (15,400) (15,000) (28,500) (82,900)
� � 4,710 2,455 2,030 4,000 13,195 Financial liabilities
Contractual amounts receivable � � 23,160 17,855 73,300 91,010 205,325
Contractual amounts payable � � (27,400) (18,500) (80,000) (97,000) (222,900)
� � (4,240) (645) (6,700) (5,990) (17,575)
Total gross settled derivatives assets/(liabilities) not held-for-trading � � 470 1,810 (4,670) (1,990) (4,380)
Total net financial assets/(liabilities) (24,368) (1,049) 5,406 10,983 6,449 4,716 2,137
* Excludes gross settled derivatives not held-for-trading

Notes to the consolidated financial statements
1 0 2
44. Risk management (cont’d)
As at 31 December 2009
On demand Trading
derivatives Less than 3 months
3 to 12 months 1 to 5 years
Over 5 years Total IFRS 7.B11
$ million $ million $ million $ million $ million $ million $ million IFRS 7.B11D Financial assets IFRS 7.B11E
Cash and balances with central bank 1,005 � 820 � 975 � 2,800
Due from banks 183 � 9,413 1,139 � � 10,735
Cash collateral on securities borrowed and reverse repurchase agreements � � 5,315 1,648 905 � 7,868
Net settled derivative assets � 2,566 1,603 1,653 906 869 7,597 Other financial assets held–for–trading � � 3,803 1,496 1,287 12 6,598
IFRS 7.B11B(a)
Financial assets held–for–trading pledge as collateral � � 1,250 1,099 1,985 15 4,349
Financial assets designated at fair value through profit or loss � � 103 926 310 19 1,358
Loans and advances to customers 2,873 � 25,968 9,465 5,503 3,535 47,344
Financial investments available–for–sale � � 746 3,471 2,634 1,600 8,451
Financial investments available–for–sale pledged as collateral � � 1,652 2,123 473 � 4,248
Financial investments held–to–maturity � � 32 24 45 41 142
Other assets 209 � 576 146 118 11 1,060 Total undiscounted financial assets * 4,270 2,566 51,281 23,190 15,141 6,102 102,550 Financial liabilities
Due to banks 667 � 921 839 335 131 2,893
Cash collateral on securities lent and repurchase agreements � � 10,682 4,207 � � 14,889
Net settled derivative liabilities � 4,181 1,348 1,734 834 924 9,021
IFRS 7.B11B(a)
Financial liabilities held–for–trading 977 � 1,057 1,408 879 � 4,321
Financial liabilities designated at fair value through profit or loss � � 411 253 1,887 2,105 4,656
Due to customers 28,167 � 14,129 4,386 3,776 1,653 52,111
Debt issued and other borrowed funds � � � 1,864 2,003 792 4,659
Other financial liabilities � � � 1,042 727 58 1,827
Total undiscounted financial liabilities * 29,811 4,181 28,548 15,733 10,441 5,663 94,377
Net undiscounted financial assets/(liabilities) * (25,541) (1,615) 22,733 7,457 4,700 439 8,173
Gross settled derivatives not held-for-trading:
IFRS 7.B11D(d)
Financial assets
Contractual amounts receivable � � 25,710 59,500 25,300 61,010 171,520
Contractual amounts payable � � (21,040) (54,000) (19,000) (57,000) (151,040)
� � 4,670 5,500 6,300 4,010 20,480 Financial liabilities
Contractual amounts receivable � � 21,600 67,080 17,030 61,010 166,720
Contractual amounts payable � � (23,240) (75,500) (19,000) (67,000) (184,740)
� � (1,640) (8,420) (1,970) (5,990) (18,020)
Total gross settled derivatives assets/ (liabilities) not held-for-trading � � 3,030 (2,920) 4,330 (1,980) 2,460
Total net undiscounted financial assets/(liabilities) (25,541) (1,615) 25,763 4,537 9,030 (1,541) 10,633
* Excludes gross settled derivatives not held-for-trading
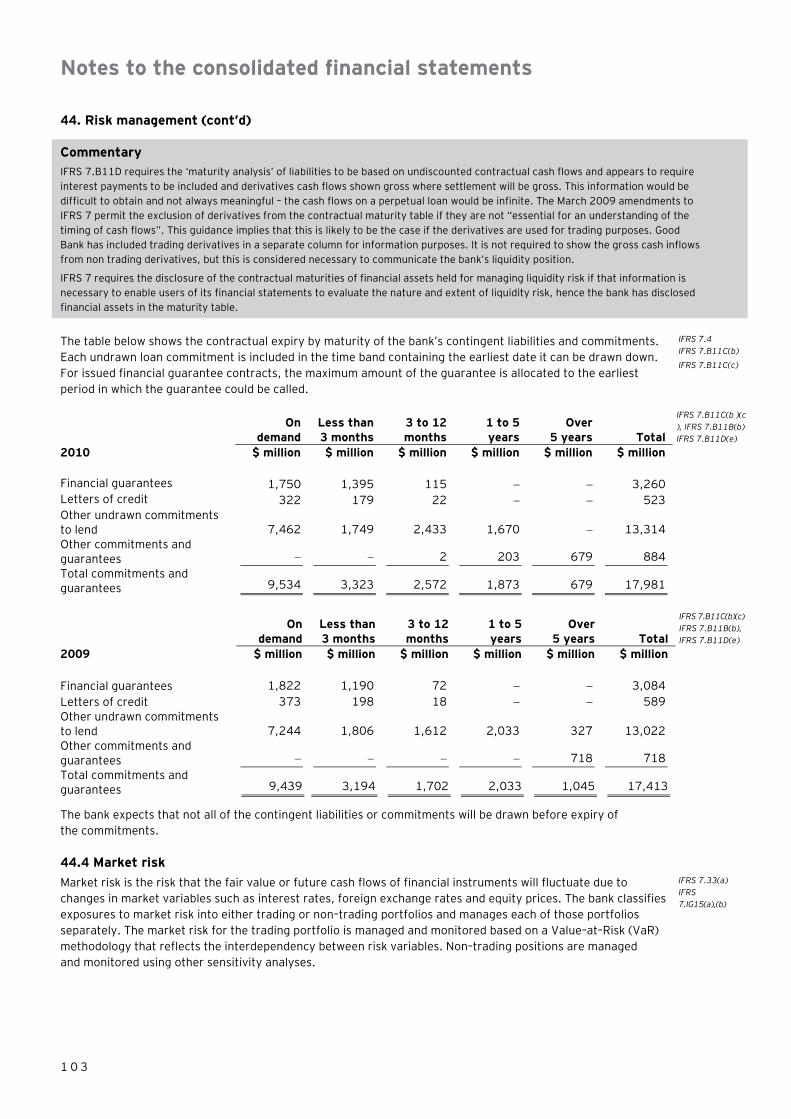
Notes to the consolidated financial statements
1 0 3
44. Risk management (cont’d)
Commentary IFRS 7.B11D requires the ‘maturity analysis’ of liabilities to be based on undiscounted contractual cash flows and appears to require interest payments to be included and derivatives cash flows shown gross where settlement will be gross. This information would be difficult to obtain and not always meaningful – the cash flows on a perpetual loan would be infinite. The March 2009 amendments to IFRS 7 permit the exclusion of derivatives from the contractual maturity table if they are not “essential for an understanding of the timing of cash flows”. This guidance implies that this is likely to be the case if the derivatives are used for trading purposes. Good Bank has included trading derivatives in a separate column for information purposes. It is not required to show the gross cash inflows from non trading derivatives, but this is considered necessary to communicate the bank’s liquidity position.
IFRS 7 requires the disclosure of the contractual maturities of financial assets held for managing liquidity risk if that information is necessary to enable users of its financial statements to evaluate the nature and extent of liquidity risk, hence the bank has disclosed financial assets in the maturity table.
The table below shows the contractual expiry by maturity of the bank’s contingent liabilities and commitments. Each undrawn loan commitment is included in the time band containing the earliest date it can be drawn down. For issued financial guarantee contracts, the maximum amount of the guarantee is allocated to the earliest period in which the guarantee could be called.
IFRS 7.4 IFRS 7.B11C(b)
IFRS 7.B11C(c)
On
demand Less than 3 months
3 to 12 months
1 to 5 years
Over 5 years Total
IFRS 7.B11C(b )(c ), IFRS 7.B11B(b) IFRS 7.B11D(e)
2010 $ million $ million $ million $ million $ million $ million
Financial guarantees 1,750 1,395 115 � � 3,260 Letters of credit 322 179 22 � � 523 Other undrawn commitments to lend 7,462 1,749 2,433 1,670 � 13,314 Other commitments and guarantees � � 2 203 679 884 Total commitments and guarantees 9,534 3,323 2,572 1,873 679 17,981
On
demand Less than 3 months
3 to 12 months
1 to 5 years
Over 5 years Total
IFRS 7.B11C(b)(c) IFRS 7.B11B(b), IFRS 7.B11D(e)
2009 $ million $ million $ million $ million $ million $ million
Financial guarantees 1,822 1,190 72 � � 3,084 Letters of credit 373 198 18 � � 589 Other undrawn commitments to lend 7,244 1,806 1,612 2,033 327 13,022 Other commitments and guarantees � � � � 718 718 Total commitments and guarantees 9,439 3,194 1,702 2,033 1,045 17,413 The bank expects that not all of the contingent liabilities or commitments will be drawn before expiry of the commitments.
44.4 Market risk
Market risk is the risk that the fair value or future cash flows of financial instruments will fluctuate due to changes in market variables such as interest rates, foreign exchange rates and equity prices. The bank classifies exposures to market risk into either trading or non–trading portfolios and manages each of those portfolios separately. The market risk for the trading portfolio is managed and monitored based on a Value–at–Risk (VaR) methodology that reflects the interdependency between risk variables. Non–trading positions are managed and monitored using other sensitivity analyses.
IFRS 7.33(a) IFRS 7.IG15(a),(b)
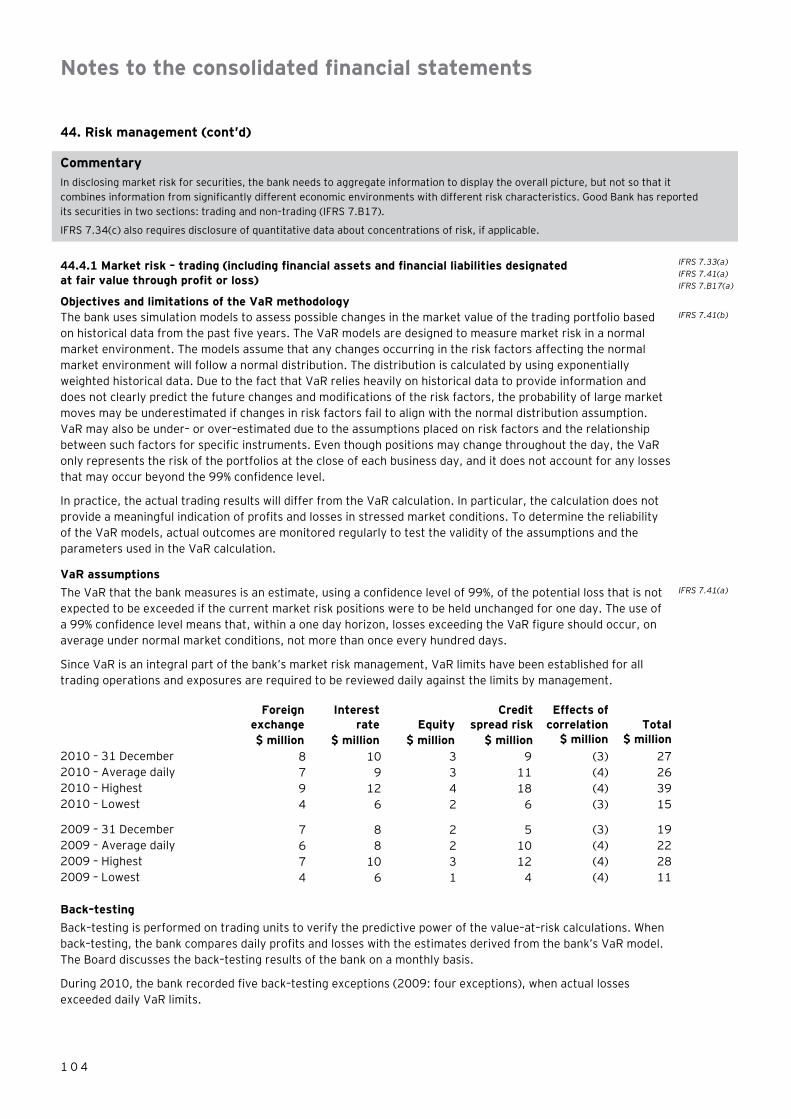
Notes to the consolidated financial statements
1 0 4
44. Risk management (cont’d)
Commentary In disclosing market risk for securities, the bank needs to aggregate information to display the overall picture, but not so that it combines information from significantly different economic environments with different risk characteristics. Good Bank has reported its securities in two sections: trading and non–trading (IFRS 7.B17).
IFRS 7.34(c) also requires disclosure of quantitative data about concentrations of risk, if applicable.
44.4.1 Market risk – trading (including financial assets and financial liabilities designated at fair value through profit or loss)
IFRS 7.33(a) IFRS 7.41(a) IFRS 7.B17(a)
Objectives and limitations of the VaR methodology
The bank uses simulation models to assess possible changes in the market value of the trading portfolio based on historical data from the past five years. The VaR models are designed to measure market risk in a normal market environment. The models assume that any changes occurring in the risk factors affecting the normal market environment will follow a normal distribution. The distribution is calculated by using exponentially weighted historical data. Due to the fact that VaR relies heavily on historical data to provide information and does not clearly predict the future changes and modifications of the risk factors, the probability of large market moves may be underestimated if changes in risk factors fail to align with the normal distribution assumption. VaR may also be under– or over–estimated due to the assumptions placed on risk factors and the relationship between such factors for specific instruments. Even though positions may change throughout the day, the VaR only represents the risk of the portfolios at the close of each business day, and it does not account for any losses that may occur beyond the 99% confidence level.
IFRS 7.41(b)
In practice, the actual trading results will differ from the VaR calculation. In particular, the calculation does not provide a meaningful indication of profits and losses in stressed market conditions. To determine the reliability of the VaR models, actual outcomes are monitored regularly to test the validity of the assumptions and the parameters used in the VaR calculation.
VaR assumptions
The VaR that the bank measures is an estimate, using a confidence level of 99%, of the potential loss that is not expected to be exceeded if the current market risk positions were to be held unchanged for one day. The use of a 99% confidence level means that, within a one day horizon, losses exceeding the VaR figure should occur, on average under normal market conditions, not more than once every hundred days.
IFRS 7.41(a)
Since VaR is an integral part of the bank’s market risk management, VaR limits have been established for all trading operations and exposures are required to be reviewed daily against the limits by management.
Foreign
exchange Interest
rate Equity Credit
spread risk Effects of
correlation Total
$ million $ million $ million $ million $ million $ million 2010 – 31 December 8 10 3 9 (3) 27 2010 – Average daily 7 9 3 11 (4) 26 2010 – Highest 9 12 4 18 (4) 39 2010 – Lowest 4 6 2 6 (3) 15 2009 – 31 December 7 8 2 5 (3) 19 2009 – Average daily 6 8 2 10 (4) 22 2009 – Highest 7 10 3 12 (4) 28 2009 – Lowest 4 6 1 4 (4) 11 Back–testing
Back–testing is performed on trading units to verify the predictive power of the value–at–risk calculations. When back–testing, the bank compares daily profits and losses with the estimates derived from the bank’s VaR model. The Board discusses the back–testing results of the bank on a monthly basis.
During 2010, the bank recorded five back–testing exceptions (2009: four exceptions), when actual losses exceeded daily VaR limits.

Notes to the consolidated financial statements
1 0 5
44. Risk management (cont’d)
Var Backtesting - VaR (1-Day, 99% in millions of Goodland dollars ($) – 2010
Var Backtesting - VaR (1-Day, 99% in millions of Goodland dollars ($) – 2009
44.4.2 Market risk – non-trading
Interest rate risk
Interest rate risk arises from the possibility that changes in interest rates will affect future cash flows or the fair values of financial instruments. The Board has established limits on the non–trading interest rate gaps for stipulated periods. The bank’s policy is to monitor positions on a daily basis and hedging strategies are used to ensure positions are maintained within the established limits.
IFRS 7.B17(a) IFRS 7.B22 IFRS 7.33(a)
Commentary For each relevant risk variable, the entity should determine the reasonable possible change based on the economic environment in which the entity operates, over the period to the next reporting date. The reasonably possible change should not include remote scenarios (IFRS 7.B19).
The following table demonstrates the sensitivity to a reasonable possible change in interest rates, with all other variables held constant, of the bank’s income statement and equity.
The sensitivity of the income statement is the effect of the assumed changes in interest rates on the profit or loss for a year, based on the floating rate non–trading financial assets and financial liabilities held at 31 December 2010, including the effect of hedging instruments. The sensitivity of equity is calculated by revaluing fixed rate available–for–sale financial assets, including the effect of any associated hedges and swaps designated as cash flow hedges, at 31 December for the effects of the assumed changes in interest rates. The total sensitivity of equity is based on the assumption that there are parallel shifts in the yield curve.
IFRS 7.40(b)
-60
-40
-20
0
20
40
60
80
J F A M J S O D
P&L
VAR +ve
VAR -ve
-60
-40
-20
0
20
40
60
J F A M J S O D
P&L
VAR +ve
VAR -ve

Notes to the consolidated financial statements
1 0 6
44. Risk management (cont’d)
Interest rate risk (cont’d) IFRS 7.34(a)
Currency Increase (decrease)
in basis points Sensitivity of profit or loss
Sensitivity of equity
IFRS 7.40(a) IFRS 7.IG32(a) IFRS 7.IG34
2010 2010 2010 IFRS 7.IG33(a)
$ million $ million
$ + 15/(15) (11)/10 60/(62)
USD + 20/(20) 24/(20) (96)/95
GBP + 15/(15) 7/(5) (30)/31
EUR + 20/(15) 15/(17) (63)/60
Others + 25/(25) (4)/(6) 18/(17)
Currency Increase (decrease)
in basis points Sensitivity of profit or loss
Sensitivity of equity
2009 2009 2009
$ million $ million
$ + 15/(15) (13)/15 64/(64)
USD + 20/(20) 32/(32) (98)/100
GBP + 15/(15) 4/(5) (25)/27
EUR + 20/(15) 18/(20) (59)/60
Others + 25/(25) (2)/2 11/(10)
The table below analyses the bank’s interest rate risk exposure on non–trading financial assets and liabilities. The bank’s assets and liabilities are included at carrying amount and categorised by the earlier of contractual re–pricing or maturity dates.
Carrying amount On demand
Less than 3 months
3 to 12 months 1 to 5 years
Over 5 years
Non–interest bearing IFRS 7.34(a)
2010 $ million $ million $ million $ million $ million $ million $ million
Assets Cash and balances with central bank 2,750 2,231 519 � � � � Due from banks 10,604 312 8,877 1,415 � � � Cash collateral on securities borrowed and reverse repurchase agreements 7,628 � 5,680 1,818 130 � � Derivatives held as hedges 3,451 � 311 867 2,273 � � Loans and advances to customers 47,924 2,638 30,368 9,926 4,210 782 � Financial investments–available–for–sale 12,067 3,975 1,009 3,859 2,024 1,199 418 Financial investments–held to maturity 141 � � 24 116 1 � Total 84,565 9,156 46,764 17,909 8,753 1,982 418 Liabilities Due to banks 3,222 1,078 2,105 38 � � � Cash collateral on securities lent and repurchase agreements 15,169 � 10,693 3,973 503 � � Derivative held as hedges 2,916 � 681 311 1,924 � � Due to customers 53,143 29,377 14,889 8,275 414 188 � Debt issued and other borrowed funds 5,310 98 2,192 1,106 1,141 773 � Other liabilities 2,097 58 220 1,818 Total 81,857 30,611 30,560 13,703 4,202 961 1,818 Total interest sensitivity gap 2,708 (21,455) 16,204 4,206 4,551 1,022 (1,400) Commentary IFRS 7.34(a) requires an entity to disclose a summary of quantitative data about its exposure for each type of risk at the reporting date, which should be based on the information provided internally to the management. IFRS 7 does not explicitly specify whether an entity needs to provide disclosure of contractual re–pricing of its interest rate exposures. The above disclosure is voluntarily adopted by the bank, in addition to the interest rate sensitivity analysis disclosed earlier.

Notes to the consolidated financial statements
1 0 7
44. Risk management (cont’d)
Interest rate risk (cont’d) IFRS 7.34(a)
Carrying
amount On demand Less than 3
months 3 to 12 months 1 to 5 years
Over 5 years
Non–interest bearing IFRS 7.34(a)
2009 $ million $ million $ million $ million $ million $ million $ million Assets Cash and balances with central bank 2,702 1,766 936 � � � � Due from banks 10,489 204 9,371 914 � � � Cash collateral on securities borrowed and reverse repurchase agreements 7,673 � 5,331 1,521 821 � � Derivative held as hedges 3,345 � 129 1,023 2,193 � � Loans and advances to customers 47,163 3,196 26,594 9,343 4,459 3,571 � Financial investments available–for–sale 12,388 3,729 1,001 3,891 2,363 1,405 198 Financial investments held-to-maturity 127 � � 37 87 2 � Total 83,887 8,895 43,362 16,729 9,923 4,978 198 Liabilities Due to banks 3,174 1,178 1,180 816 � � � Cash collateral on securities lent and repurchase agreements 15,214 � 10,775 4,208 220 � � Derivative held as hedges 2,798 � 794 404 1,600 � � Due to customers 53,177 24,398 16,084 8,652 3,334 708 � Debt issued and other borrowed funds 5,179 119 2,048 1,150 1,816 47 �
Other liabilities 2,057 142 � � � � 1,915 Total 81,599 25,837 30,881 15,230 6,970 755 1,915 Total interest sensitivity gap 2,288 (16,942) 12,481 1,499 2,953 4,223 (1,717) Currency risk IFRS 7.B23
Currency risk is the risk that the value of a financial instrument will fluctuate due to changes in foreign exchange rates. The Board has set limits on positions by currency. In accordance with the bank’s policy, positions are monitored on a daily basis and hedging strategies are used to ensure positions are maintained within established limits.
The table below indicates the currencies to which the bank had significant exposure at 31 December 2010 on its non–trading monetary assets and liabilities and its forecast cash flows. The analysis calculates the effect of a reasonably possible movement of the currency rate against the Goodland dollar, with all other variables held constant, on the income statement (due to the fair value of currency sensitive non–trading monetary assets and liabilities) and equity (due to the change in fair value of currency swaps and forward foreign exchange contracts used as cash flow hedges). A negative amount in the table reflects a potential net reduction in income statement or equity, while a positive amount reflects a net potential increase. An equivalent decrease in each of the below currencies against the Goodland dollar would have resulted in an equivalent but opposite impact.
IFRS 7.40(b)
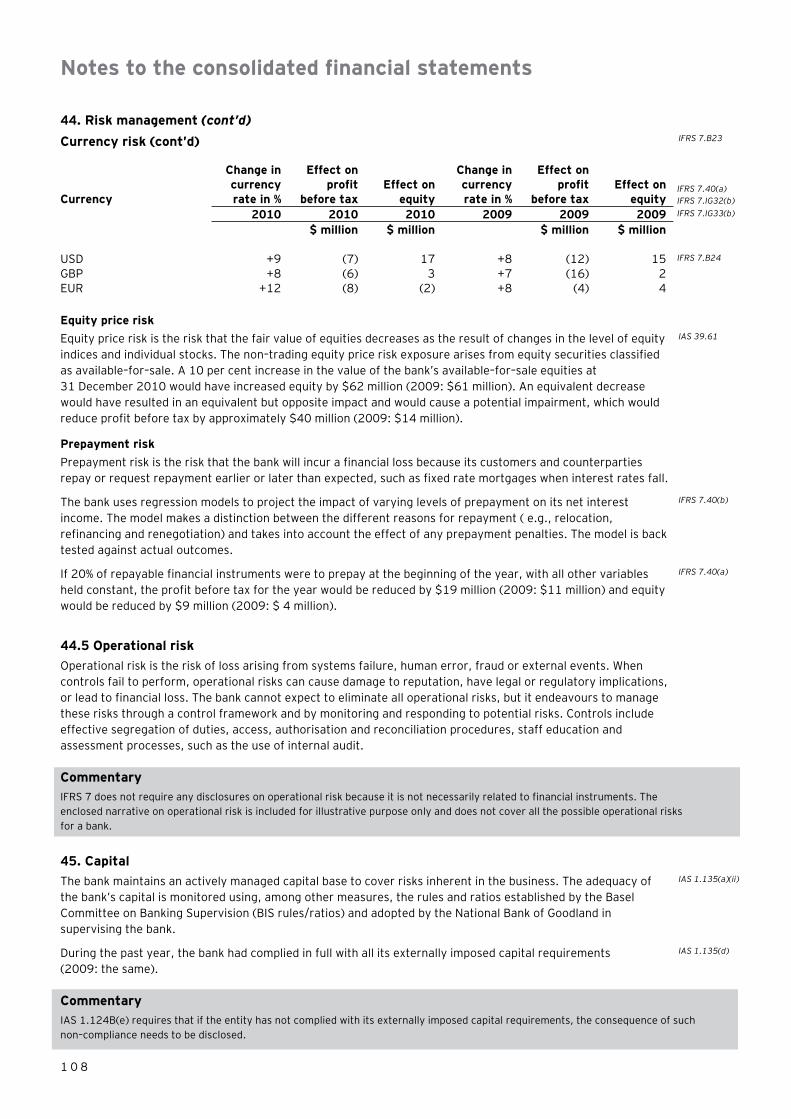
Notes to the consolidated financial statements
1 0 8
44. Risk management (cont’d)
Currency risk (cont’d) IFRS 7.B23
Currency
Change in currency rate in %
Effect on profit
before tax Effect on
equity
Change in currency rate in %
Effect on profit
before tax Effect on
equity IFRS 7.40(a) IFRS 7.IG32(b)
2010 2010 2010 2009 2009 2009 IFRS 7.IG33(b)
$ million $ million $ million $ million
USD +9 (7) 17 +8 (12) 15 IFRS 7.B24
GBP +8 (6) 3 +7 (16) 2
EUR +12 (8) (2) +8 (4) 4
Equity price risk
Equity price risk is the risk that the fair value of equities decreases as the result of changes in the level of equity indices and individual stocks. The non–trading equity price risk exposure arises from equity securities classified as available–for–sale. A 10 per cent increase in the value of the bank’s available–for–sale equities at 31 December 2010 would have increased equity by $62 million (2009: $61 million). An equivalent decrease would have resulted in an equivalent but opposite impact and would cause a potential impairment, which would reduce profit before tax by approximately $40 million (2009: $14 million).
IAS 39.61
Prepayment risk
Prepayment risk is the risk that the bank will incur a financial loss because its customers and counterparties repay or request repayment earlier or later than expected, such as fixed rate mortgages when interest rates fall.
The bank uses regression models to project the impact of varying levels of prepayment on its net interest income. The model makes a distinction between the different reasons for repayment ( e.g., relocation, refinancing and renegotiation) and takes into account the effect of any prepayment penalties. The model is back tested against actual outcomes.
IFRS 7.40(b)
If 20% of repayable financial instruments were to prepay at the beginning of the year, with all other variables held constant, the profit before tax for the year would be reduced by $19 million (2009: $11 million) and equity would be reduced by $9 million (2009: $ 4 million).
IFRS 7.40(a)
44.5 Operational risk
Operational risk is the risk of loss arising from systems failure, human error, fraud or external events. When controls fail to perform, operational risks can cause damage to reputation, have legal or regulatory implications, or lead to financial loss. The bank cannot expect to eliminate all operational risks, but it endeavours to manage these risks through a control framework and by monitoring and responding to potential risks. Controls include effective segregation of duties, access, authorisation and reconciliation procedures, staff education and assessment processes, such as the use of internal audit.
Commentary IFRS 7 does not require any disclosures on operational risk because it is not necessarily related to financial instruments. The enclosed narrative on operational risk is included for illustrative purpose only and does not cover all the possible operational risks for a bank.
45. Capital
The bank maintains an actively managed capital base to cover risks inherent in the business. The adequacy of the bank’s capital is monitored using, among other measures, the rules and ratios established by the Basel Committee on Banking Supervision (BIS rules/ratios) and adopted by the National Bank of Goodland in supervising the bank.
IAS 1.135(a)(ii)
During the past year, the bank had complied in full with all its externally imposed capital requirements (2009: the same).
IAS 1.135(d)
Commentary IAS 1.124B(e) requires that if the entity has not complied with its externally imposed capital requirements, the consequence of such non–compliance needs to be disclosed.
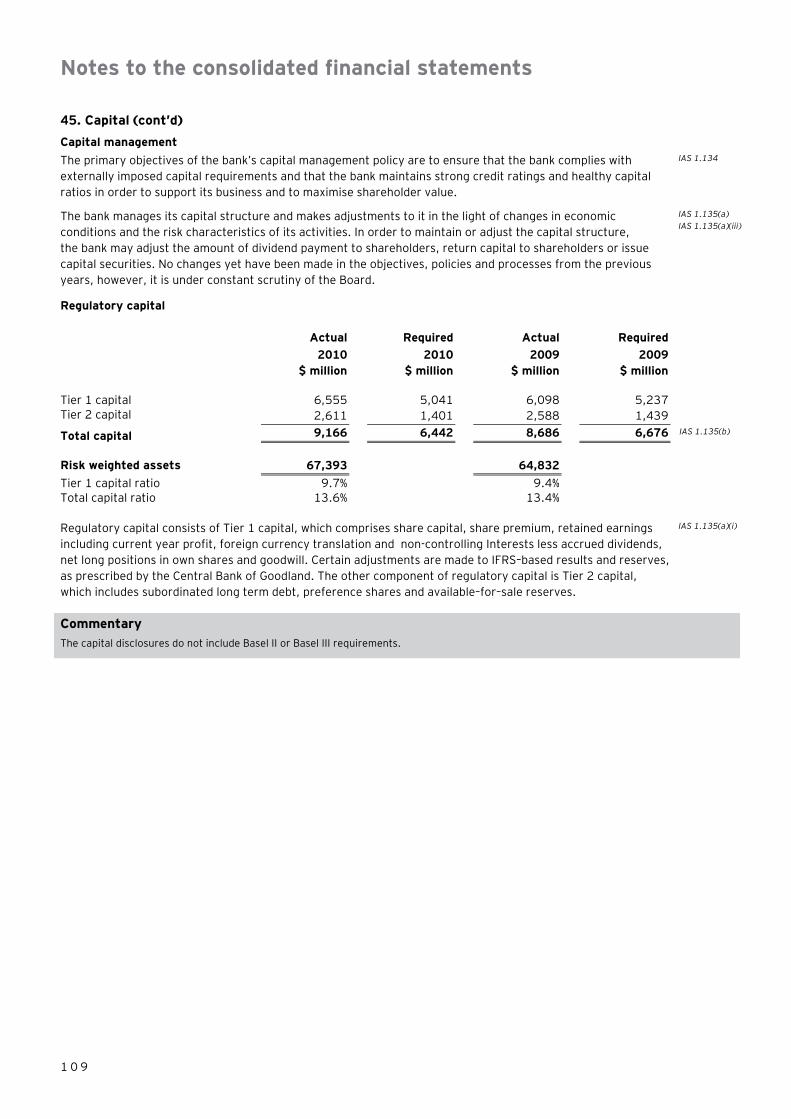
Notes to the consolidated financial statements
1 0 9
45. Capital (cont’d)
Capital management
The primary objectives of the bank’s capital management policy are to ensure that the bank complies with externally imposed capital requirements and that the bank maintains strong credit ratings and healthy capital ratios in order to support its business and to maximise shareholder value.
IAS 1.134
The bank manages its capital structure and makes adjustments to it in the light of changes in economic conditions and the risk characteristics of its activities. In order to maintain or adjust the capital structure, the bank may adjust the amount of dividend payment to shareholders, return capital to shareholders or issue capital securities. No changes yet have been made in the objectives, policies and processes from the previous years, however, it is under constant scrutiny of the Board.
IAS 1.135(a) IAS 1.135(a)(iii)
Regulatory capital
Actual Required Actual Required
2010 2010 2009 2009
$ million $ million $ million $ million
Tier 1 capital 6,555 5,041 6,098 5,237
Tier 2 capital 2,611 1,401 2,588 1,439
Total capital 9,166 6,442 8,686 6,676 IAS 1.135(b)
Risk weighted assets 67,393 64,832
Tier 1 capital ratio 9.7% 9.4%
Total capital ratio 13.6% 13.4%
Regulatory capital consists of Tier 1 capital, which comprises share capital, share premium, retained earnings including current year profit, foreign currency translation and non-controlling Interests less accrued dividends, net long positions in own shares and goodwill. Certain adjustments are made to IFRS–based results and reserves, as prescribed by the Central Bank of Goodland. The other component of regulatory capital is Tier 2 capital, which includes subordinated long term debt, preference shares and available–for–sale reserves.
IAS 1.135(a)(i)
Commentary The capital disclosures do not include Basel II or Basel III requirements.

Index
1 1 0
Advisory panel 1,5,48,51,63 64,67,68,69,71
IAS 1 Presentation of financial statements
IAS 1.6 13 IAS 1.7 10 IAS 1.9 8,10 IAS 1.10 12,13 IAS 1.11 85 IAS 1.25 14 IAS 1.26 14 IAS 1.29 8,10 IAS 1.32 8,10,13 IAS 1.45 8 IAS 1.46 8 IAS 1.51 8,9,10,11,12,13 IAS 1.54 10 IAS 1.55 10 IAS 1.60 10,13 IAS 1.61 13,81,82 IAS 1.69 57 IAS 1.70 10 IAS 1.77 52,56 IAS 1.78 10,52,60,61 IAS 1.79 10,56,60 IAS 1.82 8,9 IAS 1.83 8,9 IAS 1.86 8 IAS 1.90 9 IAS 1.96 9,11 IAS 1.99 8 IAS 1.104 8 IAS 1.106 11,60 IAS 1.107 11 IAS 1.112 13 IAS 1.113 13 IAS 1.117 13 IAS 1.122 14 IAS 1.125 14 IAS 1.134 109 IAS 1.135 108,109 IAS 1.138 13 IAS 7 Financial Instruments Disclosures)
IAS 7.10 12 IAS 7.16 12 IAS 7.17 12,56 IAS 7.18 12 IAS 7.20 12 IAS 7.21 12 IAS 7.25 12 IAS 7.28 12 IAS 7.31 12 IAS 7.34 12
IAS 7.35 12 IAS 7.43 12 IAS 7.45 12,79 IAS 7.48 79 IAS 7.49 79 IAS 8 Accounting Policies, Changes in Accounting Estimates and Errors
IAS 8.23 33,34 IAS 8.24 33,34 IAS 8.28 8,11 IAS 8.29 9 IAS 8.33 35 IAS 10 Events after the statement of financial position Date
IAS 10.14 14 IAS 10.15 14 IAS 10.16 14 IAS 10.17 13 IAS 10.21 85 IAS 12 Income Taxes
IAS 12.34 15 IAS 12.77 8 IAS 16 Property, Plant and Equipment
IAS 16.73 52 IAS 16.79 53 IAS 17 Leases
IAS 17.24 83 IAS 17.31 53 IAS 17.35 83 IAS 17.47 83 IAS 17.56 83 IAS 18 Revenue
IAS 18.30 17,18,20
IAS 19 Employee Benefits
IAS 19.46 57 IAS 19.63 15 IAS 19.93 11 IAS 19.120 57,58,59 IAS 21 The Effects of Changes in Foreign Exchange Rates
IAS 21.21 16 IAS 21.23 16 IAS 21.28 16 IAS 21.32 16 IAS 21.39 16,61
IAS 21.48 16
IAS 24 Related Party Disclosures
IAS 24.12 85 IAS 24.17 84 IAS 24.21 84 IAS 24.22 84
IAS 27 Consolidated and Separate Financial Statements
IAS 27.12 13,14 IAS 27.20 13 IAS 27.21 13 IAS 27.22 13 IAS 27.24 13 IAS 27.26 13 IAS 27.27 14 IAS 27.28 14 IAS 27.33 8,9,10
IAS 32 Financial Instruments: Presentation
IAS 32.11 19 IAS 32.15 56 IAS 32.16 19 IAS 32.28 19 IAS 32.31 19 IAS 32.33 10 IAS 32.42 13 IAS 32.50 93
IAS 33 Earnings Per Share
IAS 33.66 8
IAS 36 Impairment of Assets
IAS 36.80 53 IAS 36.134 53,54
IAS 37 Provisions, Contingent Liabilities and Contingent Assets
IAS 37.84 56,57 IAS 37.85 57 IAS 37.86 82,99
IAS 38 Intangible Assets
IAS 38.118 8,53
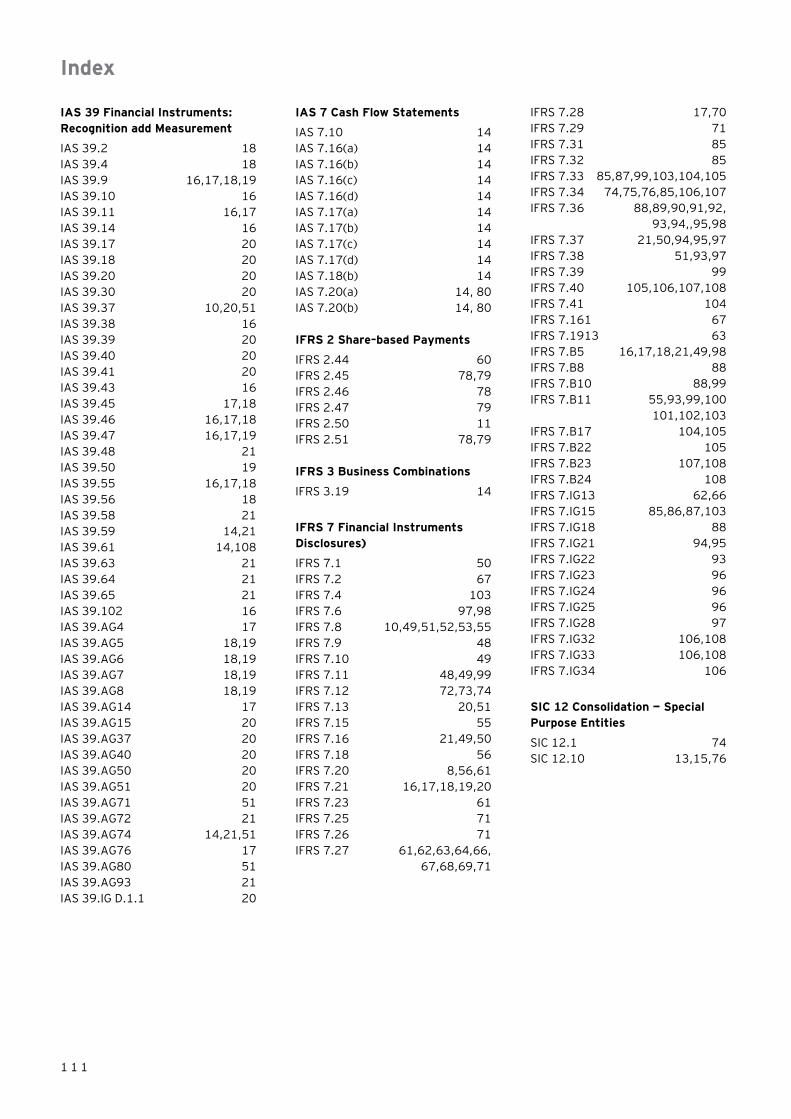
Index
1 1 1
IAS 39 Financial Instruments: Recognition add Measurement
IAS 39.2 18 IAS 39.4 18 IAS 39.9 16,17,18,19 IAS 39.10 16 IAS 39.11 16,17 IAS 39.14 16 IAS 39.17 20 IAS 39.18 20 IAS 39.20 20 IAS 39.30 20 IAS 39.37 10,20,51 IAS 39.38 16 IAS 39.39 20 IAS 39.40 20 IAS 39.41 20 IAS 39.43 16 IAS 39.45 17,18 IAS 39.46 16,17,18 IAS 39.47 16,17,19 IAS 39.48 21 IAS 39.50 19 IAS 39.55 16,17,18 IAS 39.56 18 IAS 39.58 21 IAS 39.59 14,21 IAS 39.61 14,108 IAS 39.63 21 IAS 39.64 21 IAS 39.65 21 IAS 39.102 16 IAS 39.AG4 17 IAS 39.AG5 18,19 IAS 39.AG6 18,19 IAS 39.AG7 18,19 IAS 39.AG8 18,19 IAS 39.AG14 17 IAS 39.AG15 20 IAS 39.AG37 20 IAS 39.AG40 20 IAS 39.AG50 20 IAS 39.AG51 20 IAS 39.AG71 51 IAS 39.AG72 21 IAS 39.AG74 14,21,51 IAS 39.AG76 17 IAS 39.AG80 51 IAS 39.AG93 21 IAS 39.IG D.1.1 20
IAS 7 Cash Flow Statements
IAS 7.10 14 IAS 7.16(a) 14 IAS 7.16(b) 14 IAS 7.16(c) 14 IAS 7.16(d) 14 IAS 7.17(a) 14 IAS 7.17(b) 14 IAS 7.17(c) 14 IAS 7.17(d) 14 IAS 7.18(b) 14 IAS 7.20(a) 14, 80 IAS 7.20(b) 14, 80 IFRS 2 Share–based Payments
IFRS 2.44 60 IFRS 2.45 78,79 IFRS 2.46 78 IFRS 2.47 79 IFRS 2.50 11 IFRS 2.51 78,79 IFRS 3 Business Combinations
IFRS 3.19 14
IFRS 7 Financial Instruments Disclosures)
IFRS 7.1 50 IFRS 7.2 67 IFRS 7.4 103 IFRS 7.6 97,98 IFRS 7.8 10,49,51,52,53,55 IFRS 7.9 48 IFRS 7.10 49 IFRS 7.11 48,49,99 IFRS 7.12 72,73,74 IFRS 7.13 20,51 IFRS 7.15 55 IFRS 7.16 21,49,50 IFRS 7.18 56 IFRS 7.20 8,56,61 IFRS 7.21 16,17,18,19,20 IFRS 7.23 61 IFRS 7.25 71 IFRS 7.26 71 IFRS 7.27 61,62,63,64,66, 67,68,69,71
IFRS 7.28 17,70 IFRS 7.29 71 IFRS 7.31 85 IFRS 7.32 85 IFRS 7.33 85,87,99,103,104,105 IFRS 7.34 74,75,76,85,106,107 IFRS 7.36 88,89,90,91,92, 93,94,,95,98 IFRS 7.37 21,50,94,95,97 IFRS 7.38 51,93,97 IFRS 7.39 99 IFRS 7.40 105,106,107,108 IFRS 7.41 104 IFRS 7.161 67 IFRS 7.1913 63 IFRS 7.B5 16,17,18,21,49,98 IFRS 7.B8 88 IFRS 7.B10 88,99 IFRS 7.B11 55,93,99,100 101,102,103 IFRS 7.B17 104,105 IFRS 7.B22 105 IFRS 7.B23 107,108 IFRS 7.B24 108 IFRS 7.IG13 62,66 IFRS 7.IG15 85,86,87,103 IFRS 7.IG18 88 IFRS 7.IG21 94,95 IFRS 7.IG22 93 IFRS 7.IG23 96 IFRS 7.IG24 96 IFRS 7.IG25 96 IFRS 7.IG28 97 IFRS 7.IG32 106,108 IFRS 7.IG33 106,108 IFRS 7.IG34 106
SIC 12 Consolidation — Special Purpose Entities
SIC 12.1 74 SIC 12.10 13,15,76

1 1 2
Published in 2010
By: EYGM Limited
© 2010 EYGM Limited. All rights reserved.
Disclaimer
This publication contains information in summary form and is therefore intended for general guidance only. It is not intended to be a substitute for detailed research or the exercise of professional judgment. Neither EYGM Limited nor any other member of the global Ernst & Young organisation can accept any responsibility for loss occasioned to any person acting or refraining from action as a result of any material in this publication. On any specific matter, reference should be made to the appropriate adviser.

Ernst & YoungAssurance | Tax | Transactions | Advisory
About Ernst & YoungErnst & Young is a global leader in assurance, tax, transaction and advisory services. Worldwide, our 141,000 people are united by our shared values and an unwavering commitment to quality. We make a difference by helping our people, our clients and our wider communities achieve their potential.
Ernst & Young refers to the global organization of member firms of Ernst & Young Global Limited, each of which is a separate legal entity. Ernst & Young Global Limited, a UK company limited by guarantee, does not provide services to clients. For more information about our organization, please visit www.ey.com
About Ernst & Young’s International Financial Reporting Standards GroupThe move to International Financial Reporting Standards (IFRS) is the single most important initiative in the financial reporting world, the impact of which stretches far beyond accounting to affect every key decision you make, not just how you report it. We have developed the global resources — people and knowledge — to support our client teams. And we work to give you the benefit of our broad sector experience, our deep subject matter knowledge and the latest insights from our work worldwide. It’s how Ernst & Young makes a difference.
© 2010 EYGM Limited.All Rights Reserved.
EYG no. AU0731