goldman sachs jbwere australasian forum 2007 - new york...unique production footprint and building...
TRANSCRIPT
Goldman Sachs JBWere Australasian Forum 2007 - New YorkKirby AdamsManaging Director and Chief Executive Officer
7-9 March 2007
ASX Code: BSL

Page 2
Important notice
THIS PRESENTATION IS NOT AND DOES NOT FORM PART OF ANY OFFER, INVITATION OR RECOMMENDATION IN RESPECT OF SECURITIES. ANY DECISION TO BUY OR SELL BLUESCOPE STEEL LIMITED SECURITIES OR OTHER PRODUCTS SHOULD BE MADE ONLY AFTER SEEKING APPROPRIATE FINANCIAL ADVICE. RELIANCE SHOULD NOT BE PLACED ON INFORMATION OR OPINIONS CONTAINED IN THIS PRESENTATION AND, SUBJECT ONLY TO ANY LEGAL OBLIGATION TO DO SO, BLUESCOPE STEEL DOES NOT ACCEPT ANY OBLIGATION TO CORRECT OR UPDATE THEM. THIS PRESENTATION DOES NOT TAKE INTO CONSIDERATION THE INVESTMENT OBJECTIVES, FINANCIAL SITUATION OR PARTICULAR NEEDS OF ANY PARTICULAR INVESTOR.
TO THE FULLEST EXTENT PERMITTED BY LAW, BLUESCOPE STEEL AND ITS AFFILIATES AND THEIR RESPECTIVE OFFICERS, DIRECTORS, EMPLOYEES AND AGENTS, ACCEPT NO RESPONSIBILITY FOR ANY INFORMATION PROVIDED IN THIS PRESENTATION, INCLUDING ANY FORWARD LOOKING INFORMATION, AND DISCLAIM ANY LIABILITY WHATSOEVER (INCLUDING FOR NEGLIGENCE) FOR ANY LOSS HOWSOEVER ARISING FROM ANY USE OF THIS PRESENTATION OR RELIANCE ON ANYTHING CONTAINED IN OR OMITTED FROM IT OR OTHERWISE ARISING IN CONNECTION WITH THIS.

Page 3
Introduction and Introduction and HeadlinesHeadlines

Page 4
BlueScope Steel Overview
Global flat steel product solutions company – spun out of BHP July 2002EV at listing approximately A$3.0B - today A$9.0BUnique production footprint and building products franchise in
Australia / New ZealandChina, SE Asia and IndiaNorth America
Leading regional positions inMetallic coating and painting of steel coilRollformed steel building products – roofing, walling, purlins and deckingPre-engineered steel buildings
Financial metrics (1H FY2007)Revenue A$4.5B (A$4.9B inclusive of USA JV)EBIT A$635MROE 24%Gearing (net debt) 35.6%
Cash from operations – strong - $752M in 6 months. EBITDA A$794MFocus on rewarding shareholders as we grow – 78% NPAT over 4.5 yearsStrategy – midstream and downstream growth to create a more diversified and stable revenue / earnings profileCore Value is Care – for employees, communities, customers and shareholders

Page 5
3.44.1
3.42.8
1.8 1.50.9 0.8 0.4
4.8
8.0
14
16
0
2
4
6
8
10
12
14
16
18
1995 1996 1997 1998 1999 2000 2001 2002 2003 2004 2005 2006 1H2007
Lost
time i
njurie
s per
milli
on m
an-h
ours
worke
d
Includes Contractor performance from 1996Includes Butler performance from May 2004
Medically Treated Injury Frequency RateLost Time Injury Frequency Rate
8.2 9.3 6.812
172222
29
9.36.5
4752
60
0
10
20
30
40
50
60
70
1995 1996 1997 1998 1999 2000 2001 2002 2003 2004 2005 2006 1H2007
Medic
ally t
reate
d inju
ries p
er m
illion
man
-hou
rs wo
rked
Includes Contractor performance from 2004Includes Butler performance from May 2004
Reported performance for IISI member companies
(employee only)
18,269 Employees, 98 manufacturing sites, 17 countries
Zero harm is our goal for our team and communities
NSW Manufacturing 27.9 in 2005

Page 6
Continuing to reward our shareholders as we grow
Share Buybacks – Public listing to 31 December 2006Purchased and cancelled 116m shares− on market – 90m shares− off market – 26m shares
Average price paid $6.10 per shareShares on issue
As at 31 December 2006 726.6 millionDividend reinvestment scheme
Effective from and including final FY2006 ordinary dividend
Dividends – All fully franked (ordinary / special)
Total return to shareholders since BSL’spublic listing (July 2002):
Share buybacks $ 707m 26%Dividends paid $ 1,277mInterim dividend (to be paid 02Apr07) $ 153m
$ 2,137m 78%
$2.89 per share or 78% payout ratio (NPAT)
52%
18
24
7 1020 2120
9 1218
24
13
05
101520253035404550
Interim Final Special
FY2003 FY2004 FY2005 FY2006 FY2007
22 / 7¢
30 / 10¢
42 / 20¢ 44 / 0¢

Page 7
Group financial headlines 1H FY2007 vs. 1H FY2006
Across the board improvementsSix months ended 31 December Variance
2007 2006 %Revenue A$4,528M A$3,892M Up 16% (record half year)External despatches 3.7M tonnes 3.5M tonnes Up 6% (record)EBITDA A$794M A$593M Up 34%
EBIT A$635M A$449M Up 41%
NPAT A$388M A$312M Up 24%EPS- Reported 54.7¢ 44.0¢ Up 24%
After Tax Return on Invested Capital 17.0% 14.6% Up 16%
Return on Equity 24.0% 18.9% Up 27%
Net Operating Cashflow
- From operating activities A$697M A$349M Up 100%- After capex / investments A$133M A$(156)M Up 185%
Dividend- Interim ordinary (fully franked) 21 cps 20cps Up 5%
Gearing (net debt) 35.6% 33.2% Down from 38% (June 06)

Page 8
Record sales volumes, driven by strong demand for BlueScope’sproducts
15%
39%
4%
11%
9%
7%
15%
16%
45%5%
11%
11%
4%8%
Exports - Americas
Exports - Asia
Exports – Europe/Med/Middle East/India Australia
NA (NSBSS + C&BPNA) New Zealand/Pacific
Asia
ExternalDespatches
KeyDomestic sales (produced and sold within country)
Record Half
Exports23%
16%
34%
4%8%
14%
3%
21%
1H FY2007
Exports31%
Australia
NZ
Asia
Exports - Americas
Exports Europe/Med/ME/IndiaExports - Asia
Exports38%
3,457MT 3,544MT 3,741MT
1H FY2005 1H FY2006
NorthAmerica

Page 9
EBIT variance 1H FY2006 to 1H FY2007 by item
250
350
450
550
650
750
850
HY December05
Export Prices DomesticPrices
Volume / Mix North StarSpread
Conversion &Other Costs
Raw MaterialCosts
ExchangeRates
Other HY December06
$449m
$133m$635m
($204m)
$164m
$38m
($11m)
$40m
$15m
$11m
EBIT
A$ M
illion
s
Iron Ore (4)Coal (6)Opening Inventory (71)Scrap (12)Coating Metals (112)Ext Steel Feed 1
*
Higher export slab and HRC prices
Recovery from Western Port fire and
increased Asian despatches
Smorgon dividend 9Lower redundancy 8Prior period rebates 4General employee
share plan costs 12Asset sales 5
Note:
(*) In late FY2005, BlueScope purchased 300 – 400kt of lower priced iron ore, noting iron ore fines increased by approximately 71.5% from 1 July 2006. An equivalent arrangement was not available at the end of FY2006.

Page 10
Cashflow – a real strength and point of differentiation
First HalfA$M FY2003 FY2006 FY2007
563
(214)
349
(365)Smorgon Steel shareholding (19.9%) - - (319)
(763) (356) (712)
(239)
(390)638
(7)Closing cash increase / (decrease) 1 (15)
Source
Cashflow from operations 795 752
Working capital movement (31) (55)
Net cash from operations 764 697
Application
Capital Expenditure (165) (245)
Statutory (tax) (29) (126)
Returned to shareholders (101) (169)Net Funding (468) 147
First full year of operations after listing
Strong operations performance
$168M underwritten DRP and debt reduction / other ($21M)
Working capital improvement initiatives pay off
Includes special dividend
Greenfield capex program slowing

Page 11
Balance sheet – working capital reductions and lower gearing improve financial flexibility
As at A$ Millions 30 June 2006 31 December 2006
Assets Cash 62 58 Receivables 1,344 1,181 Inventory 1,329 1,410 Other Assets 783 1,180 Net Fixed Assets 3,743 3,736
Total Assets 7,261 7,565
Liabilities Creditors 959 838 Interest Bearing Liabilities 1,952 1,983 Provisions & other Liabilities 1,265 1,253 Total Liabilities 4,176 4,074
Net Assets 3,085 3,491 Net Debt / (Net Debt + Equity) 38.0% 35.6%
Total revenue up 9% BUTreceivables down 12%
(1)
Debt flat even with Smorgon
19.9% ($319M)
2.4 percentage point
improvement in 6 months
(1) Includes BlueScope’s 19.9% shareholding in Smorgon Steel

Page 12
Reporting SegmentReporting SegmentPerformancePerformance

Page 13
Reporting business segments
Corporate / Group
Hot Rolled Products
Australia
Lowest quartile producerLeading supplier of flat steel in AustraliaGlobal scale
o Port Kembla Steelworks
New Zealand & Pacific Islands
Products
Only fully integrated flat steel maker in New ZealandLeading domestic market share of flat products
o Pacific Islandso Glenbrook, NZ
Pre-eminent global designer / supplier Pre-engineered buildingsNo 2 position in North America and no. 1 in China
o Butler buildingso Vistawall
Coated & Building Products
North America
Australia New Zealand Asia North America
Hot Rolled Products
North America
50:50 joint venture with Cargill Inc.Again voted no. 1 flat rolled steel supplier in North America (Jacobson Survey)
o Delta, Ohio
Coated & Building
Products Asia
Pre-eminent seller of branded steel in AsiaLower cost “backward integration” growth strategy
o Indonesian, Malaysian, Thailand and Vietnamese operations
o China, including Butlero Lysaght Asiao India – Tata
BlueScope JV
Largest supplier of metallic coated and painted steel in AustraliaLeading market shares in most key products
o Western Porto Springhillo Lysaght Australiao Service Centres
Coated & Building Products Australia

Page 14
All BlueScope business segments profitable and all growing revenue
300
350
400
450
500
550
600
650
700
HY December05
Hot RolledProductsAustralia
Coated &Bldg Products
Aust
NZ & Pacif icIslands
Products
Coated &Bldg Products
Asia
Hot RolledProducts Nth
America
Coated &Bldg ProductsNth America
Corporate &Group
DiscontinuedBusinesses
HY December06
-
$449m$28m
$635m$9m
$50m
$45m
$13m
$29m
($23m)
$35m
EBIT
A$ M
illion
s
EBIT MovementsFrom 1H FY2006 $410M $(30)M $66M $2M $67M $2M $(61)M $(6)M
To 1H FY2007 $438M $20M $43M $31M $112M $37M $(48)M
• SSX dividend
• Loweremployee share plan costs
-
$3M
Due to:
1H FY2007 Sales Revenue
• Higher export steel prices
• Higher domestic volumes
• $2,000M+10%
• Higher sales vols
• Higher zinc costs
• Improved operations
• Packaging loss
• $1,699M+19%
• Higher zinc costs
• Higher R&M
• $364M+1%
• Higher sales volumes
• Higher prices
• Lower one-off costs
• $676M+46%
• Improved spread (North Star)
• Higher slab & HRC prices for trading office sales
• $661M(inc. NSBSS)
+29%
• Higher sales vols
• Improved productivity
• Increased market share
• $656M+8%
• Taiwan closure
-
EBIT variance 1H FY2006 to 1H FY2007 by reporting business segment

Page 15
Unique production footprint in the world’s fastest growing regions
ThailandCold Rolling 350kt
Metal Coating 375kt Painting 90kt
MalaysiaMetal Coating 150kt
Painting 60kt
IndonesiaMetal Coating 100kt
Painting 50kt
Western PortHot Rolling 1.43mtCold Rolling 1.0mt
MC (3 lines) 830kt +Painting (2 lines) 330kt +
BrisbanePainting 90kt
Port Kembla / IllawarraRaw Steel 5.2mt
Hot Rolling 2.8mt (inc HSM Exp)Plate 360kt
Cold Rolling 930kt Tinplate/Black plate 450k (1)
MC (3 lines) 750kt +PL (2 lines) 207kt +
New Zealand / PacificIron sand MiningRaw Steel 625ktHot Rolling 750ktCold Rolling360kt
Metal Coating 230kt +Painting 60kt
Hollow Sections 45ktPacific Roll forming sites 3
• Coated and Building Products Butler / Vistawall
• North Star BluescopeJVHot Rolling 1.80mt (100%)
• Castrip JV with Nucor
Australia7 Service Centres37 Lysaght Sites
7 Bluescope Water
VietnamMC 125kt
Painting 50kt
Pan Asia24 Lysaght and Butler PEB sites
ChinaMC 250kt
Painting 150kt
IndiaMetal Coating 250kt
Painting 150kt
SydneyPaint Line (1 line) 120 kt(1) Facility to close (expected April 2007)
Page 16
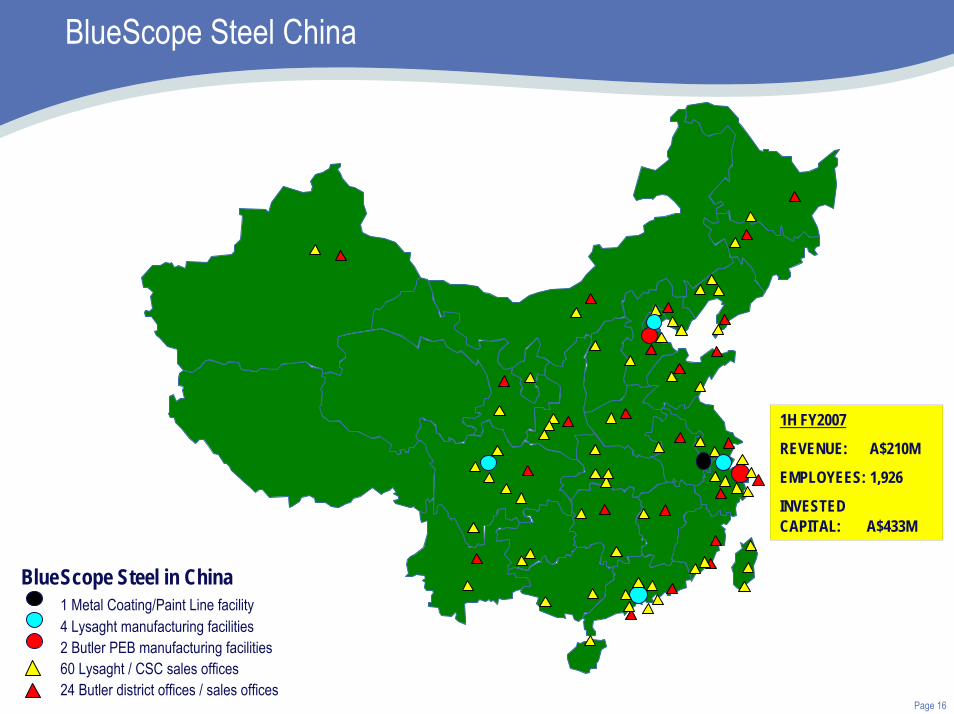
BlueScope Steel China
BlueScope Steel in China1 Metal Coating/Paint Line facility4 Lysaght manufacturing facilities 2 Butler PEB manufacturing facilities60 Lysaght / CSC sales offices24 Butler district offices / sales offices
1H FY2007
REVENUE: A$210M
EMPLOYEES: 1,926
INVESTED CAPITAL: A$433M
Page 17
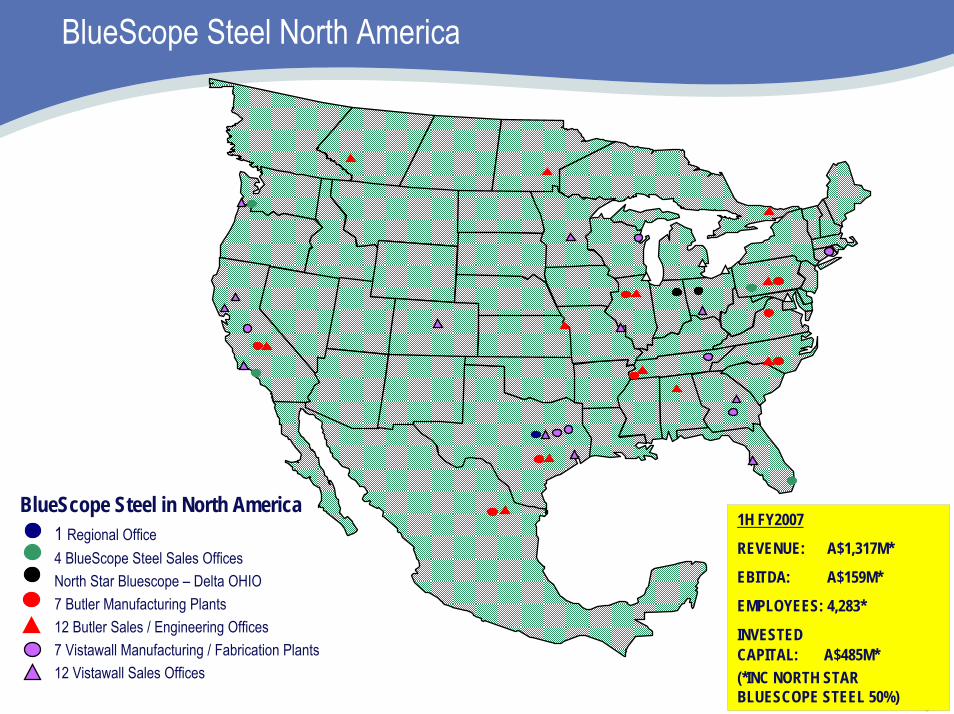
BlueScope Steel North America
BlueScope Steel in North America1 Regional Office4 BlueScope Steel Sales OfficesNorth Star Bluescope – Delta OHIO7 Butler Manufacturing Plants12 Butler Sales / Engineering Offices7 Vistawall Manufacturing / Fabrication Plants12 Vistawall Sales Offices
1H FY2007
REVENUE: A$1,317M*
EBITDA: A$159M*
EMPLOYEES: 4,283*
INVESTED CAPITAL: A$485M*(*INC NORTH STAR BLUESCOPE STEEL 50%)

Page 18
Compound Annual Growth Rates
0
200
400
600
800
1000
1200
1400
1950 1960 1970 1980 1990 2000 2005
0
20
40
60
80
100
120
Arce
lor +
Mitt
al
Nipp
on S
teel
POSC
O
JFE
Coru
s + T
ata
Baos
teel
US S
teel
Nuco
r
Thys
sen
Krup
p
Evra
z
Gerd
au
Seve
rsta
l
Wuh
an
Chin
aSte
el
Maan
shan
Blue
Scop
e
CSN
SSAB
0
5,000
10,000
15,000
20,000
25,000
30,000
35,000
40,000
45,000
50,000
Crude Steel Production (M tonnes) Revenue (US$m)
Downstream
Midstream
Upstream
STRATEGY
+11%
+27%
+11%
Global Steel IndustryGlobal Steel IndustryBlueScopeBlueScope’’ss StrategyStrategy
IndustryConsolidation

Page 19
World crude steel production - 1950 to 2006 – China driving growth but slowing
0
200
400
600
800
1000
1200
1400
1950 1960 1970 1980 1990 2000 2005
Millio
n To
nnes
6.0%
3.1%
0.3%
6.4%
Compound Annual Growth Rates
Source: IISI, BSL
China: 21.5%
World Excluding China: 2.1%
(1995-2006)
Japan: 6.9%
World Excluding Japan: 1.8%
(1965-1980)
USSR: -4.1%
World Excluding USSR: 1.1%
(1980-1995)

Page 20
Our strategy remains unchanged. Focused on growing more diversified and stable revenue / earnings profile
Downstream
Midstream
GROWTH PROJECTS
Major projects completed to 31 December 2006
AsiaIndia - PEB and Lysaghtfacilities at PuneIndia – Lysaght facility at Chennai & New Delhi
USA Successful turnaround of Tennessee facility.
AsiaThailand – second metal coating line (MCL2) and ramp up in progress– ramp up CRC
Vietnam – metal coating (MCL) and paint line (PL) and ramp up in progress
China – MCL and PL and ramp up in progress
Australia400kt HSM expansion at PKSW
[New ZealandFront end study]
USANorth Star BlueScope – new bag house installed
To be completed 2H FY2007 – FY2009
Thailand – PEB facilityChina – Guangzhou (PEB and Lysaght)
− Lang Fang (Panels)
AustraliaA$320M Smorgon Steel shareholding (19.9%)
AsiaIndia – new MCL & PL construction (CY2009)Indonesia – MCL2 & PL2 (project deferred)
AustraliaSydney Colorbond® plant start-up (around June 2007)
AustraliaBF No 5 reline (expected March 2009)Upstream
+11%
+27%
+11%
Revenue increased 1H 2006 vs. 1H 2007
Page 21
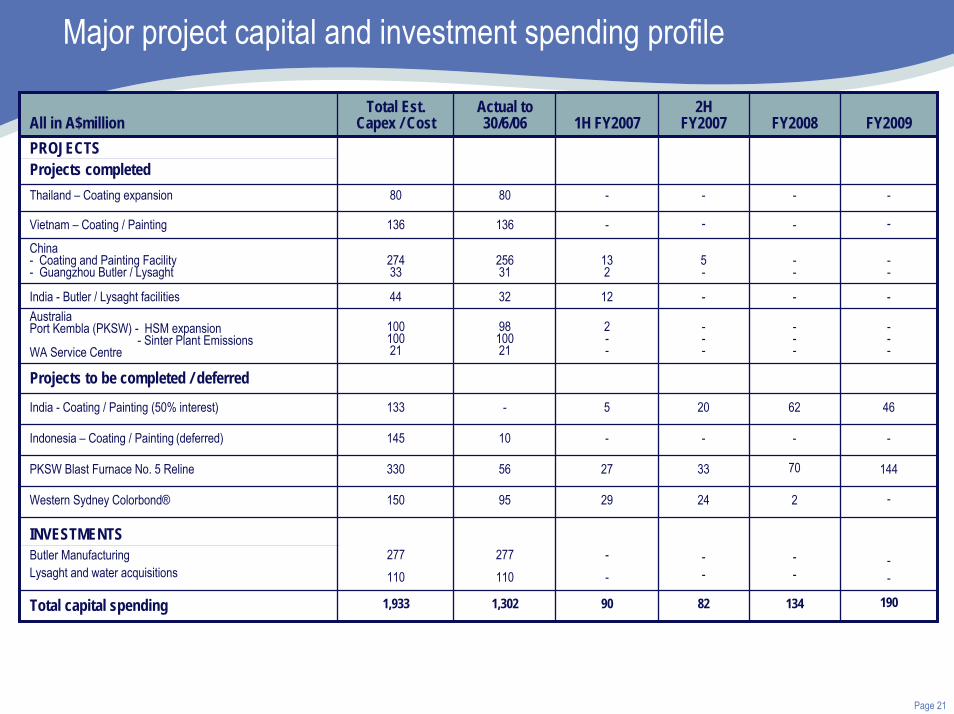
Major project capital and investment spending profile
All in A$millionTotal Est.
Capex / CostActual to 30/6/06 1H FY2007
2HFY2007 FY2008 FY2009
PROJECTSProjects completed
China- Coating and Painting Facility- Guangzhou Butler / Lysaght
27433
25631
132
5-
--
--
Projects to be completed / deferred
INVESTMENTSButler ManufacturingLysaght and water acquisitions
277110
277110
--
--
--
--
India - Coating / Painting (50% interest) 133 - 5 20 62 46
Indonesia – Coating / Painting (deferred) 145 10 - - - -
PKSW Blast Furnace No. 5 Reline 330 56 27 33 70 144
Western Sydney Colorbond® 150 95 29 24 2 -
134 190
80
136
India - Butler / Lysaght facilities 44 32 12 - - -AustraliaPort Kembla (PKSW) - HSM expansion
- Sinter Plant EmissionsWA Service Centre
10010021
9810021
2--
---
---
---
Thailand – Coating expansion 80
1,302
- - --
--
90
--
82
Vietnam – Coating / Painting 136
1,933Total capital spending

Page 22
Global group sales revenue mix – mid and downstream sales revenue growth powering ahead
1HFY2003
1HFY2005
1HFY2007
270.6%
15.3%
28.9%
15.8%
19.0%
22.1%
A$1,166M
A$1,188M
A$1,238M
A$1,350M
A$1,413M
A$1,511M
A$315M
A$1,031M
A$960M
Downstream
Midstream
Upstream
Discontinued/Other Businesses A$262M A$280M A$234MTotal Sales Revenue A$2,568M A$3,872M A$4,508M
+75.5%

Page 23
Butler Buildings North America – Number 2 in PEBs
RetailWarehouseManufacturing
CommunityShowroomRecreation

Page 24
Global steel industry – our long term view has not changed
China’s steel capacity growth rate slowingRaw material, energy and internal transport costs reducing relative competitivenessSteel reform initiatives evident with more promisedUnderlying demand in China is strongLonger term - steel to progressively displace other building materialsSteel export growth occurring
Global steel industry consolidation accelerating
Economic growth remains strongJapan – record steel production likely in 2007 stoked by domestic demandRussia – strong economy limits exportsUSA – strong North American economy―World Trade case against China
Middle East and Europe – strong demandContinued production disciplineIndia – growing steel requirementsIncreased alliance activityIncrease in steel industry mining activity

Page 25
Global steel industry consolidation increases pace
Most companies shown announced intention to acquire or formed alliancesWhat will happen in Asia and when?
0
20
40
60
80
100
120Ar
celo
r + M
ittal
Nipp
on S
teel
POSC
O
JFE
Coru
s + T
ata
Baos
teel
US S
teel
Nuco
r
Thys
sen
Krup
p
Evra
z
Gerd
au
Seve
rsta
l
Wuh
an
Chin
aSte
el
Maan
shan
Blue
Scop
e
CSN
SSAB
0
5,000
10,000
15,000
20,000
25,000
30,000
35,000
40,000
45,000
50,000
Crude Steel Production (M tonnes) Revenue (US$m)
EU / Americas
EU / Asia
Asia
Australia, Asia, Americas
EU
Americas

Page 26
In summary In summary --a very good 6 monthsa very good 6 months

Page 27
Questions and Answers
Dynamic Global Steel
Market
Dynamic Global Steel
Market
Geographic and Product
Diversity
Geographic and Product
Diversity
Strong Board & Management
Team
Strong Board & Management
Team
Growth Opportunities in
Asia
Growth Opportunities in
Asia
Low Cost Producer
Low Cost Producer
Strong and Flexible Capital
Structure
Strong and Flexible Capital
Structure
Profitable Through the
Cycle
Profitable Through the
Cycle
Consistently Strong Cash
Flows
Consistently Strong Cash
Flows
Strong Operating
Track Record
Strong Operating
Track Record
Value Added Branded Products
Value Added Branded Products
A VERY DIFFERENT KIND OF STEEL
COMPANY

Goldman Sachs JBWere Australasian Forum 2007 - New YorkKirby AdamsManaging Director and Chief Executive Officer
7-9 March 2007
ASX Code: BSL