gold price remains buoyant as brexit triggeredcdn.ceo.ca.s3-us-west-2.amazonaws.com/1cdtocl... ·...
TRANSCRIPT

The Weekly Dig – March 31, 2017 Mick Carew, PhD [email protected]
Emma Boggio, MSA, CA, CPA604-697-6166 [email protected]
and the Haywood Mining Team Member of the Canadian Investor Protection Fund
Please see page 36 for Analyst Certification, and pages 36 to 43 for Important Information and Legal Disclaimers, Rating Structure, and notes.
Gold Price Remains Buoyant as Brexit Triggered Global stock markets gained ground this week, reflecting increased confidence in the U.S. economy as indicated by the better-than-expected news from the Conference Board; the Consumer Confidence Index improved sharply in March, coming in at 125.6 from 116.1 in the prior month, hitting its highest level since December 2000. Meanwhile, on Tuesday, the signing of an executive order instructing America’s Environmental Protection Agency to withdraw and replace Obama’s Clean Power Plan was heavily criticised both in the U.S. and globally. The order included the reversal of a moratorium on coal-leasing on federal lands and dispenses with rules to curb methane emissions from oil and gas sites. The price of oil gained ground as a result, rising 5.42% to finish at $51 per barrel on Friday. Also in the news this week, Britain’s prime minister, Theresa May, officially triggered Article 50 of the Lisbon treaty to the European Council, beginning the process of Britain’s divorce from the European Union. Markets rose during the week, with the S&P/TSX Composite Index rising slightly to close the week at 15,548, while the Dow Jones Industrial Average closed up almost 188 points at 20,663. Meanwhile, the S&P/TSX Global Gold Index finished down for the week, finishing at 207 on Friday as the price of gold hit a high of $1,261 on Monday before finishing at $1,250 per ounce on Friday. It was another mixed week for precious and base metals, with silver (up 2.54%), copper (up 0.67%), and nickel (up 1.56%) all finishing up for the week at US$18.23, US$2.64, and US$4.52 respectively. Meanwhile, platinum (down 1.49%), palladium (down 1.45%), lead (down 0.51%), and zinc (down 2.24%) finished the week lower.
DIGGING IN… Metals Sector Macro: Gold up this week, finishing at US$1,250 per ounce………………2 Junior Explorer – Weekly Vantage Point: News from the Junior sector this week included drilling results from Pure Gold Mining Inc. (PGM-V), an Application Information Requirements approval from IDM Mining Ltd. (IDM-V), and a Joint Venture agreement from Golden Arrow Resource Corporation (GRG-V)……...……..……3 Haywood Research – The Week in Review: Publications from the Haywood Research team this week included an initiation report for Avnel Gold Mining Limited (AVK-T), drilling results from Osisko Mining Inc. (OSK-T), the commencement of United State Forest Service review from Midas Gold Corp. (MAX-T), concentrate sales terms from Eldorado Gold Corporation (ELD-T), drilling results from Denison Mines Corp. (DML-T), an initiation report for Barkerville Gold Mines Ltd. (BGM-V), an exploration update from Richmont Mines Inc. (RIC-T), and both financials and a corporate update from Mountain Province Diamonds Inc. (MPVD-T) ………………………………………………………………………………………………………......8 Weekly Commodities / Indices / Exchange Rates: The S&P/TSX Comp finished at 15,548 while the S&P/TSX Composite Venture Index was up 1.49% to finish at 816 …………………………………………………………………………………………………………………………13 Commodities and ETFs: Gold finishes at 1,250 per ounce on Friday…..……….……..14 Upcoming Macroeconomic News: Change in Nonfarm Payrolls for March………….18 Comparables Tables: Consensus and Haywood forecasts and multiples, plus market valuations for in situ resources………………………….…………….………….……..…..19 The Dig is intended to provide general information only and it is written for an institutional audience. It is not a solicitation for the purchase of securities, an offer of securities, or intended as investment research or advice. The information presented, while obtained from sources we believe reliable is not guaranteed against errors or omissions. For Canadian residents: Haywood Securities Inc. is a Canadian registered broker-dealer and a member of the Investment Industry Regulatory Organization of Canada, the Toronto Stock Exchange, the Toronto Venture Exchange and the Canadian Investor Protection Fund. Any Canadian client that wishes further information about anything contained herein should contact a qualified salesperson of Haywood Securities Inc. For U.S. residents: The Dig is distributed in the United States by Haywood Securities (USA) Inc.
$1,220
$1,240
$1,260
$1,280
3/27 3/31
Gold (US$/oz)Last: $1,250
$17.5
$18.0
$18.5
3/27 3/31
Silver (US$/oz)Last: $18.24
$2.40
$2.60
$2.80
3/27 3/31
Hund
reds
Copper (US$/lb)Last: $2.66
$44
$46
$48
$50
$52
3/27 3/31
WTI Crude (US$/bbl)Last: $50.72

The Weekly Dig 3/31/17
Haywood Mining [email protected] Page 2
Metals Sector Macro
Macroeconomic News
United States Wholesale inventory, increased by 0.4% month over month to $594.1 billion in February (adjusted for seasonal variations but not for price changes). Following a downwardly revised 0.2% decline in January, February’s increase was more significant than the expected 0.2% gain and finished at a 3.2% increase from February 2016. Durable goods for the month ending February 2017 finished up 0.1% from January and 1.5% from last February. Meanwhile, nondurable goods finished the month of February up 0.9% and the year up 5.9%. According to the Conference Board, the Consumer Confidence Index, which had increased in February, improved sharply in March to reach 125.6, up from 116.1 in February. The Present Situation Index rose from 134.4 to 143.1, and the Expectations Index increased from 103.9 last month to 113.8. According to the Mortgage Bankers Association (MBA), Mortgage applications decreased 0.8% in the week ended March 24. Following a 2.7% decrease in the previous period, refinancing applications declined 2.9%, while applications to purchase a home rose 1.2%. Meanwhile, average fixed 30-year mortgage rates dropped by 13 basis points to 4.33%. The annualized GDP on a quarter-over-quarter basis for Q4/16 came in at 2.1% on Thursday, beating both the surveyed expectations of 2.0% and the prior estimate of 1.9%. The increase in real GDP in Q4 reflected positive contributions from personal consumption expenditures (PCE) (which increased more than previously estimated), private inventory investment, residential fixed investment, non-residential fixed investment, and state and local government spending that were partly offset by negative contributions from exports and federal government spending. Initial jobless claims decreased by 3,000 to 258,000 in the week ended March 25, down from the previous week’s unrevised level of 261,000, but above surveyed expectations of 247,000. The 4-week moving average, which removes week-to-week volatility, increased by 7,750 to 254,250.
Canada This week it was announced that the Canadian GDP advanced by 0.6% for the month ending in January 2017. The figure was twice as much as what economists polled by Bloomberg were expecting and represents the strongest monthly GDP growth since July of 2013. In its most recent monetary policy report, the Bank of Canada predicted growth in the first quarter of 2017 to come in at an annual pace of 2.5%.

The Weekly Dig 3/31/17
Haywood Mining [email protected] Page 3
Junior Explorer: Weekly Vantage Point
News from the Junior sector this week included:
Mining Flashes Other News
Pure Gold Mining Inc. (PGM-V)
IDM Mining Ltd. (IDM-V) Golden Arrow Resources Corporation (GRG-V)
Mining Flashes
Pure Gold Mining Inc. (PGM-V, $0.57 [not rated]) – Pure Gold Expands Gold Mineralization at Russet South
Mick Carew, PhD [email protected], Emma Boggio, MSA, CA, CPA, [email protected]
Pure Gold announced new drilling results expanding the near-surface footprint of gold mineralization at the Russet South target, located ~1.5 kilometres northwest of the old Madsen mine in Ontario. Russet South is part of the Company’s 100% owned Madsen gold project (Madsen). Results are from the Shaft Zone proximal to the historical Mosquito mine at Island Mountain. Pure Gold’s 2017 exploration program is ongoing, with four drill rigs currently testing resource growth potential near the mine infrastructure and along the more than 5-kilometre strike length of the Madsen mineral system. The Company’s Phase 1 program is expected to produce 70,000 metres of core drilling, and will include underground drilling, which is expected to commence in Q2/17. The program is fully funded with approximately $17.5 million in cash and marketable securities. Highlights from the recent drilling include: • Drill hole PG17-310: 1.9 metres grading 23.1 g/t gold from a downhole depth of 138.2 metres
• Drill hole PG17-316: 1.7 metres grading 8.3 g/t gold from a downhole depth of 128.4 metres
• Drill hole PG17-335: 12.0 metres grading 4.4 g/t gold from a downhole depth of 190.0 metres, including 2.0 metres grading 14.3 g/t gold
• Drill hole PG17-341: 1.9 metres grading 21.4 g/t gold from a downhole depth of 156.1 metres.
See Haywood Securities for the full report
Other News
IDM Mining Ltd. (IDM-V; not rated)
Share Price: $0.16 52-week high/low: $0.26/$0.10 Average Daily Volume for the Week: 285,200 shares Market Capitalization: $56.62 million Shares Outstanding: 353.85 million Cash: $9.87 million (Oct. 31, 2016) Date of Release: March 31, 2017 Friday morning, IDM Mining Ltd (IDM-V) announced that the Environmental Assessment Office (“EAO”), with the support of provincial, federal, Aboriginal, and regional authorities, have approved and finalized the Application Information Requirements for the proposed Red Mountain Underground Gold Project located east of Stewart, BC. This milestone is the last significant step prior to submission of the Application to the EAO and Canadian Environmental Assessment Agency. The Application is scheduled to be submitted by IDM in Q2 2017.

The Weekly Dig 3/31/17
Haywood Mining [email protected] Page 4
In parallel with the preparation of the Project's Application and the Environmental Impact Statement, IDM is working on a Feasibility Study of the Red Mountain Project that remains on track for completion in Q2 2017.
Golden Arrow Resources Corporation (GRG-V; not rated)
Share Price: $0.86 52-week high/low: $1.48/$0.25 Average Daily Volume for the Week: 319,820 shares Market Capitalization: $83.62 million Shares Outstanding: 97.23 million Cash: $8.82 million (Sept. 30, 2016) Date of Release: March 31, 2017
Earlier this afternoon, Golden Arrow Resources Corporation (GRG-V) announced that it has received the required notice from Silver Standard Resources Inc. (SSO-T) to exercise its option on the Chinchillas project and form a joint venture to combine the Chinchillas project with the producing Pirquitas Mine into a single new operation. The joint venture agreement is pursuant to a Business Combination agreement that Golden Arrow had with Silver standard dated September 30, 2015. A few of the key highlighted elements and benefits of this agreement are as follows:
• Upon Silver Standard executing its option, a joint venture is formed comprised of the Pirquitas operation and the Chinchillas property with Silver Standard and Golden Arrow holding 75% / 25% interest, respectively.
• Silver Standard will be the operator. With the combined operation, managed and overseen by Silver Standard, there will be a benefit of their proven operational management team with extensive mine construction and operational expertise.
• This joint venture provides Golden Arrow an opportunity to use the existing production facilities at the Pirquitas Mine and future established common infrastructure to fast-track development of the Chinchillas property, in a capital efficient manner.
• It will facilitate near-term production from Chinchillas based on construction beginning in Q3 2017, followed by ore delivery to the mill in the H2 2018.
• As already mentioned, there will be an immediately benefit from the use of existing infrastructure, but there will also be benefits related to operating capabilities and cash flow generated by the currently producing Pirquitas Mine.
• There will be an option exercise payment by Silver Standard to Golden Arrow of 25% of Pirquitas mine earnings less certain expenditures incurred since October 1, 2015 until closing. This is currently estimated at approximately US$15 million, and is payable on closing.
• A pre-feasibility study ("PFS") has been completed for the development of Chinchillas. Please see further details below.
Also announced this afternoon were the results of the pre-feasibility study of their Chinchillas project for the joint-venture development of the project with Silver Standard. Highlights of which are as follows:
• Average annual silver equivalent production of 8.4 million ounces over an 8 year mine life at a 4,000 tonne per day plant throughput.
• Robust operating margins based on cash costs of $7.40 per payable ounce of silver sold over the life of mine.
• Post-tax net present value of $178 million using a 5% discount rate and metal prices of $19.50 per ounce silver, $0.95 per pound lead and $1.00 per pound zinc.
• Attractive post-tax internal rate of return of 29%. • Near-term production based on construction beginning in the third quarter of 2017, subject to
permitting, followed by ore delivery to the Pirquitas mill in the second half of 2018.
The Weekly Dig 3/31/17
Haywood Mining [email protected] Page 5
• Low capital intensity based on initial capital expenditures, including owner's costs and contingency, estimated to be $81 million.
• Mineral Reserves of 11.7 million tonnes containing 58 million ounces of silver at a grade 154 g/t, 310 million pounds of lead at a grade of 1.20% and 127 million pounds of zinc at a grade of 0.49%.
• Measured and Indicated Mineral Resources (inclusive of Mineral Reserves) of 29.3 million tonnes containing 96 million ounces of silver at a grade 101 g/t, 581 million pounds of lead at a grade of 0.90% and 386 million pounds of zinc at a grade of 0.60%.
• Capital cost estimates assume utilizing certain property, plant and equipment from the Pirquitas mine. All costs incurred prior to the declaration of commercial production are considered capital costs.

The Weekly Dig 3/31/17
Haywood Mining [email protected] Page 6
Performance of Companies Included in Junior X and Notable News Flow
Source: Capital IQ and Haywood Securities
Close Price Market Capitalization
Cash at Quarter End Weekly Performance QTD Performance
QTD Performance vs. TSXV Index
Company Ticker (C$) (C$M) (C$M)Junior Exploration Names Cardinal Resources Limited ASX:CDV 0.54 165.54 17.54 7.0% 122.9% 115.4%Cordoba Minerals Corp. TSXV:CDB 1.26 112.07 1.03 (6.0)% 68.0% 60.5%IDM Mining Ltd. TSXV:IDM 0.16 56.62 9.87 0.0% 10.3% 2.8%Kootenay Silver Inc TSXV:KTN 0.30 52.41 7.12 (1.6)% (14.3)% (21.8)%Nighthawk Gold Corp. TSXV:NHK 0.82 153.20 4.63 0.0% 82.2% 74.7%Orex Minerals Inc. TSXV:REX 0.20 22.12 3.09 0.0% (59.4)% (66.9)%Plateau Uranium Inc. TSXV:PLU 0.54 31.34 1.19 (6.9)% 145.5% 137.9%Pure Gold M ining Inc. TSXV:PGM 0.60 114.92 13.79 9.1% 29.0% 21.5%Purepoint Uranium Group Inc. TSXV:PTU 0.12 22.70 0.71 4.3% 26.3% 18.8%SilverCrest Metals Inc. TSXV:SIL 2.06 99.65 8.93 1.0% (10.4)% (18.0)%Wealth M inerals Ltd. TSXV:WML 1.45 112.61 2.99 (4.6)% 27.2% 19.6%Other Companies in the News Barkerville Gold M ines Ltd. TSXV:BGM 0.63 195.49 13.26 40.0% 37.0% 29.4%

The Weekly Dig 3/31/17
Haywood Mining [email protected] Page 7
Key Catalysts for Companies Featured in the Last Junior Exploration Report
Source: Haywood Securities
Company Ticker CatalystsJunior Exploration Names
Cardinal Resources Limited ASX:CDV • Drill results focussed on expansion of resource - 2017• Metallurgical results - Q1/17
Cordoba Minerals Corp. TSXV:CDB• Drill results from Alacran - Q1/17• Initial resource estimate - Alacran - H1/17• Regional exploration drill results - Q1/17
IDM Mining Ltd. TSXV:IDM• Phase 2 drill program - Q1/17• Environmental Assessment Certificate - mid-2017 • Commencement of production - mid-2018
Kootenay Silver Inc TSXV:KTN• Drill results from La Soledad - Q1/17• Initial resource estimate for La Negra - H1/17• Resource update leading to PEA at La Cigarra - late 2017
Nighthawk Gold Corp. TSXV:NHK• Recommence drilling at Colomac - Q1/17• Updated resource estimate - Q2/17
Orex Minerals Inc. TSXV:REX • Drill results from 5,000 metre 2-rig program at Coneto - Q1/17• Drill results from 4,000 metre program at Sandra Escobar - Q1/17
Plateau Uranium Inc. TSXV:PLU• Metallurgical test results - Q4/16• Drill results from Pinochio target - early 2017• Additional lab test work - 2017
Pure Gold M ining Inc. TSXV:PGM• Drill results from 77,000 metre program - Q1/17• Re-open portal at McVeigh horizon - Q4/16• Updated mineral resource estimate - mid-2017
Purepoint Uranium Group Inc. TSXV:PTU•Drill results from the balance of 2016 drilling and proposed 2017 drill program - 2017 .
Rupert Resources Ltd. TSXV:RUP• Phase 2 drill program - Q1/17• Exploration work - Q1/17
SilverCrest Metals Inc. TSXV:SIL• Drill results from phase 2 exploration program at Las Chispas - H1/17• Maiden resource at Las Chispas - H1/17• Results from testing and processing of bulk sample - 2017
Wealth M inerals Ltd. TSXV:WML • Developing exploration program at Atacama

The Weekly Dig 3/31/17
Haywood Mining [email protected] Page 8
Haywood Research: The Week in Review
Publications from the Haywood Research team for the week included the following:
Initiation report for Avnel Gold Mining Limited (AVK-T) Drilling results from Osisko Mining Inc. (OSK-T) Commencement of United State Forest Service review from Midas Gold Corp. (MAX-T) Concentrate sales terms from Eldorado Gold Corporation (ELD-T) Drilling results from Denison Mines Corp. (DML-T) Initiation report for Barkerville Gold Mines Ltd. (BGM-V) Exploration update from Richmont Mines Inc. (RIC-T) Financials and corporate update from Mountain Province Diamonds Inc. (MPVD-T)
Research Reports
Avnel Gold Mining Limited (AVK-T, $0.28 [Buy Rating, $0.60 Target Price]) – Indicated Resource Doubles, Plus a Slight Grade Increase at Triangle
Kerry Smith, MBA, PEng [email protected], Danny Ochoa, PEng, CFA, [email protected]
We are initiating coverage of Avnel Gold (Avnel; AVK-T) with a BUY rating and a 12-month target price of $0.60 per share. Avnel is preparing to build the Kalana Main open-pit gold project, which is fully permitted and completing financing for mine development. If successfully financed, construction of a gold mine could begin by year-end, which would lead to production by 2020.
• Reserve of 2.0 Moz – The Kalana Main gold deposit has a diluted, pit-constrained reserve of 2.0 million ounces (Moz) grading 2.8 grams per tonne (g/t) gold within a resource of 3.1 Moz grading 4.1 g/t. The gold mineralization is associated with high-grade quartz veins related to regional shear structures, and is characterized by a nugget effect.
• Avnel announced results from an optimized feasibility study (OFS) in January 2017 – Key parameters include initial capex of $171 million, and life of mine (LOM) sustaining capex of $122 million for a 1.2 million tonne per annum (Mtpa ) open-pit mine and mill. Average production would be 101 thousand ounces (koz) over 18 years (148 koz per year for the first 5 years) with LOM cash operating costs of $592/oz ($427/oz for the first 5 years) and LOM all-in sustaining cost (AISC) of $730/oz ($561/oz for the first 5 years).
• Attractive economics – Based on a gold price of $1,200/oz, the OFS has an after-tax net present value (NPV)5% of $321 million, an after-tax internal rate of return (IRR) of 50%, and a payback of 1.1 years. At our long-term gold price of $1,400/oz, we estimate an after-tax NPV5% of $529 million and an IRR of 71%. The Company is evaluating further optimization.
• Good exploration upside – The Kalana concession covers 387 km2 and contains 27 exploration prospects and multiple geochemical anomalies, providing attractive district potential. We believe that the resource could ultimately grow well beyond the Kalana Main deposit.
See Haywood Securities for the full report

The Weekly Dig 3/31/17
Haywood Mining [email protected] Page 9
Midas Gold Corp. (MAX-T, $0.77 [Buy Rating, $1.75 Target Price]) – U.S. Forest Service Starts Stibnite Gold Project ‘PRO’ Plan Review: ROD Expected Q1/19
Geordie Mark [email protected]
United States Forest Service starts its review of the PRO plan for the Stibnite gold project.
• Stibnite gold project Plan of Remediation and Operations (PRO): The United States Forest Service has now started formal review of Midas’ proposed plan and expects to develop a draft Record of Decision in 2018, followed by a final Record of Decision in Q1/19.
• This event marks another significant milestone for the Company on its path through the permitting of the Stibnite gold project in Idaho. The timeline for the completion of a final Record of Decision presented by the United States Forest Service is in line within our expectations to reach an investment decision and commence construction in 2019.
• Of note, the United States Forest Service has a dedicated website for the Stibnite gold project (http://www.fs.usda.gov/goto/payette/StibniteGold). The United States Forest Service is now anticipated to publish a Notice of Intent in the Federal Register, and initiate a 30-day public scoping period. We note that on the service’s website the timing for the Notice of Initiation milestone for the Stibnite gold project is estimated to be May 1, 2017. Further public commentary is expected to be available on the Draft Environmental Impact Statement, anticipated to be published early next year.
• Notwithstanding the permitting milestones, over the next 2 years, we anticipate Midas Gold will continue to add value and further de-risk the Stibnite gold project through additional targeted drilling of zones of gold mineralization likely to be exploited in the initial few years of the projected mine plan, as well as outline additional process optimization (e.g., comminution, reagent balance, flotation) to potentially lower unit costs and heighten metals production.
See Haywood Securities for the full report
Mountain Province Diamonds Inc. (MPVD-T, $4.56 [Buy Rating, $7.00 Target Price]) – Financials and Corporate Update Point to Debt Covenant Restructuring Ahead
Geordie Mark [email protected]
• Mountain Province released Q4/16 financials – Among operational details and initial 2017 production guidance, the accompanying corporate update highlighted that the Company requires restructuring of debt covenants relating to reserve account balance scheduling. In the press release, the Company noted that the lenders waived an initial cash call reserve account balance of US$27.9 million until May 31, 2017.
o We also note that the aggregate reserve account balance schedule initially defined by the lenders appears to be aggressive, with total reserve account requirements exceeding 50% of the maximum loan balance in approximately a year after the declaration of commercial production.
• Operations and sales – In addition, we estimate that Gahcho Kué produced 412 thousand carats (kct) in January and February 2017, with approximately 258 kilotonnes (kt) of ore material stockpiled in inventory containing > 400 kct immediately prior to declaration of commercial production. We estimate that mining costs per tonne of ore for this stockpiled material were around $33 per tonne. Gahcho Kué is expected to produce ~4.4 million carats (Mct) of diamonds in 2017, and given the ramp-up to commercial production in March, we expect that the output will be weighted to H2/17.
o We expect that the Company has now completed 3 of 10 sales this year, with the first commercially produced stones expected to be sold in June marking the Company’s point of first revenue.

The Weekly Dig 3/31/17
Haywood Mining [email protected] Page 10
• 2018 forecasts – We project diamond production of 5.6 Mct (100% basis). Sales are expected to deliver attributable operating cash flow of $1.71 per share.
See Haywood Securities for the full report
Barkerville Gold Mines Ltd. (BGM-V, $0.52 [Buy Rating, $1.00 Target Price]) – Historic Gold District: On the Footsteps to Delivery
Mick Carew, PhD [email protected], Emma Boggio, MSA, CA, CPA, [email protected]
We are initiating coverage with a $1.00 target and a BUY rating. Barkerville is an advanced-stage exploration company focusing on its Cariboo gold project in British Columbia. The project hosts several historical underground mines; it is estimated that approximately 4.5 million ounces of gold have been produced by underground and alluvial mining since the 1860s. Approximately 2,120 km2 of highly prospective ground were consolidated through a series of strategic acquisitions by the former and present management team.
• Island and Cow Mountains – For this flagship gold project, the resource estimate is expected in Q4/17. We have reviewed cross sections through both deposits and derived an estimate of 2 Moz of gold at Island Mountain (1.25 Moz) and Cow Mountain (750,000 ounces). In addition, we have attributed an initial estimate of 150,000 ounces at BC Vein and 150,000 ounces at Bonanza Ledge.
• Bonanza Ledge/BC Vein – As the test case for larger scale production at Cow/Island Mountain, Barkerville aims to commence underground production at Bonanza Ledge and BC Vein in Q2/17, producing ~30,000 ounces of gold over 3 years. The operation will test for future potential production at Cow and Island Mountains, results of which will be fed into a feasibility study expected in 2018.
• Significant regional exploration potential – The Company’s fully consolidated, 2,120 km2 land package is highly prospective and remains underexplored owing to a historically fragmented land position.
See Haywood Securities for the full report
Radar Flashes
Osisko Mining Inc. (OSK-T, $4.69 [Buy Rating, $5.00 Target Price]) – Additional Drill Results at Windfall
Mick Carew, PhD [email protected], Emma Boggio, MSA, CA, CPA, [email protected]
Osisko Mining announced additional drill results from its ongoing 400,000-metre drill program at its 100% owned Windfall Lake gold project located in Urban Township, Québec. The program combines definition drilling above the Red Dog intrusion, expansion drilling above and below Red Dog, expansion drilling to the northeast of the main deposit, and exploration drilling on the greater deposit and Urban-Barry project area. The current drilling results released consist of four drill holes and are focused on the Lynx Zone discovery.
Drilling Highlights:
• Drill Hole OSK-W-17-792: 5.4 metres (uncut) grading 71.4 g/t gold from a downhole depth of 313.3 metres
• Drill Hole OSK-W-17-788: 3.6 metres (uncut) grading 57.0 g/t gold from a downhole depth of 236.4 metres, and 3.7 metres grading 21.1 g/t gold from a downhole depth of 245.0 metres
• Drill Hole OSK-W-17-779: 7.9 metres (uncut) grading 21.6 g/t gold from a downhole depth of 268.0 metres.
See Haywood Securities for the full report

The Weekly Dig 3/31/17
Haywood Mining [email protected] Page 11
Eldorado Gold Corporation (ELD-T, $4.25 [Buy Rating, $8.25 Target Price]) – Commissioning Underway at Olympias….Better Than Expected Concentrate Sales Terms Are a Nice Surprise
Kerry Smith, MBA, PEng [email protected], Danny Ochoa, PEng, CFA, [email protected]
• Better concentrate sales terms – Tuesday after market close, Eldorado announced multiple tenders with better than previously expected concentrate sales terms for 2017+ production from Olympias. Gold payability under the new sales terms for its pyrite/gold concentrate has increased from 58% to a maximum of 71%, which results in an increase in average Phase II production of about 15,000 ounces of gold to 85,000 ounces per year. Phase II produces three concentrates—a lead/silver, a zinc, and a pyrite/gold concentrate—and the pay factor is low for the pyrite concentrate owing to the arsenic levels.
• Wet commissioning underway – Phase II construction is now complete, and commissioning has commenced. Pre-commissioning of the main flotation plant equipment is underway, and ore will be introduced next month, with low-grade ore introduced to the crushing circuit next week. This Phase II program is roughly on schedule with previous guidance for Q1 construction completion and commissioning. Production guidance for 2017 was 40,000 to 50,000 ounces at cash costs of US$250 to US$450/oz, versus our model at 45,000 ounces at a US$280/oz cash cost, and with the improved pay factors, 2017 production will be 8,000 to 10,000 ounces higher. Olympias is a +20-year mine, with low cash costs owing to the large by-product zinc/lead and silver credits.
• Underground development well on track – Underground development is well positioned for start-up, with fourteen stopes in ore on nine different levels ready for extraction, giving the mine lots of flexibility for ore production. Ore mining is expected to start imminently using drift and fill mining.
See Haywood Securities for the full report
Denison Mines Corp (DML-T, C$0.86 [Buy Rating, $1.80 Target Price]) – Drilling at Gryphon Zone Continues to Highlight Resource Growth Potential
Colin Healey, MBA [email protected]
• Winter drilling at DML’s flagship Wheeler River Joint Venture (60% DML, 30% Cameco [CCO-T; not rated], 10% JCU, private), is progressing toward the 16,000-metre winter plan. Wednesday’s probe results included some very high-grade intercepts within the D Series lenses, which are not part of the existing resource at Gryphon. The same holes also intersected potentially significant mineralization in the shallower B Series lenses, also beyond the known mineralization of the B series lenses and outside the existing resource envelope at Gryphon, which hosts a total of 43 million pounds (Mlb) of U3O8 (average grade of 2.3% U3O8, inferred), highlighting the potential to add resource at Gryphon.
• Infill drilling at the Gryphon Zone resource area is also returning positive results. Intersections are returning higher grades and thicker intervals than Denison was expecting in respective positions, as the Company is currently targeting the lower grade up/down plunge extents of the A/B/C lenses. Future infill drilling is expected to target the thicker, higher grade zones of the resource area, as Denison works to convert the inferred resources of Gryphon to indicated (25-metre by 25-metre spacing) ahead of the planned preliminary feasibility study of Wheeler River.
• Additional mineable resources at Gryphon would very likely improve the baseline economics of the April 2016 Preliminary Economic Assessment (PEA ) on the Wheeler River project, as Gryphon is the first deposit mined in the sequential mine plan, providing significant cash flow for development capex toward accessing the Phoenix deposit. Total Wheeler River project resources currently stand at 114.2 Mlb of U3O8 (average grade of 5.1% U3O8, all categories), including the Phoenix Zone: 70.1 Mlb of U3O8 (indicated), at an average grade of 19.1% U3O8. The Wheeler River PEA base-case financial assessment suggested a positive post-tax

The Weekly Dig 3/31/17
Haywood Mining [email protected] Page 12
IRR of 17.8% at a uranium price of US$44/lb of U3O8 (post-tax NPV of $343 million, 100% basis), rising to 29.2% at US$62.6/lb (post-tax NPV of $913 million).
See Haywood Securities for the full report
Richmont Mines Inc. (RIC-T, $9.40 [Buy Rating, $14.00 Target Price]) – Drilling Update at Island – Still Getting Bigger
Kerry Smith, MBA, PEng [email protected], Danny Ochoa, PEng, CFA, [email protected]
• Main theme – This is the first exploration update this year, and Island is developing into what we expect is a +3 Moz deposit over time. Grades continue to improve with depth, and the system is showing no signs of petering out. Richmont has 103,000 metres of drilling planned this year from surface and underground to infill the current 995,700-ounce inferred resource and expand resources both laterally and at depth.
• Eastern lateral extension provides resource upside potential – Drilling conducted in 2016 added two new inferred resource blocks in the eastern lateral extension, 300 metres east of the Expansion PEA area, including an inferred 95,000 ounces of gold at an average grade of 10.35 g/t in the largest of these two blocks. These two blocks are relatively shallow (between the 350 and 750 metre levels) and easily accessible from existing mine infrastructure.
• Deep directional drilling indicates mineralization remains open – The 2016 deep directional drill program successfully identified an inferred resource block (230,000 ounces grading 9.53 g/t gold) in the eastern downplunge extension between the 1,050 and 1,300 metre levels. The 2017 drill program is targeting the expansion of this new resource block with 16,000 metres of deep directional drilling from surface (three rigs currently), and 20,000 metres of underground drilling are planned later this year once the 860 level exploration drift is completed. Results released today include:
• 24.5 g/t gold over 3.76 metres in drill hole MH1-10
• 4.6 g/t gold over 2.24 metres in drill hole MH8.
See Haywood Securities for the full report

The Weekly Dig 3/31/17
Haywood Mining [email protected] Page 13
Weekly Commodities / Indices / Exchange Rates
Metal and Currency Prices for the Week
Source: Haywood Securities
15,000
15,500
16,000
3/27 3/31
S&P/TSX Composite IndexLast: 15,548
180
200
220
3/27 3/31
S&P/TSX Global Gold IndexLast: 207.42
20,000
20,500
21,000
3/27 3/31
Dow Jones Industrial AverageLast: 20,663
790
800
810
820
3/27 3/31
S&P/TSX Venture Comp IndexLast: 816 102
104
106
108
110
112
3/27 3/31
S&P/TSX Global Base Metals IndexLast: 109.96
2,300
2,350
2,400
3/27 3/31
S&P 500 IndexLast: 2,363

The Weekly Dig 3/31/17
Haywood Mining [email protected] Page 14
Commodities and ETFs: A Week in Action
Gold - 1-Year US$/oz (left) and Total ETF Holdings (right)
Spot: Gain (+0.4%) for the week
ETF Holdings: 58,871,079 ounces, up 145,399 ounces or the week
Silver - 1-Year US$/oz (left) and Total ETF Holdings (right)
Spot: Gain (+2.1%) for the week
ETF Holdings: 644,693,594 ounces, down 401,321 ounces for the week
Platinum - 1-Year US$/oz (left) and Total ETF Holdings (right)
Spot: Loss (-1.5%) for the week
ETF Holdings: 2,424,510 ounces, up 1,463 ounces for the week
Palladium - 1-Year US$/oz (left) and Total ETF Holdings (right)
Spot: Loss (-1.4%) for the week
ETF Holdings: 1,541,309 ounces, down 7,142 ounces for the week
Copper - 1-Year US$/lb (left) and LME Inventory (right)
Futures: Gain (+0.7%) for the week
LME Copper: 257,150 tonnes, down 6,625 tonnes for the week
$1,000
$1,100
$1,200
$1,300
$1,400
Mar-16 Mar-17Gold ($/oz)
Price100D MA
47
57
67
Mar-16 Mar-17Gold ETF Holdings (Moz)
$13.00
$16.00
$19.00
$22.00
Mar-16 Mar-17Silver ($/oz)
Price
100D MA
570590610630650670690
Mar-16 Mar-17Silver ETF Holdings (Moz)
$800
$1,000
$1,200
Mar-16 Mar-17Platinum ($/oz)
Price
100D MA
2.1
2.2
2.3
2.4
2.5
Mar-16 Mar-17Platinum ETF Holdings (Moz)
$460
$660
$860
Mar-16 Mar-17Palladium ($/oz)
Price
100D MA
1.5
1.7
1.9
2.1
2.3
2.5
Mar-16 Mar-17Palladium ETF Holdings (Moz)
$1.90
$2.40
$2.90
Mar-16 Mar-17Copper ($/lb)
Price
100D MA
130,000
230,000
330,000
Mar-16 Mar-17LME Copper Inventories (t)

The Weekly Dig 3/31/17
Haywood Mining [email protected] Page 15
Nickel - 1-Year US$/lb (left) and LME Inventory (right)
Spot: Gain (+1.6%) for the week
LME Nickel: 377,514 tonnes, down 4,752 tonnes for the week
Lead - 1-Year US$/lb (left) and LME Inventory (right)
Spot: Loss (-0.5%) for the week
LME Lead: 187,175 tonnes, down 3,025 tonnes for the week
Zinc - 1-Year US$/lb (left) and LME Inventory (right)
Spot: Loss (-2.2%) for the week
LME Zinc: 371,875 tonnes, down 3,950 tonnes for the week
Iron – 1-Year US$/t 62% Fe (left) and 1-Year US$/t Newcastle (right)
Newcastle Thermal Futures: Gain (+6.8%) for the week
62% Fe Iron Ore: Loss (-9.9%) for the week
Uranium – 1-Year US$/lb Short-Term (left) and Long-Term (right)
Uranium Spot: Loss (-4.0%) for the week
Uranium Long-Term: Unchanged
Source: Bloomberg, UxC Consulting, and Haywood Securities
$3.50
$4.50
Mar-16 Mar-17Nickel ($/lb)
Price
100D MA
350,000
400,000
450,000
Mar-16 Mar-17LME Nickel Inventories (t)
$0.70
$0.90
$1.10
Mar-16 Mar-Lead ($/lb)
Price
100D MA
140,000
160,000
180,000
200,000
220,000
Mar-16 Mar-17LME Lead Inventories (t)
$0.65
$1.15
Mar-16 Mar-17Zinc ($/lb)
Price
100D MA
300,000
400,000
500,000
600,000
Mar-16 Mar-17LME Zinc Inventories (t)
$35
$55
$75
Mar-16 Mar-1762% Iron Ore ($/t)
Price
100D MA
$30
$50
$70
$90
Mar-16 Mar-17Newcastle Coal (AUD/t)
Price
100D MA
$18
$23
$28
$33
$38
Mar-16 Mar-17Uranium Spot ($/lb)
Price
100D MA
$30
$35
$40
$45
Mar-16 Mar-17Uranium Long-Term ($/lb)
Price
100D MA

The Weekly Dig 3/31/17
Haywood Mining [email protected] Page 16
Equities: Weekly Performances S&P TSX Global Mining Index – Top and Bottom Performance (upper) and Constituent Performance (lower)
Source: Capital IQ and Haywood Securities
Top Companies Close $∆ %∆Osisko Mining Inc. 4.85 0.43 10% Cloud Peak Energy Inc. 4.58 0.37 9% Trevali Mining Corporation 1.32 0.10 8% Eldorado Gold Corporation 4.55 0.33 8% Century Aluminum Company 12.69 0.89 8% Capstone Mining Corp 1.30 0.09 7% Endeavour Mining Corporation 25.80 1.69 7% CONSOL Energy Inc. 16.78 1.07 7% Lucara Diamond Corp. 3.09 0.19 7% Arch Coal, Inc. 68.94 4.17 6%
1Wk 1WkBottom Companies Close $∆ %∆Stornoway Diamond Corporation 0.84 (0.10) (11)% Seabridge Gold Inc. 11.00 (1.05) (9)% Goldcorp Inc. 19.40 (1.80) (8)% Klondex Mines Ltd. 5.19 (0.45) (8)% Mountain Province Diamonds Inc. 4.75 (0.40) (8)% MAG Silver Corp. 17.41 (1.27) (7)% Hudbay Minerals Inc. 8.74 (0.59) (6)% NovaGold Resources Inc. 6.46 (0.36) (5)% Continental Gold Inc. 4.01 (0.22) (5)% Detour Gold Corporation 15.24 (0.76) (5)%
1Wk 52Wk 1Wk 52WkTicker Company Close $∆ %∆ High Low Ticker Company Close $∆ %∆ High LowTSX:AEM Agnico Eagle Mines Limited 56.42 (2.24) (4)% 78.35 45.97 TSX:IVN Ivanhoe Mines Ltd. 4.64 (0.05) (1)% 5.11 0.81 TSX:ASR Alacer Gold Corp. 2.69 (0.09) (3)% 3.79 1.75 NasdaqGS:KALU Kaiser Aluminum Corporation 79.90 0.07 0% 96.06 69.41 TSX:AGI Alamos Gold Inc. 10.68 (0.27) (2)% 13.65 6.68 TSX:K Kinross Gold Corporation 4.69 0.13 3% 7.56 3.87 NYSE:AA Alcoa Corporation 34.40 1.84 6% 39.78 20.00 TSX:KL Kirkland Lake Gold LTD. 9.81 0.48 5% 11.15 6.33 NasdaqGS:ARLP Alliance Resource Partners, L.P. 21.65 0.50 2% 26.65 11.00 TSX:KDX Klondex Mines Ltd. 5.19 (0.45) (8)% 7.95 3.40 TSX:ALS Altius Minerals Corporation 12.32 0.02 0% 14.06 9.01 TSX:LUC Lucara Diamond Corp. 3.09 0.19 7% 4.39 2.62 NYSE:ACH Aluminum Corporation Of China Limited 12.13 (0.12) (1)% 13.85 7.22 TSX:LUN Lundin Mining Corporation 7.49 0.06 1% 8.94 3.70 NYSE:AU AngloGold Ashanti Limited 10.77 (0.33) (3)% 22.91 9.28 TSX:MAG MAG Silver Corp. 17.41 (1.27) (7)% 23.32 11.95 NYSE:ARCH Arch Coal, Inc. 68.94 4.17 6% 86.47 59.05 TSX:MDI Major Drilling Group International Inc. 7.06 (0.34) (5)% 8.66 5.72 TSX:AR Argonaut Gold Inc. 2.33 (0.07) (3)% 4.45 1.48 NYSE:MTRN Materion Corporation 33.55 1.75 6% 41.23 22.36 TSX:AZ Arizona Mining Inc. 2.15 (0.10) (4)% 3.49 0.76 NYSE:MUX McEwen Mining Inc. 3.04 (0.07) (2)% 4.92 1.80 TSX:AKG Asanko Gold Inc. 3.49 0.13 4% 6.09 2.72 TSX:MPVD Mountain Province Diamonds Inc. 4.75 (0.40) (8)% 7.18 4.07 TSX:BTO B2Gold Corp. 3.79 (0.11) (3)% 4.74 2.06 TSX:NSU Nevsun Resources Ltd. 3.42 0.02 1% 4.81 3.01 TSX:ABX Barrick Gold Corporation 25.26 (0.46) (2)% 30.45 17.09 TSX:NGD New Gold Inc. 3.97 0.06 2% 7.87 3.11 NYSE:BHP BHP Billiton Limited 36.32 (0.19) (1)% 41.79 23.40 NYSE:NEM Newmont Mining Corporation 32.96 (0.52) (2)% 46.07 25.63 NYSE:BBL BHP Billiton plc 31.15 (0.09) (0)% 37.44 20.36 TSX:NXE NexGen Energy Ltd. 3.15 0.02 1% 4.45 1.42 TSX:CCO Cameco Corporation 14.72 0.14 1% 17.65 9.88 TSX:NDM Northern Dynasty Minerals Ltd. 1.88 0.08 4% 4.54 0.37 TSX:CS Capstone Mining Corp 1.30 0.09 7% 1.81 0.44 TSX:NG NovaGold Resources Inc. 6.46 (0.36) (5)% 9.56 5.09 TSX:CG Centerra Gold Inc. 7.65 0.30 4% 8.13 5.56 TSX:OGC OceanaGold Corporation 3.94 (0.15) (4)% 5.56 3.24 NasdaqGS:CENX Century Aluminum Company 12.69 0.89 8% 16.53 5.53 TSX:OR Osisko Gold Royalties Ltd. 14.78 (0.19) (1)% 18.64 11.90 TSX:CGG China Gold International Resources Corp. Ltd. 2.67 (0.10) (4)% 3.67 1.84 TSX:OSK Osisko Mining Inc. 4.85 0.43 10% 5.10 1.00 NYSE:CLD Cloud Peak Energy Inc. 4.58 0.37 9% 8.04 1.64 TSX:PAAS Pan American Silver Corp. 23.28 (0.10) (0)% 27.99 13.60 NYSE:CDE Coeur Mining, Inc. 8.08 0.22 3% 16.41 5.21 TSX:PG Premier Gold Mines Limited 3.21 0.09 3% 5.05 1.87 NYSE:BVN Compañía de Minas Buenaventura S.A.A. 12.04 (0.45) (4)% 16.45 7.02 TSX:PVG Pretium Resources Inc. 14.26 (0.69) (5)% 16.48 6.73 NYSE:CMP Compass Minerals International, Inc. 67.85 1.90 3% 84.40 65.30 NasdaqGS:GOLD Randgold Resources Limited 87.28 (1.79) (2)% 126.55 67.54 NYSE:CNX CONSOL Energy Inc. 16.78 1.07 7% 22.34 10.53 TSX:RIC Richmont Mines Inc. 9.43 0.01 0% 15.01 7.13 NYSE:CSTM Constellium N.V 6.50 0.30 5% 8.85 4.02 NYSE:RIO Rio Tinto plc 40.68 (0.16) (0)% 47.11 26.71 TSX:CNL Continental Gold Inc. 4.01 (0.22) (5)% 5.75 1.69 NasdaqGS:RGLD Royal Gold, Inc. 70.05 2.82 4% 87.74 49.50 TSX:DML Denison Mines Corp. 0.82 0.01 1% 1.10 0.49 TSX:SSL Sandstorm Gold Ltd. 5.72 (0.05) (1)% 8.73 4.06 TSX:DGC Detour Gold Corporation 15.24 (0.76) (5)% 35.93 14.35 NYSE:SA Seabridge Gold Inc. 11.00 (1.05) (9)% 15.88 7.35 TSX:DDC Dominion Diamond Corporation 16.82 (0.17) (1)% 17.82 10.47 TSX:SMF SEMAFO Inc. 4.01 (0.15) (4)% 7.46 3.60 TSX:ELD Eldorado Gold Corporation 4.55 0.33 8% 6.71 3.46 NYSE:SBGL Sibanye Gold Limited 8.81 - - 20.97 6.16 TSX:EDV Endeavour Mining Corporation 25.80 1.69 7% 28.81 10.87 TSX:SSO Silver Standard Resources Inc. 14.12 0.09 1% 20.48 6.92 TSX:EDR Endeavour Silver Corp. 4.23 0.11 3% 7.75 3.07 TSX:SLW Silver Wheaton Corp. 27.71 0.22 1% 40.80 20.51 NasdaqGS:GSM Ferroglobe PLC 10.33 0.51 5% 12.53 7.67 TSX:SVM Silvercorp Metals Inc. 4.62 (0.03) (1)% 5.90 1.70 TSX:FR First Majestic Silver Corp. 10.79 0.26 2% 24.96 7.92 NYSE:SCCO Southern Copper Corporation 35.89 (0.66) (2)% 39.50 24.90 TSX:FM First Quantum Minerals Ltd. 14.13 0.50 4% 17.55 5.38 NYSE:SWC Stillwater Mining Company 17.27 (0.13) (1)% 17.53 9.02 TSX:FVI Fortuna Silver Mines Inc. 6.92 0.20 3% 12.73 4.84 TSX:SWY Stornoway Diamond Corporation 0.84 (0.10) (11)% 1.33 0.81 TSX:FNV Franco-Nevada Corporation 87.12 0.75 1% 105.69 71.44 TSX:THO Tahoe Resources Inc. 10.68 0.45 4% 22.13 9.58 NYSE:FCX Freeport-McMoRan Inc. 13.36 0.55 4% 17.06 8.76 TSX:TECK.B Teck Resources Limited 29.08 0.83 3% 35.67 9.05 NYSE:GFI Gold Fields Limited 3.53 0.01 0% 6.60 2.60 TSX:TGZ Teranga Gold Corporation 0.85 0.02 2% 1.40 0.63 TSX:G Goldcorp Inc. 19.40 (1.80) (8)% 26.56 15.95 TSX:TMR TMAC Resources Inc. 16.33 (0.02) (0)% 20.18 8.81 TSX:GSC Golden Star Resources Ltd. 1.12 (0.01) (1)% 1.46 0.56 TSX:TXG Torex Gold Resources Inc 26.22 (0.54) (2)% 35.17 16.50 TSX:GPR Great Panther Silver Limited 2.17 (0.01) (0)% 2.95 1.13 TSX:TRQ Turquoise Hill Resources Ltd. 4.06 0.01 0% 5.03 3.22
NYSE:VEDL Vedanta Limited 17.17 0.93 6% 17.07 5.00 TSX:WDO Wesdome Gold Mines Ltd. 4.02 0.10 3% 4.40 1.47

The Weekly Dig 3/31/17
Haywood Mining [email protected] Page 17
Upcoming Macroeconomic News
Source: Bloomberg
Date Event Period Survey Prior Revised Relevance Date Event Period Survey Prior Relevance
United States Canada04/03/2017 Markit US Manufacturing PMI Mar F -- 53.4 90 04/03/2017 MLI Leading Indicator MoM Feb -- 0.60% 704/03/2017 Markit US Composite PMI Mar F -- 53.2 70 04/03/2017 Markit Canada Manufacturing PMI Mar -- 54.7 9004/03/2017 ISM Manufacturing Mar 57 57.7 96 04/03/2017 Bloomberg Nanos Confidence 31-Mar -- 58.5 1104/03/2017 ISM Prices Paid Mar -- 68 75 04/03/2017 Business Outlook Future Sales 1Q -- 26 4704/03/2017 ISM New Orders Mar -- 65.1 6 04/03/2017 BoC Senior Loan Officer Survey 1Q -- -2.6 4404/03/2017 ISM Employment Mar -- 54.2 5 04/04/2017 Int'l Merchandise Trade Feb 0.67b 0.81b 6204/03/2017 Construction Spending MoM Feb 1.20% -1.00% 81 04/06/2017 Building Permits MoM Feb 5.40% 7304/03/2017 Wards Total Vehicle Sales Mar 17.40m 17.47m 46 04/07/2017 Unemployment Rate Mar 6.70% 6.60% 9104/03/2017 Wards Domestic Vehicle Sales Mar 13.70m 13.65m 41 04/07/2017 Part Time Employment Change Mar -- -89.8 3304/04/2017 Trade Balance Feb -$46.5b -$48.5b 85 04/07/2017 Full Time Employment Change Mar -- 105.1 3804/04/2017 Factory Orders Feb 0.90% 1.20% 88 04/07/2017 Net Change in Employment Mar 3.2k 15.3k 8704/04/2017 Factory Orders Ex Trans Feb -- 0.30% 8 04/07/2017 Participation Rate Mar -- 65.8 3604/04/2017 Durable Goods Orders Feb F -- 1.70% 93 04/07/2017 Ivey Purchasing Managers Index SA Mar -- 55 3104/04/2017 Durables Ex Transportation Feb F -- 0.40% 7504/04/2017 Cap Goods Orders Nondef Ex Air Feb F -- -0.10% 6204/04/2017 Cap Goods Ship Nondef Ex Air Feb F -- 1.00% 6104/05/2017 MBA Mortgage Applications 31-Mar -- -0.80% 9204/05/2017 ADP Employment Change Mar 180k 298k 8604/05/2017 Markit US Services PMI Mar F -- 52.9 7004/05/2017 ISM Non-Manf. Composite Mar 57 57.6 7904/05/2017 FOMC Meeting Minutes 15-Mar -- -- 804/06/2017 Challenger Job Cuts YoY Mar -- -40.00% 3904/06/2017 Initial Jobless Claims 1-Apr -- 258k 9804/06/2017 Continuing Claims 25-Mar -- 2052k 6904/06/2017 Bloomberg Consumer Comfort 2-Apr -- 49.7 6904/07/2017 Change in Nonfarm Payrolls Mar 174k 235k 9904/07/2017 Two-Month Payroll Net Revision Mar -- 9k 1704/07/2017 Change in Private Payrolls Mar 178k 227k 3304/07/2017 Change in Manufact. Payrolls Mar 19k 28k 6904/07/2017 Unemployment Rate Mar 4.70% 4.70% 8904/07/2017 Average Hourly Earnings MoM Mar 0.30% 0.20% 3204/07/2017 Average Hourly Earnings YoY Mar 2.80% 2.80% 3104/07/2017 Average Weekly Hours All Employees Mar 34.4 34.4 2704/07/2017 Labor Force Participation Rate Mar -- 63.00% 1904/07/2017 Underemployment Rate Mar -- 9.20% 2304/07/2017 Wholesale Trade Sales MoM Feb -- -0.10% 1604/07/2017 Wholesale Inventories MoM Feb F -- 0.40% 8204/07/2017 Consumer Credit Feb $11.000b $8.794b 44

The Weekly Dig 3/31/17
Haywood Mining [email protected] Page 18
Precious Metals Comparables – Consensus Estimates
Source: Capital IQ and Haywood Securities
Shares Market Working EnterpriseCompany Symbol Price O/S Capitalization Cash Capital Debt Value 2016E 2017E Number of
(millions (millions) (millions) (millions) (millions) (millions) CFPS CFPS Estimates 2016E 2017E 2016E 2017E 2016E 2017E
Senior Precious Metals ProducersAgnico Eagle Mines Limited TSX:AEM C$ 56.56 228.7 US$ 9,704 US$ 641 US$ 807 US$ 1,073 US$ 9,971 US$ 3.51 US$ 3.13 11 12.1x 13.6x 12.4x 13.9x 11.4x 11.8xAngloGold Ashanti Limited NYSE:AU C$ 14.23 408.2 US$ 4,358 US$ 220 US$ 406 US$ 2,144 US$ 6,096 US$ 2.71 US$ 2.60 6 3.9x 4.1x 5.5x 5.7x 3.9x 4.3xBarrick Gold Corporation TSX:ABX C$ 25.26 1165.8 US$ 22,097 US$ 2,389 US$ 3,055 US$ 7,712 US$ 26,754 US$ 2.35 US$ 2.48 13 8.1x 7.7x 9.8x 9.3x 6.7x 6.5xCompañía de Minas Buenaventura NYSE:BVN C$ 16.04 254.0 US$ 3,058 US$ 81 US$ 57 US$ 272 US$ 3,273 US$ 1.28 US$ 1.26 3 9.4x 9.5x 10.1x 10.2x 9.7x 7.0xEldorado Gold Corporation TSX:ELD C$ 4.55 715.3 US$ 2,442 US$ 917 US$ 1,001 US$ 592 US$ 2,033 US$ 0.18 US$ 0.24 15 18.7x 14.5x 15.6x 12.0x 10.4x 9.5xFresnillo PLC LSE:FRES C$ 25.97 736.9 US$ 14,359 US$ 912 US$ 1,270 US$ 798 US$ 13,887 US$ 1.00 US$ 1.01 6 19.5x 19.2x 18.9x 18.6x 13.5x 11.5xGold Fields Limited NYSE:GFI C$ 4.65 820.6 US$ 2,860 US$ 527 US$ 193 US$ 1,505 US$ 4,172 US$ 1.20 US$ 1.05 6 2.9x 3.3x 4.2x 4.8x 3.3x 4.0xGoldcorp Inc. TSX:G C$ 19.40 855.4 US$ 12,452 US$ 200 US$ 791 US$ 2,510 US$ 14,171 US$ 1.40 US$ 1.54 17 10.4x 9.5x 11.8x 10.8x 9.8x 9.2xKinross Gold Corporation TSX:K C$ 4.69 1246.8 US$ 4,388 US$ 838 US$ 1,443 US$ 1,733 US$ 4,678 US$ 0.75 US$ 0.76 15 4.7x 4.6x 5.0x 5.0x 4.2x 4.3xNewcrest Mining Limited ASX:NCM C$ 22.67 765.8 US$ 13,027 US$ 248 US$ 479 US$ 2,016 US$ 14,564 US$ 1.35 US$ 1.63 6 12.6x 10.5x 14.1x 11.7x 11.0x 9.4xNewmont Mining Corporation NYSE:NEM C$ 43.92 531.5 US$ 17,518 US$ 2,812 US$ 2,927 US$ 4,039 US$ 18,630 US$ 4.70 US$ 3.97 9 7.0x 8.3x 7.5x 8.8x 6.4x 7.8xRandgold Resources Limited LSE:RRS C$ 116.23 94.0 US$ 8,197 US$ 516 US$ 678 US$ 3 US$ 7,522 US$ 4.81 US$ 5.29 6 18.1x 16.5x 16.6x 15.1x 13.7x 12.2xYamana Gold Inc. TSX:YRI C$ 3.67 948.0 US$ 2,611 US$ 168 US$ 77 US$ 1,574 US$ 4,107 US$ 0.60 US$ 0.51 15 4.6x 5.4x 7.3x 8.6x 6.3x 7.1x
Group Average - Senior Producers 10.2x 9.7x 10.7x 10.4x 8.5x 8.0xGroup Average - Senior Producers (excluding high/low) 10.0x 9.5x 10.5x 10.1x 8.5x 8.0x
Intermediate Precious Metals ProducersAcacia Mining plc LSE:ACA C$ 7.50 410.1 US$ 2,308 US$ 318 US$ 413 US$ 71 US$ 1,966 US$ 0.86 US$ 1.02 8 6.6x 5.5x 5.6x 4.7x 4.8x 4.4xAlamos Gold Inc. TSX:AGI C$ 10.68 255.5 US$ 2,048 US$ 403 US$ 494 US$ 313 US$ 1,867 US$ 0.52 US$ 0.56 12 15.3x 14.2x 14.0x 13.0x 13.0x 10.7xB2Gold Corp. TSX:BTO C$ 3.79 973.0 US$ 2,767 US$ 145 US$ 101 US$ 473 US$ 3,139 US$ 0.33 US$ 0.19 13 8.7x 14.9x 9.8x 16.9x 9.9x 15.2xCentamin Plc LSE:CEY C$ 2.88 1150.0 US$ 2,487 US$ 400 US$ 509 - US$ 1,978 US$ 0.29 US$ 0.25 6 7.6x 8.6x 6.0x 6.9x 5.3x 5.8xCenterra Gold Inc. TSX:CG C$ 7.65 291.3 US$ 1,672 US$ 160.1 US$ 788.6 US$ 392.9 US$ 1,276.3 US$ 1.40 US$ 1.40 10 4.1x 4.1x 3.1x 3.1x 2.9x 2.7xDetour Gold Corporation TSX:DGC C$ 15.24 174.6 US$ 1,996 US$ 129 (US$ 159) - US$ 2,155 US$ 1.28 US$ 1.46 16 8.9x 7.8x 9.6x 8.5x 9.5x 8.4xEndeavour Mining Corporation TSX:EDV C$ 25.80 93.8 US$ 1,816 US$ 124.3 US$ 133.9 US$ 141.0 US$ 1,823.1 US$ 2.16 US$ 2.75 6 9.0x 7.0x 9.0x 7.1x 8.1x 7.0xGuyana Goldfields Inc. TSX:GUY C$ 7.19 171.1 US$ 923 US$ 103.9 US$ 111.4 US$ 58.8 US$ 870.8 US$ 0.47 US$ 0.48 6 11.6x 11.2x 10.9x 10.5x 10.1x 10.2xHarmony Gold Mining Company LimNYSE:HMY C$ 3.26 439.4 US$ 1,076 US$ 89 US$ 219 US$ 110 US$ 966 US$ 0.52 US$ 0.69 5 4.7x 3.5x 4.3x 3.2x 2.9x 2.7xHecla Mining Company NYSE:HL C$ 7.05 395.4 US$ 2,092 US$ 199 US$ 176 US$ 501 US$ 2,417 US$ 0.54 US$ 0.54 7 9.9x 9.8x 11.4x 11.3x 10.1x 9.9xIAMGOLD Corporation TSX:IMG C$ 5.32 464.6 US$ 1,855 US$ 652 US$ 817 US$ 485 US$ 1,522 US$ 0.65 US$ 0.62 15 6.2x 6.5x 5.1x 5.3x 4.7x 4.8xKirkland Lake Gold LTD. TSX:KL C$ 9.81 203.0 US$ 1,495 US$ 234.9 US$ 92.3 US$ 0.0 US$ 1,402.3 US$ 1.18 US$ 1.05 8 6.2x 7.0x 5.8x 6.6x 9.1x 5.6xNew Gold Inc. TSX:NGD C$ 3.97 575.5 US$ 1,714 US$ 186 US$ 234 US$ 890 US$ 2,370 US$ 0.55 US$ 0.50 16 5.4x 6.0x 7.4x 8.2x 8.0x 7.9xOceanaGold Corporation TSX:OGC C$ 3.94 611.4 US$ 1,808 US$ 69 (US$ 52) US$ 200 US$ 2,060 US$ 0.42 US$ 0.60 14 7.1x 5.0x 8.0x 5.7x 7.4x 4.9xPretium Resources Inc. TSX:PVG C$ 14.26 179.8 US$ 1,924 US$ 142 US$ 46 US$ 501 US$ 2,379 (US$ 0.05) US$ 0.40 5 - 26.6x - 32.9x - 39.7xSEMAFO Inc. TSX:SMF C$ 4.01 324.9 US$ 978 US$ 274 US$ 287 US$ 57 US$ 747 US$ 0.45 US$ 0.36 12 6.8x 8.3x 5.2x 6.3x 5.1x 5.9xTMAC Resources Inc. TSX:TMR C$ 16.33 83.9 US$ 1,029 US$ 47 US$ 53 US$ 86 US$ 1,061 (US$ 0.64) US$ 0.80 1 - 15.3x - 15.7x - 15.1xTorex Gold Resources Inc TSX:TXG C$ 26.22 79.7 US$ 1,569 US$ 104 US$ 125 US$ 388 US$ 1,832 US$ 1.67 US$ 2.29 6 11.8x 8.6x 13.7x 10.0x 11.6x 8.2x
Group Average - Intermediate Producers 8.1x 9.4x 8.1x 9.8x 7.7x 9.4xGroup Average - Intermediate Producers (excluding high/low) 6.0x 8.7x 6.0x 8.7x - 7.9x
Junior Precious Metals ProducersAlacer Gold Corp. TSX:ASR C$ 2.69 292.8 US$ 591 US$ 215 US$ 269 - US$ 322 US$ 0.14 US$ 0.29 8 14.8x 7.0x 8.0x 3.8x 8.9x 3.5xArgonaut Gold Inc. TSX:AR C$ 2.33 177.0 US$ 309 US$ 42.1 US$ 95.4 US$ 0.0 US$ 214.1 US$ 0.23 US$ 0.22 8 7.6x 7.9x 5.3x 5.5x 5.2x 5.0xAsanko Gold Inc. TSX:AKG C$ 3.49 203.3 US$ 532 US$ 59.7 US$ 72.3 US$ 154.5 US$ 614.6 US$ 0.33 US$ 0.42 7 7.9x 6.3x 9.1x 7.3x 8.6x 6.5xDundee Precious Metals Inc. TSX:DPM C$ 2.82 178.4 US$ 378 US$ 12 US$ 33 US$ 25 US$ 370 US$ 0.44 US$ 0.48 4 4.9x 4.4x 4.8x 4.3x 6.6x 4.9xGolden Star Resources Ltd. TSX:GSC C$ 1.12 376.2 US$ 316 US$ 21.8 US$ (60.5) US$ 88.6 US$ 465.2 US$ 0.04 US$ 0.13 5 22.1x 6.5x 32.5x 9.5x 32.4x 7.8xHighland Gold Mining Limited AIM:HGM C$ 2.91 325.2 US$ 711 US$ 19.8 US$ (4.4) US$ 121.7 US$ 836.7 US$ 0.45 US$ 0.41 1 4.9x 5.3x 5.7x 6.3x 6.3x 6.5xMcEwen Mining Inc. TSX:MUX C$ 4.05 300.0 US$ 912 US$ 44.2 US$ 58.0 US$ 0.0 US$ 853.7 - - 0 - - - - - -Primero Mining Corp. TSX:P C$ 0.74 190.9 US$ 106 US$ 19.9 US$ (3.2) US$ 52.5 US$ 161.7 US$ 0.09 US$ 0.19 14 6.0x 2.9x 9.1x 4.4x 4.6x 4.0xRichmont Mines Inc. TSX:RIC C$ 9.43 63.2 US$ 447 US$ 55.9 US$ 45.4 US$ 1.2 US$ 403.2 US$ 0.61 US$ 0.81 10 11.5x 8.7x 10.4x 7.9x 11.5x 7.7xRoxgold Inc. TSX:ROXG C$ 1.38 611.4 US$ 633 US$ 60.6 US$ 26.5 US$ 52.2 US$ 658.8 US$ 0.05 US$ 0.17 7 21.7x 6.0x 22.6x 6.3x 3.2x 3.3xTeranga Gold Corporation TSX:TGZ C$ 0.85 536.7 US$ 342 US$ 96.4 US$ 71.0 US$ 13.8 US$ 285.2 US$ 0.16 US$ 0.10 5 4.0x 6.2x 3.3x 5.2x 2.7x 5.0xTimmins Gold Corp. TSX:TMM C$ 0.50 355.6 US$ 133 US$ 33.9 US$ 37.8 US$ 0.0 US$ 95.7 US$ 0.13 US$ 0.04 8 2.9x 8.7x 2.1x 6.3x 2.3x 7.4xWesdome Gold Mines Ltd. TSX:WDO C$ 4.02 130.6 US$ 394 US$ 19.9 US$ 11.6 US$ 0.0 US$ 382.5 US$ 0.12 US$ 0.15 7 25.1x 20.5x 24.4x 19.9x 32.5x 18.1x
Group Average - Junior Producers 11.1x 7.6x 11.4x 7.2x 10.4x 6.6xGroup Average - Junior Producers (excluding high/low) 10.5x 6.7x 10.3x 6.3x 9.0x 5.8x
All data sourced from Capital IQ
P/CF Ratio EV/CF Ratio EV/EBITDA Ratio

The Weekly Dig 3/31/17
Haywood Mining [email protected] Page 19
Other Precious Metals Comparables – Consensus Estimates
Source: Capital IQ and Haywood Securities
Shares Market Working EnterpriseCompany Symbol Price O/S Capitalization Cash Capital Debt Value 2016E 2017E Number of
(millions) (millions) (millions) (millions) (millions) (millions) CFPS CFPS Estimates 2016E 2017E 2016E 2017E 2016E 2017E
PGM ProducersImpala Platinum Holdings Limited JSE:IMP C$ 4.49 709.7 US$ 2,392 US$ 390 US$ 828 US$ 582 US$ 2,147 US$ 0.31 US$ 0.29 4 10.8x 11.7x 9.7x 10.5x 7.6x 7.6xLonmin plc LSE:LMI C$ 1.42 282.4 US$ 301 US$ 323 US$ 511 US$ 150 (US$ 60) US$ 0.30 US$ 0.26 5 3.5x 4.1x - - - -Stillwater Mining Company NYSE:SWC C$ 23.01 121.4 US$ 2,096 US$ 450 US$ 527 US$ 275 US$ 1,844 US$ 0.75 US$ 1.21 2 23.2x 14.3x 20.4x 12.6x 18.2x 12.1xNorth American Palladium Ltd. TSX:PDL C$ 5.39 58.1 US$ 235 US$ 11 US$ 6 US$ 34 US$ 263 - - 0 - - - - - -
Group Average - PGM Producers 12.5x 10.0x 15.1x 11.5x 12.9x 9.9xGroup Average - PGM Producers (excluding high/low) 10.8x 11.7x 9.7x 10.5x 7.6x 7.6x
Silver ProducersAurcana Corporation TSXV:AUN C$ 0.39 84.7 US$ 25 US$ 1 US$ 1 - US$ 24 - - 0 - - - - - -Coeur Mining, Inc. NYSE:CDE C$ 10.77 181.6 US$ 1,467 US$ 162 US$ 294 US$ 176 US$ 1,349 US$ 1.10 US$ 1.15 5 7.3x 7.0x 6.8x 6.4x 5.8x 5.8xEndeavour Silver Corp. TSX:EDR C$ 4.23 127.1 US$ 403 US$ 72 US$ 82 - US$ 322 US$ 0.23 US$ 0.23 5 13.8x 13.6x 11.0x 10.8x 8.9x 9.6xFirst Majestic Silver Corp. TSX:FR C$ 10.79 165.0 US$ 1,336 US$ 143 US$ 131 US$ 32 US$ 1,237 US$ 0.61 US$ 0.67 6 13.2x 12.0x 12.2x 11.1x 11.6x 10.6xFortuna Silver Mines Inc. TSX:FVI C$ 6.92 158.9 US$ 825 US$ 105 US$ 91 US$ 40 US$ 773 US$ 0.49 US$ 0.52 5 10.7x 10.0x 10.0x 9.3x 9.5x 7.7xHecla Mining Company NYSE:HL C$ 7.05 395.4 US$ 2,092 US$ 199 US$ 176 US$ 501 US$ 2,417 US$ 0.54 US$ 0.54 5 9.9x 9.8x 11.4x 11.3x 10.1x 9.9xMandalay Resources Corporation TSX:MND C$ 0.59 451.2 US$ 200 US$ 67 US$ 44 US$ 1 US$ 157 US$ 0.12 US$ 0.11 4 3.8x 4.1x 3.0x 3.2x 3.1x 3.4xPan American Silver Corp. TSX:PAAS C$ 23.28 153.1 US$ 2,675 US$ 218 US$ 429 US$ 57 US$ 2,303 US$ 1.48 US$ 1.44 6 11.8x 12.1x 10.2x 10.4x 8.2x 8.6xSilver Standard Resources Inc. TSX:SSO C$ 14.12 119.4 US$ 1,265 US$ 476 US$ 560 US$ 220 US$ 926 US$ 1.45 US$ 1.16 4 7.3x 9.1x 5.3x 6.7x 4.7x 6.1xSilvercorp Metals Inc. TSX:SVM C$ 4.62 167.4 US$ 580 US$ 97 US$ 64 - US$ 516 US$ 0.18 US$ 0.42 2 19.3x 8.3x 17.1x 7.3x 12.6x -Tahoe Resources Inc. TSX:THO C$ 10.68 311.7 US$ 2,498 US$ 163 US$ 209 US$ 35 US$ 2,324 US$ 1.11 US$ 0.95 10 7.2x 8.4x 6.7x 7.8x 6.0x 6.8x
Group Average - Silver Producers 10.4x 9.4x 9.4x 8.5x 8.1x 7.6xGroup Average - Silver Producers (excluding high/low) 10.1x 9.6x 9.2x 8.8x 8.1x 7.8x
Diamond ProducersDominion Diamond Corporation NYSE:DDC C$ 16.83 83.1 US$ 1,049 US$ 198 US$ 438 - US$ 611 US$ 1.67 US$ 1.32 4 7.6x 9.5x 4.4x 5.6x 2.4x 3.9xLucara Diamond Corp. TSX:LUC C$ 3.09 382.2 US$ 886 US$ 53 US$ 66 - US$ 820 US$ 0.28 US$ 0.28 8 8.2x 8.3x 7.6x 7.7x 4.4x 4.8xMountain Province Diamonds Inc. TSX:MPVD C$ 4.75 160.2 US$ 571 US$ 5 (US$ 23) US$ 292 US$ 886 (US$ 0.12) US$ 0.49 4 - 7.3x - 11.3x 107.3x 9.7xPetra Diamonds Limited LSE:PDL C$ 2.22 518.7 US$ 866 US$ 37 (US$ 40) US$ 473 US$ 1,379 US$ 0.25 US$ 0.34 6 6.8x 4.9x 10.8x 7.7x 8.6x 6.3xStornoway Diamond Corporation TSX:SWY C$ 0.84 828.5 US$ 522 US$ 64 US$ 39 US$ 150 US$ 633 US$ 0.10 US$ 0.08 3 6.5x 7.6x 7.9x 9.3x - 6.7x
Group Average - Diamond Producers 7.9x 8.9x 6.0x 6.6x 3.4x 4.4x
Royalty CompaniesAnglo Pacific Group plc LSE:APF C$ 2.03 180.0 US$ 274 US$ 7 US$ 20 US$ 8 US$ 261 US$ 0.12 US$ 0.23 3 12.7x 6.6x 12.1x 6.3x 11.9x 5.8xFranco-Nevada Corporation TSX:FNV C$ 87.12 178.5 US$ 11,668 US$ 253 US$ 324 - US$ 11,345 US$ 2.58 US$ 2.57 15 25.3x 25.5x 24.6x 24.8x 23.5x 22.7xOsisko Gold Royalties Ltd. TSX:OR C$ 14.78 106.6 US$ 1,182 US$ 373 US$ 368 US$ 34 US$ 847 US$ 0.37 US$ 0.39 11 29.8x 28.1x 21.4x 20.2x 25.5x 21.7xRoyal Gold, Inc. US:RGLD C$ 93.35 65.3 US$ 4,576 US$ 84 US$ 114 US$ 677 US$ 5,140 US$ 3.41 US$ 4.17 9 20.5x 16.8x 23.1x 18.9x 19.4x 16.5xSandstorm Gold Ltd. TSX:SSL C$ 5.72 152.0 US$ 652 US$ 21 US$ 24 - US$ 628 US$ 0.27 US$ 0.27 8 16.0x 16.1x 15.4x 15.5x 16.1x 15.4xSilver Wheaton Corp. TSX:SLW C$ 27.71 441.5 US$ 9,180 US$ 124 US$ 109 US$ 1,193 US$ 10,264 US$ 1.32 US$ 1.29 9 15.7x 16.2x 17.6x 18.1x 17.6x 17.4x
Group Average - Royalty Companies 20.0x 18.2x 19.0x 17.3x 19.0x 16.6xGroup Average - Royalty Companies (excluding high/low) 19.4x 18.6x 19.4x 18.1x 19.1x 17.8x
All data sourced from Capital IQ
P/CF Ratio EV/CF Ratio EV/EBITDA Ratio

The Weekly Dig 3/31/17
Haywood Mining [email protected] Page 20
Base Metals Comparables – Consensus Estimates
Shares Market Working EnterpriseCompany Symbol Price O/S Capitalization Cash Capital Debt Value 2016E 2017E Number of
(millions) (millions) (millions) (millions) (millions) (millions) CFPS CFPS Estimates 2016E 2017E 2016E 2017E 2016E 2017E
Large-Cap Base Metals ProducersAnglo American plc LSE:AAL C$ 20.35 1402.2 US$ 21,413 US$ 6,070 US$ 5,924 US$ 11,320 US$ 26,809 US$ 3.91 US$ 4.66 8 3.9x 3.3x 4.9x 4.1x 4.6x 3.2xAntofagasta plc LSE:ANTO C$ 13.93 985.9 US$ 10,303 US$ 2,049 US$ 1,881 US$ 2,201 US$ 10,622 US$ 1.10 US$ 1.39 10 9.5x 7.5x 9.8x 7.7x 6.8x 5.7xBHP Billiton Limited ASX:BHP C$ 24.47 5320.6 US$ 97,698 US$ 14,090 US$ 9,502 US$ 30,670 US$ 118,866 US$ 2.75 US$ 3.44 4 6.7x 5.3x 8.1x 6.5x 10.0x 5.4xFirst Quantum Minerals Ltd. TSX:FM C$ 14.13 689.4 US$ 7,309 US$ 1,463 US$ 849 US$ 4,561 US$ 11,021 US$ 1.49 US$ 1.67 9 7.1x 6.4x 10.7x 9.6x 10.8x 9.5xFreeport-McMoRan Inc. NYSE:FCX C$ 17.80 1445.4 US$ 19,310 US$ 4,245 US$ 6,170 US$ 14,795 US$ 27,935 US$ 2.83 US$ 2.80 7 4.7x 4.8x 6.8x 6.9x 5.9x 5.5xGlencore Plc LSE:GLEN C$ 5.23 14250.3 US$ 55,883 US$ 2,642 US$ 45 US$ 22,862 US$ 78,700 US$ 0.51 US$ 0.67 9 7.7x 5.9x 10.9x 8.2x 8.0x 5.6xKGHM Polska Miedz Spólka Akcyjna WSE:KGH C$ 38.94 200.0 US$ 5,843 US$ 242 US$ 90 US$ 1,566 US$ 7,320 US$ 4.10 US$ 5.29 4 7.1x 5.5x 8.9x 6.9x 6.7x 4.8xRio Tinto plc LSE:RIO C$ 53.56 1798.0 US$ 72,266 US$ 8,536 US$ 5,686 US$ 17,405 US$ 83,985 US$ 5.22 US$ 7.43 7 7.7x 5.4x 8.9x 6.3x 6.4x 4.7xTeck Resources Limited TSX:TECK.B C$ 29.08 577.3 US$ 12,604 US$ 1,047 US$ 1,907 US$ 6,137 US$ 16,834 US$ 3.52 US$ 6.57 7 6.2x 3.3x 8.3x 4.4x 6.3x 3.9xVale S.A. NYSE:VALE C$ 12.71 5153.4 US$ 48,113 US$ 4,426 US$ 11,350 US$ 29,220 US$ 65,983 US$ 1.49 US$ 1.98 6 6.4x 4.8x 8.6x 6.5x 5.9x 4.1x
Group Average - Large-Cap Producers 6.7x 5.2x 8.6x 6.7x 7.1x 5.2xGroup Average - Large-Cap Producers (excluding high/low) 6.7x 5.2x 8.8x 6.7x 7.0x 5.0x
Mid Tier Base Metals ProducersCapstone Mining Corp TSX:CS C$ 1.30 391.3 US$ 382 US$ 130 US$ 171 US$ 325 US$ 536 US$ 0.30 US$ 0.32 10 3.2x 3.1x 4.5x 4.3x 3.6x 3.7xCliffs Natural Resources Inc. NYSE:CLF C$ 10.94 296.4 US$ 2,433 US$ 323 US$ 434 US$ 2,175 US$ 4,175 US$ 1.24 US$ 2.18 2 6.6x 3.8x 11.4x 6.5x 12.3x 5.9xHudbay Minerals Inc. TSX:HBM C$ 8.74 237.3 US$ 1,556 US$ 147 US$ 122 US$ 1,216 US$ 2,650 US$ 1.55 US$ 1.92 11 4.2x 3.4x 7.2x 5.8x 6.0x 4.4xImperial Metals Corporation TSX:III C$ 6.36 93.6 US$ 447 US$ 3 (US$ 37) US$ 640 US$ 1,124 US$ 0.80 US$ 1.36 4 6.0x 3.5x 15.1x 8.8x 14.2x 8.7xKAZ Minerals plc LSE:KAZ C$ 7.59 446.5 US$ 2,543 US$ 1,108 US$ 866 US$ 3,446 US$ 5,123 US$ 0.60 US$ 0.94 3 9.6x 6.0x 19.3x 12.1x 16.5x 6.8xLundin Mining Corporation TSX:LUN C$ 7.49 726.4 US$ 4,083 US$ 715 US$ 2,052 US$ 979 US$ 3,009 US$ 0.53 US$ 0.98 8 10.6x 5.7x 7.8x 4.2x 5.1x 3.4xMMG Limited HKSE:1208 C$ 0.50 7938.9 US$ 2,963 US$ 553 US$ 422 US$ 9,516 US$ 12,057 US$ 0.24 US$ 0.19 1 1.6x 1.9x 6.3x 7.9x 14.7x 5.4xNevsun Resources Ltd. TSX:NSU C$ 3.42 301.9 US$ 775 US$ 199 US$ 201 - US$ 574 US$ 0.34 US$ 0.22 6 7.6x 11.6x 5.6x 8.6x 5.5x 6.9xNyrstar NV ENXTBR:NYR C$ 8.30 93.6 US$ 583 US$ 142 (US$ 411) US$ 596 US$ 1,590 US$ 0.92 US$ 2.43 1 6.8x 2.6x 18.5x 7.0x 7.8x 4.8xOZ Minerals Limited ASX:OZL C$ 7.97 298.7 US$ 1,786 US$ 474 US$ 556 - US$ 1,230 US$ 0.88 US$ 0.99 5 6.8x 6.1x 4.7x 4.2x 4.1x 3.7xSherritt International Corporation TSX:S C$ 0.94 294.3 US$ 208 US$ 230 US$ 368 US$ 1,627 US$ 1,466 (US$ 0.38) US$ 0.19 2 - 3.8x - 26.6x 84.9x 6.6xTurquoise Hill Resources Ltd. TSX:TRQ C$ 4.06 2012.3 US$ 6,131 US$ 1,418 US$ 2,434 US$ 4,126 US$ 7,823 US$ 0.15 (US$ 0.11) 5 20.9x - 26.7x - 21.0x 114.3xVedanta Resources plc LSE:VED C$ 13.52 277.1 US$ 2,811 US$ 8,167 US$ 1,358 US$ 12,022 US$ 13,475 US$ 8.43 US$ 12.76 2 1.2x 0.8x 5.8x 3.8x 5.8x 4.3xWestern Areas Ltd ASX:WSA C$ 2.35 272.3 US$ 480 US$ 75 US$ 87 - US$ 394 US$ 0.12 US$ 0.23 3 15.1x 7.6x 12.4x 6.2x 14.3x 7.7x
Group Average - Mid Tier Producers 7.7x 4.6x 11.2x 8.2x 15.4x 13.3xGroup Average - Mid Tier Producers (excluding high/low) 6.6x 4.0x 9.9x 6.6x 10.6x 5.7x
Small Cap Base Metals ProducersAmerigo Resources Ltd. TSX:ARG C$ 0.65 174.8 US$ 85 US$ 16 US$ 1 US$ 59 US$ 144 US$ 0.12 US$ 0.13 1 4.1x 3.8x 6.9x 6.3x 40.0x 8.0xAtalaya Mining plc AIM:ATYM C$ 2.16 116.7 US$ 189 US$ 7 (US$ 27) - US$ 217 US$ 0.10 US$ 0.20 3 17.1x 8.1x 19.5x 9.3x 45.3x 3.7xCopper Mountain Mining Corporation TSX:CMMC C$ 1.03 132.7 US$ 103 US$ 23 (US$ 1) US$ 236 US$ 339 US$ 0.27 US$ 0.32 4 2.8x 2.4x 9.3x 7.9x 9.5x 6.7xTaseko Mines Limited TSX:TKO C$ 1.77 224.1 US$ 298 US$ 67 US$ 82 US$ 269 US$ 484 US$ 0.06 US$ 0.38 5 22.3x 3.5x 36.3x 5.7x 34.8x 5.8xTrevali Mining Corporation TSX:TV C$ 1.33 403.3 US$ 403 US$ 12 US$ 8 US$ 43 US$ 438 US$ 0.09 US$ 0.22 5 11.1x 4.5x 12.1x 4.9x 9.5x 2.2x
Group Average - Small Cap Producers 11.5x 4.5x 16.8x 6.8x 27.8x 5.3xGroup Average - Small Cap Producers (excluding high/low) 10.7x 3.9x 13.7x 6.6x 28.1x 5.4x
All data sourced from Capital IQ
P/CF Ratio EV/CF Ratio EV/EBITDA Ratio

The Weekly Dig 3/31/17
Haywood Mining [email protected] Page 21
Iron Comparables – Consensus Estimates
Bloomberg Shares Market Daily Enterprise
Company (T icker) Share PriceConsensus
TargetImplied Return β
Outstanding (millions)
Capitalization (millions)
Volume (millions)
Weekly Liquidity WACC
Debt (millions)
Value (millions) 2017 2018 2019 2017 2018 2019 2017 2018 2019 2017 2018 2019
Diversified Mining HousesVALE SA (VALE3-BZ) R$ 29.79 R$ 36.55 22.7% 1.65 3,217 R$ 153,025 5.6 0.6% 14.5% R$ 95,563 R$ 241,159 7.32 5.48 5.50 4.1x 5.4x 5.4x 7.8x 10.7x 9.5x 5.2x 6.2x 5.7xBHP BILLITON (BHP-AU) A$ 24.04 A$ 27.75 15.4% 1.57 3,212 A$ 120,090 9.7 1.7% 10.8% A$ 36,421 A$ 117,469 4.08 3.80 3.73 5.9x 6.3x 6.4x 12.4x 14.5x 15.7x 5.3x 5.9x 6.0xRIO TINTO (RIO-AU) A$ 60.46 A$ 70.63 16.8% 1.20 424 A$ 98,197 2.8 3.4% 10.1% A$ 17,630 A$ 90,461 9.83 8.03 8.43 6.1x 7.5x 7.2x 10.4x 14.1x 13.5x 5.1x 6.1x 5.9xGroup Average - Diversifed Mining Avg. -> 5.4x 6.4x 6.3x 10.2x 13.1x 12.9x 5.2x 6.0x 5.9x
ProducersKUMBA IRON (KIO-SJE) ZAR 20,291 ZAR 18,963 (6.5)% 2.00 322 ZAR 65,354 0.7 1.2% 14.7% ZAR 4,500 ZAR 67,875 3527 2382 1874 5.8x 8.5x 10.8x 7.1x 11.4x 13.5x 3.4x 5.1x 5.7xFORTESCUE METALS (FMG-AU) A$ 6.23 A$ 6.57 5.4% 1.61 3,114 A$ 19,399 23.2 3.3% 11.0% A$ 6,771 A$ 18,813 1.73 1.06 1.10 3.6x 5.9x 5.7x 5.6x 9.6x 12.9x 3.5x 4.9x 5.8xCLIFFS NATURAL (CLF-US) US$ 8.21 US$ 9.86 20.1% 2.06 296 US$ 2,433 19.4 22.7% 10.0% US$ 2,231 US$ 4,475 2.69 2.42 2.02 3.1x 3.4x 4.1x 5.0x 7.5x 11.8x 6.2x 7.9x 9.6xMMX MINERACAO (MMXM3-BRZ) R$ 4.89 0.63 6 R$ 32 0.0 13.3% 12.9% R$ 151 R$ 163 FERREXPO PLC (FXPO-LSE) GBp 168 GBp 161.30 (4.2)% 1.38 589 GBp 991 4.3 3.6% 9.7% GBp 734 GBp 1,833 52.08 39.48 43.92 3.2x 4.3x 3.8x 3.9x 6.7x 6.2x 3.7x 5.6x 5.8xMOUNT GIBSON (MGX-AU) A$ 0.42 A$ 0.53 25.4% 0.88 1,097 A$ 461 4.3 0.9% 9.0% A$ 0 A$ 14 0.06 0.02 0.04 7.6x 18.3x 9.8x 9.5x 19.1x 35.0xGRANGE RESOURCES (GRR-AU) A$ 0.20 0.77 1,157 A$ 226 2.5 0.6% 7.9% A$ 9 A$ 69 BC IRON (BCI-AU) A$ 0.18 A$ 0.34 88.9% 1.90 393 A$ 71 4.2 2.3% 16.2% A$ 2 A$ 38 Group Average - Producers Avg. -> 4.7x 8.1x 6.8x 6.2x 10.9x 15.9x 4.2x 5.9x 6.8x
Advanced Development / Exploration (Select Group)SUNDANCE RESOURCES (SDL-AU) A$ 0.01 1.10 7,102 A$ 35.5 30.0 0.8% 3.4% A$ 97 A$ 112 NEW MILLENNIUM (NML-T) C$ 0.20 1.16 181 C$ 36.2 0.9 0.3% 12.6% C$ 0 C$ 22 ZANAGA IRON (ZIOC-LSE) GBp 7 0.06 279 GBp 19.5 0.4 0.1% 4.9% GBp 0 GBp 18 CENTURY GLOBAL (CNT-T) C$ 0.30 98 C$ 29.5 0.0 0.0% 11.0% C$ 0 C$ 16 CHAMPION IRON (CIA-T) C$ 1.03 1.13 386 C$ 397.5 2.0 0.4% 13.0% C$ 0 C$ 384 BLACK IRON (BKI-T) C$ 0.12 (0.40) 160 C$ 19.2 1.1 3.4% -2.2% C$ 0 C$ 11 OCEANIC IRON (FEO-T) C$ 0.26 0.45 50 C$ 12.7 0.1 0.2% 5.7% C$ 2 C$ 12 MACARTHUR MINERALS (MMS-T) C$ 0.12 0.79 140 C$ 16.1 2.0 1.7% 7.8% C$ 0 C$ 16 Group Average - Developers / Explorers Avg. ->All data sourced from Bloomberg
EV/EBITDAP/EPSCFPS (LoC) P/CFPS

The Weekly Dig 3/31/17
Haywood Mining [email protected] Page 22
Uranium Comparables – Consensus Estimates
IBES Shares Market Enterprise Total Reserves IBESCompany (T icker)Haywood Covered Names bold
Share Price
Consensus Target
Implied Return
Outst. (millions)
Capitalization (millions)
Value (USD)(millions)
& Resources (M lb)
USD EV/lb Resource
Consensus NAV
Price / Nav 2016 2017 2018 2016 2017 2018 2016 2017 2018 2016 2017 2018
Cameco Corporation (CCO-T) $14.72 $16.49 12% 396 $5,826 $5,252 1,155 $4.55 $16.41 0.90x $0.98 $1.28 $1.64 15.1x 11.5x 9.0x $0.44 $0.51 $0.90 33.5x 28.7x 16.3xPaladin Energy (PDN-T) $0.11 $0.07 (36)% 1,713 $188.4 $482.1 353.2 $1.36 $0.12 0.93x $0.01 ($0.02) $0.01 16.5x 14.7x ($0.02) ($0.02) $0.00 36.7xUranium Energy (UEC-US) $1.42 $2.81 98% 138 $195.6 $187.6 86.1 $2.18 $3.80 0.37x ($0.16) ($0.11) ($0.07) ($0.16) ($0.12) ($0.10)Energy Fuels (UUUU-US) $2.17 $4.27 97% 70 $152.2 $167.6 149.9 $1.12 $4.51 0.48x $0.05 ($0.28) $0.17 43.4x 12.8x ($0.51) ($0.36) ($0.11)UR-Energy Inc. (URE-T) $0.89 $2.08 133% 146 $129.6 $119.8 42.9 $2.79 $2.31 0.38x $0.03 $0.05 ($0.03) 33.8x 16.9x ($0.03) $0.04 22.3xPeninsula Energy (PEN-AU) $0.50 $1.15 130% 226 $113.2 $111.0 98.3 $1.13 $1.16 0.43x ($0.03) $0.03 14.4x ($0.07) ($0.05) $0.04 13.9xEnergy Resources (ERA-AU) $0.72 $0.05 (93)% 518 $372.8 ($17.4) 443.5 $0.60 1.20x $0.02 ($0.12) $0.01 36.0x 72.0x ($0.26) ($0.14) ($0.07)Group Average - Producers $2.19 0.67x 29.0x 14.2x 24.6x 33.5x 25.5x 22.3x
NexGen Energy (NXE-T) $3.15 $4.73 50% 306 $965 $725.2 302.1 $2.40 $4.93 0.64x ($0.04) ($0.02) ($0.02) ($0.06) ($0.04) ($0.04)Denison Mines (DML-T) $0.82 $1.04 27% 559 $458.4 $332.4 127.8 $2.60 $1.15 0.71x ($0.02) ($0.02) ($0.03) ($0.02) ($0.02) ($0.01)Fission Uranium (FCU-T) $0.84 $1.75 108% 484 $406.7 $267.5 108.3 $2.47 $1.96 0.43x ($0.02) ($0.01) ($0.02) ($0.02) ($0.01) ($0.02)Berkeley Energia (BKY-AU) $0.74 $1.10 48% 254 $188.3 $110.9 89.4 $1.24 ($0.03) ($0.05) ($0.09) ($0.03) ($0.07) $0.05 13.8xToro Energy (TOE-AU) $0.04 $0.07 67% 2,008 $84.3 $68.4 63.4 $1.08 $0.09 0.47xUEX Corporation (UEX-T) $0.31 $0.55 80% 319 $97.4 $70.0 86.4 $0.81 $0.53 0.58x ($0.03) ($0.02) ($0.02) ($0.03) ($0.02) ($0.02)Summit Resources (SMM-AU) $0.38 218 $82.8 $62.1 84.3 $0.74GoviEx Uranium (GXU-V) $0.26 321 $83.6 $68.9 218.4 $0.32Vimy Resources (VMY-AU) $0.23 $0.49 116% 317 $71.3 $55.9 76.8 $0.73 $0.48 0.47x ($0.02) ($0.03) ($0.02) ($0.05) ($0.04) ($0.02)A-Cap Resources (ACB-AU) $0.06 872 $51.4 $34.5 190.6 $0.18Deep Yellow (DYL-AU) $0.29 130 $37.6 $26.9 95.3 $0.28Western Uranium (WUC-L) $1.82 18 $32.5 $24.8 98.6 $0.25Energy Metals (EME-AU) $0.12 210 $25.2 $3.5 46.7 $0.08Group Average - Developers $1.01 0.55x 13.8x
Aurania Resources (ARU-V) $2.50 23 $56.9 $42.9Mega Uranium (MGA-T) $0.21 286 $60.0 $44.2 17.0 $2.60Laramide Resources (LAM-T) $0.60 $0.75 25% 113 $67.6 $51.2 151.4 $0.34 $0.93 0.65xBannerman Resources (BMN-AU) $0.06 850 $46.7 $32.2 270.7 $0.12Plateau Uranium (PLU-V) $0.54 58 $31.3 $22.6 123.4 $0.18Kivalliq Energy (KIV-V) $0.12 $0.15 30% 247 $28.4 $21.0 43.5 $0.48 $0.16 0.72xGlobex Mining (GMX-T) $0.55 $1.00 82% 49 $26.9 $19.2Skyharbour Resources (SYH-V) $0.52 48 $24.9 $17.3 7.0 $2.48Purepoint Uranium (PTU-V) $0.12 189 $22.7 $15.5Forsys Metals (FSY-T) $0.13 146 $19.0 $13.8 127.0 $0.11Blue Sky (BSK-V) $0.35 47 $16.1 $11.1Fission 3.0 (FUU-V) $0.08 178 $14.2 $10.1U3O8 Corp. (UWE-T) $0.04 339 $11.9 $8.8 47.7 $0.18Cauldron Energy (CXU-AU) $0.05 329 $17.1 $9.1 30.9 $0.29Azimut Exploration (AZM-V) $0.32 45 $14.5 $8.8Zadar Ventures (ZAD-V) $0.12 97 $11.2 $8.2enCore Energy (:EU-V) $0.10 111 $11.1 $8.3 56.4 $0.15CanAlaska Uranium (CVV-V) $0.48 27 $13.0 $8.2Anfield Resources (ARY-V) $0.10 109 $10.4 $7.1 19.6 $0.36Tajiri Resources (TAJ-V) $0.13 50 $6.6 $4.9Melkior Resources (MKR-V) $0.05 141 $6.4 $4.4Marenica Energy (MEY-AU) $0.16 31 $4.9 $4.9 46.0 $0.11Benton Resources (BEX-V) $0.11 79 $8.3 $4.292 Resources (NTY-V) $0.12 54 $6.5 $4.2Pele Mountain (GEM-V) $0.03 210 $5.2 $3.8 60.2 $0.06Avrupa Minerals (AVU-V) $0.10 74 $7.0 $4.6Forum Uranium (FDC-V) $0.09 75 $6.8 $4.5 0.6 $7.11Uracan Resources (URC-V) $0.05 106 $5.3 $3.9 43.2 $0.09X-Terra Resources (XTT-V) $0.24 18 $4.3 $3.1Uravan Minerals (UVN-V) $0.10 42 $4.2 $2.6Montero Mining (MON-V) $0.04 85 $3.0 $2.7Aben Resources (ABN-V) $0.13 31 $3.8 $2.4Roughrider Exploration (REL-V) $0.08 37 $2.9 $2.1Eros Resources (ERC-V) $0.18 42 $7.3 $1.9Aldever Resources (ALD-V) $0.07 38 $2.4 $1.4Spruce Ridge (SHL-V) $0.03 73 $1.8 $1.5Tarku Resources (TKU-V) $0.05 32 $1.6 $1.1IsoEnergy Ltd. (ISO-V) $1.10 15 $16.0Elysee Development (ELC-V) $0.39 22 $8.5 ($2.7)Group Average - Explorers $0.98 0.68x
INVENTORY FUNDSUranium Participation (U-T) $4.06 $5.25 29% 121 $490.65 $360.2 15.5 $23.24 $5.42 0.75x
All data sourced from S&P Capital IQ, SNL Financial, Bloomberg
Earnings CompsConsensus Targets In-Situ Comps - EV/lb U3O8 NAV Comps Cash Flow CompsEPS (LoC) P/EPS
PROD
UCER
SDE
VELO
PERS
EXPL
ORER
S
CFPS (LoC) P/CFPS

The Weekly Dig 3/31/17
Haywood Mining [email protected] Page 23
Coal Comparables – Consensus Estimates
Large Cap USA Bloomberg Shares Market Daily Enterprise
Company (T icker) Share PriceConsensus
TargetImplied Return β
Outstanding (millions)
Capitalization (millions)
Volume (millions)
Weekly Liquidity WACC
Debt (millions)
Value (millions) 2015 2016 2017 2015 2016 2017 2015 2016 2017 2015 2016 2017
Large Cap USACONSOL ENERGY (CNX-US) US$ 16.78 US$ 22.55 34.4% 1.60 229 US$ 3,850 3.6 6.6% 9.7% US$ 2,774 US$ 6,706 3.03 3.95 5.20 5.5x 4.3x 3.2x 29.2x 18.1x 11.6x 7.1x 5.9x 5.0xFORESIGHT ENERGY (FELP-US) US$ 6.26 US$ 7.00 11.8% 1.68 66 US$ 820 0.1 0.3% 7.6% US$ 1,391 US$ 2,108 59.6x 6.7x 7.4x 7.8xCORSA COAL (CSO-V) C$ 2.00 C$ 4.25 112.5% 1.53 94 C$ 189 0.1 0.2% 13.1% C$ 40 C$ 206 2.0x 1.9x 2.5x 3.1x 2.8x 3.0xWESTMORELAND COAL (WLB-US) C$ 14.52 C$ 19.00 30.9% 1.03 19 C$ 270 0.3 11.9% 5.4% C$ 1,109 C$ 1,317 9.25 5.30 1.6x 2.7x 23.7x 4.9x 5.4x 5.4xWALTER ENERGY (WLT-US) US$ 0.07 1.11 81 US$ 6 0.2 1.3% 9.9% US$ 3,136 US$- 176CLOUD PEAK (CLD-US) US$ 4.58 US$ 5.34 16.7% 1.58 75 US$ 344 2.0 9.9% 7.4% US$ 483 US$ 743 0.74 0.84 1.04 6.2x 5.5x 4.4x 6.9x 7.0x 7.3xGroup Average - Large Cap USA Avg. -> 4.4x 4.1x 3.8x 28.6x 10.0x 7.0x 5.8x 5.7x 5.7x
Limitied PartnershipsALLIANCE RESOURCE (ARLP-US) US$ 21.65 US$ 27.67 27.8% 1.14 75 US$ 1,615 0.3 2.5% 8.2% US$ 662 US$ 2,243 8.1x 9.7x 8.8x 3.8x 4.0x 3.7xNATURAL RESOURCE (NRP-US) US$ 36.15 US$ 37.67 4.2% 1.17 12 US$ 442 0.1 1.4% 5.8% US$ 1,126 US$ 1,525 10.79 11.65 3.4x 3.1x 5.8x 5.8x 5.3x 7.3x 7.3x 7.4xGroup Average - Limited Partnerships Avg. -> 7.0x 7.7x 7.1x 5.6x 5.6x 5.6x
Large Cap Non-North AmericaNEW HOPE (NHC-AU) A$ 1.78 A$ 1.91 7.4% 0.83 831 A$ 1,479 0.2 0.1% 8.5% A$ 15 A$ 1,343 0.32 0.27 0.23 5.6x 6.6x 7.8x 10.6x 9.8x 12.0x 4.6x 4.6x 5.5xWHITEHAVEN COAL (WHC-AU) A$ 2.99 A$ 3.04 1.8% 1.78 1,026 A$ 3,068 7.1 4.1% 12.7% A$ 961 A$ 3,697 0.64 0.63 0.51 4.7x 4.8x 5.8x 7.5x 8.7x 10.7x 4.8x 5.5x 6.5xBANPU PUBLIC (BANPU-SET) ฿ 19.80 ฿ 22.08 11.5% 1.51 5,061 ฿ 100,201 56.6 4.0% 7.9% ฿ 114,111 ฿ 216,735 2.80 2.72 3.56 7.1x 7.3x 5.6x 10.8x 11.1x 9.1x 9.6x 10.3x 9.5xCHINA COAL (1898-HK) HK$ 3.92 HK$ 4.52 15.3% 1.34 4,107 HK$ 79,275 12.6 1.3% 5.6% HK$ 98,178 HK$ 171,038 0.81 0.88 1.11 4.3x 3.9x 3.1x 12.8x 13.3x 13.0x 10.0x 10.4x 10.2xCHINA SHENHUA (1088-HK) HK$ 18.04 HK$ 19.00 5.3% 1.28 3,399 HK$ 422,019 23.4 3.7% 7.7% HK$ 105,981 HK$ 502,892 3.04 3.05 3.25 5.3x 5.2x 4.9x 10.4x 10.8x 11.1x 6.2x 6.4x 6.5xCOAL OF (CZA-AU) A$ 0.04 A$ 0.08 90.3% 2,216 A$ 95 0.0 0.0% 9.8% A$ 0 A$ 66NINE ENTERTAINMENT (NEC-AU) A$ 1.26 A$ 1.12 (10.6)% 1.01 871 A$ 1,094 3.8 3.3% 8.4% A$ 220 A$ 1,271 0.10 0.17 0.14 12.6x 7.6x 9.2x 11.3x 11.2x 11.8x 7.2x 7.2x 8.2xYANZHOU COAL (1171-HK) HK$ 6.04 HK$ 6.34 5.0% 1.54 1,952 HK$ 49,914 13.0 1.8% 6.7% HK$ 69,480 HK$ 92,042 1.78 1.65 3.0x 3.2x 8.0x 9.7x 8.2x 9.8xGroup Average - Large Cap Non-North-America Avg. -> 6.1x 5.5x 6.1x 10.2x 10.7x 11.3x 6.3x 7.8x 7.7x
Developer/ExplorersEAST ENERGY (EER-AU) A$ 0.01 356 A$ 2.5 0.0 0.0% 4.4% A$ 23 A$ 26FORTUNE MINERALS (FT -T) C$ 0.20 0.90 297 C$ 59.3 1.9 1.5% 9.2% C$ 4 C$ 63JAMESON RESOURCES (JAL-AU) A$ 0.08 223 A$ 17.9 0.1 0.1% 9.8% A$ 0 A$ 15Group Average - Developers / Explorers Avg. ->
Sundry CompaniesADARO ENERGY (ADRO-JKSE) ¥ 1,750 ¥ 1,972 12.7% 1.71 31,986 ¥ 55,975,434 26.4 0.5% 12.3% ¥ 1,434 ¥ 5,199 0.02 0.02 0.02 6.6x 6.6x 7.7x 10.9x 10.9x 10.1x 5.2x 5.0x 4.9xNLC INDIA (NEYVELILIG-NSEI) रू 107.35 रू 110.00 2.5% 0.83 1,678 रू 180,102 0.5 0.1% 8.7% रू 83,844 रू 234,167SOUTHGOBI RESOURCES (SGQ-T) C$ 0.38 0.92 273 C$ 104 0.0 0.1% 5.6% C$ 109 C$ 194TAMBANG BATUBARA (PTBA-JKSE) ¥ 13,200 ¥ 14,891 12.8% 1.39 2,304 ¥ 30,414,540 2.8 1.2% 12.5% ¥ 2,368,524 ¥ 29,239,445 1356.51 1385.70 2433.51 9.7x 9.5x 5.4x 10.7x 10.3x 7.3x 7.6x 7.4x 4.2xGroup Average - Sundry Companies Avg. -> 5.6x 5.5x 6.6x 7.7x 7.4x 8.7x 7.6x 7.7x 4.6xAll data sourced from Bloomberg
EV/EBITDAP/EPSCFPS (LoC) P/CFPS

The Weekly Dig 3/31/17
Haywood Mining [email protected] Page 24
Senior/Intermediate Gold Producers – EV/oz Comparables
Symbol Market Working Enterprise serves & Resources Reserves Reserves (M&I and Inferred) GlobalAu Au AuEq AuEq % Au Au Au AuEq AuEq % Au EV/oz Au Au AuEq AuEq % Au % Au EV/oz EV/oz
Agnico Eagle Mines Limited NYSE:AEM US $9,704 US $807 US $9,982 53.4 1.95 59.6 2.18 90% 19.1 2.37 20.5 2.55 93% US $523 34.3 1.78 39.1 2.03 88% 54% US $187 US $168AngloGold Ashanti Limited JSE:ANG US $4,358 US $406 US $6,096 208.7 1.23 235.7 1.39 89% 51.9 0.80 55.4 0.86 94% US $118 157.0 1.55 180.5 1.78 87% 32% US $29 US $26B2Gold Corp. TSX:BTO US $2,767 US $101 US $3,139 23.2 0.75 28.9 0.94 80% 7.5 1.38 7.5 1.38 100% US $421 15.7 0.62 21.5 0.85 73% 47% US $135 US $108Barrick Gold Corporation TSX:ABX US $22,097 US $3,055 US $26,868 199.0 0.80 317.5 1.28 63% 102.3 1.13 140.7 1.55 73% US $263 96.7 0.61 176.8 1.12 55% 33% US $135 US $85Compañía de Minas Buenaventura S.A.A. NYSE:BVN US $3,058 US $57 US $3,648 20.2 0.22 88.2 0.95 23% 3.6 0.11 24.5 0.75 15% US $1,015 16.4 0.28 63.5 1.07 26% 35% US $181 US $41Detour Gold Corporation TSX:DGC US $1,996 US ($159) US $2,155 21.4 0.98 21.4 0.98 100% 16.4 0.99 16.4 0.99 100% US $131 5.0 0.96 5.0 0.96 100% 22% US $101 US $101Eldorado Gold Corporation TSX:ELD US $2,442 US $1,001 US $2,033 37.4 0.76 53.6 1.09 70% 20.6 1.10 28.6 1.53 72% US $99 16.9 0.56 25.0 0.82 68% 59% US $54 US $38Gold Fields Limited JSE:GFI US $2,860 US $193 US $4,233 111.3 2.09 130.5 2.45 85% 48.0 2.78 49.2 2.85 98% US $88 63.3 1.76 81.3 2.26 78% 44% US $38 US $32Goldcorp Inc. TSX:G US $12,452 US $791 US $14,423 113.6 0.77 189.8 1.28 60% 42.3 0.71 84.5 1.42 50% US $341 71.2 0.80 105.3 1.19 68% 35% US $127 US $76Harmony Gold Mining Company Limited JSE:HAR US $1,076 US $224 US $962 81.2 1.04 111.0 1.42 73% 23.7 0.66 35.4 0.99 67% US $41 57.5 1.35 74.7 1.76 77% 36% US $12 US $9IAMGOLD Corporation TSX:IMG US $1,855 US $817 US $1,523 33.4 1.22 33.4 1.22 100% 8.8 1.39 8.8 1.39 100% US $173 24.6 1.17 24.6 1.17 100% 33% US $46 US $46Kinross Gold Corporation TSX:K US $4,388 US $1,443 US $4,678 67.1 0.70 73.7 0.77 91% 33.2 0.71 36.9 0.79 90% US $141 33.9 0.70 36.8 0.76 92% 15% US $70 US $63New Gold Inc. TSX:NGD US $1,714 US $234 US $2,370 23.5 0.76 31.0 1.00 76% 15.0 0.78 18.6 0.97 80% US $158 8.5 0.72 12.4 1.05 69% 22% US $101 US $76Newmont Mining Corporation NYSE:NEM US $17,518 US $2,927 US $18,646 122.6 0.72 168.3 0.99 73% 71.3 0.82 79.4 0.91 90% US $262 51.3 0.62 88.9 1.08 58% 34% US $152 US $111Randgold Resources Limited LSE:RRS US $8,197 US $678 US $7,522 27.9 3.31 27.9 3.31 100% 14.8 3.69 14.8 3.69 100% US $510 13.1 2.96 13.1 2.96 100% 51% US $270 US $270Tahoe Resources Inc. TSX:THO US $2,498 US $209 US $2,340 18.9 0.66 31.9 1.11 59% 4.5 0.48 11.8 1.26 38% US $524 14.4 0.74 20.1 1.04 72% 56% US $124 US $73Yamana Gold Inc. TSX:YRI US $2,611 US $77 US $4,148 64.5 0.55 120.7 1.03 53% 22.3 0.41 55.1 1.02 40% US $186 42.2 0.67 65.6 1.04 64% 39% US $64 US $34Group Average - Total # Companies: 17 US $294 US $107 US $80Equivalency assumptions (US$ / 03-17-17): $1,248/oz Au, $18.21/oz Ag, $952/oz Pt, $798/oz Pd, $2.67/lb Cu, $1.26/lb Zn, $1.06/lb Pb, $4.69/lb Ni, $8.55/lb Mo, $23.93/lb Co, $8,625/t Sb, $24.20/lb U3O8, $0.20/lb Sn, $93.00/t HCC, $89.47/t 62% FeSource: SNL Financial retrieved on March 31, 2017
Reserves
Alamos Gold Inc. TSX:AGI US $2,395 US $355 US $2,341 21.7 1.20 22.4 1.23 97% 5.9 1.67 5.9 1.67 100% US $398 15.9 1.08 16.5 1.13 96% 30% US $108 US $105Argonaut Gold Inc. TSX:AR US $309 US $95 US $214 9.3 0.67 9.9 0.71 94% 3.3 0.82 3.3 0.82 100% US $64 6.0 0.61 6.6 0.67 91% 23% US $23 US $22Centamin Plc LSE:CEY US $2,487 US $509 US $1,978 10.1 1.18 10.1 1.18 100% 4.4 1.08 4.4 1.08 100% US $450 5.7 1.27 5.7 1.27 100% 31% US $196 US $196China Gold International Resources Corp. Ltd. TSX:CGG US $794 US ($339) US $1,692 12.2 0.18 65.2 0.94 19% 5.4 0.29 24.2 1.32 22% US $316 6.9 0.13 40.9 0.80 17% 51% US $138 US $26Evolution Mining Limited ASX:EVN US $2,699 US $67 US $3,044 16.2 1.33 16.8 1.39 96% 7.6 1.29 7.7 1.31 98% US $401 8.2 1.38 8.7 1.47 94% 46% US $188 US $181G-Resources Group Limited SEHK:1051 US $512 US $976 US ($464) - - - - - - - - - - - - - - - - - - - Northern Star Resources Limited ASX:NST US $1,862 US $208 US $1,661 8.5 3.26 21.2 8.16 40% 1.7 5.24 1.7 5.24 100% US $951 6.7 3.02 19.5 8.70 35% 58% US $196 US $78OceanaGold Corporation TSX:OGC US $1,808 US ($52) US $2,112 15.8 1.53 17.2 1.66 92% 5.3 1.47 6.2 1.71 86% US $396 10.5 1.56 11.0 1.63 95% 32% US $133 US $123Primero Mining Corp. TSX:P US $106 US ($3) US $213 6.8 0.84 10.9 1.35 62% 1.8 1.38 2.9 2.29 60% US $121 5.0 0.73 8.0 1.17 63% 27% US $31 US $20Regis Resources Limited ASX:RRL US $1,263 US $83 US $1,182 8.6 0.96 8.6 0.96 100% 2.1 1.09 2.1 1.09 100% US $556 6.4 0.93 6.4 0.93 100% 25% US $138 US $138Resolute Mining Limited ASX:RSG US $732 US $280 US $468 11.5 1.40 11.5 1.40 100% 5.2 1.50 5.2 1.50 100% US $91 5.9 1.26 5.9 1.26 100% 42% US $41 US $41SEMAFO Inc. TSX:SMF US $978 US $287 US $747 7.6 2.80 7.6 2.80 100% 3.0 3.29 3.0 3.29 100% US $251 4.6 2.56 4.6 2.56 100% 42% US $98 US $98Group Average - Total # Companies: 11 US $363 US $117 US $93Equivalency assumptions (US$ / 03-17-17): $1,248/oz Au, $18.21/oz Ag, $952/oz Pt, $798/oz Pd, $2.67/lb Cu, $1.26/lb Zn, $1.06/lb Pb, $4.69/lb Ni, $8.55/lb Mo, $23.93/lb Co, $8,625/t Sb, $24.20/lb U3O8, $0.20/lb Sn, $93.00/t HCC, $89.47/t 62% FeSource: SNL Financial retrieved on March 31, 2017
% Au Au(Moz)
Au(g/t)
AuEq(Moz)
AuEq(g/t)
EV/ozAu
EV/ozAuEq
Au(Moz)
Au(g/t)
AuEq(Moz)
AuEq(g/t)
% Au
Global Reserves & Resources Reserves Resources (M&I and Inferred)Au
(Moz)Au(g/t)
AuEq(Moz)
AuEq(g/t)
% Au
GlobalEV/oz
Au% Au
Inferred
EnterpriseValue
(millions)Company Symbol
MarketCapitalization
(millions)
WorkingCapital
(millions)

The Weekly Dig 3/31/17
Haywood Mining [email protected] Page 25
Junior Gold Producers – EV/oz Comparables
Reserves
Alacer Gold Corp. TSX:ASR US $591 US $269 US $322 7.7 0.40 17.7 0.92 44% 3.9 2.04 5.4 2.82 72% US $82 3.8 0.22 12.3 0.71 31% 53% US $42 US $18Asanko Gold Inc. TSX:AKG US $532 US $72 US $615 9.5 1.68 9.5 1.68 100% 4.7 1.68 4.7 1.68 100% US $130 4.8 1.68 4.8 1.68 100% 48% US $65 US $65Avesoro Resources Inc. TSX:ASO US $160 US ($1) US $246 2.5 2.48 2.5 2.48 100% 0.8 3.38 0.8 3.38 100% US $296 1.7 2.19 1.7 2.19 100% 68% US $97 US $97Beadell Resources Limited ASX:BDR US $270 US $9 US $266 3.5 - 18.5 - 19% 1.5 - 1.5 - 100% US $180 2.1 - 17.1 - 12% 68% US $75 US $14Avnel Gold Mining Limited TSX:AVK US $83 US $4 US $80 2.7 4.11 2.7 4.11 100% 1.6 2.81 1.6 2.81 100% US $51 1.2 11.05 1.2 11.05 100% 21% US $29 US $29Azumah Resources Limited ASX:AZM US $13 US $1 US $12 1.9 1.55 1.9 1.55 100% 0.6 2.14 0.6 2.14 100% US $22 1.3 1.38 1.3 1.38 100% 47% US $7 US $7Banro Corporation TSX:BAA US $38 US ($242) US $333 12.1 1.60 12.1 1.60 100% 3.2 2.03 3.2 2.03 100% US $105 8.9 1.49 8.9 1.49 100% 57% US $28 US $28Dundee Precious Metals Inc. TSX:DPM US $378 US $33 US $384 11.1 0.43 20.2 0.78 55% 3.0 3.36 4.0 4.52 74% US $128 8.1 0.32 16.2 0.64 50% 51% US $35 US $19Endeavour Mining Corporation TSX:EDV US $1,816 US $134 US $1,833 15.2 1.59 15.2 1.59 100% 5.5 1.71 5.5 1.71 100% US $332 9.6 1.54 9.6 1.54 100% 49% US $121 US $121Golden Star Resources Ltd. TSX:GSC US $316 US ($60) US $467 8.6 2.96 8.6 2.96 100% 1.9 2.77 1.9 2.77 100% US $248 6.7 3.02 6.7 3.02 100% 46% US $55 US $55Goldgroup Mining Inc. TSX:GGA US $16 US $3 US $14 0.5 0.76 0.9 1.47 52% - - - - - - 0.5 0.76 0.9 1.47 52% 41% US $29 US $15Guyana Goldfields Inc. TSX:GUY US $923 US $111 US $871 8.9 2.95 8.9 2.95 100% 3.0 2.94 3.0 2.94 100% US $286 5.9 2.95 5.9 2.95 100% 36% US $98 US $98Kirkland Lake Gold LTD. TSX:KL US $1,495 US $92 US $1,430 10.6 5.23 10.6 5.23 100% 2.3 9.51 2.3 9.51 100% US $623 8.3 4.65 8.3 4.65 100% 41% US $135 US $135Klondex Mines Ltd. TSX:KDX US $691 US $33 US $680 3.5 1.71 3.7 1.79 96% 0.5 8.51 - - - US $1,238 3.0 1.49 - - - 55% US $193 US $185Mandalay Resources Corporation TSX:MND US $200 US $44 US $158 1.8 0.86 4.3 2.09 41% 0.7 2.30 1.1 3.43 67% US $224 1.0 0.61 3.2 1.86 33% 21% US $90 US $37Metanor Resources Inc. TSXV:MTO US $40 US ($4) US $44 1.7 1.53 1.7 1.53 100% 0.2 7.37 0.2 7.37 100% US $219 1.5 1.38 1.5 1.38 100% 79% US $26 US $26Orosur Mining Inc. TSX:OMI US $19 US $7 US $12 1.6 0.68 2.7 1.11 61% 0.1 1.43 0.1 1.43 100% US $95 1.5 0.65 2.6 1.10 59% 5% US $7 US $5Orvana Minerals Corp. TSX:ORV US $23 US $5 US $25 3.5 2.50 4.3 3.03 83% 0.3 2.82 0.5 3.82 74% US $74 3.2 2.47 3.8 2.96 84% 48% US $7 US $6Perseus Mining Limited ASX:PRU US $245 US $61 US $184 17.2 1.28 17.2 1.28 100% 6.5 1.50 6.5 1.50 100% US $28 10.7 1.17 10.7 1.17 100% 43% US $11 US $11Richmont Mines Inc. TSX:RIC US $447 US $46 US $409 4.7 3.59 4.7 3.60 100% 0.6 8.05 0.6 8.05 100% US $654 4.1 3.30 4.1 3.32 100% 59% US $87 US $87Roxgold Inc. TSX:ROXG US $385 US $26 US $416 1.2 13.55 1.2 13.55 100% 0.7 11.83 0.7 11.83 100% US $609 0.5 16.96 0.5 16.96 100% 91% US $354 US $354Rubicon Minerals Corporation TSX:RMX US $80 US $17 US $71 0.4 6.39 0.4 6.39 100% - - - - - - 0.4 6.39 0.4 6.39 100% 74% US $173 US $173Shanta Gold Ltd. AIM:SHG US $66 US $34 US $64 3.1 3.19 3.1 3.19 100% 0.8 4.95 0.8 4.95 100% US $83 2.3 2.95 2.3 2.95 100% 57% US $20 US $20Teranga Gold Corporation TSX:TGZ US $342 US $71 US $285 8.5 1.52 8.5 1.52 100% 3.2 1.40 3.2 1.40 100% US $89 5.3 1.61 5.3 1.61 100% 28% US $34 US $34T immins Gold Corp. TSX:TMM US $133 US $38 US $96 3.2 0.94 3.3 0.97 97% 0.6 0.50 0.6 0.50 100% US $151 2.6 1.20 2.7 1.25 96% 4% US $30 US $29Torex Gold Resources Inc TSX:TXG US $1,569 US $125 US $1,850 8.5 2.48 11.7 3.40 73% 3.6 2.62 3.7 2.68 98% US $510 4.9 2.39 8.0 3.89 61% 88% US $217 US $158Wesdome Gold Mines Ltd. TSX:WDO US $394 US $12 US $387 6.4 1.43 6.4 1.43 100% 0.4 4.63 0.4 4.63 100% US $898 6.0 1.36 6.0 1.36 100% 59% US $60 US $60Group Average - Total # Companies: 27 US $294 US $79 US $70Equivalency assumptions (US$ / 03-17-17): $1,248/oz Au, $18.21/oz Ag, $952/oz Pt, $798/oz Pd, $2.67/lb Cu, $1.26/lb Zn, $1.06/lb Pb, $4.69/lb Ni, $8.55/lb Mo, $23.93/lb Co, $8,625/t Sb, $24.20/lb U3O8, $0.20/lb Sn, $93.00/t HCC, $89.47/t 62% FeSource: SNL Financial retrieved on March 31, 2017
% Au Au(Moz)
Au(g/t)
AuEq(Moz)
AuEq(g/t)
EV/ozAu
EV/ozAuEq
Au(Moz)
Au(g/t)
AuEq(Moz)
AuEq(g/t)
% Au % AuInferred
Global Reserves & Resources Reserves Resources (M&I and Inferred)Au
(Moz)Au(g/t)
AuEq(Moz)
AuEq(g/t)
% Au
GlobalEV/oz
Au
EnterpriseValue
(millions)Company Symbol
MarketCapitalization
(millions)
WorkingCapital
(millions)

The Weekly Dig 3/31/17
Haywood Mining [email protected] Page 26
Gold Development-Stage Companies (Engineering Study Complete) – EV/oz Comparables
Company Reserves
African Gold Group, Inc. TSXV:AGG US $16 US ($1) US $17 2.0 1.01 2.0 1.01 100% 0.5 1.25 0.5 1.25 100% 1.5 0.96 1.5 0.96 100% 59% US $9 US $9Almaden Minerals Ltd. TSX:AMM US $105 US $7 US $98 2.0 0.54 3.7 0.99 54% - - - - - 2.0 0.54 3.7 0.99 54% 18% US $49 US $27Amarillo Gold Corporation TSXV:AGC US $23 US ($1) US $32 2.0 1.30 2.0 1.30 100% - - - - - 2.0 1.30 - - - 29% US $16 US $16ATAC Resources Ltd. TSXV:ATC US $41 US $12 US $29 0.7 2.35 0.7 2.39 98% - - - - - 0.7 2.35 0.7 2.39 98% 28% US $42 US $42Barkerville Gold Mines Ltd. TSXV:BGM US $147 US $18 US $129 5.0 2.43 5.1 2.45 99% 0.0 4.82 - - - 5.0 2.42 - - - 41% US $26 US $25Chaarat Gold Holdings Limited AIM:CGH US $86 US $2 US $84 7.1 2.53 7.2 2.57 98% - - - - - 7.1 2.53 7.2 2.57 98% 15% US $12 US $12Chalice Gold Mines Limited ASX:CHN US $35 US $44 US ($9) 0.2 4.09 0.2 4.09 100% - - - - - 0.2 4.09 0.2 4.09 100% 83% - - Chesapeake Gold Corp. TSXV:CKG US $119 US $17 US $102 19.8 0.49 32.1 0.80 62% 18.3 0.52 29.6 0.84 62% 1.5 0.33 2.4 0.52 64% 53% US $5 US $3Continental Gold Inc. TSX:CNL US $426 US $14 US $412 9.1 9.91 9.7 10.61 93% 3.7 8.41 3.9 8.77 96% 5.4 11.31 5.9 12.32 92% 86% US $45 US $42Dacian Gold Limited ASX:DCN US $305 US $18 US $286 3.3 - 3.3 - 100% 1.2 - - - - 2.1 - - - - 53% US $86 US $86Dalradian Resources Inc. TSX:DNA US $257 US $24 US $234 4.4 10.74 4.4 10.74 100% - - - - - 4.4 10.74 4.4 10.74 100% 52% US $53 US $53Exeter Resource Corporation TSX:XRC US $153 US $13 US $140 25.3 0.49 39.5 0.77 64% 0.0 3.31 0.0 3.31 100% 25.3 0.49 39.5 0.77 64% 7% US $6 US $4Falco Resources Ltd. TSXV:FPC US $107 US $13 US $101 5.6 1.54 9.6 2.63 58% - - - - - 5.6 1.54 9.6 2.63 58% 19% US $18 US $11First Mining Finance Corp. TSXV:FF US $334 US $30 US $307 14.0 1.64 14.4 1.69 97% 0.2 1.50 - - - 13.8 1.64 - - - 41% US $22 US $21Gabriel Resources Ltd. TSX:GBU US $115 US $52 US $105 16.4 - 17.5 - 94% 8.1 - - - - 8.3 - - - - 27% US $6 US $6Gold Road Resources Limited ASX:GOR US $366 US $269 US $97 3.3 1.11 3.4 1.15 97% 1.8 1.20 1.8 1.20 100% 1.5 1.02 1.7 1.10 93% 62% US $29 US $28Golden Queen Mining Co. Ltd. TSX:GQM US $75 US $8 US $103 0.9 0.53 1.1 0.66 80% 0.5 0.66 0.6 0.82 80% 0.4 0.43 0.5 0.54 80% 30% US $115 US $92Goldquest Mining Corp. TSXV:GQC US $99 US $6 US $93 2.2 2.60 3.3 3.93 66% 0.8 3.72 1.1 5.07 73% 1.4 2.19 2.0 3.27 67% 16% US $42 US $28Hummingbird Resources PLC AIM:HUM US $111 US $37 US $104 6.4 1.64 6.4 1.64 100% 0.6 3.14 0.6 3.14 100% US $173 5.8 1.57 5.8 1.57 100% 53% US $16 US $16Integra Gold Corp. TSXV:ICG US $326 US $14 US $313 5.4 6.38 5.4 6.39 100% - - - - - - 5.4 6.38 5.4 6.39 100% 60% US $58 US $58International Tower Hill Mines Ltd. TSX:ITH US $84 US $8 US $76 12.6 0.68 12.6 0.68 100% 9.0 0.71 9.0 0.71 100% US $9 3.6 0.60 3.6 0.60 100% 31% US $6 US $6INV Metals Inc. TSX:INV US $63 US $6 US $56 3.1 - 3.9 - 79% 1.9 - - - - US $30 1.2 - - - - 44% US $18 US $14K92 Mining Inc. TSXV:KNT US $74 US $14 US $66 1.4 8.09 2.0 11.21 72% - - - - - - 1.4 8.09 - - - 84% US $46 US $33KEFI Minerals Plc AIM:KEFI US $20 US ($2) US $22 1.9 1.96 1.9 1.96 100% 1.0 2.12 1.0 2.12 100% US $22 0.9 1.82 0.9 1.82 100% 20% US $11 US $11Lundin Gold Inc. TSX:LUG US $543 US $1 US $542 9.5 - 9.7 - 98% 4.8 - - - - US $112 4.7 - - - - 46% US $57 US $56Lupaka Gold Corp. TSXV:LPK US $12 US ($1) US $14 2.8 1.17 3.2 1.35 87% - - - - - - 2.8 1.17 3.2 1.35 87% 42% US $5 US $4Lydian International Limited TSX:LYD US $182 US $141 US $112 5.0 0.69 5.4 0.73 94% 2.4 0.78 2.6 0.83 94% US $46 2.6 0.62 2.8 0.66 94% 77% US $22 US $21Metals Exploration Plc AIM:MTL US $88 US ($44) US $174 1.7 1.62 2.0 1.91 85% 0.9 1.86 1.0 2.12 88% US $194 0.8 1.43 1.0 1.74 82% 82% US $101 US $85Midas Gold Corp. TSX:MAX US $109 US $34 US $94 6.5 1.57 7.3 1.74 90% 4.6 1.60 5.1 1.79 90% US $21 2.0 1.49 2.1 1.64 91% 55% US $14 US $13Moneta Porcupine Mines Inc. TSX:ME US $33 US $5 US $28 4.3 1.17 4.3 1.17 100% - - - - - - 4.3 1.17 4.3 1.17 100% 75% US $7 US $7NewCastle Gold Ltd. TSX:NCA US $99 US $9 US $91 5.4 0.24 14.1 0.62 38% - - - - - - 5.4 0.24 14.1 0.62 38% 17% US $17 US $6NovaGold Resources Inc. TSX:NG US $1,559 US $104 US $1,540 28.7 - 44.1 - 65% 19.6 - - - - US $78 9.1 - - - - 58% US $54 US $35Orca Gold Inc. TSXV:ORG US $32 US $6 US $26 1.6 1.88 1.9 2.26 83% - - - - - - 1.6 1.88 1.9 2.26 83% 24% US $17 US $14Orezone Gold Corporation TSXV:ORE US $64 US $24 US $39 4.5 0.77 4.5 0.77 100% - - - - - - 4.5 0.77 4.5 0.77 100% 15% US $9 US $9Pershimco Resources Inc. TSXV:PRO US $55 US ($12) US $68 0.8 0.69 1.0 0.87 80% 0.5 0.77 0.5 0.82 93% US $139 0.1 7.46 0.1 7.46 100% 12% US $84 US $67Pilot Gold Inc. TSX:PLG US $64 US $12 US $52 2.0 0.36 4.3 0.77 47% - - - - - - 2.0 0.36 4.3 0.77 47% 35% US $26 US $12Premier Gold Mines Limited TSX:PG US $485 US $126 US $399 7.2 1.74 7.3 1.77 98% 2.9 1.20 2.9 1.22 98% US $138 4.3 2.49 4.4 2.55 98% 54% US $56 US $55Pretium Resources Inc. TSX:PVG US $1,924 US $46 US $2,378 49.0 0.68 63.3 0.88 77% 7.5 14.14 7.9 14.98 94% US $317 41.5 0.58 55.4 0.78 75% 31% US $49 US $38Red Eagle Mining Corporation TSX:R US $153 US $2 US $211 0.6 3.35 0.6 3.35 100% 0.4 5.19 0.4 5.19 100% US $520 0.2 1.98 0.2 1.98 100% 64% US $344 US $344RTG Mining Inc. TSX:RTG US $20 US $12 US $8 0.6 1.66 1.3 3.70 45% 0.3 2.04 0.8 5.03 41% US $25 0.3 1.35 0.5 2.61 52% 84% US $14 US $6Sabina Gold & Silver Corp. TSX:SBB US $258 US $30 US $228 7.2 6.21 7.2 6.21 100% 2.5 6.30 2.5 6.30 100% US $91 4.7 6.16 4.7 6.16 100% 40% US $32 US $32Sandspring Resources Ltd. TSXV:SSP US $45 US $5 US $41 10.0 0.84 11.3 0.95 88% 4.1 1.00 4.6 1.12 90% US $10 5.9 0.75 6.6 0.85 89% 53% US $4 US $4Seabridge Gold Inc. TSX:SEA US $598 US $6 US $592 109.8 0.48 220.1 0.96 50% 45.3 0.61 71.1 0.97 64% US $13 64.6 0.41 149.0 0.95 43% 76% US $5 US $3Sihayo Gold Limited ASX:SIH US $17 US ($1) US $18 1.1 2.60 1.1 2.60 100% 0.4 2.41 0.4 2.41 100% US $42 0.7 2.73 0.7 2.73 100% 43% US $16 US $16Sulliden Mining Capital Inc. TSX:SMC US $8 US $12 US ($4) 1.4 - 1.6 - 88% - - - - - - 1.4 - - - - 26% - - Terraco Gold Corp. TSXV:TEN US $15 US $2 US $20 1.0 0.70 1.0 0.70 100% - - - - - - 1.0 0.70 1.0 0.70 100% 8% US $20 US $20Vast Resources plc AIM:VAST US $30 US ($0) US $34 2.4 1.53 2.9 1.89 81% 0.6 1.83 1.0 3.25 56% US $58 1.8 1.45 1.9 1.54 94% 75% US $14 US $11Victoria Gold Corp. TSXV:VIT US $223 US $41 US $182 4.5 0.65 4.6 0.66 99% 2.7 0.67 2.7 0.67 100% US $68 1.9 0.62 1.9 0.63 98% 30% US $40 US $40Group Average - Total # Companies: 48 US $105 US $38 US $33Group Average - 0 - 20 million ounces # Companies: 44 US $37 US $34Group Average - 20 - 50 million ounces # Companies: 3 US $36 US $14Group Average - +50 million ounces # Companies: 1 US $5 US $20Equivalency assumptions (US$ / 03-17-17): $1,248/oz Au, $18.21/oz Ag, $952/oz Pt, $798/oz Pd, $2.67/lb Cu, $1.26/lb Zn, $1.06/lb Pb, $4.69/lb Ni, $8.55/lb Mo, $23.93/lb Co, $8,625/t Sb, $24.20/lb U3O8, $0.20/lb Sn, $93.00/t HCC, $89.47/t 62% FeSource: SNL Financial retrieved on March 31, 2017
ReservesAu
(Moz)Au
(g/t)
GlobalEV/oz
AuEV/ozAuEq
Resources (M&I and Inferred)Au
(Moz)Au
(g/t)AuEq(Moz) % AuAuEq
(Moz)AuEq(g/t)
% AuInferre% AuAuEq
(g/t)EV/oz
AuSymbol
MarketCapitalization
(millions)
WorkingCapital
(millions)
EnterpriseValue
(millions)
Global Reserves & ResourcesAu
(Moz)Au
(g/t)AuEq(Moz)
AuEq(g/t) % Au

The Weekly Dig 3/31/17
Haywood Mining [email protected] Page 27
Gold Exploration-Stage Companies (Resource Only) – EV/oz Comparables
Alexandria Minerals Corporation TSXV:AZX US $21 US $5 US $16 1.6 1.82 2.1 2.42 75% - - - - - 1.6 1.82 2.1 2.42 75% 41% US $10 US $8Atacama Pacific Gold Corporation TSXV:ATM US $30 US $3 US $27 5.9 0.37 5.9 0.37 100% 3.7 0.40 3.7 0.40 100% 2.1 0.33 2.1 0.33 100% 29% US $5 US $5Auryn Resources Inc. TSX:AUG US $180 US $2 US $178 2.7 4.85 3.0 5.49 88% - - - - - 2.7 4.85 - - - 70% US $66 US $59Balmoral Resources Ltd TSX:BAR US $73 US $8 US $65 0.6 0.77 1.1 1.46 53% - - - - - 0.6 0.77 1.1 1.46 53% 68% US $110 US $58Bellhaven Copper & Gold Inc. TSXV:BHV US $7 US ($0) US $7 1.0 - 1.5 - 65% - - - - - 1.0 - - - - 27% US $8 US $5Calibre Mining Corp. TSXV:CXB US $53 US $3 US $50 1.1 2.34 1.4 2.83 83% - - - - - 1.1 2.34 1.4 2.83 83% 97% US $44 US $37Cardinal Resources Limited ASX:CDV US $124 US $13 US $111 - - - - - - - - - - - - - - - - - - Columbus Gold Corporation TSX:CGT US $107 US ($4) US $110 2.9 0.86 3.6 1.05 82% - - - - - 2.9 0.86 3.6 1.05 82% 40% US $38 US $31Condor Gold PLC AIM:CNR US $50 US $4 US $46 3.7 3.08 4.1 3.37 91% 0.7 3.04 0.7 3.12 98% 3.1 3.09 3.4 3.43 90% 65% US $12 US $11Coral Gold Resources Ltd. TSXV:CLH US $12 US $0 US $12 2.7 0.49 2.7 0.49 100% - - - - - 2.7 0.49 - - - 100% US $4 US $4Corvus Gold Inc. TSX:KOR US $59 US $4 US $55 1.8 0.26 1.9 0.28 94% - - - - - 1.8 0.26 1.9 0.28 94% 64% US $31 US $30Eastmain Resources Inc. TSX:ER US $63 US $6 US $57 1.8 4.37 1.8 4.37 100% - - - - - 1.8 4.37 1.8 4.37 100% 34% US $31 US $31Eco Oro Minerals Corp TSX:EOM US $52 US $11 US $42 3.5 4.38 3.7 4.64 95% - - - - - 3.5 4.38 3.7 4.64 95% 37% US $12 US $11Eurasian Minerals Inc. TSXV:EMX US $70 US $5 US $66 - - - - - - - - - - - - - - - - - - Falco Resources Ltd. TSXV:FPC US $107 US $13 US $101 5.6 1.54 9.6 2.63 58% - - - - - 5.6 1.54 9.6 2.63 58% 19% US $18 US $11GobiMin Inc. TSXV:GMN US $20 US $34 US ($12) 2.9 1.49 2.9 1.50 99% - - - - - 2.9 1.49 2.9 1.50 99% 63% - - Granada Gold Mine Inc. TSXV:GGM US $19 US ($2) US $22 0.7 3.07 0.7 3.38 91% 0.1 4.24 0.1 4.24 100% 0.6 2.96 0.6 3.30 90% 6% US $34 US $30Gold Standard Ventures Corp TSXV:GSV US $481 US $18 US $463 2.1 0.56 2.3 0.61 92% - - - - - 2.1 0.56 2.3 0.61 92% 70% US $222 US $204Harte Gold Corp. TSX:HRT US $177 US $0 US $179 0.5 9.47 0.5 9.47 100% - - - - - 0.5 9.47 0.5 9.47 100% 33% US $376 US $376IDM Mining Ltd. TSXV:IDM US $42 US $5 US $37 0.5 7.80 0.6 8.12 96% - - - - - 0.5 7.80 0.6 8.12 96% 20% US $68 US $65Kasbah Resources Limited ASX:KAS US $12 US $1 US $12 0.2 0.55 0.3 0.63 87% - - 0.0 0.09 - 0.2 0.90 0.2 0.97 92% - US $51 US $45Lexam VG Gold Inc. TSX:LEX US $38 US $0 US $38 2.4 2.74 2.4 2.74 100% - - - - - 2.4 2.74 2.4 2.74 100% 39% US $16 US $16Lincoln Mining Corporation TSXV:LMG US $1 US ($3) US $7 0.4 2.29 0.4 2.29 100% - - - - - 0.4 2.29 - - - 82% US $17 US $17Lion One Metals Limited TSXV:LIO US $57 US $25 US $32 0.7 0.09 17.9 2.30 4% - - - - - 0.7 0.09 17.9 2.30 4% 60% US $44 US $2Marathon Gold Corporation TSX:MOZ US $89 US $2 US $87 1.3 2.37 1.3 2.37 100% - - - - - 1.3 2.37 1.3 2.37 100% 15% US $66 US $66Orex Minerals Inc. TSXV:REX US $17 US $4 US $12 0.1 0.28 0.4 1.64 17% - - - - - 0.1 0.28 0.4 1.64 17% 47% US $193 US $33Puma Exploration Inc. TSXV:PUM US $12 US ($0) US $12 0.4 0.52 3.2 4.41 12% - - - - - 0.4 0.52 3.1 4.36 12% 2% US $33 US $4Pure Gold Mining Inc. TSXV:PGM US $86 US $9 US $77 1.2 9.47 1.2 9.47 100% - - - - - 1.2 9.47 1.2 9.47 100% 24% US $63 US $63RNI NL ASX:RNI US $15 US $2 US $14 - - 0.2 2.23 - - - - - - - - 0.2 2.23 - - - US $56Rye Patch Gold Corp. TSXV:RPM US $99 US $13 US $87 4.4 0.42 5.0 0.48 87% - - - - - 4.4 0.42 5.0 0.48 87% 29% US $20 US $17Sarama Resources Ltd TSXV:SWA US $20 US ($2) US $22 0.7 1.68 0.7 1.68 100% - - - - - 0.7 1.68 0.7 1.68 100% 100% US $30 US $30Spanish Mountain Gold Ltd TSXV:SPA US $29 US $2 US $27 7.0 0.40 7.2 0.41 98% - - - - - 7.0 0.40 7.2 0.41 98% 50% US $4 US $4Teras Resources Inc. TSXV:TRA US $18 US $0 US $18 1.1 0.48 1.3 0.56 86% - - - - - 1.1 0.48 1.3 0.56 86% 10% US $16 US $13Treasury Metals Inc. TSX:TML US $63 US ($2) US $65 1.6 1.88 1.9 2.26 83% - - - - - 1.6 1.88 1.9 2.26 83% 24% US $42 US $35TriMetals Mining Inc. TSX:TMI US $32 US $2 US $31 1.8 0.07 14.9 0.57 12% - - - - - 1.8 0.07 14.9 0.57 12% 47% US $18 US $2West Kirkland Mining Inc. TSXV:WKM US $22 US ($0) US $22 1.3 0.55 1.6 0.67 83% 0.6 0.58 0.7 0.69 83% 0.7 0.53 0.9 0.65 83% 23% US $17 US $14Group Average - Total # Companies: 38 US $46 US $38Equivalency assumptions (US$ / 03-17-17): $1,248/oz Au, $18.21/oz Ag, $952/oz Pt, $798/oz Pd, $2.67/lb Cu, $1.26/lb Zn, $1.06/lb Pb, $4.69/lb Ni, $8.55/lb Mo, $23.93/lb Co, $8,625/t Sb, $24.20/lb U3O8, $0.20/lb Sn, $93.00/t HCC, Source: SNL Financial retrieved on March 31, 2017
Company SymbolMarket
Capitalization(millions)
WorkingCapital
(millions)
EnterpriseValue
(millions)Au
(Moz)Au
(g/t)AuEq(Moz)
Global Reserves & Resources Reserves Resources (M&I and Inferred)Au
(MozAu
(g/t)AuEq(Moz)
AuEq(g/t)
AuEq(g/t)
% AuInferre
EV/ozAu
EV/ozAuEq
Au(Moz)
Au(g/t)
AuEq(Moz)
AuEq(g/t) % Au
Global% Au% Au

The Weekly Dig 3/31/17
Haywood Mining [email protected] Page 28
Silver – EV/oz Comparables
Reserves
Alexco Resource Corp. TSX:AXR US $143 US $18 US $125 67 319 123 584 55% - - - - - - 67 319 123 584 55% 18% US $1.86 US $1.01Americas Silver Corporation TSX:USA US $115 US $20 US $95 109 150 226 311 48% 31 185 - - - US $3.05 78 140 - - - 35% US $0.87 US $0.42Athena Silver Corp OTCPK:AHNR US $3 US ($2) US $6 43 67 43 67 100% - - - - - - 43 67 43 67 100% - US $0.13 US $0.13Bear Creek Mining Corporation TSXV:BCM US $176 US $33 US $144 523 41 1,096 85 48% 291 52 624 111 47% US $0.49 232 32 471 65 49% 33% US $0.27 US $0.13Defiance Silver Corp. TSXV:DEF US $21 US $1 US $20 17 182 18 191 95% - - - - - - 17 182 18 191 95% 100% US $1.19 US $1.14Dolly Varden Silver Corporation TSXV:DV US $18 US $3 US $16 43 333 43 333 100% - - - - - - 43 333 43 333 100% 25% US $0.37 US $0.37Golden Arrow Resources Corporation TSXV:GRG US $63 US $7 US $56 58 83 101 145 57% 6 145 7 166 87% US $9.26 52 79 94 143 55% 25% US $0.96 US $0.55Golden Minerals Company AMEX:AUMN US $57 US $4 US $53 113 41 284 102 40% - - - - - - 113 41 284 102 40% 58% US $0.47 US $0.19Iberian Minerals Ltd. TSXV:IML US $20 US $0 US $20 22 9 422 168 5% - - - - - - 22 9 422 168 5% - US $0.87 US $0.05Investigator Resources Limited ASX:IVR US $17 US $3 US $14 33 117 33 117 100% - - - - - - 33 117 33 117 100% 100% US $0.42 US $0.42Kootenay Silver Inc TSXV:KTN US $39 US $6 US $33 76 62 118 96 65% - - - - - - 76 62 118 96 65% 19% US $0.43 US $0.28MacPhersons Resources Limited ASX:MRP US $63 US $6 US $57 20 28 65 88 31% 8 44 25 133 33% US $6.94 12 22 40 73 30% 29% US $2.84 US $0.89MAG Silver Corp. TSX:MAG US $1,055 US $141 US $914 152 65 528 226 29% - - - - - - 152 65 528 226 29% 59% US $6.01 US $1.73Minco Silver Corporation TSX:MSV US $58 US $40 US $19 162 158 251 246 64% 50 189 62 233 81% US $0.37 112 148 190 250 59% 52% US $0.11 US $0.07Silver Bear Resources Inc. TSX:SBR US $48 US $3 US $117 56 723 57 729 99% 23 852 23 852 100% US $5.19 34 - 34 - 99% 67% US $2.08 US $2.06Silver Bull Resources, Inc. OTCPK:SVBL US $16 US $1 US $15 91 48 450 236 20% - - - - - - 91 48 450 236 20% 0% US $0.17 US $0.03Silver Predator Corp. TSXV:SPD US $5 US $0 US $6 21 67 21 67 100% - - - - - - 21 67 21 67 100% 19% US $0.27 US $0.27Silver Range Resources Ltd. TSXV:SNG US $12 US $1 US $11 2 9 76 397 2% - - - - - - 2 9 76 397 2% - US $6.30 US $0.15T inka Resources Limited TSXV:TK US $86 US $9 US $78 39 31 220 171 18% - - - - - - 39 31 220 171 18% 64% US $1.97 US $0.35Group Average - Total # Companies: 19 US $4.22 US $1.45 US $0.54Equivalency assumptions (US$ / 03-17-17): $1,248/oz Au, $18.21/oz Ag, $952/oz Pt, $798/oz Pd, $2.67/lb Cu, $1.26/lb Zn, $1.06/lb Pb, $4.69/lb Ni, $8.55/lb Mo, $23.93/lb Co, $8,625/t Sb, $24.20/lb U3O8, $0.20/lb Sn, $93.00/t HCC, $89.47/t 62% FeSource: SNL Financial retrieved on March 31, 2017
Company SymbolMarket
Capitalization(millions)
WorkingCapital
(millions)
EnterpriseValue
(millions)Ag
(Moz)Ag(g/t)
AgEq(Moz)
Global Reserves & Resources Reserves Resources (M&I and Inferred)Ag
(Moz)Ag(g/t)
AgEq(Moz)
AgEq(g/t)
AgEq(g/t)
% AgInferred
EV/ozAg
EV/ozAg
EV/ozAgEq
Ag(Moz)
Ag(g/t)
AgEq(Moz)
AgEq(g/t)
% Ag
Global
% Ag% Ag
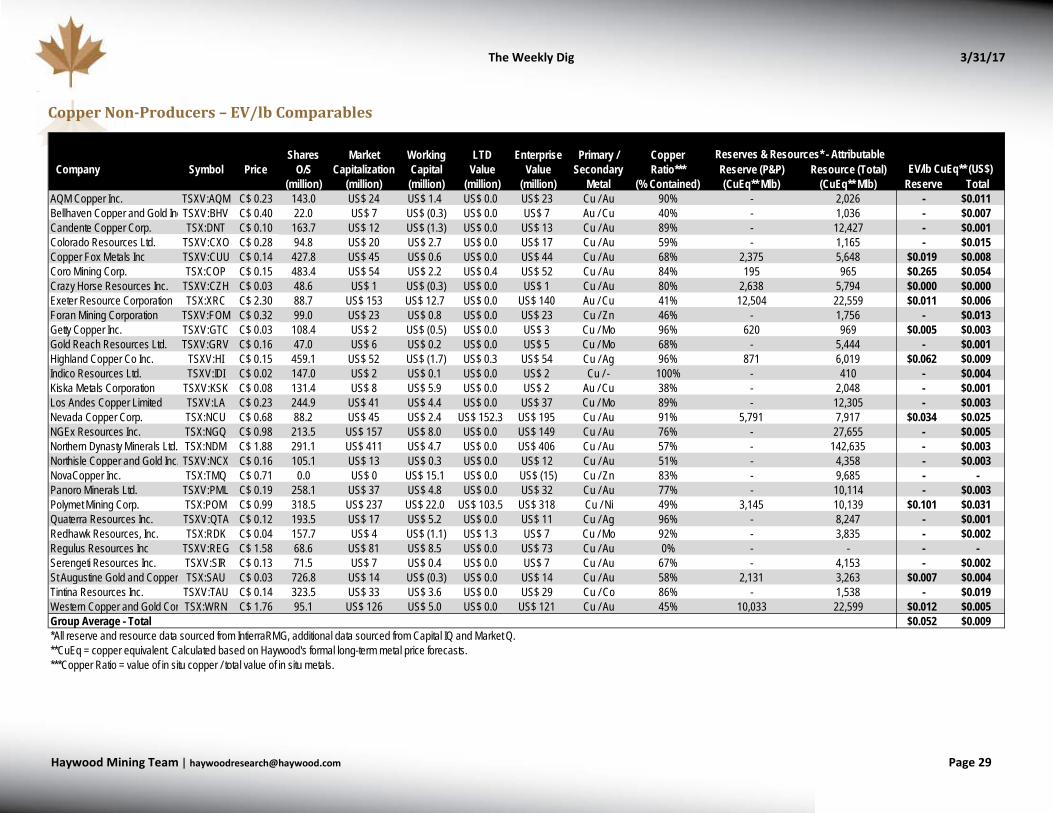
The Weekly Dig 3/31/17
Haywood Mining [email protected] Page 29
Copper Non-Producers – EV/lb Comparables
Shares Market Working LTD Enterprise CopperCompany Symbol Price O/S Capitalization Capital Value Value Ratio*** Reserve (P&P) Resource (Total)
(million) (million) (million) (million) (million) (% Contained) (CuEq** Mlb) (CuEq** Mlb) Reserve TotalAQM Copper Inc. TSXV:AQM C$ 0.23 143.0 US$ 24 US$ 1.4 US$ 0.0 US$ 23 Cu / Au 90% - 2,026 - $0.011Bellhaven Copper and Gold IncTSXV:BHV C$ 0.40 22.0 US$ 7 US$ (0.3) US$ 0.0 US$ 7 Au / Cu 40% - 1,036 - $0.007Candente Copper Corp. TSX:DNT C$ 0.10 163.7 US$ 12 US$ (1.3) US$ 0.0 US$ 13 Cu / Au 89% - 12,427 - $0.001Colorado Resources Ltd. TSXV:CXO C$ 0.28 94.8 US$ 20 US$ 2.7 US$ 0.0 US$ 17 Cu / Au 59% - 1,165 - $0.015Copper Fox Metals Inc TSXV:CUU C$ 0.14 427.8 US$ 45 US$ 0.6 US$ 0.0 US$ 44 Cu / Au 68% 2,375 5,648 $0.019 $0.008Coro Mining Corp. TSX:COP C$ 0.15 483.4 US$ 54 US$ 2.2 US$ 0.4 US$ 52 Cu / Au 84% 195 965 $0.265 $0.054Crazy Horse Resources Inc. TSXV:CZH C$ 0.03 48.6 US$ 1 US$ (0.3) US$ 0.0 US$ 1 Cu / Au 80% 2,638 5,794 $0.000 $0.000Exeter Resource Corporation TSX:XRC C$ 2.30 88.7 US$ 153 US$ 12.7 US$ 0.0 US$ 140 Au / Cu 41% 12,504 22,559 $0.011 $0.006Foran Mining Corporation TSXV:FOM C$ 0.32 99.0 US$ 23 US$ 0.8 US$ 0.0 US$ 23 Cu / Zn 46% - 1,756 - $0.013Getty Copper Inc. TSXV:GTC C$ 0.03 108.4 US$ 2 US$ (0.5) US$ 0.0 US$ 3 Cu / Mo 96% 620 969 $0.005 $0.003Gold Reach Resources Ltd. TSXV:GRV C$ 0.16 47.0 US$ 6 US$ 0.2 US$ 0.0 US$ 5 Cu / Mo 68% - 5,444 - $0.001Highland Copper Co Inc. TSXV:HI C$ 0.15 459.1 US$ 52 US$ (1.7) US$ 0.3 US$ 54 Cu / Ag 96% 871 6,019 $0.062 $0.009Indico Resources Ltd. TSXV:IDI C$ 0.02 147.0 US$ 2 US$ 0.1 US$ 0.0 US$ 2 Cu / - 100% - 410 - $0.004Kiska Metals Corporation TSXV:KSK C$ 0.08 131.4 US$ 8 US$ 5.9 US$ 0.0 US$ 2 Au / Cu 38% - 2,048 - $0.001Los Andes Copper Limited TSXV:LA C$ 0.23 244.9 US$ 41 US$ 4.4 US$ 0.0 US$ 37 Cu / Mo 89% - 12,305 - $0.003Nevada Copper Corp. TSX:NCU C$ 0.68 88.2 US$ 45 US$ 2.4 US$ 152.3 US$ 195 Cu / Au 91% 5,791 7,917 $0.034 $0.025NGEx Resources Inc. TSX:NGQ C$ 0.98 213.5 US$ 157 US$ 8.0 US$ 0.0 US$ 149 Cu / Au 76% - 27,655 - $0.005Northern Dynasty Minerals Ltd. TSX:NDM C$ 1.88 291.1 US$ 411 US$ 4.7 US$ 0.0 US$ 406 Cu / Au 57% - 142,635 - $0.003Northisle Copper and Gold Inc. TSXV:NCX C$ 0.16 105.1 US$ 13 US$ 0.3 US$ 0.0 US$ 12 Cu / Au 51% - 4,358 - $0.003NovaCopper Inc. TSX:TMQ C$ 0.71 0.0 US$ 0 US$ 15.1 US$ 0.0 US$ (15) Cu / Zn 83% - 9,685 - -Panoro Minerals Ltd. TSXV:PML C$ 0.19 258.1 US$ 37 US$ 4.8 US$ 0.0 US$ 32 Cu / Au 77% - 10,114 - $0.003Polymet Mining Corp. TSX:POM C$ 0.99 318.5 US$ 237 US$ 22.0 US$ 103.5 US$ 318 Cu / Ni 49% 3,145 10,139 $0.101 $0.031Quaterra Resources Inc. TSXV:QTA C$ 0.12 193.5 US$ 17 US$ 5.2 US$ 0.0 US$ 11 Cu / Ag 96% - 8,247 - $0.001Redhawk Resources, Inc. TSX:RDK C$ 0.04 157.7 US$ 4 US$ (1.1) US$ 1.3 US$ 7 Cu / Mo 92% - 3,835 - $0.002Regulus Resources Inc TSXV:REG C$ 1.58 68.6 US$ 81 US$ 8.5 US$ 0.0 US$ 73 Cu / Au 0% - - - -Serengeti Resources Inc. TSXV:SIR C$ 0.13 71.5 US$ 7 US$ 0.4 US$ 0.0 US$ 7 Cu / Au 67% - 4,153 - $0.002St Augustine Gold and Copper TSX:SAU C$ 0.03 726.8 US$ 14 US$ (0.3) US$ 0.0 US$ 14 Cu / Au 58% 2,131 3,263 $0.007 $0.004Tintina Resources Inc. TSXV:TAU C$ 0.14 323.5 US$ 33 US$ 3.6 US$ 0.0 US$ 29 Cu / Co 86% - 1,538 - $0.019Western Copper and Gold Cor TSX:WRN C$ 1.76 95.1 US$ 126 US$ 5.0 US$ 0.0 US$ 121 Cu / Au 45% 10,033 22,599 $0.012 $0.005Group Average - Total $0.052 $0.009*All reserve and resource data sourced from IntierraRMG, additional data sourced from Capital IQ and Market Q.**CuEq = copper equivalent. Calculated based on Haywood's formal long-term metal price forecasts.***Copper Ratio = value of in situ copper / total value of in situ metals.
Primary / Secondary
Metal
Reserves & Resources* - AttributableEV/lb CuEq** (US$)

The Weekly Dig 3/31/17
Haywood Mining [email protected] Page 30
Nickel Non-Producers – EV/lb Comparables
Zinc Non-Producers – EV/lb Comparables
Shares Market Working LTD Enterprise NickelCompany Symbol Price O/S Capitalization Capital Value Value Ratio*** Reserve (P&P) Resource (Total)
(million) (million) (million) (million) (million) (% Contained) (NiEq** Mlb) (NiEq** Mlb) Reserve TotalAnfield Nickel Corp. TSXV:ANF C$ 0.99 119.2 US$ 89 US$ 21.2 US$ 0.0 US$ 67 Ni / Co 99% 2,169 3,616 $0.031 $0.019Asian Mineral Resources LimiteTSXV:ASN C$ 0.03 788.9 US$ 15 US$ 4.7 US$ 0.0 US$ 10 Ni / Cu 86% 85 146 $0.120 $0.069Canadian Arrow Mines Ltd. TSXV:CRO C$ 0.02 140.0 US$ 2 US$ (0.6) US$ 0.0 US$ 3 Ni / Cu 82% - 141 - $0.019First Point Minerals Corp. TSXV:FPX C$ 0.12 122.3 US$ 11 US$ 0.2 US$ 5.1 US$ 16 Ni / Cu 182% - 141 - $0.110Hard Creek Nickel Corporation TSXV:HNC C$ 0.05 43.1 US$ 2 US$ 0.1 US$ 0.0 US$ 2 Ni / Co 91% - 9,161 - $0.000Mustang Minerals Corp. TSXV:MUM C$ 0.02 256.5 US$ 3 US$ (0.5) US$ 0.0 US$ 3 Co / Ni 38% 2 1,176 $1.428 $0.003Noront Resources Ltd TSXV:NOT C$ 0.24 306.3 US$ 55 US$ 7.4 US$ 32.8 US$ 81 Ni / Cu 78% 498 851 $0.162 $0.095North American Nickel Inc. TSXV:NAN C$ 0.08 122.2 US$ 7 US$ 4.0 US$ 0.0 US$ 3 Ni / Cu 0% - - - -Northern Shield Resources Inc TSXV:NRN C$ 0.05 205.0 US$ 8 US$ 1.7 US$ 0.0 US$ 6 Ni / Cu 0% - - - -Poseidon Nickel Limited ASX:POS C$ 0.04 885.0 US$ 26 US$ (1.3) US$ 14.6 US$ 42 Ni / Au 98% 171 1,284 $0.245 $0.033Royal Nickel Corporation TSX:RNX C$ 0.30 276.2 US$ 62 US$ (13.6) US$ 13.0 US$ 89 Ni / Cu 0% - - - -Sama Resources Inc. TSXV:SME C$ 0.15 119.0 US$ 13 US$ (0.0) US$ 0.0 US$ 13 Ni / Cu 71% - 195 - $0.069Strongbow Exploration Inc. TSXV:SBW C$ 0.15 57.9 US$ 7 US$ 0.4 US$ 1.1 US$ 7 Ni / Cu 86% - 417 - $0.017Talon Metals Corporation TSX:TLO C$ 0.09 129.6 US$ 8 US$ 0.2 US$ 13.9 US$ 22 Ni / Fe 56% - 125 - $0.176Group Average - Total $0.397 $0.055*All reserve and resource data sourced from IntierraRMG, additional data sourced from Capital IQ and Market Q.**NiEq = nickel equivalent. Calculated based on Haywood's formal long-term metal price forecasts.***Nickel Ratio = value of in situ nickel / total value of in situ metals.
Primary / Secondary
Metal
Reserves & Resources* - AttributableEV/lb NiEq** (US$)
Shares Market Working LTD Enterprise ZincCompany Symbol Price O/S Capitalization Capital Value Value Ratio*** Reserve (P&P) Resource (Total)
(million) (million) (million) (million) (million) (% Contained) (ZnEq** Mlb) (ZnEq** Mlb) Reserve TotalAquila Resources Inc. TSX:AQA C$ 0.25 271.5 US$ 51 US$ (0.5) US$ 0.0 US$ 51 Au / Zn 19% - 1,587 - $0.032Canada Zinc Metals Corp. TSXV:CZX C$ 0.34 155.2 US$ 40 US$ 5.9 US$ 0.0 US$ 34 Zn / Pb 82% - 6,096 - $0.006Canadian Zinc Corporation TSX:CZN C$ 0.22 265.9 US$ 44 US$ 7.1 US$ 0.0 US$ 37 Zn / Pb 40% 2,525 10,077 $0.015 $0.004El Nino Ventures Inc. TSXV:ELN C$ 0.03 61.6 US$ 1 US$ 0.2 US$ 0.0 US$ 1 Zn / Cu 45% - 1,357 - $0.001Firestone Ventures Inc. TSXV:FV C$ 0.04 36.8 US$ 1 US$ (0.6) US$ 0.0 US$ 2 Zn / Pb 73% - 454 - $0.004Foran Mining Corporation TSXV:FOM C$ 0.32 99.0 US$ 23 US$ 0.8 US$ 0.0 US$ 23 Cu / Zn 33% - 4,962 - $0.005InZinc Mining Ltd. TSXV:IZN C$ 0.25 72.7 US$ 13 US$ 0.4 US$ 0.0 US$ 13 Zn / Cu 77% - 3,873 - $0.003Rathdowney Resources Ltd. TSXV:RTH C$ 0.27 176.2 US$ 36 US$ (0.6) US$ 0.0 US$ 36 Zn / Pb 80% - 3,437 - $0.011Wolfden Resources Corp. TSXV:WLF C$ 0.13 81.1 US$ 8 US$ 1.2 US$ 0.0 US$ 7 Au / Zn 29% - 4,516 - $0.001Group Average - Total $0.015 $0.004*All reserve and resource data sourced from IntierraRMG, additional data sourced from Capital IQ and Market Q.**ZnEq = Zinc equivalent. Calculated based on Haywood's formal long-term metal price forecasts.***Zinc Ratio = value of in situ zinc / total value of in situ metals.
Primary / Secondary
Metal
Reserves & Resources* - AttributableEV/lb ZnEq** (US$)

The Weekly Dig 3/31/17
Haywood Mining [email protected] Page 31
Dissemination of Research Research reports are disseminated either through electronic medium or in printed copy. Clients may access reports on our website, or receive publications directly via email. Haywood strives to ensure all clients receive research in a timely manner and at the same time. It is against our policy for analysts to discuss or circulate their recommendations internally prior to public distribution. This policy applies equally to recommendation changes, target changes and/or forecast revisions. For Canadian residents: Haywood Securities Inc. is a Canadian registered broker-dealer and a member of the Investment Industry Regulatory Organization of Canada, the Toronto Stock Exchange, the Toronto Venture Exchange and the Canadian Investor Protection Fund and accepts responsibility for the dissemination of this report. Any Canadian client that wishes further information on any securities discussed in this report should contact a qualified salesperson of Haywood Securities Inc. For U.S. residents: This investment research is distributed in the United States, as third party research by Haywood Securities (USA) Inc. Haywood Securities (USA) Inc. is a wholly owned subsidiary of Haywood Securities Inc., registered with the U.S. Securities and Exchange Commission, and is a member of FINRA and the Securities Investor Protection Corporation (SIPC). Haywood Securities (USA) Inc. as a U.S. registered broker-dealer accepts responsibility for this Research Report and its dissemination in the United States. Any U.S. client that wishes further information on any securities discussed in this report or wish to effect a transaction in these securities should contact a qualified salesperson of Haywood Securities (USA) Inc. Haywood Securities Inc. Research Analysts are considered Foreign Research Analysts to the USA and are not registered/qualified as Research Analysts with FINRA. As these analysts are considered Foreign Research Analysts they may not be specifically subject to FINRA (formerly NASD) Rule 2711 and FINRA (formerly NYSE) Rule 472 restrictions on communications with a Subject Company, Public Appearances and trading securities held by a Research Analyst Account. This report may be distributed in the following states: nil. Otherwise, this report may only be distributed into those states with an institutional buyer state securities registration exemption.
Analyst Certification We, Mick Carew, Geordie Mark, Colin Healey, Pierre Vaillancourt, and Kerry Smith, hereby certify that the views expressed in this report (which includes the rating assigned to the issuer’s shares as well as the analytical substance and tone of the report) accurately reflect my/our personal views about the subject securities and the issuer. No part of my/our compensation was, is, or will be directly or indirectly related to the specific recommendations.
Important Disclosures Of the companies included in the report the following Important Disclosures apply:
Ticker Company 1 2 3 4 5 6 7 8
TSX:AGI Alamos Gold Inc. X X X TSX:AKG Asanko Gold Inc. X TSXV:AGB Atlantic Gold Corp. X X X X TSX:AVK Avnel Gold Mining Limited X X TSX:BTO B2Gold Corp. X X TSXV:BGM Barkerville Gold Mines Ltd. X X X TSX:ABX Barrick Gold Corporation X TSX:DML Denison Mines Corp. X X X TSX:DGC Detour Gold Corporation X X TSX:ELD Eldorado Gold Corporation X X TSX:EDV Endeavour Mining Corp. X X X TSX:EFR Energy Fuels Inc. X X X ASX:GOR Gold Road Resources Limited X TSXV:IDM IDM Mining Ltd. X X X

The Weekly Dig 3/31/17
Haywood Mining [email protected] Page 32
TSXV:ICG Integra Gold Corp. X X TSX:LUC Lucara Diamond Corp. X X TSX:LUG Lundin Gold Inc. X X TSX:MOZ Marathon Gold Corp. X X X X TSX:MAX Midas Gold Corp. X X X TSX:MPVD Mountain Province Diamonds Inc. X X X TSX:NXE NexGen Energy Ltd. X X TSXV:NCA NewCastle Gold Ltd. X X X TSX:OGC OceanaGold Corporation X TSX:OR Osisko Gold Royalties Ltd. X TSX:OSK Osisko Mining Inc. X X TSX:PLG Pilot Gold Inc. X X TSXV:PGM Pure Gold Mining Inc. X X TSX:RIC Richmont Mines Inc. X X TSXV:ROG Roxgold Inc. X X X TSX:RNX RNC Minerals X X X X TSX:SBB Sabina Gold and Silver Corp. X X TSX:SMF SEMAFO Inc. X X TSX:THO Tahoe Resources Inc. X AMEX:UEC Uranium Energy Corp. X X X TSX:U Uranium Participation Corporation X X
1 The Analyst(s) preparing this report (or a member of the Analysts’ households) have a financial interest in this company.
2 As of the end of the month immediately preceding this publication either Haywood Securities, Inc., one of its subsidiaries, its officers or directors beneficially owned 1% or more of this company.
3 Haywood Securities, Inc. has reviewed lead projects of this company and a portion of the expenses for this travel have been reimbursed by the issuer.
4 Haywood Securities Inc. or one of its subsidiaries has managed or co-managed or participated as selling group in a public offering of securities for this company in the past 12 months.
5 Haywood Securities, Inc. or one of its subsidiaries has received compensation for investment banking services from this company in the past 12 months
6 Haywood Securities, Inc. or one of its subsidiaries has received compensation for investment banking services from this company in the past 24 months
7 Haywood Securities, Inc. or one of its subsidiaries is restricted on this company at the time of publication
8 Haywood Securities, Inc. or one of its subsidiaries expects to receive or intends to seek compensation for investment banking services from this company in the next three months
Other material conflict of interest of the research analyst of which the research analyst or Haywood Securities Inc. knows or has reason to know at the time of publication or at the time of public appearance: n/a
Rating Structure Each company within an analyst’s universe, or group of companies covered, is assigned: (i) a recommendation or rating, usually BUY, HOLD, or SELL; (ii) a 12 month target price, which represents an analyst’s current assessment of a company’s potential stock price over the next year; (iii) an overall risk rating which represents an analyst’s assessment of the company’s overall investment risk; and (iv) specific risk ratings or risk profile parameters which in their aggregate support an analyst’s overall risk rating. These ratings are more fully explained below. Before acting on our recommendation we caution you to confer with your Haywood investment advisor to determine the suitability of our recommendation for your specific investment objectives, risk tolerance and investment time horizon.

The Weekly Dig 3/31/17
Haywood Mining [email protected] Page 33
Recommendation Rating BUY –The analyst believes that the security will outperform other companies in their sector on a risk adjusted basis or for the reasons stated in the research report the analyst believes that the security is deserving of a (continued) BUY rating. HOLD – The analyst believes that the security is expected to perform in line with other companies in their sector on a risk adjusted basis or for the reasons stated in the research report the analyst believes that the security is deserving of a (continued) HOLD rating. SELL – Investors are advised to sell the security or hold alternative securities within the sector. Stocks in this category are expected to under-perform other companies on a risk adjusted basis or for the reasons stated in the research report the analyst believes that the security is deserving of a (continued) SELL rating. TENDER – The analyst is recommending that investors tender to a specific offering for the company’s stock. RESEARCH COMMENT – An analyst comment about an issuer event that does not include a rating or recommendation. UNDER REVIEW – Placing a stock Under Review does not revise the current rating or recommendation of the analyst. A stock will be placed Under Review when the relevant company has a significant material event with further information pending or to be announced. An analyst will place a stock Under Review while he/she awaits sufficient information to re-evaluate the company’s financial situation. COVERAGE DROPPED – Haywood Securities will no longer cover the issuer. Haywood will provide notice to clients whenever coverage of an issuer is discontinued. Haywood’s focus is to search for undervalued companies which analysts believe may achieve attractive risk-adjusted returns. This research coverage on potentially undervalued companies may result in an outweighed percentage of companies rated as BUY. Management regularly reviews rating and targets in all sectors to ensure fairness and accuracy. For further information on Haywood Securities’ research dissemination policies, please visit: http://haywood.com/what-we-offer/research/research-policy
Overall Risk Rating Very High Risk: Venture type companies or more established micro, small, mid or large cap companies whose risk profile parameters and/or lack of liquidity warrant such a designation. These companies are only appropriate for investors who have a very high tolerance for risk and volatility and who are capable of incurring temporary or permanent loss of a very significant portion of their investment capital. High Risk: Typically micro or small cap companies which have an above average investment risk relative to more established or mid to large cap companies. These companies will generally not form part of the broad senior stock market indices and often will have less liquidity than more established mid and large cap companies. These companies are only appropriate for investors who have a high tolerance for risk and volatility and who are capable of incurring a temporary or permanent loss of a significant loss of their investment capital. Medium-High Risk: Typically mid to large cap companies that have a medium to high investment risk. These companies will often form part of the broader senior stock market indices or sector specific indices. These companies are only appropriate for investors who have a medium to high tolerance for risk and volatility and who are prepared to accept general stock market risk including the risk of a temporary or permanent loss of some of their investment capital. Moderate Risk: Large to very large cap companies with established earnings who have a track record of lower volatility when compared against the broad senior stock market indices. These companies are only appropriate for investors who have a medium tolerance for risk and volatility and who are prepared to accept general stock market risk including the risk of a temporary or permanent loss of some of their investment capital.

The Weekly Dig 3/31/17
Haywood Mining [email protected] Page 34
Distribution of Ratings (as of March 31, 2017) IB Clients
% # (TTM) Buy 76.1% 70 96.2% Hold 7.6% 7 0.0% Sell 0.0% 0 0.0% Tender 1.1% 1 0.0% UR (Buy) 0.0% 0 0.0% UR (Hold) 0.0% 0 0.0% UR (Sell) 0.0% 0 0.0% dropped (TTM) 15.2% 14 3.8%
Price Chart, Rating and Target Price History (as of March 31, 2017) Alamos Gold Inc. (AGI-T) Date Target(C$) Rating
7/11/16 $13.00 Buy7/7/16 $14.75 Buy
5/30/16 $10.25 Buy5/13/16 $9.50 Buy3/28/16 $7.75 Buy1/12/16 $7.00 Buy
11/13/15 $8.00 Buy7/15/15 $9.00 Buy1/27/15 $9.25 Buy
10/23/14 $11.25 Buy4/16/14 $12.00 Buy
0
5
10
15
20
25
Apr14
Jul14
Oct14
Jan15
Apr15
Jul15
Oct15
Jan16
Apr16
Jul16
Oct16
Jan17
Price History (C$) Target/Rating/Coverage Change
Asanko Gold Inc. (AKG-T) Date Target(C$) Rating2/28/17 $5.20 Buy2/22/17 $5.50 Buy1/25/17 $5.50 Hold7/11/16 $6.50 Buy5/31/16 $5.25 Buy5/3/16 $5.00 Buy4/7/16 $3.50 Buy
3/24/16 $3.25 Hold1/12/16 $3.25 Buy7/15/15 $3.60 Buy1/21/15 $3.20 Buy
10/23/14 $3.35 Buy4/16/14 $3.60 Buy
Initiated Coverage 12/11/13
0
1
2
3
4
5
6
7
Mar14
Jun14
Sep14
Dec14
Mar15
Jun15
Sep15
Dec15
Mar16
Jun16
Sep16
Dec16
Price History (C$) Target/Rating/Coverage Change
Atlantic Gold Corporation (AGB-V) Date Target(C$) Rating1/25/17 $1.30 Buy10/6/16 $1.35 Buy7/11/16 $1.25 Buy5/19/16 $1.10 Buy12/9/15 $1.00 Buy3/1/16 $0.85 Buy
1/12/16 $0.55 Buy12/10/15 $0.50 Buy
Initiated Coverage 12/9/15
0
0.2
0.4
0.6
0.8
1
1.2
1.4
1.6
Feb14
May14
Aug14
Nov14
Feb15
May15
Aug15
Nov15
Feb16
May16
Aug16
Nov16
Price History (C$) Target/Rating/Coverage Change
Avnel Gold Mining Limited (AVK-T) Date Target(C$) Rating3/27/17 $0.60 Buy
Initiated Coverage: 3/27/2017
00.10.20.30.40.50.60.70.80.9
Mar14
Jun14
Sep14
Dec14
Mar15
Jun15
Sep15
Dec15
Mar16
Jun16
Sep16
Dec16
Price History (C$) Target/Rating/Coverage Change
B2Gold Corp. (BTO-T) Date Target(C$) Rating1/25/17 $5.50 Buy8/5/16 $6.00 Buy8/3/16 $5.00 Buy
7/11/16 $4.50 Buy5/31/16 $2.80 Buy5/13/16 $2.75 Hold3/18/16 $2.10 Hold
11/16/15 $2.10 Buy3/17/15 $2.75 Buy1/27/15 $3.25 Buy
11/17/14 $3.20 Buy10/23/14 $3.45 Buy8/15/14 $3.75 Buy7/9/14 $3.90 Buy
4/16/14 $3.80 Buy3/18/14 $3.75 Buy
Transferred Coverage 09/12/12; Re-Initiated Coverage 02/05/14
0
1
2
3
4
5
6
7
Feb14
May14
Aug14
Nov14
Feb15
May15
Aug15
Nov15
Feb16
May16
Aug16
Nov16
Price History (C$) Target/Rating/Coverage Change
Barkerville Gold Mines Ltd. (BGM-V) Date Target(C$) Rating3/30/17 $1.00 Buy
Initiated Coverage: 3/30/2017
0
0.2
0.4
0.6
0.8
1
1.2
Mar14
Jun14
Sep14
Dec14
Mar15
Jun15
Sep15
Dec15
Mar16
Jun16
Sep16
Dec16
Price History (C$) Target/Rating/Coverage Change

The Weekly Dig 3/31/17
Haywood Mining [email protected] Page 35
Barrick Gold Corporation (ABX-T) Date Target(C$) Rating2/17/17 $38.50 Buy1/25/17 $33.00 Buy7/11/16 $37.50 Buy5/31/16 $25.25 Buy4/27/16 $25.00 Buy4/18/16 $20.50 Buy2/19/16 $19.50 Buy1/12/16 $14.50 Buy8/7/15 $11.00 Buy
7/15/15 $15.65 Hold4/29/15 $15.75 Hold2/20/15 $15.00 Hold1/27/15 $14.25 Hold
10/23/14 $17.25 Hold7/9/14 $23.50 Hold5/1/14 $23.00 Hold0
51015202530354045
Feb14
May14
Aug14
Nov14
Feb15
May15
Aug15
Nov15
Feb16
May16
Aug16
Nov16
Price History (C$) Target/Rating/Coverage Change
Copper Mountain Mining Corporation (CMMC-T) Date Target(C$) Rating11/8/16 $0.75 Buy10/7/16 $0.60 Buy5/3/16 $0.60 Hold
1/12/16 $0.60 Buy11/10/15 $1.00 Buy7/15/15 UR Buy1/27/15 $2.00 Buy1/19/15 $3.50 UR(Buy)8/11/14 $3.50 Buy7/7/14 $3.00 Buy
4/16/14 $2.75 Buy2/24/14 $2.50 Buy
Initiated Coverage: 8/26/10
00.5
11.5
22.5
33.5
44.5
Dec13
Mar14
Jun14
Sep14
Dec14
Mar15
Jun15
Sep15
Dec15
Mar16
Jun16
Sep16
Price History (C$) Target/Rating/Coverage Change
Denison Mines Corp. (DML-T) Date Target(C$) Rating5/31/16 $1.80 Buy1/12/16 $1.90 Buy
Transferred & Re-initiated Coverage 08/20/12
00.20.40.60.8
11.21.41.61.8
2
Mar14
Jun14
Sep14
Dec14
Mar15
Jun15
Sep15
Dec15
Mar16
Jun16
Sep16
Dec16
Price History (C$) Target/Rating/Coverage Change
Detour Gold Corporation (DGC-T) Date Target(C$) Rating1/25/17 $32.00 Buy11/3/16 $38.00 Buy7/11/16 $49.00 Buy5/31/16 $32.00 Buy4/15/16 $28.00 Buy3/11/16 $24.00 Buy1/27/16 $19.50 Buy1/12/16 $18.75 Buy7/15/15 $18.50 Buy1/27/15 $14.00 Buy
10/23/14 $13.50 Buy7/31/14 $15.50 Buy7/9/14 $16.50 Buy
4/16/14 $13.75 Buy3/6/14 $12.50 Buy
0
10
20
30
40
50
60
Feb14
May14
Aug14
Nov14
Feb15
May15
Aug15
Nov15
Feb16
May16
Aug16
Nov16
Price History (C$) Target/Rating/Coverage Change
Eldorado Gold Corporation (ELD-T) Date Target(C$) Rating1/25/17 $8.25 Buy7/29/16 $8.75 Buy7/11/16 $9.25 Buy5/31/16 $7.50 Buy5/13/16 $6.75 Buy1/26/16 $4.50 Buy1/12/16 $6.50 Buy7/15/15 $6.75 Buy2/23/15 $7.75 Buy1/27/15 $9.00 Buy
10/23/14 $9.50 Buy7/9/14 $8.50 Hold
4/16/14 $8.00 Hold
0123456789
10
Mar14
Jun14
Sep14
Dec14
Mar15
Jun15
Sep15
Dec15
Mar16
Jun16
Sep16
Dec16
Price History (C$) Target/Rating/Coverage Change
Endeavour Mining Corporation (EDV-T) Date Target(C$) Rating1/25/17 $31.00 Buy
10/20/16 $33.00 Buy7/11/16 $33.00 Buy5/31/16 $22.00 Buy4/21/16 $19.75 Buy3/21/16 $14.50 Buy1/18/16 $12.00 Buy12/3/15 $11.00 Buy1/27/15 $13.00 Buy11/5/14 $11.50 Buy
10/23/14 $10.50 Buy8/21/14 $12.50 Buy
Initiated Coverage 08/21/14; 10:1 Prices/Targets adjusted to reflect Stock Consolidation 12/02/15; Transfer of Coverage 10/20/16
0
5
10
15
20
25
30
35
Feb14
May14
Aug14
Nov14
Feb15
May15
Aug15
Nov15
Feb16
May16
Aug16
Nov16
Price History (C$) Target/Rating/Coverage Change
Energy Fuels Inc. (AMEX:UUUU) Date Target(US$) Rating1/25/17 $4.80 Buy11/4/16 $5.00 Buy5/31/16 $6.00 Buy1/12/16 $7.25 Buy9/30/15 $8.20 Buy7/15/15 $9.41 Buy7/9/14 $11.73 Buy
4/16/14 $12.71 Buy3/31/14 $13.55 Buy
Targets and prices prior to 11/06/13 adjusted for share consolidation; Transferred & Re-initiated Coverage 08/20/12; Targets prior to 05/31/16 converted to US$ at spot
0
2
4
6
8
10
12
14
16
Feb14
May14
Aug14
Nov14
Feb15
May15
Aug15
Nov15
Feb16
May16
Aug16
Nov16
Price History (US$) Target/Rating/Coverage Change
Gold Road Resources Limited (GOR-A) Date Target(C$) Rating10/20/16 $1.00 Buy9/13/16 $1.00 Buy
Initiated Coverage 9/13/2016; Transfer of Coverage 10/20/16
0
0.5
1
1.5
2
2.5
3
Jan14
Apr14
Jul14
Oct14
Jan15
Apr15
Jul15
Oct15
Jan16
Apr16
Jul16
Oct16
Price History (C$) Target/Rating/Coverage Change

The Weekly Dig 3/31/17
Haywood Mining [email protected] Page 36
Integra Gold Corp. (ICG-V) Date Target(C$) Rating1/25/17 $0.90 Buy7/11/16 $0.90 Hold5/31/16 $0.70 Hold1/12/16 $0.60 Buy7/15/15 $0.70 Buy6/23/15 $0.65 Buy
Initiated Coverage 6/23/16
0
0.2
0.4
0.6
0.8
1
Feb14
May14
Aug14
Nov14
Feb15
May15
Aug15
Nov15
Feb16
May16
Aug16
Nov16
Price History (C$) Target/Rating/Coverage Change
Lucara Diamond Corp. (LUC-T) Date Target(C$) Rating1/25/17 $3.50 Buy12/1/16 $3.00 Hold
11/10/16 $3.25 Hold8/8/16 $3.70 Hold8/2/16 $3.90 Hold
6/30/16 $3.90 Buy5/31/16 $4.40 Hold5/4/16 $4.10 Buy
3/15/16 $3.40 Buy1/12/16 $3.15 Buy12/3/15 $2.80 Buy8/13/15 $2.50 Buy4/28/15 $2.80 Buy
Initiated Coverage 04/28/15
00.5
11.5
22.5
33.5
44.5
5
Jan14
Apr14
Jul14
Oct14
Jan15
Apr15
Jul15
Oct15
Jan16
Apr16
Jul16
Oct16
Price History (C$) Target/Rating/Coverage Change
Lundin Gold Inc. (LUG-T) Date Target(C$) Rating1/25/17 $8.25 Buy7/11/16 $8.75 Buy5/31/16 $7.25 Buy12/8/15 $5.00 Buy
Initiated Coverage: 12/08/15
0123456789
10
Jan14
Apr14
Jul14
Oct14
Jan15
Apr15
Jul15
Oct15
Jan16
Apr16
Jul16
Oct16
Price History (C$) Target/Rating/Coverage Change
Marathon Gold Corporation (MOZ-T) Date Target(C$) Rating2/27/17 $1.50 Buy1/17/17 $1.10 Buy
Initiated Coverage: 1/17/2017
00.20.40.60.8
11.21.41.61.8
2
Feb14
May14
Aug14
Nov14
Feb15
May15
Aug15
Nov15
Feb16
May16
Aug16
Nov16
Price History (C$) Target/Rating/Coverage Change
Midas Gold Corp. (MAX-T) Date Target(C$) Rating1/25/17 $1.75 Buy7/11/16 $1.90 Buy5/31/16 $0.95 Buy4/21/16 $0.85 Buy3/11/16 $0.65 Buy1/12/16 $0.45 Hold7/15/15 $0.50 Hold1/27/15 $0.80 Buy1/9/15 $0.85 Buy
10/23/14 $1.15 Buy8/21/14 $1.30 Buy7/9/14 $1.40 Buy
Transferred and Re-initiated Coverage 11/05/13
00.20.40.60.8
11.21.41.61.8
2
Mar14
Jun14
Sep14
Dec14
Mar15
Jun15
Sep15
Dec15
Mar16
Jun16
Sep16
Dec16
Price History (C$) Target/Rating/Coverage Change
Mountain Province Diamonds Inc. (MPVD-T) Date Target(C$) Rating3/30/17 $7.00 Buy
10/17/16 $10.00 Buy3/31/16 $7.60 Buy1/12/16 $8.00 Buy7/15/15 $8.50 Buy2/19/15 $7.40 Buy2/5/15 $7.70 Buy
Initiated Coverage 02/05/15
0
2
4
6
8
10
12
Mar14
Jun14
Sep14
Dec14
Mar15
Jun15
Sep15
Dec15
Mar16
Jun16
Sep16
Dec16
Price History (C$) Target/Rating/Coverage Change
NewCastle Gold Ltd. (NCA-T) Date Target(C$) Rating1/10/17 $1.60 Buy
10/31/16 UR UR7/11/16 $1.20 Buy5/31/16 $0.80 Buy1/12/16 $0.45 Buy9/3/15 $0.30 Buy
7/15/15 $0.60 Buy1/27/15 $0.70 Buy
12/12/14 $0.65 Buy10/23/14 $0.75 Buy
7/9/14 $1.40 Buy4/16/14 $1.35 Buy
Initiated Coverage 11/28/13; Name changed to NewCastle Gold 06/30/15; Transfer of Coverage 10/20/2016
00.20.40.60.8
11.21.41.61.8
Feb14
May14
Aug14
Nov14
Feb15
May15
Aug15
Nov15
Feb16
May16
Aug16
Nov16
Price History (C$) Target/Rating/Coverage Change
NexGen Energy Ltd. (NXE-T) Date Target(C$) Rating2/27/17 $6.00 Buy1/25/17 $4.50 Buy4/14/16 $4.00 Buy3/30/16 $3.20 Buy1/12/16 $2.00 Buy11/5/15 $2.10 Buy
Initiated Coverage 11/05/15
0
1
2
3
4
5
6
7
Mar14
Jun14
Sep14
Dec14
Mar15
Jun15
Sep15
Dec15
Mar16
Jun16
Sep16
Dec16
Price History (C$) Target/Rating/Coverage Change

The Weekly Dig 3/31/17
Haywood Mining [email protected] Page 37
OceanaGold Corporation (OGC-T) Date Target(C$) Rating1/25/17 $5.75 Buy7/11/16 $6.50 Buy5/31/16 $4.40 Hold4/29/16 $4.35 Hold3/1/16 $3.80 Hold
2/19/16 $4.00 Hold10/2/15 $4.00 Buy7/15/15 $4.10 Buy4/30/15 $3.80 Buy2/20/15 $3.60 Buy1/27/15 $3.20 Buy
10/23/14 $3.30 Buy9/22/14 $3.50 Buy
Initiated Coverage 09/22/14
0
1
2
3
4
5
6
7
Jan14
Apr14
Jul14
Oct14
Jan15
Apr15
Jul15
Oct15
Jan16
Apr16
Jul16
Oct16
Price History (C$) Target/Rating/Coverage Change
Osisko Gold Royalties Ltd. (OR-T) Date Target(C$) Rating1/25/17 $18.25 Buy
10/20/16 $19.00 Buy7/11/16 $20.25 Buy3/2/16 $19.00 Buy
12/16/15 $18.75 Buy
Initiated Coverage 12/16/2015; Transfer of Coverage 10/20/2016
0
5
10
15
20
25
Jun14
Sep14
Dec14
Mar15
Jun15
Sep15
Dec15
Mar16
Jun16
Sep16
Dec16
Price History (C$) Target/Rating/Coverage Change
Osisko Mining Inc. (OSK-T) Date Target(C$) Rating3/17/17 $5.00 Buy
10/20/16 $4.00 Buy7/11/16 $4.00 Buy5/31/16 $3.00 Buy2/4/16 $2.00 Buy
12/10/15 $2.50 Buy
Initiated Coverage 12/10/2016; Transfer of Coverage 10/20/2016
0
1
2
3
4
5
6
7
Apr14
Jul14
Oct14
Jan15
Apr15
Jul15
Oct15
Jan16
Apr16
Jul16
Oct16
Jan17
Price History (C$) Target/Rating/Coverage Change
Pilot Gold Inc. (PLG-T) Date Target(C$) Rating10/20/16 $1.00 Buy7/11/16 $1.20 Buy5/31/16 $1.00 Buy1/12/16 $0.70 Buy7/15/15 $1.50 Buy1/29/15 $1.90 Buy1/27/15 $1.60 Buy
10/23/14 $1.70 Buy4/2/14 $2.00 Buy
Initiated Coverage 10/09/12; Transfer of Coverage 10/20/2016
0
0.5
1
1.5
2
2.5
Jan14
Apr14
Jul14
Oct14
Jan15
Apr15
Jul15
Oct15
Jan16
Apr16
Jul16
Oct16
Price History (C$) Target/Rating/Coverage Change
Richmont Mines Inc. (RIC-T) Date Target(C$) Rating1/25/17 $14.00 Buy7/11/16 $20.00 Buy5/31/16 $15.75 Buy5/13/16 $12.25 Buy4/13/16 $10.00 Buy3/7/16 $8.00 Buy
Initiated Coverage: 3/7/16
0
5
10
15
20
25
Feb14
May14
Aug14
Nov14
Feb15
May15
Aug15
Nov15
Feb16
May16
Aug16
Nov16
Price History (C$) Target/Rating/Coverage Change
Roxgold Inc. (ROG-V) Date Target(C$) Rating1/25/17 $2.00 Buy
10/20/16 $2.10 Buy7/11/16 $2.15 Buy5/31/16 $1.60 Buy4/28/16 $1.50 Buy7/15/15 $1.10 Buy11/5/14 $1.00 Buy7/9/14 $1.25 Buy
4/23/14 $1.15 Buy
Initiated Coverage 01/27/14; Transfer of Coverage 10/20/2016
0
0.5
1
1.5
2
2.5
Feb14
May14
Aug14
Nov14
Feb15
May15
Aug15
Nov15
Feb16
May16
Aug16
Nov16
Price History (C$) Target/Rating/Coverage Change
Sabina Gold & Silver Corp. (SBB-T) Date Target(C$) Rating1/25/17 $1.70 Buy6/16/16 UR UR (Buy)5/31/16 $1.65 Buy1/12/16 $1.00 Buy
12/15/15 $0.90 Buy
Initiated Coverage 12-15-15
00.20.40.60.8
11.21.41.61.8
2
Feb14
May14
Aug14
Nov14
Feb15
May15
Aug15
Nov15
Feb16
May16
Aug16
Nov16
Price History (C$) Target/Rating/Coverage Change
SEMAFO Inc. (SMF-T) Date Target(C$) Rating3/9/17 $5.50 Buy
1/25/17 $7.00 Buy11/10/16 $7.50 Buy7/11/16 $8.25 Buy5/12/16 $6.50 Buy2/26/16 $6.00 Buy7/15/15 $5.00 Buy1/27/15 $5.75 Buy
10/23/14 $6.25 Buy7/9/14 $6.50 Buy
4/16/14 $5.50 Buy3/13/14 $5.25 Buy
0123456789
Mar14
Jun14
Sep14
Dec14
Mar15
Jun15
Sep15
Dec15
Mar16
Jun16
Sep16
Dec16
Price History (C$) Target/Rating/Coverage Change

The Weekly Dig 3/31/17
Haywood Mining [email protected] Page 38
B: Buy; H: Hold; S: Sell; T: Tender; UR: Under Review
Source: Capital IQ and Haywood Securities
Tahoe Resources Inc. (THO-T) Date Target(C$) Rating3/13/17 $12.00 Hold1/25/17 $14.00 Hold11/4/16 $25.00 Buy8/11/16 $28.00 Buy7/11/16 $25.00 Buy5/9/16 $20.00 Buy
7/15/15 $16.50 Buy4/29/15 $19.25 Buy4/2/15 $16.00 Hold
1/27/15 $14.50 Sell12/5/14 $12.75 Sell11/7/14 $15.00 Sell
10/23/14 $17.25 Sell7/9/14 $18.75 Sell
5/12/14 $17.00 Sell
Initiated Coverage 11/05/13
0
5
10
15
20
25
30
35
Mar14
Jun14
Sep14
Dec14
Mar15
Jun15
Sep15
Dec15
Mar16
Jun16
Sep16
Dec16
Price History (C$) Target/Rating/Coverage Change
Uranium Participation Corporation (U-T) Date Target(C$) Rating1/25/17 $5.10 Buy
12/19/16 $5.80 Buy1/12/16 $6.80 Buy7/15/15 $6.50 Buy1/27/15 $6.20 Buy
10/23/14 $5.80 Buy7/9/14 $5.70 Buy
4/16/14 $6.60 Buy
Transferred & Re-initiated Coverage 08/20/12
0
1
2
3
4
5
6
7
8
Jan14
Apr14
Jul14
Oct14
Jan15
Apr15
Jul15
Oct15
Jan16
Apr16
Jul16
Oct16
Price History (C$) Target/Rating/Coverage Change
Uranium Energy Corp. (UEC-AMEX) Date Target(US$) Rating2/3/17 $2.40 Buy
1/25/17 $2.00 Buy5/31/16 $1.80 Buy7/15/15 $2.00 Buy6/24/15 $2.10 Hold7/8/14 $1.70 Hold
4/16/14 $2.00 Hold
Transferred & Re-initiated Coverage 08/20/12
0
0.5
1
1.5
2
2.5
3
3.5
Feb14
May14
Aug14
Nov14
Feb15
May15
Aug15
Nov15
Feb16
May16
Aug16
Nov16
Price History (US$) Target/Rating/Coverage Change