gold grades & gold costs - trench et al - feb 2015 - centre for exploration targeting /...
TRANSCRIPT

Gold Grades and Gold Costs
Exploding the High-Grade Myth
Allan Trench12 Matthew Kanakis23 & John Sykes12
1. Department of Mineral & Energy Economics, Curtin University
2. Centre for Exploration Targeting, Curtin University & University of Western Australia
3. Consultant, KPMG, Perth WA 6000

RIU Explorers Conference: Making Mines, Making Money
The Australian Gold Industry
• A ‘Rise & Stall’ scenario (or worse) for the Australian
gold industry is a material risk - despite discovery
exceptions of recent years (Andy Well, Tropicana)
• ‘Grade is King’ over-simplifies the sector’s mine
economics: If “Grade is King, Geology is the Ace”
• That is, publicly reported cost data from 50 mines
reveals that scale effects, orebody geometry &
mineralisation style are more important to deposit
economics than is grade between mines
25 Feb 2015
Gold Grades and Gold Costs: Exploding the High-Grade Myth
Slide 2 of 12

RIU Explorers Conference: Making Mines, Making Money
A case study of ‘geological-economics’ and
the challenges facing Australian gold
0
2
4
6
8
10
12
1989 1994 1999 2004 2009
Mil
lio
ns
of
ou
nc
es
Australian Production of Gold (1989-2013)
0
200
400
600
800
1000
1200
1400
1600
1800
US
D/o
un
ce
Increases in costs over time
GrowthCapex Cost
All-In-Costs
Gold Price
25 Feb 2015
Gold Grades and Gold Costs: Exploding the High-Grade Myth
Source: USGS and Taggart (2013)
Slide 3 of 12

RIU Explorers Conference: Making Mines, Making Money
Australian gold: About 50 mines with close to 50:50
underground to open pit split of production
25 Feb 2015
Gold Grades and Gold Costs: Exploding the High-Grade Myth
Fact Key Figure(s)/Mine example(s)
Total Australian and New Zealand Production Dec Half-
Year 2013 Recorded in the Study. 4,126,319 oz.
Percentage of Gold Production from Underground Mines 56%
Percentage of Gold Production from Open Pit Mines 44%
Percentage of Production that is Gold Only 72%
Percentage of Production that is Polymetallic 28%
Mined Grade Dec Half-Year 2013
Production-Weighted Average Gold Grade 3.26 g/t
Highest Grade Mine Andy Well (12.45 g/t)
Lowest Grade Mine Cadia Hill (0.36 g/t)
Cost Information Dec Half-Year 2013
Lowest Cost Mine Cadia Hill/Cadia East/Ridgeway $242/oz. (cash costs) $302/oz.
(AISC)
Highest Cost Mine Challenger $1427.64/oz. (cash costs) Henty $1527/oz. (AISC)
Lowest Cost Quartile Threshold (25th Percentile) $700/oz. (cash costs) $925/oz. (AISC)
Highest Cost Quartile Threshold (75th Percentile) $950/oz. (cash costs) $1205/oz. (AISC)
Source: Kanakis (2014)
Slide 4 of 12

RIU Explorers Conference: Making Mines, Making Money
How do you think a production cost versus grade
chart might look for Australian gold mines? This?
Co
sts
($A
U)
Grade (g/t)
25 Feb 2015
Gold Grades and Gold Costs: Exploding the High-Grade Myth
Source: Kanakis (2014)
Higher grade,
lower cost
mines
Lower grade,
higher cost
mines
Slide 5 of 12

RIU Explorers Conference: Making Mines, Making Money
It is actually not that simple:
High grade doesn’t equate to low cost!
25 Feb 2015
Gold Grades and Gold Costs: Exploding the High-Grade Myth
0
200
400
600
800
1000
1200
1400
1600
1800
2000
0.00 2.00 4.00 6.00 8.00 10.00 12.00 14.00
All
in
Su
sta
inin
g C
osts
($A
U)
Operating Grade Q4 (g/t)
Open Pit
Underground
Source: Kanakis (2014)
Slide 6 of 12

RIU Explorers Conference: Making Mines, Making Money
So what drives relative costs if not grade?
Deposit-type tells us little
• Orogenic Gold and Epithermal Au-Ag deposits gave variable results on the cost curves
• Porphyry deposits were very low cost except for Boddington
• Of the IOCG deposits the only figure available was a December Half Year Total Cash Cost for Prominent Hill, which was around the mean of the dataset
• There is not much to go with here……….
25 Feb 2015
Gold Grades and Gold Costs: Exploding the High-Grade Myth
Slide 7 of 12
RIU Explorers Conference: Making Mines, Making Money
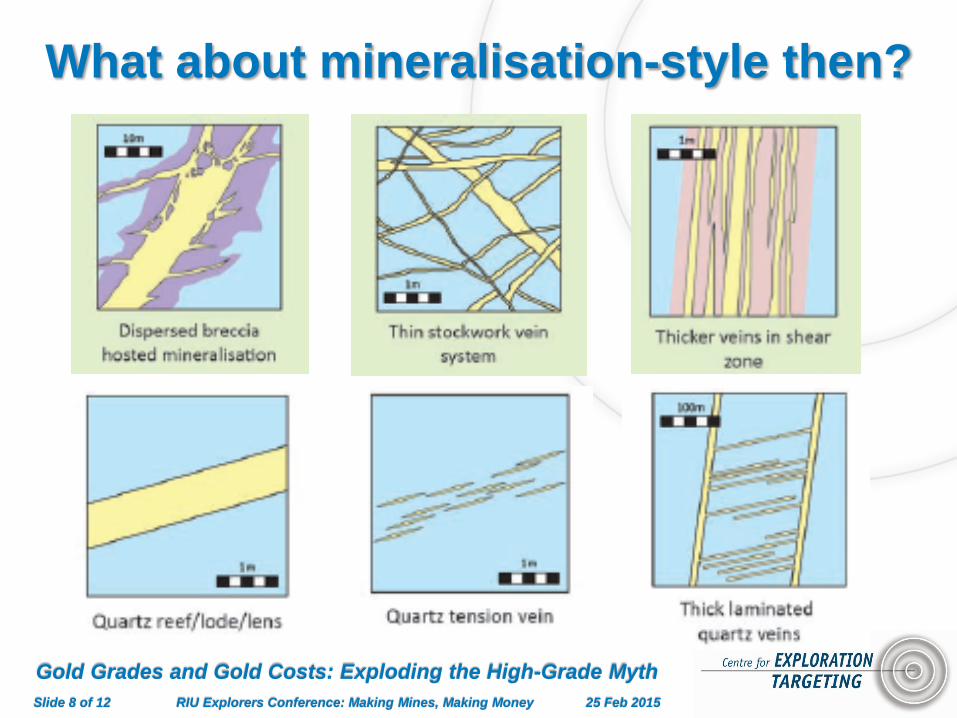
What about mineralisation-style then?
25 Feb 2015
Gold Grades and Gold Costs: Exploding the High-Grade Myth
Slide 8 of 12

RIU Explorers Conference: Making Mines, Making Money
Disseminated mineralisation appears
important
0.00%
10.00%
20.00%
30.00%
40.00%
50.00%
60.00%
70.00%
80.00%
90.00%
100.00%
Q1 Q2 Q3 Q4
Pro
du
cti
on
(%
of
qu
art
ile t
ota
l)
Percentage of deposits with different mineralisation style in
each cost quartile
Vein/Reef Style
Disseminated
• Deposits with more
disseminated style
mineralisation displayed lower
costs than those with vein/reef
style mineralisation
• Relationship especially evident
in the cash cost datasets.
25 Feb 2015
Gold Grades and Gold Costs: Exploding the High-Grade Myth
Source: Kanakis (2014)
Slide 9 of 12

RIU Explorers Conference: Making Mines, Making Money
Geometry clearly matters too: Lower
cost deposits are equidimensional • Deposits were defined
as equidimensional,
planar and cylindrical
shaped.
• Equidimensional
deposits gave much
lower costs than planar
and cylindrical deposits.
• Gently dipping planar
deposits also give lower
costs than steeply
dipping planar deposits.
25 Feb 2015
Gold Grades and Gold Costs: Exploding the High-Grade Myth
Planar Deposit
Cylindrical Deposit
Equidimensional
Deposit
Source: Kanakis (2014)
Slide 10 of 12

RIU Explorers Conference: Making Mines, Making Money
Contrasting geometries means that we likely
‘engineer-away’ grade advantage to reach
stopes
25 Feb 2015
Gold Grades and Gold Costs: Exploding the High-Grade Myth
Source: Kanakis (2014)
Slide 11 of 12

THANK YOU
For more information:
Centre for Exploration Targeting: www.cet.edu.au
Contact information:
Allan Trench: [email protected]
Matthew Kanakis: [email protected]
John P. Sykes: [email protected]