gold electrodeposition in organic media - tara: home
TRANSCRIPT
Accepted Manuscript
Gold electrodeposition in organic media
Lorena M.A. Monzon, Fiona Byrne, J.M.D. Coey
PII: S1572-6657(11)00132-9
DOI: 10.1016/j.jelechem.2011.03.010
Reference: JEAC 459
To appear in: Journal of Electroanalytical Chemistry
Received Date: 7 December 2010
Revised Date: 7 March 2011
Accepted Date: 10 March 2011
Please cite this article as: L.M.A. Monzon, F. Byrne, J.M.D. Coey, Gold electrodeposition in organic media, Journal
of Electroanalytical Chemistry (2011), doi: 10.1016/j.jelechem.2011.03.010
This is a PDF file of an unedited manuscript that has been accepted for publication. As a service to our customers
we are providing this early version of the manuscript. The manuscript will undergo copyediting, typesetting, and
review of the resulting proof before it is published in its final form. Please note that during the production process
errors may be discovered which could affect the content, and all legal disclaimers that apply to the journal pertain.
1
Gold electrodeposition in organic media
Lorena M. A. Monzon*, Fiona Byrne and J. M. D. Coey
School of Physics, Trinity College Dublin, Ireland
Abstract
Organic species are easily adsorbed onto metal electrodes, due to the high
surface energy. This principle is widely employed in electrodeposition to obtain
grains with a given shape and size. Electrodeposition in organic electrolytes and ionic
liquids is expected to produce deposits whose properties will be modified by the
nature of the species present in the bath. Here, we analyse the voltammetric profiles
for the reduction of two different gold complexes, tetrachloroaurate (III) ( −4AuCl ) and
dicyanoaurate (I) ( −2)(CNAu ), in dimethylsufoxide (DMSO) and in the ionic liquid
tributylmethylammonium bis(trifluoromethylsulfonyl)imide (TBMA+NTf2-). We
evaluate how organic cations present in the electrolyte modify not only the
voltammetric response but also the morphology of the deposits obtained. The films
range from very smooth with a rms roughness of ~ 10 nm for 500 nm film to rough
globular or facetted films with a crystalline size of ~ 200 nm.
Keywords
tetrabutylammonium, shape-control agent, SEM, AFM, voltammetry, kinetic constant.

2
1. Introduction
The electrodeposition of highly electropositive metals is performed in
electrolytic baths where high voltages are accessible. At present, materials such as Al,
La, Ta, Ga, Na and Si, among others, are deposited in organic electrolytes or ionic
liquids where the chemical stability of the organic species leads to a wider potential
window.1-6
Capping agents are used in electrodeposition to guide the growth of metal or
semiconductor crystals.7-19 These organic species adsorb onto electrodes and
electrodeposits as a result of the high surface energy of these materials, which
ultimately influence the shape of the growing grains. Therefore, the chemical nature
of the organic ions present in ionic liquids and organic electrolytes may have a strong
impact on the morphology of the deposits produced. To address this, we chose to
electrodeposit a noble metal, gold, because the films obtained remain stable after
exposure to air, allowing the morphology to be readily characterised.
We analyse the cyclic voltammograms of −4AuCl and −
2)(CNAu in
dimethylsulfoxide (DMSO) containing different electrolytes. The adsorption of
tetrabutylammonium (TBA+) onto the electrode surface is evaluated through the
electrochemical characterisation of the reduction of −4AuCl . The voltammetric
profiles are correlated with the SEM images of the films. Images of deposits grown in
the ionic liquid tributylmethylammonium bis(trifluoromethylsulfonyl)imide
(TBMA+NTf2-) are included for comparison. Although the electro-reduction of
−4AuCl in organic media has been reported,20-23 the physicochemical aspects of the
differences with its reduction in water were not discussed. Here, we analyse the
thermodynamic aspects involved during this process and their implications.
3
2. Experimental
Electrochemical measurements were carried out in a Braun 130 glovebox with
O2 level < 1 ppm and H2O 3-4 ppm using a CHI 660 potentiostat, with iR drop
compensation. A three-electrode arrangement was used. A gold disk 5mm diameter
was employed as the working electrode and platinum mesh as the counter electrode.
The reference electrode was a commercial silver wire in a capillary tube immersed in
the supporting electrolyte solution employed and separated from the analyte solution
by a porous frit. After each experiment, a ferrocene solution was added as an internal
standard to set the potential scale. The working electrode was polished prior to every
experiment with 1 µm, 0.3 µm and 0.05 µm alumina slurries on lapping pads,
followed by electrochemical cleaning in a 0.2 M H2SO4 solution purged with Argon:
potential pulses of 2 seconds at 2V and -2V vs. Ag/AgCl/0.1M Cl- were applied
during 1 minute. The electrode was rinsed with deionised water, carefully dried with
N2 and transported into the glovebox.
Dimethylsulfoxide (DMSO) anhydrous was dried with activated molecular
sieves, 4 Ǻ (Sigma). The molecular sieves were activated in a furnace at 350ºC during
1 day and added to the DMSO. The solvent was allowed to dry for one week and
stored in the glovebox. The supporting electrolytes employed were
tetrabutylammonium (TBA+) or potassium perchlorate (Sigma). They were dried at
70ºC under vacuum. Anhydrous potassium tetrachloroaurate (III) and potassium
dicyanoaurate (I) were obtained from Sigma and opened, weighted and always kept in
a dried atmosphere. TBMA+NTf2- ionic liquid was prepared via metathesis of
tributylmethylammonium chloride and lithium bis(trifluoromethylsulfonyl)imide, in
water. Gold salts soluble in the ionic liquid were synthesised in a similar fashion. An
aqueous solution of tributylmethylammonium chloride was added to an aqueous
4
solution of potassium tetrachloroaurate (III) or potassium dicyanoaurate (I) to produce
(TBMA+AuCl4-) or (TBMA+Au(CN)2
-) respectively. TBMA+AuCl4- precipitate as a
yellow solid and (TBMA+Au(CN)2-) separates from the aqueous solution as an oily
phase. TBMA+AuCl4- was purified by recrystallization and dried at 800C.
TBMA+Au(CN)2- and TBMA+NTf2
- were washed with water several times and dried
under vacuum at 800C overnight. For SEM images, the films were grown
potentiodynamically, on gold substrates with an exposed area of 1.13 cm2. The
Au/Si(100) subtrates were prepared by e-beam evaporation of 20 nm of chromium
followed by 100 nm of gold using a BOC Edwards Auto 500 evaporator (base
pressure: 5 10-7 mbar). Prior each electrodeposition, they were cleaned with H2O2 + 1
M KOH, followed by electrochemical stripping in 1 M KOH.24 The clean substrates
were blown with N2 and transported into the glovebox. Voltammetric simulations
were carried out, employing the Windows-based software supplied with the 660 CHI
potentiostat.
The surface topography and roughness (rms) of some of the resulting films
were also determined using an Asylum MFP-3D atomic force microscope (AFM).
Morphology and composition were studied by scanning electron microscopy (SEM)
and energy dispersive x-ray analysis (EDAX).
3. Results and discussion
3.1 Electrochemistry of −4AuCl
In aqueous solutions, the reduction of −4AuCl to metallic gold takes place via a
single three-electron process, 25-27. −2AuCl does not appear as an intermediate in
aqueous solutions because its formation is less favourable (the standard redox
potential for the reduction of −4AuCl to metallic gold is larger than to −
2AuCl ).
5
)2(926.022
)1(002.1430
)()(2)(4
0)()()(4
NHEvsVEClAuCleAuCl
NHEvsVEClAueAuCl
aqaqaq
aqsaq
=+→+
=+→+−−−−
−−−
In organic solvents 20,21 and ionic liquids 22,23, on the other hand, this reduction occurs
in two consecutive electrochemical steps, at two different potentials:
)4(2
)3(22
2)()(2
1)(2)(4
EClAueAuCl
EClAuCleAuCl
so
oo
−−−
−−−−
+→+
+→+
To the best of our knowledge, no physicochemical explanation has been given for this
difference. We think that a possible reason might be the poor solvation of Cl- ions in
aprotic solvents and ionic liquids. It is accepted that the solubility of small anions is
determined by the electron pair acceptability of the solvent, which in the case of
DMSO is 19.3 against 54.8 for water.28 Therefore, the solvation of DMSO towards
halide ions is predicted to be much weaker than it is in water, making the release of
four Cl- in one single step thermodynamically unlikely. In the case of ionic liquids,
the solubility of halides is mainly determined by supra-molecular interactions with the
cation of the ionic liquid. Given the low dielectric constant of ionic liquids, typically
~ 10,29,30 the ion-pair interactions are strong.31,32 It has been shown that even small
amounts of Cl- ions dissolved in ionic liquids increase their viscosity dramatically,33
which reflects the structuring effect exerted by such small hydrophilic ions. This is in
agreement with thermodynamic calculations that predict solvation entropies of halides
in ionic liquids to be negative.34 All this evidence indicates that the insertion of Cl- in
ionic liquids or aprotic solvents modifies the solvent environment unfavourably,
increasing the energy barrier of the overall electrochemical reaction. A similar
behaviour was reported in the electrochemistry of TiCl4 in ionic liquids, where the
impossibility of electrodepositing Ti was attributed to ‘kinetics and thermodynamic
barriers’ imposed by the media.35
6
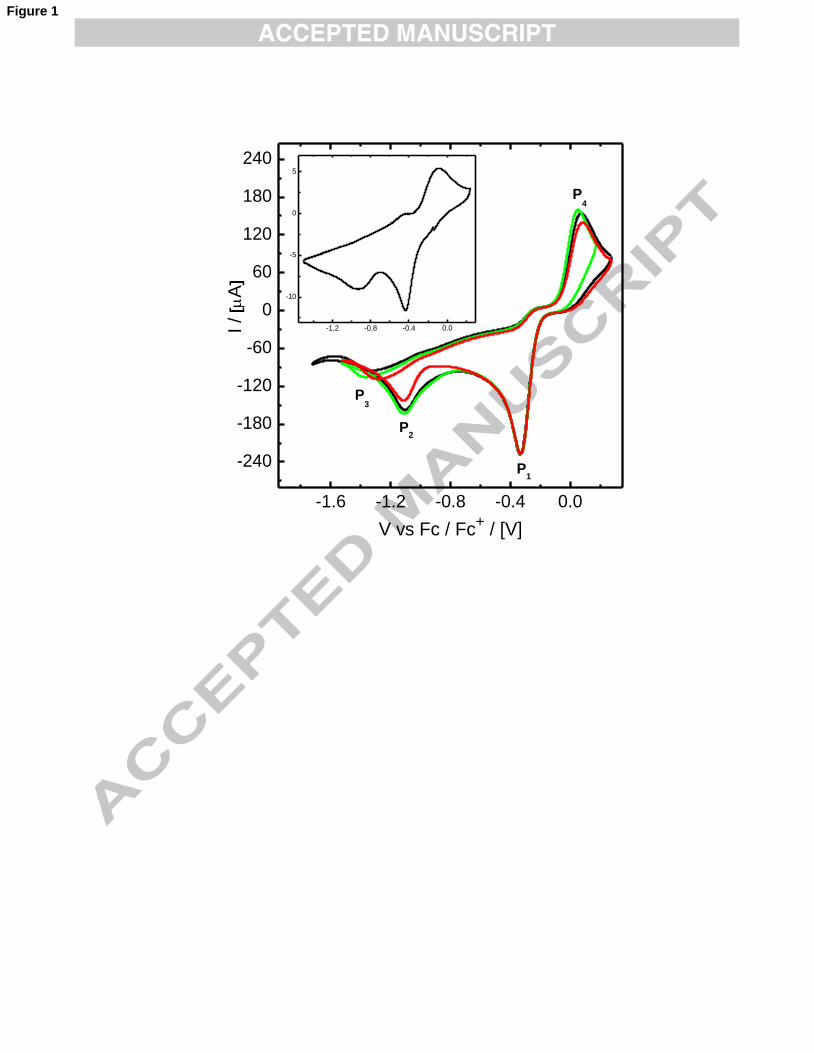
Fig. 1 shows cyclic voltammograms of −4AuCl in DMSO. In the figure, P1 and
P2 correspond to the reactions (3) and (4), respectively. Each cycle shown in the
figure is the first scan recorded in separated experiments, after the surface of the
electrode was previously polished. It can be noted that after the surface has been
polished the formation of the intermediate in solution, P1, is reproducible. On the
contrary, the formation of metallic gold, P2, is not. This fact indicates that the
electroreduction of −2AuCl to metallic gold is highly dependent on the surface
morphology of the polycrystalline working electrode. Moreover it has been reported
that it also depends on the electrode material.22 In the reverse scan, the cathodic peak
P3 shows the reactivation of the electrode. In general, this happens when inhibitory
species are removed from the surface leaving the electrode exposed again to more
gold electrodeposition, at potentials where the electrodeposition of gold is still
favourable. Contrary to what one might expect, P4 has been assigned to the oxidation
of Cl- to Cl2 rather than to the formation of −2AuCl or −
4AuCl , given that similar
anodic peaks were recorded with solutions containing only Cl-, at glassy carbon
electrodes.36 The stripping of gold to produce gold chloride complexes takes place at
much larger anodic overpotentials.21,22 The inset of the figure shows the voltammetric
response obtained in the ionic liquid TBMA+NTf2-. Although the voltamograms
recorded in DMSO and in TBMA+NTf2- are quite similar, the magnitude of the
current in the later case is considerably smaller. This is related to the high viscosity of
the medium.37,38
A detailed analysis of P1 will allow us to evaluate and quantify the interaction
of organic ions with the electrode surface. A series of experiments was carried out in
0.1 M KClO4 or using 0.1 M TBAClO4 as supporting electrolyte. In all cases, peak
current Ip1, and peak potential, Ep
1, values for the reduction of −4AuCl to −
2AuCl were

7
plotted against the square root of the scan rate, v, and log v, respectively. In Fig. 2a-b
are shown the experimental data obtained with KClO4 as supporting electrolyte. In all
cases, it was found that the electrochemical reduction of −4AuCl to −
2AuCl is
irreversible given that Ip1 vs v1/2 and Ep
1 vs log v are linear.39 Without organic ions, the
slope of Ep1 vs log v gives a n'αc value of 0.86 ± 0.04, where n’ represents the number
of electrons involved in the rate-determining step and αc the cathodic transfer
coefficient. Given that n'αc ≤ 1, it is deduced that the number of electrons involved in
the kinetic step is one, with αc = 0.86 ± 0.04.39 In other words, since the
electrochemical step P1 is a two-electron process, the transfer of one of the two
electrons is slow while the other one is fast. The diffusion coefficient (D) of −4AuCl in
DMSO was calculated from the slope of Ip1 vs v1/2 giving a value of (4.43 ± 0.03) 10-6
cm2 s-1, half of the one reported in water, 9.0 10-6 cm2 s-1.40 It is known that the
diffusion is strongly influenced by the viscosity (η) of the solvent. According to the
Stokes-Einstein equation D is inversely proportional toη. 41 Thus, it is deduced that in
more viscous solutions the diffusion will be slower. At 250C the viscosity of DMSO
and water are 1.99 mPa s 42 and 0.89 mPa s 43, respectively, which predicts OHD2
values almost two times larger than DMSOD , in agreement with the value determined
here.
The standard kinetic constant (k0) for the reduction of −4AuCl to −
2AuCl can
be calculated from the intercept of a plot of lnIp1 vs. (Ep - E0), which is
)227.0ln( 0knFAC∞ , where E0 is the standard redox potential, n the total number of
electrons involved in the electrochemical reaction, F the Faraday constant, A the area
of the electrode and C∞ the concentration of −4AuCl in the solution.39 However, since
E0 is not known, the potential where the reaction starts, Erxn, was used instead,44 as
8
recommended by Nicholson and Shain.45 In the absence of organic ions, the k0 value
derived was (1.2 ± 2) 10-5 cm s-1. From the slope of the graph, (n'αcF/RT) n'αc is 0.77
± 0.03, close to 0.86 ± 0.04 obtained by linear regression of Ep vs log v. Voltammetric
simulations like the ones shown in Fig. 2d corroborate the accuracy of the parameters
calculated. Details on the way the electrochemical parameters n'αc, k0 and D are
calculated can be found in ref. 44.
The use of bulky organic cations in the supporting electrolyte can lead to
interesting changes in the electrochemical profiles and modify the surface
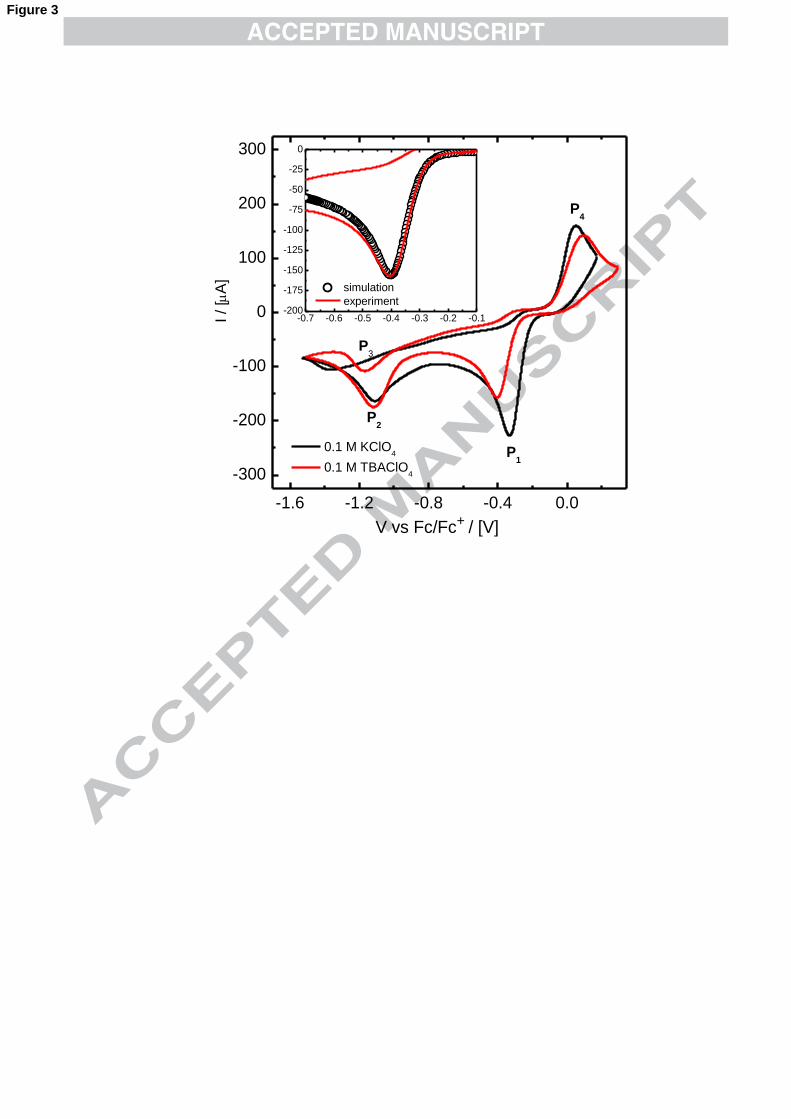
morphology of the electrodeposits. Fig. 3 shows the cyclic voltammograms recorded
in solutions containing the same −4AuCl concentration. Black and red lines were
obtained when KClO4 or TBAClO4 were employed as electrolytes. As it can be seen
in the figure, TBA+ causes a marked shift of Ep1 towards more cathodic potentials, a
decrease in the overall current and a less steep increase in the current at low over-
potentials. It has been reported that, given its hydrophobicity, TBA+ modifies the
double layer capacity of gold electrodes 46 and for the same reason; it protects
titanium against chemical etching.47 At more cathodic potentials the accumulation of
TBA+ at the surface should increase, modifying in turn nucleation processes. Its
interaction with the electrode surface has two effects. First, the decrease in 1pI value
observed is mainly caused by a reduction of the exposed surface area, which it is
estimated by comparison of the slopes of the graphs 1pI vs. v1/2 for the experiments
carried out in KClO4 in DMSO and in TBAClO4 in DMSO. Our results indicate that ~
34 % of the working electrode is covered by TBA+ at ~ -0.3 V. Such large coverage of
the surface leads to the second observation, the shift in Ep1, which reflects the
hindrance of the electrochemical reduction of −4AuCl to −
2AuCl . That is, the partial
9
adsorption of this large hydrophobic cation slows down the rate of the electron
transfer process. It is important to point out that these effects are only significant
because the reduction of −4AuCl takes place quite below the potential of zero charge,
where the adsorption of hydrophobic cations is significant.48 The k0 value calculated
for the reduction of −4AuCl to −
2AuCl with TBA+ in the electrolyte was (2.2 ± 1) 10-6
cm s-1, around one order of magnitude smaller than in its absence. Simulations were
performed employing these electrochemical parameters, leading to a good agreement
with the experimental profiles (see inset Fig. 3). It seems that TBA+ slows down
electron transfer reactions but it is only perceptible in already kinetically controlled
processes.49,50 The influence of TBA+ on the morphology of gold electrodeposits will
be discussed in section 3.3.
3.2 Electrochemistry of −2)(CNAu
Gold was also electrodeposited from organic solutions containing −2)(CNAu .
The electro-reduction of −2)(CNAu takes place at more negative potentials than
−4AuCl because −
2)(CNAu is very stable. According to several authors, the reduction
of −2)(CNAu to metallic gold in water follows two different mechanisms. At low
overpotentials, −2)(CNAu first adsorbs at the surface, and then it reduces to Au(s).51-54
)6(
)5()(
)(
)(2
−−
−−
+→+
+→
CNAueAuCN
CNAuCNCNAu
sad
adw
whereas at higher overpotentials the reduction proceeds in one step,
)7(2)( )()(2−−− +→+ CNAueCNAu sw
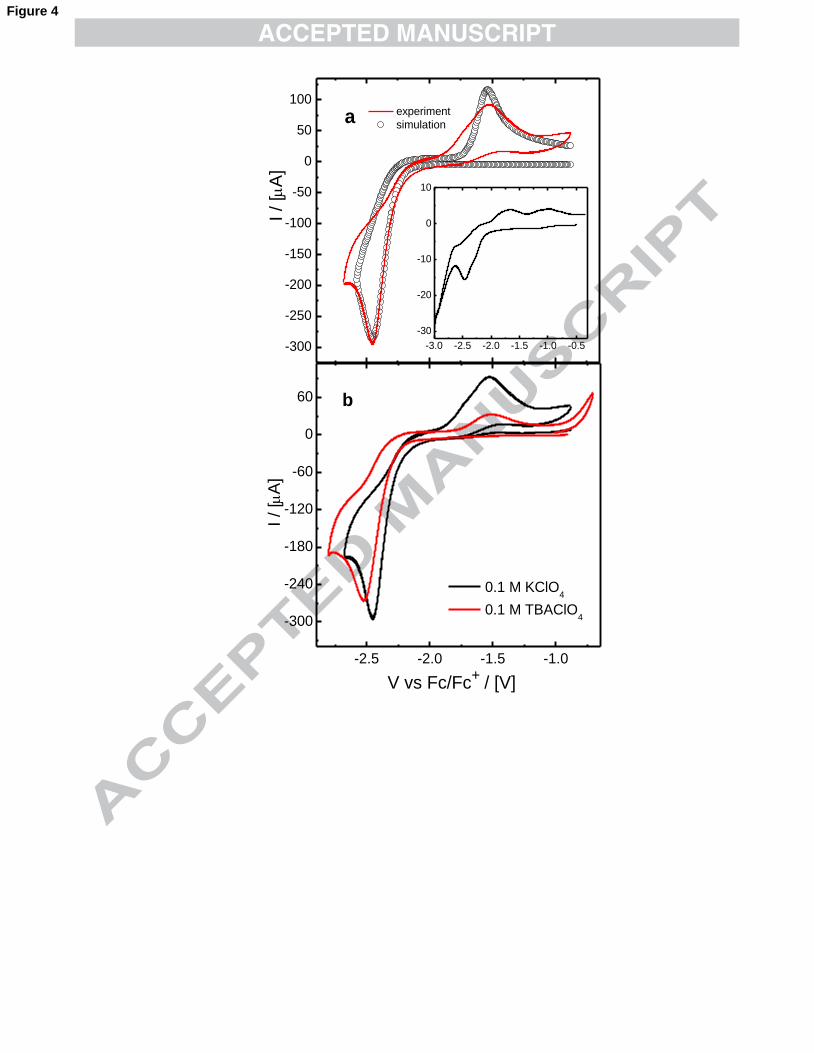
In DMSO, only one cathodic peak is recorded (~ -2.5 V) which suggests at
first that the reduction of −2)(CNAu follows only one electrochemical path. (See Fig.
10
4a, red line) The plots of Ip vs v1/2 and Ep vs log v are linear which, together with the
difference between the anodic and cathodic peaks of ~ 1 V indicates that this reaction
is electrochemically irreversible. However, the simulations obtained with the
electrochemical parameters derived from plots equivalent to the ones shown in Fig. 2
do not match the experimental profiles (Fig. 4a). At low overpotentials, it can be seen
that the current of the experimental curve is larger than the one in the simulation.
Besides, on the experimental curve, there are two overlapping anodic peaks on the
reversed scan. These profiles were reproducible every time the gold surface is
polished, which indicates that these differences cannot be attributed to preferred
electrodeposition and growth on different facets. Consequently, the cathodic peak for
the reduction of −2)(CNAu must be the result of processes (6) and (7) taking place
simultaneously. In the ionic liquid TBMA+NTf2-, on the other hand, these two
reactions take place at slightly more different potentials, since two separated peaks
appear overlapped (see inset Fig. 4a). Given that reactions (6) and (7) cannot be
studied separately, no reliable electrochemical parameters were derived from these
experiments.
As it was noted before in the reduction of −4AuCl to −
2AuCl , the
voltammograms recorded with TBA+ in the solution also exhibit a shift of Ep towards
more cathodic potentials and a decrease in the overall current (Fig. 4b).
3.3 Morphology of films produced in −4AuCl and −
2)(CNAu and solutions
To analyse the effect of the organic media on gold electrodeposits, films were
grown keeping the concentration constant (10 mM) while the electrolyte nature was
changed. In Fig. 5 are the SEM images of films produced from −4AuCl baths and in
Fig. 6 those obtained from −2)(CNAu solutions. Each row corresponds to films grown
11
at the same applied potential: those at the top were deposited in the kinetic-controlled
regime, while those at the bottom were produced under diffusion-controlled
conditions.
It is well established that the quality and properties of gold electrodeposits is
strongly influenced by the nature of the complex employed.55,56 For instance, in the
kinetic-controlled regime, the deposits produced by the reduction of −4AuCl (Fig. 5a-
c) have uneven grain growth, while the films obtained from −2)(CNAu solutions are
more uniform (Fig. 6a-c). As it was mentioned earlier, the reduction of −2AuCl to
metallic gold is strongly dependent on surface morphology of the electrode, given that
P2 is not reproducible after the electrode has been polished (See Fig. 1). This together
with the in-plane image of the deposits obtained at low overpotentials (Fig. 5a-c)
indicates that the local facets present in the substrate lead to a preferential nucleation
and growth of certain grains. Baker et. al.57 have recently shown that the bonding
between Cl and the Au(111) surface is primarily covalent while with the other faces
remain ionic. Thus, the shielding effect of Cl chemically adsorbed onto Au(111) will
produce different growth rates of the crystallite facets. It is worth mentioning that at
higher overpotentials, this wide size distribution of the grains is only maintained in
the absence of organic cation species (compare left column in Fig. 5 with the middle
and right columns in the same figure).
Left, middle and right columns in Fig. 5 and 6 are the images of deposits
produced in solutions containing K+, TBA+ and TBMA+, respectively. In Section 3.1
it was estimated that TBA+ present in the electrolyte covers at least 34% of the
electrode surface. Therefore, the electrodeposits formed will preferentially grow on
the bare areas of the electrode. In the Figures, this is seen as an increase in roughness.
There is also a change in the grain shape. The almost planar cross–like conformation

12
of TBA+ 58,59 leads to the formation of star-shape lamellae or rosette deposits (Fig. 5b,
e and g; and Fig. 6b and e). The right column of Fig. 5 and 6 are the images for
deposits produced when TBMA+ is in the electrolyte. TBMA+ is similar to TBA+ but
with one of its four chains shorter, which resembles a T-shape.60 When the deposits
are obtained from the reduction of −4AuCl , the gold particles formed seem to be
polyhedral rather than spherical (Fig. 5c). When the electrodeposition is carried out in
solutions containing −2)(CNAu , small rectangular grains can be distinguished (Fig. 6c).
These polyhedral features could be caused by the particular T-shape of TBMA+
adsorbed at the electrode surface, although the high viscosity of the ionic liquid could
favour selectivity towards the formation of crystalline structures.61,62 The deposits
shown at the bottom row in Fig. 6 are produced at potentials where the organic
species present in the electrolyte are being reduced as well. They are fibrous sponge-
like films.
The roughening effect of TBA+ was evaluated by AFM. The smoothest films
produced are those from −2)(CNAu in DMSO, grown under the kinetic-controlled
regime. The reproducibility of the voltammogram after polishing the electrode
(section 3.2) seems to indicate that the deposition is not influenced by the surface
morphology, which could be the reason why these deposits are quite smooth (rms
roughness obtained for these films is ~10 nm for a film thickness of ~ 0.5 µm. Film
thicknesses were obtained by Faraday’s law). Fig. 7a shows a (1 µm x 1 µm) section
of this type of deposits. By contrast, the same deposition carried out in the presence of
TBA+ produces rougher films with a rms roughness of ~ 70 nm.
13
4. Conclusions
The electrodeposition of gold in several organic media was explored. Analysis
of the voltammetric profiles and SEM images of the films obtained in the different
electrolytes allowed us to understand the role of organic ions on the kinetics and
morphology of the deposits produced.
The differences found between the electrochemical reduction of −4AuCl in
water and DMSO and ionic liquids were explained in terms of the solvation entropy
of the released Cl- anions and weak electron pair acceptability of the media.
The adsorption of TBA+ at the electrode surface was shown to cover at least
34 % of the total surface area. A decrease of one order of magnitude in the kinetic
constant for the reduction of −4AuCl to −
2AuCl was calculated.
Organic ions strongly influence the shape of grains and roughness of gold
electrodeposits. This is a key fact to take into account when employing organic media
for electrodeposition.
Since electro-catalysis is highly dependent on the presence of active surface
states and the morphology of the deposits, some of the baths presented here could be
employed to grow rough electrodes for electro-catalytic applications, such as in fuel
cells.63,64
Acknowledgments
This work was supported by Science Foundation Ireland as part of the MANSE
project 05/IN/1850 and on contract RFP OD/RFP/PHY2372. This work was also
supported by the FP7 NAMDIATREAM project.
14
References
[1] E. M. Moustafa, S. Zein El Abedin, A. Shkurankov, E. Zschippang, A.Y. Saad, A.
Bund, F. Endres, J. Phys. Chem. B, 111 (2007) 4693-4704.
[2] S. Legeai, S. Diliberto, N. Stein, C. Boulanger, J. Estager, N. Papaiconomou, M.
Draye, Electrochem. Comm., 10 (2008) 1661-1664.
[3] L. H. S. Gasparotto, N. Borisenko, O. Höfft, R. Al-Salman, W. Maus-Friedrichs,
N. Bocchi, S. Zein El Abedin, F. Endres, Electrochim. Acta, 55 (2009) 218-226.
[4] T. Munisamy, A.J. Bard, Electrochim. Acta, 55 (2010) 3797-3803.
[5] R. Wibowo, L. Aldous, E. I. Rogers, S. E. Ward Jones, R. G. Compton, J. Phys.
Chem. C, 114 (2010) 3618-3626.
[6] A. Ispas, B. Adolphi, A. Bund, F. Endres, Phys. Chem. Chem. Phys., 12 (2010)
1793-1803.
[7] Y. Guo, Q. Liao, J. Zhang, D. Xu, J. Phys. Chem. B, 109 (2005) 13519-13522.
[8] S. Jiao, F. Sun, Y. Guo, W. Song, J. Zhao, L. Tang, Z. Wang, J. Crystal Growth,
304 (2007) 425-429.
[9] M. Min, C. Kim, Y.I. Yang, J. Yi, H. Lee, Phys. Chem. Chem. Phys., 11 (2009)
9759-9765.
[10] L. Xu, L. Xu, K. Hu, J. Li, S. Gao, D Xu, J. Phys. Chem. C, 114 (2010) 269-273.
[11] H. Sato, T. Homma, H. Kudo, T. Izumi, T. Osaka, S. Shoji, J. Electroanal. Chem.
584 (2005) 28–33.
[12] M. A. Pasquale, L. M. Gassa, A. J. Arvia, Electrochim. Acta, 53 (2008) 5891-
5904.
[13] G. Wei, H. Ge, X. Zhu, Q. Wu, J. Yu, B. Wang, Appl. Surf. Sci., 253 (2007)
7461-7466.
[14] A. Dolati, A. Afshar, H. Ghasemi, Mater. Chem. Phys., 94 (2005) 23-28.
15
[15] L. Liao, W. Liu, X. Xiao, J. Electroanal. Chem. 566 (2004) 341–350.
[16] J. H. Yang, J. C. Lin, T. K. Chang, X. B. You, S. B. Jiang, J. Micromech.
Microeng., 19 (2009) 025015 (1-12).
[17] A. M. Rashidi, A. Amadeh, Surf. Coat. Technol., 204 (2009) 353-358.
[18] A. L. Portela, G. I. Lacconi, M. López Teijelo, J. Electroanal. Chem., 495
(2001)169-172.
[19] R. Fukui,Y. Katayama, T. Miura, Electrochim. Acta, 58 (2011) 1196.
[20] A. D. Goolsby, D. T. Sawyer, Anal. Chem., 40 (1968) 1978-1983.
[21] U. Koelle, A. Laguna, Inor. Chim. Acta, 290 (1999) 44-50.
[22] L. Aldous, D. S. Silvester, C. Villagran, W. R. Pitner, R. G. Compton, M. C.
Lagunas, C. Hardacre, New J. Chem, 30 (2006) 1576-1583.
[23] L. Aldous, D. S. Silvester, W. R. Pitner, R. G. Compton, M. C. Lagunas, C.
Hardacre, J. Phys. Chem. C, 111 (2007) 8496-8503.
[24] L. M. Fisher, M. Tenje, A. R. Heiskanen, N. Masuda, J. Castillo, A. Bentien, J,
Emneus, M. H. Jakobsen, A. Boisen, J. Microel. Eng., 86 (2009) 1282-1285.
[25] K. B. Holt, G. Sabin, R. G. Compton, J. S. Foord, F. Marken, Electroanalysis, 14
(2002) 797-803.
[26] O. M. Magnussen, K. Krug, A. H. Ayyad, J. Stettner, Electrochim. Acta, 53
(2008) 3449-3458.
[27] L. Komsiyska, G. Staikov, Electrochim. Acta, 54 (2008) 168-172.
[28] K. Wakabayashi, Y. Maeda, K. Ozutsumi, H. Ohtaki, J. Molec. Liq., 110 (2004)
43-50.
[29] G. Sese, E. Guardia, J. A. Padro, J. Phys. Chem., 99 (1995) 12647-12654.
[30] N. Sieffert, G. Wiff, J. Phys. Chem. B, 111 (2007) 7253-7266.

16
[31] H. Weingartner, A. Oleinikova, C. Wakai, C. Daguenet, P. J. Dyson, I. Krossing,
J. M. Slattery, J. Phys. Chem. B, 110 (2006) 12682-12688.
[32] I. Krossing, J. M. Slattery, C. Daguenet, P. J. Dyson, A. Oleinikova, H.
Weingartner, J. Am. Chem. Soc., 128 (2006) 13427-13434.
[33] K. R. Seddon, A. Stark, M. J. Torres, Pure Appl. Chem., 72 (2000) 2275-2287.
[34] S. Bruzzone, M. Malvaldi, C. Chiappe, J. Chem. Phys., 129 (2008) 074509 (1-9).
[35] F. Endres, S. Zein El Abedin, A. Y. Saad, E. M. Moustafa, N. Borissenko, W. E.
Price, G. G. Wallace, D. R. MacFarlane, P. J. Newmanc, A. Bundd, Phys. Chem.
Chem. Phys., 10 (2008) 2189–2199.
[36] C. Villagran, C. E. Banks, C. Hardacre, R. G. Compton, Anal. Chem., 76 (2004)
1998-2003.
[37] M. C. Buzzeo, C. Hardacre, R. G. Compton, Anal. Chem., 76 (2004) 4583-4588.
[38] S. R. Belding, E. I. Rogers, R. G. Compton, J. Phys. Chem. C, 113 (2009) 4202-
4207.
[39] C. M. A. Brett, A. M. Oliveira Brett in Electrochemistry. Principles, Methods and
Applications, Oxford University Press, 2000, pp. 179-182.
[40] H. Martın, P. Carro, A. Hernandez Creus, S. Gonzalez, R. C. Salvarezza, A. J.
Arvia, Langmuir 13 (1997) 100-110.
[41] N. G. Tsierkezos, J Solution Chem, 36 (2007), 289-302.
[42] E. W. Flick, Handbook of industrial solvents, 5th edition, Noyres Data
Corporation, New Jersey, 1998;
[43] R. C. Weast, Handbook of Chemistry and Physics, 53rd, The Chemical Rubber
Co, Ohio, 1972.
[44] L. M. A. Monzón, J. Electroanal. Chem., 648 ( 2010), 47-53.
[45] R. S. Nicholson, I. Shain, Anal. Chem. 36 (1964) 706-723.
17
[46] A. Tymosiak-Zielinska, Z. Borkowska, Electrochim Acta, 46 (2000) 3073-3082.
[47] K. Shankar, G. K. Mor, A. Fitzgerald, C. A. Grimes, J Phys. Chem. C, 111
(2007) 21-26.
[48] N. Serizawa, Y. Katayama, T. Miura, Electrochim. Acta, 56 (2010) 346–351.
[49] T. Nishiumi, Y. Chimoto, Y. Hagiwara, M. Higuchi, K. Yamamoto,
Macromolecules, 37 (2004) 2661-2664.
[50] L. Pospisil, M. Hromadova, R. Sokolova, J. Bulickova, N. Fanelli, Electrochim.
Acta, 53 (2008) 4852-4858.
[51] J. A. Harrison, J. Thompson, J. Electroanal. Chem., 40 (1972) 133-142.
[52] B. Bozzini, B.J. Hwang, R. Santhanam, Y.L. Lin, Electroanalysis, 15 (2003)
1667-1676;
[53] B. Bozzini, G. P. De Gaudenzi, C. Mele, J. Electroanal. Chem., 563 (2004) 133-
143.
[54] B. Bozzini, C. Mele, V. Romanello, J. Electroanal. Chem., 592 (2006) 25-30.
[55] M. Kato, Y. Okinaka, Gold Bull., 37 (2004) 37-44.
[56] T. A. Green, Gold Bull., 40 (2007) 105-114.
[57] T. A. Baker, C. M. Friend, E. Kaxiras, J. Am. Chem. Soc., 130 (2008) 3720-
3721.
[58] J. Lipkowski, V. Y. Komarov, T. V. Rodionova, Y. A. Dyadinb, L. S. Aladkob,
J. Supramol. Chem., 2 (2002) 435-439.
[59] P. D. C. Dietzela, M. Jansenb, Z. Anorg. Allg. Chem., 632 (2006) 2276-2280.
[60] S. Katsuta, H. Wakabayashi, M. Tamaru, Y. Kudo, Y. Takeda, J Sol. Chem, 36
(2007) 531-547.
[61] N. Tachikawa, N. Serizawa, Y. Katayama, T. Miura, Electrochim. Acta 53
(2008) 6530–6534.
18
[62] C. Zhao, D. R. MacFarlane, A. M. Bond, J. Am. Chem. Soc. 131 (2009) 16195–
16205.
[63] D. Cameron, R. Holliday, D. Thompson, J. Power Sources, 118 (2003) 298-303.
[64] A. P. O’Mullane, S. J. Ippolito, Y. M. Sabri, V. Bansal, S. K. Bhargava,
Langmuir, 25 (2009) 3845-3852.
Fig. Captions
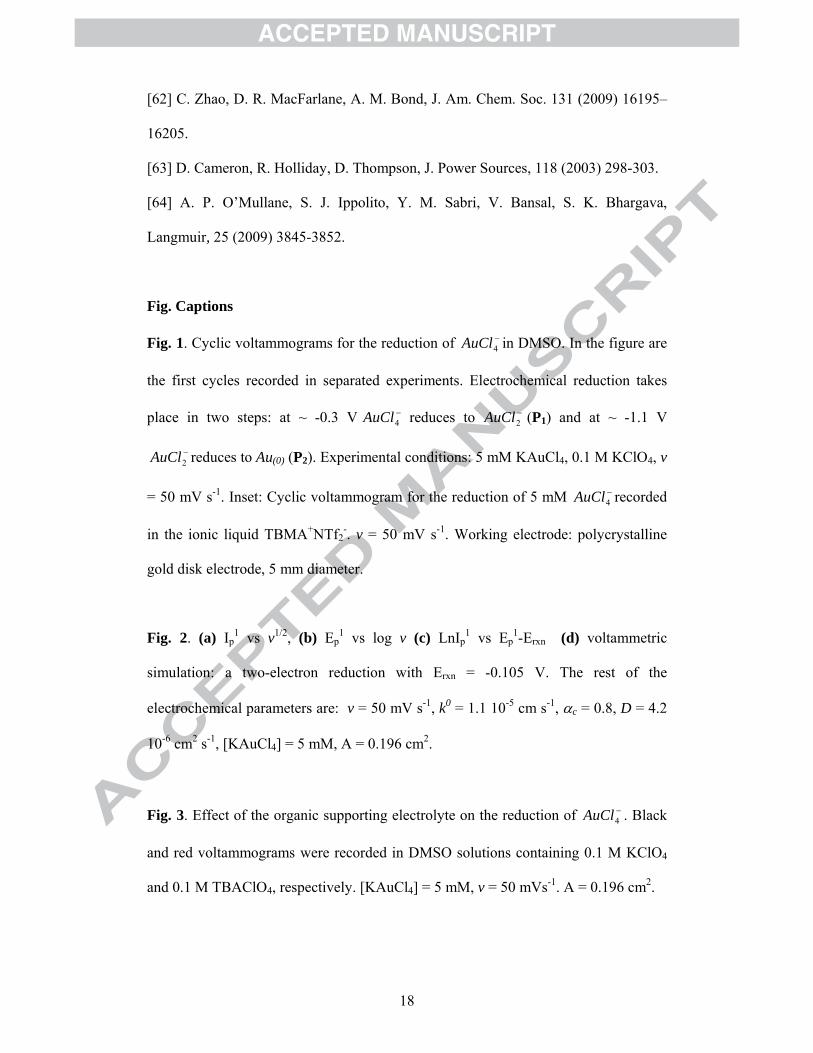
Fig. 1. Cyclic voltammograms for the reduction of −4AuCl in DMSO. In the figure are
the first cycles recorded in separated experiments. Electrochemical reduction takes
place in two steps: at ~ -0.3 V −4AuCl reduces to −
2AuCl (P1) and at ~ -1.1 V
−2AuCl reduces to Au(0) (P2). Experimental conditions: 5 mM KAuCl4, 0.1 M KClO4, v
= 50 mV s-1. Inset: Cyclic voltammogram for the reduction of 5 mM −4AuCl recorded
in the ionic liquid TBMA+NTf2-. v = 50 mV s-1. Working electrode: polycrystalline
gold disk electrode, 5 mm diameter.
Fig. 2. (a) Ip1 vs v1/2, (b) Ep
1 vs log v (c) LnIp1 vs Ep
1-Erxn (d) voltammetric
simulation: a two-electron reduction with Erxn = -0.105 V. The rest of the
electrochemical parameters are: v = 50 mV s-1, k0 = 1.1 10-5 cm s-1, αc = 0.8, D = 4.2
10-6 cm2 s-1, [KAuCl4] = 5 mM, A = 0.196 cm2.
Fig. 3. Effect of the organic supporting electrolyte on the reduction of −4AuCl . Black
and red voltammograms were recorded in DMSO solutions containing 0.1 M KClO4
and 0.1 M TBAClO4, respectively. [KAuCl4] = 5 mM, v = 50 mVs-1. A = 0.196 cm2.
19
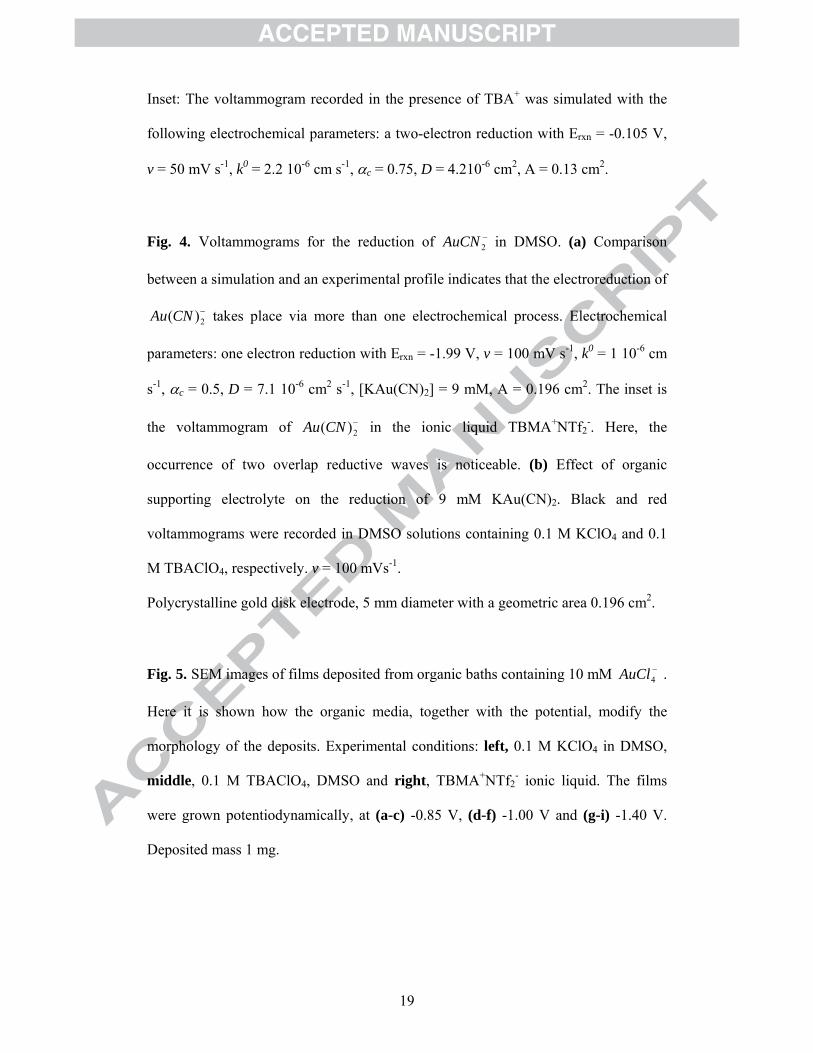
Inset: The voltammogram recorded in the presence of TBA+ was simulated with the
following electrochemical parameters: a two-electron reduction with Erxn = -0.105 V,
v = 50 mV s-1, k0 = 2.2 10-6 cm s-1, αc = 0.75, D = 4.210-6 cm2, A = 0.13 cm2.
Fig. 4. Voltammograms for the reduction of −2AuCN in DMSO. (a) Comparison
between a simulation and an experimental profile indicates that the electroreduction of
−2)(CNAu takes place via more than one electrochemical process. Electrochemical
parameters: one electron reduction with Erxn = -1.99 V, v = 100 mV s-1, k0 = 1 10-6 cm
s-1, αc = 0.5, D = 7.1 10-6 cm2 s-1, [KAu(CN)2] = 9 mM, A = 0.196 cm2. The inset is
the voltammogram of −2)(CNAu in the ionic liquid TBMA+NTf2
-. Here, the
occurrence of two overlap reductive waves is noticeable. (b) Effect of organic
supporting electrolyte on the reduction of 9 mM KAu(CN)2. Black and red
voltammograms were recorded in DMSO solutions containing 0.1 M KClO4 and 0.1
M TBAClO4, respectively. v = 100 mVs-1.
Polycrystalline gold disk electrode, 5 mm diameter with a geometric area 0.196 cm2.
Fig. 5. SEM images of films deposited from organic baths containing 10 mM −4AuCl .
Here it is shown how the organic media, together with the potential, modify the
morphology of the deposits. Experimental conditions: left, 0.1 M KClO4 in DMSO,
middle, 0.1 M TBAClO4, DMSO and right, TBMA+NTf2- ionic liquid. The films
were grown potentiodynamically, at (a-c) -0.85 V, (d-f) -1.00 V and (g-i) -1.40 V.
Deposited mass 1 mg.
20
Fig. 6. SEM images of films deposited from organic baths containing 10 mM
−2)(CNAu . The morphology of the deposits depends on the nature of the organic
media, as well as the deposition rate. Experimental conditions: left, 0.1 M KClO4 in
DMSO, middle, 0.1 M TBAClO4, DMSO and right, TBMA+NTf2- ionic liquid. The
films were grown potentiodynamically, at (a-c) -2.20 V, (d-f) -2.50 V and (g-i) -3.00
V. Deposited mass 1 mg.
Fig. 7. The roughening effect of TBA+ is demonstrated by AFM images. The deposits
shown were produced from bath containing 10 mM −2)(CNAu in DMSO, with (a)
KClO4 and (b) TBAClO4 as electrolytes. Rms roughness increases from (a) 14 ± 2 nm
to (b) 68 ± 5 nm.
-1.6 -1.2 -0.8 -0.4 0.0
-240
-180
-120
-60
0
60
120
180
240
-1.2 -0.8 -0.4 0.0
-10
-5
0
5
I / [
A]
V vs Fc / Fc+ / [V]
P4
P3
P2
P1
Figure 1

-1.6 -1.5 -1.4 -1.3 -1.2 -1.1 -1.0 -0.9 -0.8
-0.35
-0.34
-0.33
-0.32
E1 p /
[V]
log v
b
-0.22 -0.21 -0.20 -0.19
-8.6
-8.4
-8.2
-8.0
-7.8
-7.6
Ln(I1 p /
A)
E1p - Erxn / [V]
c
-0.5 -0.4 -0.3 -0.2 -0.1 0.0-240
-200
-160
-120
-80
-40
0
I / [
A]
V vs Fc/Fc+ / [V]
experiment simulation
d
0.0 0.1 0.2 0.3 0.40
50
100
150
200
250
300
350
400
I1 p / [
A]
v1/2 / [V1/2 s-1/2]
a
Figure 2
-1.6 -1.2 -0.8 -0.4 0.0
-300
-200
-100
0
100
200
300
-0.7 -0.6 -0.5 -0.4 -0.3 -0.2 -0.1-200
-175
-150
-125
-100
-75
-50
-25
0
P4
P3
P2
I / [
A]
V vs Fc/Fc+ / [V]
0.1 M KClO4
0.1 M TBAClO4
P1
simulation experiment
Figure 3
-300
-250
-200
-150
-100
-50
0
50
100
-3.0 -2.5 -2.0 -1.5 -1.0 -0.5-30
-20
-10
0
10
I / [
A]
experiment simulation
a
-2.5 -2.0 -1.5 -1.0
-300
-240
-180
-120
-60
0
60
I / [
A]
V vs Fc/Fc+ / [V]
0.1 M KClO4 0.1 M TBAClO4
b
Figure 4
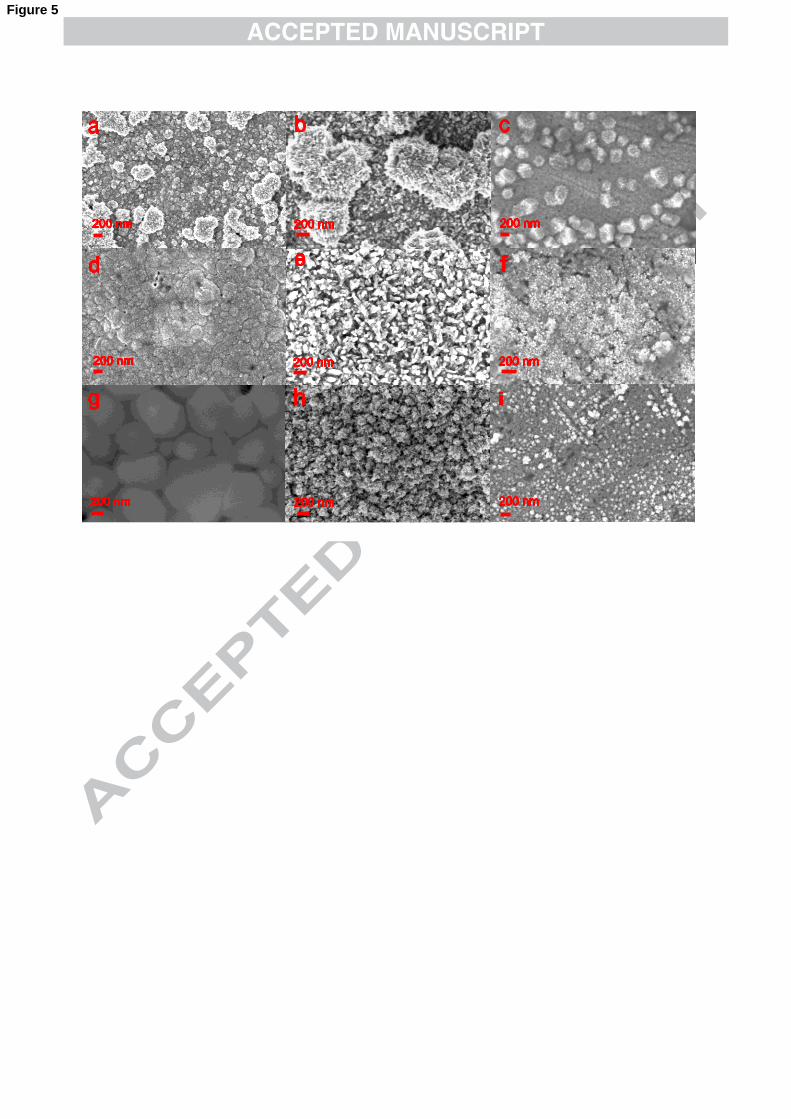
Figure 5
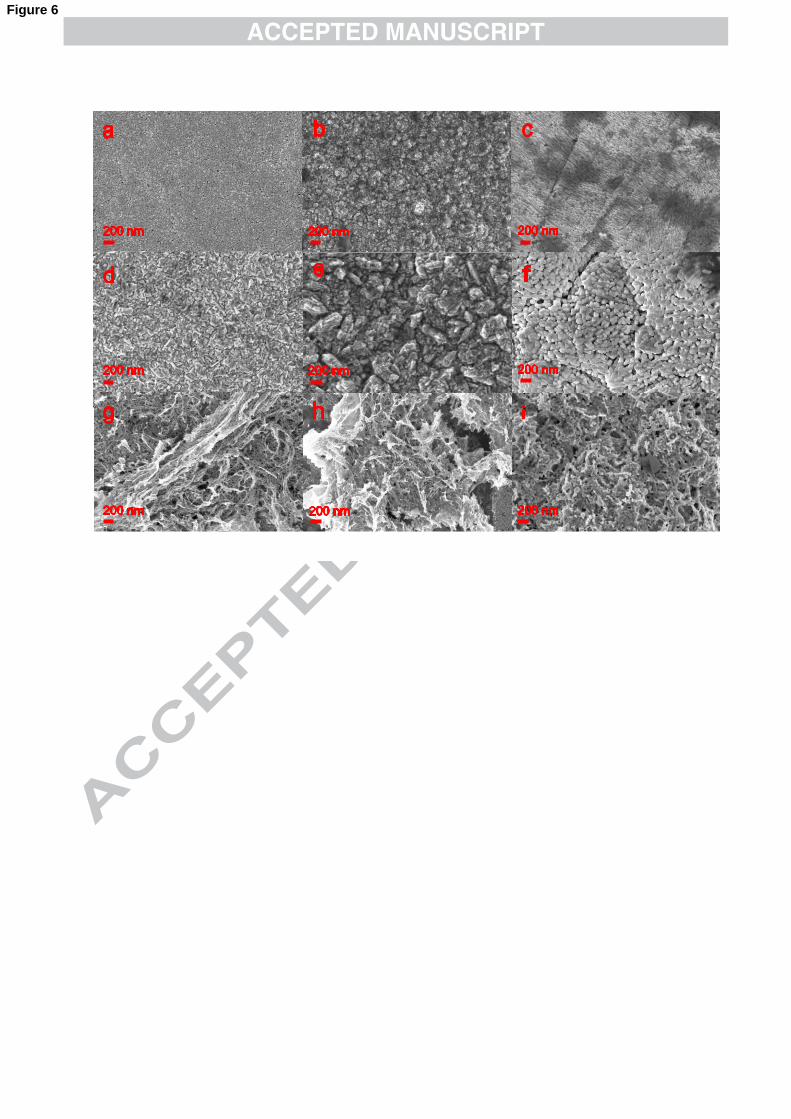
Figure 6
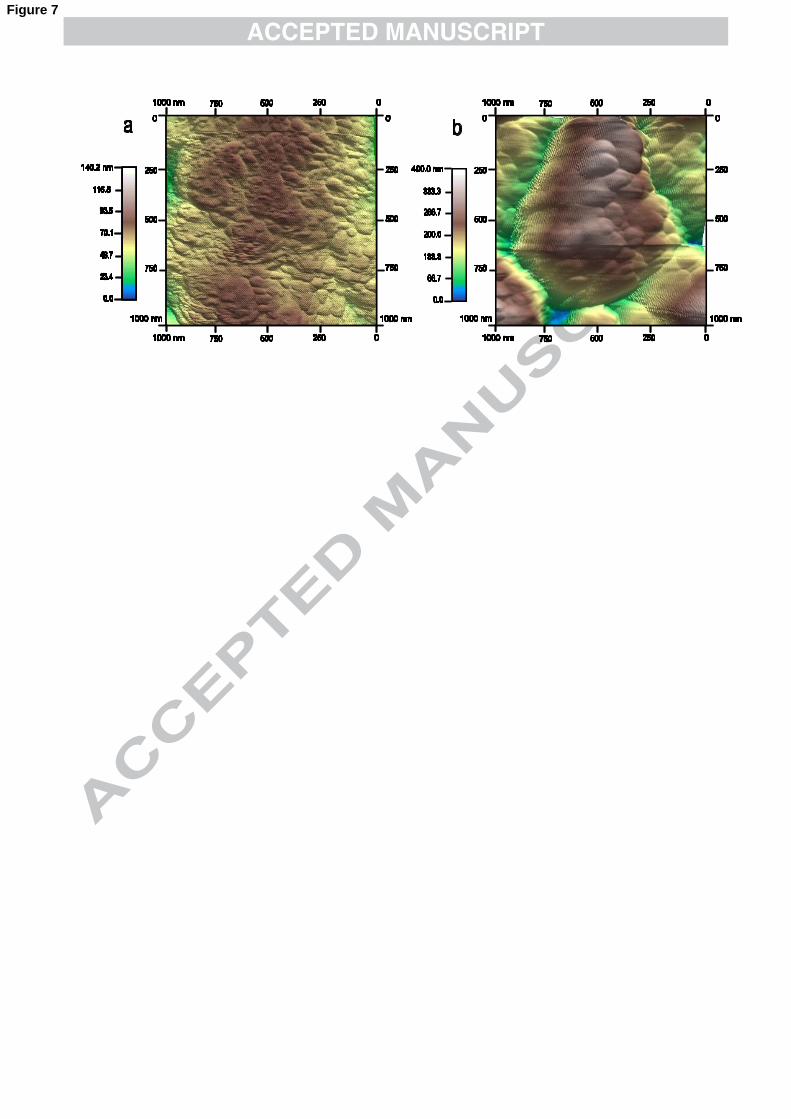
Figure 7

21
Research Highlights • The adsorption of Tetrabutylammonium at the electrode surface was shown to
cover ~ 30 % of the total surface area. • A decrease of one order of magnitude in the kinetic constant for the reduction of
−4AuCl to −
2AuCl was calculated. • Organic ions strongly influence the shape of grains and roughness of gold
electrodeposits.