going to a better school: effects and behavioral responsesmsu2101/pop-eleches_urquiola(2013).pdf ·...
TRANSCRIPT

American Economic Review 2013 103(4) 1289ndash1324 httpdxdoiorg101257aer10341289
1289
Going to a Better School Effects and Behavioral Responsesdagger
By Cristian Pop-Eleches and Miguel Urquiola
This paper applies a regression discontinuity design to the Romanian secondary school system generating two findings First students who have access to higher achievement schools perform better in a (high stakes) graduation test Second the stratification of schools by quality in general and the opportunity to attend a better school in particular result in significant behavioral responses (i) teachers sort in a manner consistent with a preference for higher achieving students (ii) children who make it into more selective schools realize they are relatively weaker and feel marginalized (iii) parents reduce effort when their children attend a better school (JEL I21 I28 J13)
Whether students would benefit from attending higher-achievement schools is an important question in education Clear evidence on this issue is scarce in large part because students are not randomly allocated to schools Nevertheless as discussed below several papers provide credible estimates of the effect of having access to a better school
Such estimates do not provide a complete road map for policy however as they may reflect but not reveal behavioral responses that amplify or reduce the impact of educational quality For instance parents might react to their children going to a better school by lowering their own effort There might also be reactions on the part of students for example an individual who makes it into a better school might feel inferior or be stigmatized1 Importantly these responses might change over time and may thus influence estimates differently depending on when outcome data are col-lected Additionally some of these responsesmdashwhich we will refer to as equilibrium effectsmdashmay only emerge once interventions are taken to scale and sustained for a period of time2 To illustrate stratifying students by ability might lead to reactions in the school system itself eg the emergence of norms that assign more qualified
1 Partially along these lines Cullen Jacob and Levitt (2006) explore how school choice affects studentsrsquo atti-tudes and behaviors
2 See for example the discussions in Banerjee and Duflo (2008) Acemoglu (2010) and Deaton (2010)
Pop-Eleches Columbia University 420 W 118th Street New York NY 10027 (e-mail cp2124columbiaedu) Urquiola Columbia University 420 W 118th Street New York NY 10027 (e-mail msu2101columbiaedu) For useful feedback we are thankful to Josh Angrist Ken Chay Damon Clark Rajeev Dehejia Caroline Hoxby Chang-Tai Hsieh Lawrence Katz Bentley MacLeod Ofer Malamud Richard Murnane Jonah Rockoff Amy Schwartz Douglas Staiger Eric Verhoogen and three anonymous referees for contributions at early stages of the project to Andreea Balan For excellent research assistance we thank Anindya Roy Special thanks go to Ioana Veghes at Gallup Romania for managing the survey and the data collection effort For financial support we are grateful to the National Science Foundation (SES 0819776) and to Columbiarsquos Institute for Social and Economic Research and Policy (ISERP) and Program for Economic Research (PER) Urquiola is also very grateful to the Russell Sage Foundation
dagger To view additional materials visit the article page at httpdxdoiorg101257aer10341289
1290 THE AMERICAN ECONOMIC REVIEW juNE 2013
teachers to brighter students Thus the very characteristics of an intervention may depend on its reach The bottom line as emphasized by Todd and Wolpin (2003) is that knowledge of such behavioral responses is crucial to a full understanding of educational interventions Yet there is little evidence on their empirical relevance
In this context this paper makes two contributions First using administrative data from all of Romania it provides a rigorous estimate of the impact of going to a better school where school quality is proxied by peer ability Second using data from a survey of parents teachers and principals in a subset of Romanian towns it explores the existence of dynamic behavioral responses and equilibrium effects
As stated our starting point is that identifying the effect of access to a better school is challenging Nonetheless several analyses have exploited compelling research designs with Dale and Krueger (2002) Cullen Jacob and Levitt (2006) and Hastings Kane and Staiger (2009) providing early examples Several more recent papers rely on regression discontinuity (RD) designs Specifically Park et al (2008) Hoekstra (2009) Saavedra (2009) and Jackson (2010a) find that rela-tive to students who just miss gaining admission to high achievement educational institutions those who make it have better academic andor labor market out-comes In contrast Clark (2010) Duflo Dupas and Kremer (2011) Sekhri and Rubinstein (2010) Abdulkadiroglu Angrist and Pathak (2011) and Dobbie and Fryer (2011) find scant evidence of impacts from getting into a higher achievement school or class within a school
We also apply an RD design to Romaniarsquos high school system exploiting the fact that as they transition into secondary education Romanian childrenrsquos ability to choose a high school depends solely on a score which is the average of their per-formance on a nationwide test and their grade point average After obtaining their transition score students submit a list of high school and track (eg Mathematics and Social Studies) combinations they wish to enroll in These tracks are essentially ldquoschools within a schoolrdquo in that their students take all their classes together and do not take courses with members of other tracks
After students have submitted their choices they are allocated to schooltracks via a nationally centralized process that honors higher scoring studentsrsquo requests subject to pre-established slot constraints3 This gives rise to cutoff scores that deter-mine access into schoolstracks and we show that there are clear discontinuities in educational quality at these cutoffs For instance relative to students who score just below a school cutoff those who score just above experience on average a highly significant increase in the average transition score displayed by their peers Further this mechanism generates about 2000 cutoffs allowing us to explore the heteroge-neity of school effectsmdashwhether being able to attend a more selective school for example is more valuable to a student whose initial performance is high or low
We explore the effects of this variation on a ldquohigh stakesrdquo outcome performance on a Baccalaureate exam Passing this exam is a requirement for application to uni-versity and the grade is used by many institutions as a crucial admission criterion We find that students do benefit from access to higher ranked schools and tracks within schools Specifically relative to individuals who just miss scoring above a
3 As discussed below the setting gives students incentives to truthfully reveal their preference rankings
1291pop-eleches and urquiola going to a better schoolVol 103 no 4
school cutoff those who succeed display a statistically significant 002 to 010 stan-dard deviation advantage in Baccalaureate performance4 If scaled by the associated improvements in peer quality these effects are of a magnitude consistent with some estimates in the literature5 They are also often larger and more precisely estimated for cutoffs at higher grade levels
Having established these results we turn to describing behavioral responses using a survey we administered in a subset of towns These data are consistent with teach-ers sorting in response to the stratification of students teachers with higher certifica-tion standards are more likely to work at better-ranked schools This sorting persists even within schools as one moves from a weaker to a stronger track and even within tracks as one moves from a weaker to a stronger class6 As a result although stu-dents who score just above a cutoff attend schools that on average have more certi-fied teachers the marginal (actual) teachers assigned to them are not observably different from those assigned to students who score just below the cutoff In short more qualified teachers are matched with higher achieving students This seems to be an established norm in Romania perhaps one that reflects a long term outcome of the interplay between teacher and parental preferences
In terms of parental effort a first finding is that children who just score above a cut-off receive less homework-related help from their parents In this sense Romanian parents may view educational quality and their own effort as substitutes We also find areas where there seems to be no change in parental choices again leading to differences in average versus marginal effects For example children who make it into more selective schools are exposed to peers whose parents are significantly more involved in their education yet their own parents show no greater sign of such engagement
In terms of student responses we find that children who just score above a cutoff on average perceive themselves as weaker relative to their peers This is not surpris-ing in a setting in which tracking by ability has been in place a long time and is well understood Additionally however this is associated with greater frequency of negative interactions with peers providing some evidence that getting into a higher achievement school leads to marginalization
For the parental and student dimensions we also find evidence that these responses have a dynamic component Namely the RD-estimated feelings of stigmatization and reduction in parental help are strongest earlier in studentsrsquo high school careers and diminish over time This might reflect for example studentsrsquo gradual realiza-tion that tracking involves some noise or parentsrsquo realization that their help is nec-essary even if their child is in a higher achievement setting Such dynamics imply that the estimated effects of going to a better school might depend for example on whether academic outcomes are measured at the ninth or twelfth grade level
Taken together these results inform not just the literature on tracking and school effects but also the research on experimental analyses of educational policy Specifically while we do not expect the magnitude or even the direction of the
4 In contrast there is no evidence of an effect on the probability of taking the Baccalaureate exam5 For instance a one standard deviation increase in peer quality is associated with a 01ndash02 standard deviation
increase in Baccalaureate grade performance6 Stratifying students into classes within tracks (when tracks are large enough) is a common but not universal or
codified practice in Romanian high schools
1292 THE AMERICAN ECONOMIC REVIEW juNE 2013
responses we find to extend to all settings our results suggest that large scale inter-ventions can result in equilibrium responses by different actors involved in educa-tional markets These reactions may not be observed or are explicitly held constant in partial equilibrium interventions In salient examples the STAR class size experiment (eg Krueger 1999) and the tracking experiment in Duflo Dupas and Kremer (2011) report on contexts in which one dimension of educational quality was manipulated while teacher quality was held constant by randomly assigning instruc-tors to classrooms In our data in contrast relevant teacher characteristics end up being correlated with educational quality Similarly parental effort may not change in a temporary experiment but might respond once an intervention is sustained and understood
As stated such behavioral responses and equilibrium effects may well be setting-specific7 To the extent that they exist however they may affect the key characteris-tics and impacts of an educational intervention Indeed the presence or absence of similar behavioral responses might partially account for the mixed findings in the growing RD literature on school effects cited above8
The remainder of the paper proceeds as follows Section I presents a conceptual framework Section II describes the student allocation mechanism and Sections III and IV our data and methodology respectively Section V presents results and Section VI concludes
I Conceptual Framework
The range of behavioral responses we focus on can be illustrated with a minor addition to the useful framework set out in Todd and Wolpin (2003) The addition reflects that while Todd and Wolpin focus on responses on the part of households here we also consider reactions on the part of the school sector itself
Specifically consider a three period setting in which period t = 0 precedes a child entering school and t = 1 and t = 2 denote the first and second years of school respectively F t stands for household investments into childrenrsquos skill acquisition in period t and μ for a childrsquos innate ability W denotes family wealth Finally let A t indicate a childrsquos achievement at the beginning of period t For example A 1 is a childrsquos achievement as she enters school and reflects only her familyrsquos investments in the previous period and her innate ability
A 1 = g 0 ( F 0 μ)
7 For example Duflo Dupas and Kremer (2011) point out that in Kenya teacher sorting would result in more effective instructors being matched to weaker children In contrast Lankford Loeb and Wyckoff (2002) suggest that in the United States low-achieving students are typically matched with the least-skilled teachers
8 Our results are also related to research on how families make decisions regarding human capital investments (Becker 1964 Becker 1981 Becker and Tomes 1986) The empirical literature in this area has usually focused on the impact of parental characteristics on child outcomes (eg Behrman et al 1997 Case and Deaton 1999 Brown 2006) without considering parent-school interactions Das et al (2013) is a notable exception that stud-ies how parents adjust their educational expenditures in response to anticipated and unanticipated school grants Additionally Liu Mroz and van der Klaauw (2010) study the interrelationship between school inputs and house-hold migrationemployment decisions A related literature considers private responses to public transfers (eg Moffitt 1992 Rosenzweig and Wolpin 1994 Jacoby 2002 and Jensen 2003) Case and Deaton (1998) point out that the impact of transfers might be different in the short and the long run since it takes time for private behavioral responses to public transfers to have an effect
1293pop-eleches and urquiola going to a better schoolVol 103 no 4
where g t is a period-specific production function Childrenrsquos learning is also enhanced by the school inputs they receive each period
S 1 and S 2 Thus a childrsquos achievement at the start of the second year of school depends on endowments and the history of family and school inputs
A 2 = g 1 ( S 1 F 1 F 0 μ)
Todd and Wolpin (2003) make a useful distinction between the amount of school inputs a child would receive if this were entirely up to her family and the amount she actually receives at school While families cannot control their childrenrsquos school inputs they can influence their level In the United States for example they can do this through residential choice or private schooling in Romania they might help their children prepare for transition exams Let
_ S t denote the amount of inputs households
target by such actions Households choose this level as a function of their wealth and their childrenrsquos endowment and achievement at the beginning of each period For example
_ S 1 = θ ( A 1 W μ)
Schools in turn can choose how to allocate resources to students For example a child making clear progress toward reading might receive less attention than a strug-gling one or might be ldquotrackedrdquo differently Schools therefore have decision rules eg they condition the inputs a child receives in period one on her achievement at the beginning of that period and on her endowment
S 1 = ψ ( A 1 μ)
With this the deviation between the level of inputs children actually receive and the amount their families had targeted for the first period is S 1 minus
_ S 1 Assume house-
holds observe this deviation before setting their own home input investment level For example for the first schooling period they use a decision rule
F 1 = ϕ ( A 1 W μ S 1 minus _ S 1 )
In words a household sets its own investment for the first year of school as a func-tion of its childrsquos achievement at the beginning of the year endowments and the deviation between the school-based inputs they would want for their child and those she will actually receive (for instance the child may not have been admitted to the school they had hoped she would attend)
This setup illustrates the parameters that different types of work identify For example a common goal of research is to answer the question What would be the effect of exogenously changing a first period school input S 1 mdashsay class sizemdashwhile holding all other inputs constant
(1) part A 2 _
part ( S 1 minus _ S 1 )
= part A 2 _ part S 1
= part g 1 _ part S 1
1294 THE AMERICAN ECONOMIC REVIEW juNE 2013
This is a question about the properties of the production function Todd and Wolpin argue that experiments more typically answer the question
What would be the total effect of an exogenous change in S 1 not holding other inputs constant They refer to the STAR class size experiment as an illustration since class size was manipulated exogenously but parents were free to adjust their own effort for example Such a ldquopolicy effectrdquo is given by
(2) d A 2 _
d ( S 1 minus _ S 1 )
= d A 2 _ d S 1
= part g 1 _ part S 1
+ part g 1 _ part F 1
part F 1 _
part ( S 1 minus _ S 1 )
This is a well-defined and relevant measure one that in comparison to (1) also con-tains the indirect (behavioral) effect resulting from changes in parental investments At the same time it has some limitations for example cost benefit calculations might require ascertaining the relative contributions of school and family inputs In addition although in the present framework the behavioral response by parents is instantaneous in real world situations it might take time for parents to notice and react to changes in school inputs As a result the estimated policy effect (2) could vary with the time at which achievement is measured
Now consider a second school input such that there are two S 1 x and S 1 y
A ran-domized experiment might be able to vary one of these while controlling the level of the other In that case the resulting impact will still resemble expression (2) This is broadly the way in which we interpret the results in Duflo Dupas and Kremer (2011) This study manipulates the peer quality of the classes children have access to say S 1 x
while at the same time constraining changes to other school inputs For example teachers are randomly assigned to high or low achievement classes
Now suppose the increase in S 1 x originates not in an experiment but from an exten-
sive and sustained policy Then the school system will have a chance to react to this and the total effect is
(3) d A 2 _
d ( S 1 x minus
_ S 1 x ) =
d A 2 _ d S 1
x =
part g 1 _ part S 1
x +
part g 1 _ part S 1
y part S 1
y _
part S 1 x
+ part g 1 _ part F 1
( part F 1 _ part ( S 1
x minus
_ S 1 x ) +
part F 1 _ part ( S 1
y minus
_ S 1 y ) )
which differs from (2) in also including responses within the school system To summarize Todd and Wolpin (2003) make a useful distinction between pro-
duction function parameters (1) and policy effects (2) We wish to further empha-size that policy effects might be different in situations where behavioral responses take time to unfold or where these responses only appear when certain interventions reach a certain scalemdash(3) versus (2) A further implication is that in the presence of behavioral responses estimated policy effects are less likely to be externally valid since indirect (behavioral) effects may vary across settings
More specifically aside from attempting to estimate the policy effect of having access to a higher-ranked school we endeavor to measure the importance of behav-ioral responsesmdashthe terms beyond the first one in the right-hand side of equation (3) For example we will search for evidence consistent with parents reacting to changes
1295pop-eleches and urquiola going to a better schoolVol 103 no 4
in the school inputs their children experience an effect captured by part F 1 _ part ( S 1 x
minus _ S 1 x ) 9
We note it is not our aim to establish the causal impact of any particular one of
these mechanisms this would be difficult given that we have a single instrument for school quality and as we show below the evidence suggests multiple mechanisms are operative
II The Student Allocation Mechanism
The transition between middle and high school (eighth to ninth grade) in Romania results in an unusually systematic allocation of students to schools Specifically every child who completes middle school receives a transition score which equally weights (i) her performance in a national eighth grade exam covering Language Math and HistoryGeography10 and (ii) her gymnasium (grades 5ndash8) grade point average
After receiving their transition scores students are required to submit a list of ranked choices specifying combinations of (i) a high school and (ii) one of seven academic tracks Mathematics Natural Sciences Technical Studies Services Social Studies Literature and Natural Resources and Environmental Protection11 These tracks constitute ldquoschools within a schoolrdquo in that the students in them take all their coursework together and do not take classes with members of other tracksmdashalthough they share infrastructure and a principal meet during breaks and might share teach-ers Not all schools offer all tracks but all must submit their track- specific capacities in advance and these are public information
Studentsrsquo schooltrack choices are expressed through an application form sub-mitted (through their gymnasium) to the Ministry of Education in the capital Bucharest12 Using a computerized system the Ministry then ranks students by their transition scoremdashno other criteria (eg sibling preferences or geographic proxim-ity) go into the ranking The mechanism considers the highest ranked student and assigns her to her most preferred schooltrack choice It then moves on to the sec-ond and treats her similarly Eventually the procedure will reach a student whose first choice is full If this happens it tries to assign the student to her second choice if that one is full as well then to the third and so on Only once this student has been assigned to a school does the mechanism move onto the next person13 Under this set up students have incentives to truthfully reveal their preference rankings14
9 Similarly we will look for evidence consistent with teachers sorting in response to the stratification of students by ability an effect broadly captured by part S 1
y _ part S 1
x
10 All tests and grades use a scale ranging from 1 to 10 with a passing grade of 5 Students who score below 5 are not allowed to apply to high school but can enroll in vocational school
11 For the 2001 sample the administrative data on tracks is not as precise it combines three of the tracks (Technical Studies Services and Natural Resources and Environmental Protection) into one technical track
12 During the period we study schooling in Romania was compulsory until the tenth grade As a result the entire cohort of students who complete middle school is required to participate in this allocation process
13 Some students only request school-track choices with minimum entry scores above their own transition score These individuals are assigned in a second round to schoolstracks that did not fill Students are warned against this outcome and allowed to submit a list of choices of essentially unlimited length As a result for example in 2007 only 11 percent of applicants moved to the second round
14 The existing legislation does not allow children to decline their initial assignment although in rare situations children do manage to switch schools andor tracks over the years Such switching does not pose a threat to our ldquointent-to-treatrdquo research design which as discussed below is based on the assigned schooltrack
1296 THE AMERICAN ECONOMIC REVIEW juNE 2013
Schools must enroll the children in the admission list returned from the comput-erized allocation In cases in which they offer multiple classes of the same track the system just returns the list of students admitted into the track without further instructions on how to divide them into classes We have data on this division for only a subset of schools (as described in Section III) these data and the anecdotal evidence suggest that many schools further stratify classes by transition score
As shown in the regression results below the result of this process in most markets is a clear hierarchy of schools by average peer quality average observable teacher characteristics and average parental effort The lack of administrative data on the actual school choices that families submit prevents us from fully exploring what information is used to make these choices The anecdotal evidence indicates that school quality is the most important determinant of school choice in Romania That said we cannot make definite statements for example on how parentsrsquo rankings of schools weigh aspects like peer quality parental participation or teacher value added15
III Data
We rely on two types of data (i) administrative information covering the universe of children and (ii) data from a survey we administered in most towns with two or three high schools16
A Administrative Data
Our administrative data cover the 2001ndash2003 and 2005ndash2007 admission cohorts They provide the name gymnasium transition score and the allocated schooltrack for all students but no information on their ranking of schooltracks or their socio-economic characteristics We focus on two subsamples of these data
(i) The 2001ndash2003 cohorts for which we linked admissions data with informa-tion on whether students took the Baccalaureate exam and how they performed (these cohorts took the exam in 2005ndash2007)17 A satisfactory Baccalaureate grade is a prerequisite for applying to university and an excellent one raises the probability of admission to the most prestigious institutions18
15 See MacLeod and Urquiola (2009) for a framework in which a preference for schools with better reputation might result in tradeoffs between attributes like peer quality and teacher value added
16 We use the term town to denote a high school market The term that appears in the administrative data is local-ity (Localitate in Romanian) In most cases these units actually correspond to citiestowns In a few they denote the largest of a number of small towns or villagesmdashthe town which actually contains the high school that might draw from a corresponding catchment area composed of smaller towns or villages
17 We merged the admission and Baccalaureate data by student name and county using a fuzzy matching tech-nique to allow for some misspelling of names Our conclusions are not sensitive to different levels of precision in the matching algorithm and are also similar if we use only exact matches Our matched data do not allow us to differen-tiate between high school dropouts and students who complete high school but do not take the Baccalaureate exam
18 The Baccalaureate exam is administered nationally Students usually take six component exams with a combi-nation of common subjects (written language oral language written foreign language) as well as two track-specific exams and one elective exam The overall grade is the unweighted average of these scores The exam is first admin-istered in July Students who fail are allowed to retake the exam in August (we use the August score for students who took the exam twice) Additionally students are generally not allowed to take the Baccalaureate exam early
1297pop-eleches and urquiola going to a better schoolVol 103 no 4
These cohorts contain about 334000 students attending about 800 high schools in 135 towns
(ii) The 2005ndash2007 cohorts for which we have only admissions information and can thus only explore ldquofirst stagesrdquo These cohorts consist of about 301000 students from essentially the same schools and towns it contains the students we surveyed as described below
Presenting descriptive statistics Table 1 thus covers the universe of students admit-ted to high school during these years with three exceptions19 The first two reflect
19 Due to publication-related space constraints Table 1 does not include maxima and minima these are in the online Appendix (Table A1)
Table 1mdashDescriptive Statistics Administrative Data 2001ndash2003 Cohorts
High school admission cohort
2001 2002 2003
Mean SD N Mean SD N Mean SD N
Panel A All towns
Panel A1 Individual levelTransition grade 768 093 107812 787 086 110912 796 097 115413Baccalaureate taken 0847 0360 107812 0822 0383 110912 0808 0393 115413Baccalaureate grade 831 093 87411 828 095 85946 851 088 84076
Panel A2 Track levelNumber of ninth grade students 626 490 1722 666 506 1665 715 533 1615
Panel A3 School levelNumber of ninth grade students 1353 614 797 1406 631 789 1441 692 801Number of tracks 22 12 797 21 12 789 20 12 801
Panel A4 Town levelNumber of ninth grade students 8046 8496 134 8277 8755 134 8549 9195 135Number of schools 59 60 134 59 58 134 59 59 135Number of tracks 129 119 134 124 114 134 120 109 135
Panel B Survey towns
Panel B1 Individual levelTransition grade 758 091 14951 785 084 15257 789 009 15641Baccalaureate taken 0832 0374 14951 0812 0390 15257 0805 0396 15641Baccalaureate grade 837 087 11966 831 090 11821 863 082 11312
Panel B2 Track levelNumber of ninth grade students 505 372 296 537 388 284 551 425 284
Panel B3 School levelNumber of ninth grade students 1216 547 123 1240 543 123 1272 645 123Number of tracks 24 13 123 23 13 123 23 13 123
Panel B4 Town levelNumber of ninth grade students 2774 1261 55 2774 126 55 284 1408 55Number of schools 22 04 55 22 04 55 22 04 55Number of tracks 52 18 55 52 18 55 52 16 55
Notes Panel A describes the universe of Romanian towns with two exceptions (discussed in Section III) (i) towns that make up Bucharest and (ii) towns that contain a single school Panel A1 presents student level statistics and panels A2 A3 and A4 refer to characteristics at the track school and town level respectively Panels B1ndashB4 present analogous information for the towns we eventually targeted for surveying Note that these panels refer to 55 rather than the 59 towns discussed in Section III and described in Table 2 This reflects that the remaining four towns only had one school in 2001ndash2003 and so are not in our main administrative sample (these four towns did contain two or three schools in 2005 and thus were targeted for the survey) Finally due to publication-related space con-straints Table 1 does not include maxima and minima these are in the online Appendix (Table A1)
1298 THE AMERICAN ECONOMIC REVIEW juNE 2013
that as explained below we rank schools and set cutoff scores under the assump-tion that towns are self-contained markets We therefore omit the capital Bucharest which is composed of six towns the borders of which students can cross with relative ease We do not find this omission to affect our key conclusions Second when our analysis focuses on between-school cutoffs we omit towns that have only one high school20 Third we drop all students who enroll in the vocational sector this pre-cludes their access to higher education and hence we do not observe Baccalaureate outcomes for them21
B Survey Data
While the administrative dataset offers substantial sample sizes it contains only basic information To explore behavioral responses we therefore implemented a survey that featured principal parent and student questionnaires The way in which we carried out this survey partially explains our final survey sample and we there-fore begin with a description of its implementation
The 2005ndash2007 administrative data provided studentsrsquo names but not their addresses or any way of contacting them or their parents The data also contained almost no information regarding school characteristics We therefore approached schools and asked their principalsadministrators to fill out a school survey and to provide us with the addresses of the students in the mentioned cohorts (who were still in school) The school survey collected information on the student population and on school resources and infrastructure The principals were also asked to pro-vide a subjective ranking of their school relative to other schools in their towns along dimensions like teacher quality student ability and parental involvement Our surveyors also collected administrative data on the experience education and cer-tification levels of the teachers responsible for seven subjects Math Romanian History Geography Music Sports and Computer Science
During the first half of 2009 we used the list of addresses to directly approach parents and students at home The survey administered to them had three com-ponents First we interviewed the family to obtain demographic information on each member of the household as well as basic household characteristics Second we surveyed the primary caregiver to elicit information on each child Third we conducted a separate interview with the child from the selected schools The latter included asking children (for matching purposes) the name of their teacher in the seven subjects for which we collected teacher characteristics at schools
Two factors led us to restrict our target sample to towns containing two or three schools First since we needed information from students on either side of admis-sions cutoffs it was imperative that all schools in each town agree to participate and
20 Despite these omissions for simplicity we will describe the sample as covering ldquoall townsrdquo unless we focus only on those towns covered by our specialized survey
21 The omission of students who enroll in vocational tracks could be problematic if the probability of enrolling is affected by options in nonvocational schooling We nonetheless decided to drop these students because it is very unlikely that a large proportion of students would prefer to attend a vocational track over a nonvocational track We have explored the actual schooltrack choices as collected ex post in our survey sample These responses may suffer from ex post rationalization as discussed below but it is worth noting that less than 1 percent of students who attend a nonvocational track claim that they ranked a vocational track above their assigned track For further information on vocational education in Romania see Malamud and Pop-Eleches (2010)
1299pop-eleches and urquiola going to a better schoolVol 103 no 4
therefore the effort was more likely to encounter problems in larger towns Second as shown below the administrative data reveal that the magnitude of the first stages is three to four times larger in smaller towns
We started with a sample of 57527 children and 167 schools in the 71 towns with two or three schools If any school in a given town declined to participate we aban-doned the whole town In the end we obtained complete school surveys and student data from 148 schools in 64 towns the administrators in these schools provided us with 32307 addresses We restricted the target sample further to 138 schools in 59 towns which contained 30676 children22 Due to financial constraints we ran-domly sampled 19878 children (about 65 percent of the total) out of this population From this target sample we obtained 12590 parent and child surveys Our response rate of 63 percent is in line with Gallup Romaniarsquos (the firm we contracted with) interview rate for this population While the resulting sample is not completely rep-resentative of the population of these schools we found no evidence that response rates differed between households whose children had a transition score just above a cutoff and their counterparts who scored just below Table 2 presents descriptive statistics from the survey data using the household and school questionnaires23
IV Empirical Strategy
Although in principle a student can request any high school in the country we suppose that students restrict their choices to the towns they live in a reasonable assumption since the applicants are 13ndash14 year olds likely to be living with their parents Within each town we rank schools and schooltracks (in separate exer-cises) according to their average score and set the cutoffs equal to their minimum scores24 In other words we set each schoolrsquos (or schooltrackrsquos) cutoff equal to the score of the child with the lowest transition score25
This yields a large number of quasi-experimentsmdash1984 if one considers schools 6434 if one considers schooltracksmdashsince each cutoff score makes for a potential RD analysis26 In this section we first discuss the conceptual basis for analyzing any
22 The elimination of five towns reflected that at least one school in each of them though willing to fill out the school questionnaire was unable to provide student addresses
23 Table A2 in the online Appendix explores how two sets of towns differ from those for which we eventually got completed surveys first the 7 (out of 71) towns where at least one school refused to participate and second the 12 (out of 71) towns that either fall into the previous category or else did not complete parental and child surveys Generally we did not find significant differences between the towns in our final sample compared to the initial tar-get sample in terms of characteristics including average transition scores area population and income per capita
24 We also implemented the exercise ranking schools and tracks by their minimum score with quite similar results
25 Using the minimum admission score is in line with our ldquointent-to-treatrdquo approach (discussed below) in the sense that only schools that reach capacity will generate meaningful first stages An alternative approach would have been to set each schoolrsquos (or schooltrackrsquos) cutoff equal to the transition score of the child that fills its last slot We could potentially identify that child since classes are limited to 28 slots (eg the track-specific slot avail-abilities which schools submit prior to the allocation process must be multiples of 28) However our process for col-lecting and matching the administrative files (from hundreds of thousands of web pages) creates some measurement error This limits our ability to determine with certainty if a school reached capacity Nevertheless using some approximations we estimate that excluding the bottom ranked school in each town the percent of schools that reach capacity ranges (depending on the cohort) between 80 and 90 percent
26 The between-school cutoffs are 663 655 and 666 for the 2001 2002 and 2003 entry cohorts respectively for the between-track cutoffs the corresponding numbers are 1956 1952 and 2526
1300 THE AMERICAN ECONOMIC REVIEW juNE 2013
given one of these experiments focusing on schools for simplicity We then describe how we go about summarizing them
A Empirical Setup for a Single Between-School Cutoff
Consider a town in which i indexes students and s = 1 hellip S indexes schools where the latter have been ordered from the worst to the best in terms of the average transition score observed among their students Additionally let z = 1 hellip (S minus 1) index cutoffs such that for example z = 1 denotes the cutoff between the worst and next-to-worst school in the town and z = (S minus 1) indicates the cutoff between the top-ranked school and the next best institution Let t i denote student i rsquos transition score and t z be the minimum grade required for admission into the higher-ranked of the two schools indexed by z27
27 We abuse notation as above we used t to denote a time period henceforth it will stand for the transition score
Table 2mdashDescriptive Statistics Survey Data 2005ndash2007 Cohorts
Mean SD Observations
Panel A Socioeconomic characteristics (Household survey)Female head of household 0112 0316 11931Age of household head 46752 7145 11843
Ethnicity of household head Romanian 0938 0240 11931 Hungarian 0050 0218 11931 Gypsy 0003 0056 11931 Other 0008 0091 11931
Education of household head Primary 0665 0472 11840 Secondary 0205 0404 11840 Tertiary 0130 0337 11840Female child 0584 0493 11931Age of child 18077 0939 11866
Panel B Parental responses (Household survey)Parent has volunteered at school in the past 12 months 0111 0314 11868Parent has paid for tutoring services in the past 12 months 0237 0425 11850Parent helps child with homework every day or almost every day 0197 0398 11815Child does homework every day or almost every day 0752 0432 11779
Panel C Child responses (Household survey)Relative rank among peers (1ndash7 with 7 better ranked) 4745 1300 11798Index of negative interactions with peers1 0121 0369 11838Child does homework every day or almost every day 0632 0482 11908Child perceives homework to be easy (1ndash7 with 7 easiest) 5450 1015 9628
Panel D Language teacher qualifications (school data matched to children) Proportion of teachers with highest state certification 0608 0488 11169Years of experience 15801 12228 11169Proportion of teachers who are ldquonovicesrdquo (less than 2 years of experience) 0061 0238 11169
Notes This table summarizes a specialized survey collected in 135 schools located in 59 towns (see Section III for a description of the survey) 1 Index based on the sum of four indicators for whether during the past month childrenrsquos peers (i) were mean to them (ii) hit them (iii) took their things without asking or (iv) made them feel marginalized Each indicator ranges between 0 (did not happen in the past month) and 5 (happened daily)
1301pop-eleches and urquiola going to a better schoolVol 103 no 4
In this setup consider the ldquoreduced formrdquo regression
(4) y i = α1 t i minus t z ge 0 + a ( t i ) + ϵ i
where y is an outcome 1 t i minus t z ge 0 is an indicator for whether a students transi-tion score is greater than or equal to the cutoff indexed by z and a( t i ) is a flexible control function for the transition score As outcomes y we will consider studentsrsquo Baccalaureate performance as well as a series of behaviors and characteristics related to students parents teachers principals and schools
The idea behind the RD design is that if access to a higher-ranked school changes discontinuously at t z then the causal impact of this access can be identified even if studentsrsquo transition scores are systematically related to factors that affect outcomes like Baccalaureate grades28 Intuitively suppose the transition score is smoothly related to characteristics that affect achievement ie a(t) is constant in a small enough neighborhood around the cutoff Under this assumption students with scores just below t z will provide an adequate control group for individuals with scores just above and any difference in their outcomes can be attributed to the fact that they have access to schools of different qualitymdashie α is nonparametrically identified at t z (Hahn Todd and van der Klaauw 2001) More generally if a(t) is specified correctly it will capture all dependence of outcomes on the transition score away from the cutoff and one can use all the data to estimate (4) Below we present such results and also estimates that rely only on observations close to cutoff scores
As is common in the RD-based literature we use specifications like (4) to pro-duce ldquointent to treatrdquo estimates of the effect of having the opportunity to attend a higher-ranked school Our ldquofirst stagerdquo results will show that a significant proportion of children who have a chance to go to a better school take this opportunity This allows us to measure the effect that having this opportunity has on a childrsquos outcome although not the effect of any specific change in school quality because the children above and below the cutoff attend schools with a range of different qualities
While we focus on reduced form results in some cases we also present results from an instrumental variables-type specification
(5) y i = γ E ( T i | t i ) + a ( t i ) + e i
(6) E ( T i | t i ) = β1 t i ge t z + a ( t i )
where (6) is the ldquofirst stagerdquo and T i stands for the average transition score among student i rsquos peers (eg the average score among the children at her school) Under assumptions analogous to those discussed above and if the mean of T conditional on the transition score E( T i | t i ) is discontinuous at t z then (5)ndash(6) will consistently estimate γ mdashthe effect of having access to a higher-ranked school as measured by peer group quality We implement (5)ndash(6) mainly as a descriptive exercise to com-pare the magnitude of effects across cutoffs This reflects that γ cannot be given a
28 This design was proposed by Thistlewaite and Campbell (1960) for an overview see Imbens and Lemieux (2008)
1302 THE AMERICAN ECONOMIC REVIEW juNE 2013
strict instrumental variables interpretation since as shown below several aspects of school qualitymdashnot just peer compositionmdashchange discontinuously at the cutoffs29
B Summarizing Information for Many Cutoffs
The above specifications illustrate how one might exploit one cutoff As stated our data contain thousands of cutoffs In order to summarize these and for the sake of statistical power we focus on regressions which pool data across cutoffs relying on the fact that t i minus t z measures the distance between each cutoff and the transition score of each student in a town Specifically we ldquostackrdquo the data such that every stu-dent in a town serves as an observation for every cutoff and (when observations are used more than once) run the analyses clustering at the relevant level30 Including all observations for every cutoff is relevant in that for example the student with the best score in town could successfully request any school We note however that regressions restricted to students in bands close to the cutoffs in fact rarely use student-level observations more than once
For concreteness most of our reduced form regressions are specified as follows
(7) y iz = α1 t i minus t z ge 0 + η ( t i minus t z ) + ψ ( t i minus t z ) times 1 t i minus t z ge 0 + w z + v i
that is a regression of outcomes on a dummy for whether a studentrsquos transition score is greater than or equal to the cutoff along with controls that include (i) a linear spline in studentsrsquo grade distance to the cutoff one which allows the slope to vary on each side of the cutoff and (ii) a full set of cutoff dummies w z 31
V Results
This section first presents results that pool all the between-school and between-track cutoffs It then turns to describing the heterogeneity in effects observed when discon-tinuities take place at different points of the transition score distribution Finally it closes with exercises that using our survey data explore behavioral responses
A The First Stage
Figure 1 panel A illustrates the basic first stage result in our data pooling all between-school cutoffs as described in Section IV this figure summarizes results of specifications analogous to (6) The x-axis describes studentsrsquo transition scores relative to the cutoffs that allow the opportunity to access a higher-ranked school the y-axis describes the peer quality students experience as measured by the mean transition score at their respective school Panel A plots this mean transition score collapsed into cells containing individuals who are within 001 of a transition grade from each other The right-hand side of panel B plots analogous information but the
29 In other words it is unlikely that a particular channel like peer quality satisfies an exclusion restriction30 To illustrate in the first year of our data 2001 the first town in our data Alba-lulia has 836 students in seven
schools producing six between-school cutoffs For that year this produces a dataset of 5016 (=836 times 6) observations31 For simplicity equation (7) does not have a time dimension in reality our standard specification includes a
full set of cutoffyear dummies
1303pop-eleches and urquiola going to a better schoolVol 103 no 4
y-axis is based on residuals from a regression of the mean transition score on cutoff fixed effects32 Both panels suggest that the average peer quality students experience increases significantly and discontinuously if their transition score crosses the
32 Figures 1 3 and 4 (and A1ndashA6 in the online Appendix) have a similar structure in that the left-hand-side panels use raw data and the right-hand-side panels use residuals from regressions that control for cutoff fixed effects
75
755
76
765
77
Sch
ool l
evel
sco
re
Score distance to cutoff
Panel A Average transition scoremdashno controls
ndash02
ndash01
0
01
02
Sch
ool l
evel
sco
re
Score distance to cutoff
Panel B Average transition scoremdashcontrols
071
072
073
074
075
Tak
en
Score distance to cutoff
Panel C Baccalaureate takenmdashno controls
ndash004
ndash002
0
002
Tak
en
Score distance to cutoff
Panel D Baccalaureate takenmdashcontrols
795
8
805
81
815
Gra
de
ndash02 ndash01 0 01 02
Score distance to cutoff
Panel E Baccalaureate grademdashno controls
ndash02
ndash01
0
01
02
Gra
de
ndash02 ndash01 0 01 02
ndash02 ndash01 0 01 02 ndash02 ndash01 0 01 02
ndash02 ndash01 0 01 02 ndash02 ndash01 0 01 02
Score distance to cutoff
Panel F Baccalaureate grademdashcontrols
Figure 1 Between-School Cutoffs All Towns
Notes All panels are based on administrative data for the 2001ndash2003 admission cohorts and restrict observations to individuals with transition scores within 02 points of a cutoff The left-hand-side panels plot (001 point) tran-sition score cell means of the dependent variable The right-hand-side panels plot analogous means of residuals from a regression of the dependent variable on cutoff fixed effects In each panel the solid lines are fitted values of regressions of the dependent variable on a linear trend in the transition score estimated separately on each side of the cutoff The dependent variable in panels A and B is the average transition score of the peers students encoun-ter at school the dependent variable in panels C and D is an indicator for having taken the Baccalaureate test the dependent variable in panels E and F is the Baccalaureate exam grade
1304 THE AMERICAN ECONOMIC REVIEW juNE 2013
threshold that gives them the option of going to a better-ranked school The vertical distance between the points close to the discontinuity further is analogous to the estimate of β in expression (6)
Table 3 panel A presents the regression analog to these results where columns 1 and 2 refer to all towns Panel A column 1 refers to the 2001ndash2003 cohorts and uses data within one point of the cutoffmdashabout 18 million observations from 1984 cutoffs33 It regresses the average transition grade that students experience at school on an indicator for whether their scores are above cutoffs The specification
33 Panel D in Table 3 presents similar results for the 2005ndash2007 cohorts
Table 3mdashFirst Stages
Administrative data
All towns Survey towns Survey data
Within Within Within Within Within Within1 point IK 1 point IK 1 point IK
of cutoff bound of cutoff bound of cutoff bound(1) (2) (3) (4) (5) (6)
Panel A School-level average transition grade 2001ndash2003 cohortsmdashbetween school cutoffs
1Transition grade ge cutoff 0107 0115 0446 0447(0001) (0001) (0007) (0007)
Linear spline Yes Yes Yes YesR2 0790 0792 0754 0754
Observations 1857376 1160458 39363 39104
Panel B Track-level average transition grade 2001ndash2003 cohortsmdashbetween track cutoffs
1Transition grade ge cutoff 0063 0070 0188 0188(0001) (0001) (0003) (0003)
Linear spline Yes Yes Yes YesR2 0857 0858 0792 0793
Observations 4845812 3423493 172656 166458
Panel C Track-level average transition grade 2001ndash2003 cohortsmdashbetween school cutoffs
1Transition grade ge cutoff 0073 0082 0266 0274(0001) (0001) (0006) (0006)
Linear spline Yes Yes Yes YesR2 0849 0852 0811 0816
Observations 1857376 1196898 39363 39633
Panel D School-level average transition grade 2005ndash2007 cohortsmdashbetween school cutoffs
1Transition grade ge cutoff 0107 0106 0414 0438 0477 0477(0001) (0001) (0007) (0009) (0018) (0018)
Linear spline Yes Yes Yes Yes Yes YesR2 0808 0811 0700 0691 0700 0700
Observations 1611388 1822434 34855 22485 6559 6382
Notes All regressions are clustered at the student level and include cutoff fixed effects Standard errors are in paren-theses All panels present reduced form specifications where the key independent variable is a dummy for whether a studentrsquos transition score is greater than or equal to the cutoff
Significant at the 1 percent level Significant at the 5 percent level Significant at the 10 percent level
1305pop-eleches and urquiola going to a better schoolVol 103 no 4
includes (i) a linear spline in studentsrsquo grade distance to the cutoffs one which allows the slope to vary on either side of the cutoff and (ii) cutoffyear dummiesmdashie equation (7) with cutoffyear fixed effects34 The results suggest that scoring above a cutoff results in a highly statistically significant jump in peer qualitymdash011 points equivalent to about 01 standard deviations in transition test performance
As stated column 1 restricts the sample to include only students whose transition scores are within one point of a cutoff (about half of the full sample)35 This is our preferred specification it attempts to balance the goal of focusing on observations close to the cutoffs while providing enough data to yield fairly precise estimates We experimented with several more stringent windows with similar conclusions36 We opt to feature in column 2 a regression within the bandwidths suggested by the procedure in Imbens and Kalyanaraman (2009)mdashhenceforth IKmdashwhich in our data is generally more restrictive than the one point band used in column 237 All these samples result in similar and highly significant estimates
Columns 3 and 4 repeat the specifications in columns 1 and 2 focusing only on towns included in our specialized survey (the corresponding graphical evidence is in online Appendix Figure A1 panels A and B) The observed discontinuities are always statistically significant and about four times the size of those observed in the full sample38
The ldquofirst stagesrdquo in Table 3 panel A are those that will be relevant for the Baccalaureate outcomes They show that the Romanian high school admissions pro-cess provides a potentially fruitful setting for an RD analysis of the impact of having access to a better school at least if school quality is judged by average transition scores39 Below we will explore other dimensions along which school characteris-tics vary at the cutoffs
Additionally recall that students apply for schooltrack combinations and so the between-track cutoffs also provide candidate first stages The corresponding regres-sion results are presented in panel B of Table 3 In all cases the coefficient of interest is somewhat smaller (although always statistically significant) than that observed for the between school cutoffs (Figure A2 in the online Appendix presents the cor-responding graphical results)
34 We note that all our regression results are not qualitatively affected by instead using a linear quadratic or cubic specification for a( t i ) in (4) or by excluding the cutoff fixed effects
35 Table A3 in the online Appendix presents the full sample results omitted here for reasons of space36 For example a previous version of the paper focused on only the administrative data (which offer substantial
sample sizes) featured specifications that for each cutoff used only the two students immediately to the left and right37 Specifically we follow Lee and Lemieux (2010) and use a simple rectangular kernel Further we implemented
the bandwidth selection procedure using the Stata ado file labeled rdobado available at httpfaculty-gsbstanfordeduimbensdocumentsrdobzip (accessed April 13 2013)
38 It is possible that the greater magnitude of the ldquofirst stagerdquo in the survey towns reflects that these have fewer available cutoffs For example if students seek to segregate by ability then (subject to assumptions on the density of scores and the size of schools) towns with fewer schools might have greater discontinuities On the other hand if students cared only about proximity to school or in the extreme chose schools randomly then the magnitude of the discontinuities might not vary systematically with town size
39 The RD approach additionally requires that there be no discrete changes in student characteristics that affect outcomes like Baccalaureate performance While our administrative data do not contain such variables our survey data suggest this condition is fulfilled Specifically online Appendix Table A4 shows that a number of mother child and household characteristics do not vary discontinuously around the cutoffs (all but one of the 20 estimates are insignificant in the sample within one point of the cutoffs) As an additional test online Appendix Figure A7 shows that there is no visible jump in the density around the discontinuity as expected the McCrary (2008) test shows no statistically significant break (log difference in height is 0074 with a standard error of 0058)
1306 THE AMERICAN ECONOMIC REVIEW juNE 2013
This is consistent with some sorting happening between-tracks within schools with the implication being that students with access to higher ranked schools expe-rience better peers but that this effect is more marked if the measure is the aver-age score of their school-level rather than their track-level peers Panel C (Table 3) confirms this by exploring how the track level average transition grade students experience changes at the cutoffs that determine access to a higher ranked school The observed estimates are still highly significant but smaller than those observed when peer groups are defined at the school level (panel A)
In order to elaborate on how these first stage results originate we note that not all students request the highest-ranked school they are eligible for Specifically panels A and B in Figure 2 summarize information regarding the cutoffs that sepa-rate the best and second-best school in towns with at least three schools Panel A plots transition score cell means of the percentage of students who attend the high-est-ranked school and not surprisingly this is equal to zero when students scores are to the left of the cutoff these students are not eligible to attend the most selective school While the proportion of students in the best school jumps discretely once one moves to the right it does not rise to one rather roughly 40 percent of children eligible for enrollment in the best school take advantage of the opportunity Panel B which plots the percentage of individuals in the second best school shows that about 25 percent of those eligible for the best decide to remain in the second-best school with another 35 percent attending institutions other than the top two40
Multiple factors (eg proximity) may account for why not all students request the highest-ranked school they are eligible for Whichever ones are actually operative Figure 2 underlines that results generated using the first stages in Table 3 should be interpreted in an ldquointent to treatrdquo spirit41
B Baccalaureate Outcomes
A first outcome we consider is simply whether students took the Baccalaureate exam Panels C and D in Figure 1 present the graphical evidence and suggest few if any changes in test-taking rates at the cutoffs This is confirmed in regressions in panel A of Table 4 where columns 1 and 2 refer to the full sample of towns The results suggest that having access to a higher-ranked school results in small and sta-tistically insignificant changes in the probability of taking the Baccalaureate exam The results within bands allow us to rule out differences in test-taking rates of less than a third of a percentage point42
A generally similar conclusion emerges among the towns in our survey sample (Table 4 panel A columns 3 and 4 and online Appendix Figure A1 panels C and D) and when we analyze the opportunity to enroll in a better track (Table 4 panel D
40 A related note is that all regressions exclude the child whose score was exactly equal to the cutoff since that student may be selected This reflects that this studentrsquos score dictates the cutoff score and mechanically that stu-dent attends the better school with probability one which is empirically not the case with the individuals right above her This exclusion does not have a qualitative effect on any of our conclusions
41 For further reference panels C and D in Figure 2 show analogous evidence for the cutoffs separating the worst and the next to worst schools in each town panels E and F plot similar information for towns with only two schools
42 The full sample results are in online Appendix Table A5
1307pop-eleches and urquiola going to a better schoolVol 103 no 4
and online Appendix Figure A2 panels C and D)43 This consistent lack of evidence of selection into test taking makes it easier to interpret effects on Baccalaureate performance
Turning to this issue panels E and F in Figure 1 describe grade outcomes at the cutoffs suggesting a discrete increase in average achievement The corresponding regression evidence is in panel B of Table 4 which presents statistically significant
43 In contrast to Table 3 Table 4 no longer has columns 5 and 6 Again this reflects that for the 2005ndash2007 cohorts we do not have Baccalaureate outcomes so these variables are not available for the children we surveyed
0
025
05
075
1
0
025
05
075
1
0
025
05
075
1
0
025
05
075
1
0
025
05
075
1
0
025
05
075
1
Per
cent
of s
tude
nts
in
scho
ol a
bove
cut
off
Per
cent
of s
tude
nts
in
scho
ol b
elow
cut
off
Per
cent
of s
tude
nts
in
scho
ol b
elow
cut
off
Per
cent
of s
tude
nts
in
scho
ol b
elow
cut
off
Per
cent
of s
tude
nts
in
scho
ol a
bove
cut
off
Per
cent
of s
tude
nts
in
scho
ol a
bove
cut
off
ndash02 ndash01 0 01 02 ndash02 ndash01 0 01 02
ndash02 ndash01 0 01 02 ndash02 ndash01 0 01 02
ndash02 ndash01 0 01 02 ndash02 ndash01 0 01 02
Score distance to cutoff
Panel A Cutoffs for the best two schools
Score distance to cutoff
Panel B Cutoffs for the best two schools
Score distance to cutoff
Panel C Cutoffs between the worst two schools
Score distance to cutoff
Panel D Cutoffs between the worst two schools
Score distance to cutoff
Panel E Cutoffs in two-school towns
Score distance to cutoff
Panel F Cutoffs in two-school towns
Figure 2 Top and Bottom Cutoffs in Towns with Three or More Schools Two-School Towns
Notes Panels A and B describe cutoffs that determine access to the best school in towns that contain at least three schools Panels C and D refer to the lowest cutoffs in such towns Panels E and F describe the cutoffs in two-school towns All panels are restricted to individuals with a transition score within 02 points of a cutoff The left-hand panels plot (001 point) transition cell means of the proportion of students who attend the school above the cutoff the right-hand-side panels plot the proportion of students who enroll in the school below The solid lines plot fit-ted values of residuals from regressions of the dependent variable on a linear trend in the transition score estimated separately on each side of the cutoff
1308 THE AMERICAN ECONOMIC REVIEW juNE 2013
gains equivalent to about 002 to 010 standard deviations depending on whether one looks at the full or the survey sample
The bottom line is that students who score above cutoffs giving them access to higher ranked schools perform better in the high stakes Baccalaureate exam and under the assumptions underlying RD designs this impact can be viewed as causal44
44 Table A6 in the online Appendix illustrates that these conclusions are robust to changing the controls included in the regressions Panel A features no controls at all and panel B features only cutoff fixed effects Panel C adds
Table 4mdashEffects on Baccalaureate Taking and Performance
All towns Survey towns
Within Within Within Within1 point IK 1 point IK
of cutoff bound of cutoff bound(1) (2) (3) (4)
Panel A Baccalaureate taken dummy 2001ndash2003 cohortsmdashbetween school cutoffs
1Transition grade ge cutoff 0000 0001 0012 0006(0001) (0001) (0009) (0007)
Linear spline Yes Yes Yes YesR2 0054 0053 0081 0082
Observations 1857376 2086043 39363 49100
Panel B Baccalaureate grade 2001ndash2003 cohortsmdashbetween school cutoffs
1Transition grade ge cutoff 0018 0019 0105 0099(0002) (0002) (0015) (0016)
Linear spline Yes Yes Yes YesR2 0483 0488 0494 0490
Observations 1256038 1394577 25393 24029
Panel C Baccalaureate grade 2001ndash2003 cohortsmdashbetween school cutoffs IV specification
Average school transition grade 0163 0177 0228 0212(0020) (0020) (0033) (0034)
Linear spline Yes Yes Yes Yes
Observations 1256038 1394577 25393 24029
Panel D Baccalaureate taken dummy 2001ndash2003 cohortsmdashbetween track cutoffs
1Transition grade ge cutoff minus0001 minus0001 0000 0000(0001) (0001) (0004) (0004)
Linear spline Yes Yes Yes YesR2 0057 0058 0084 0086
Observations 4845812 4567167 172656 150025
Panel E Baccalaureate grade 2001ndash2003 cohortsmdashbetween track cutoffs
1Transition grade ge cutoff 0011 0011 0036 0036(0001) (0001) (0007) (0007)
Linear spline Yes Yes Yes YesR2 0490 0497 0495 0493
Observations 3371726 3206212 117179 114663
Notes All regressions are clustered at the student level and include cutoff fixed effects Standard errors are in parentheses All panels present reduced form specifications where the key independent variable is a dummy for whether a studentrsquos transition score is greater than or equal to the cutoff
Significant at the 1 percent level Significant at the 5 percent level Significant at the 10 percent level
1309pop-eleches and urquiola going to a better schoolVol 103 no 4
A similar conclusion emerges when looking at the towns covered in our special-ized survey (Table 4 panel B columns 3 and 4 and online Appendix Figure A1 panels E and F) and when one considers between-track rather than between school cutoffs (Table 4 panel E and online Appendix Figure A2 panels E and F)
The magnitude of the effects on test performance is greatest in the survey towns which is consistent with the larger first stage estimates observed there In order to illustrate this panel C (Table 4) presents specifications in which peer quality is instrumented using the cutoffs as in equations (5)ndash(6) Measured this way the mag-nitude of the impact of peer quality across samples is relatively stable We note that we present these IV estimates in a descriptive spirit since as we return to below the exclusion restriction is likely not satisfied
C Heterogeneity in Baccalaureate Outcomes
The results above pool all between school and between track cutoffs We now explore how the Baccalaureate effects vary according to where the cutoffs are located in the transition score distribution To provide a visual summary of the results Figure 3 presents the first stages observed in the top (panels A and B) and bottom terciles (panels C and D) of between-school cutoffs if these were ordered according to the grades at which they happen It illustrates that on average students are inter-ested both in accessing the best schools and avoiding the worstmdashin both cases dis-crete changes in the probability of attending the higher-ranked school are observed at the cutoff However the magnitude of this effect is larger among the higher cutoffs
Panels EndashH present evidence on Baccalaureate performance45 Panels E and F suggest that gaining admission to a higher-ranked school when the cutoff in ques-tion is in the top third of cutoffs raises testing performance Panels G and H point to a similar if less precisely estimated effect among the bottom cutoffs
Table 5 presents regressions for these and other samples For the sake of space it uses only observations within one point of the cutoffs and focuses on between-school cutoffs To illustrate panel A refers to the full sample and repeats results pre-sented above Column 1 presents the first stage (from Table 3 panel A column 1) Columns 2 and 3 focus on Baccalaureate taking and performance and column 4 presents an IV specification Panels B and C refer to the top and bottom tercile of cutoffs and panels D E and F to towns with four or more three or two schools respectively Column 1 shows that the first stages are larger among the top (relative to the bottom) tercile and in two school towns (relative to larger markets) Column 2 shows that the lack of an effect on test taking persists in all subsamples In contrast the estimates surrounding Baccalaureate performance (column 3) again generally suggest a positive impact from having access to a higher ranked school The magni-tude of the effect is again larger wherever the first stages are larger (eg top versus bottom tercile and smaller versus larger markets) although the estimates espe-cially in the IV specifications cannot always be statistically distinguished
Baccalaureate test subject dummiesmdashsince we know the subjects that each student took for the different parts of the Baccalaureate exam we can include subject-specific indicators to control for differences in the composition of the tests students wrote Finally panel D adds track fixed effects
45 We omit the evidence on test taking because there is again no evidence of an effect along this dimension
1310 THE AMERICAN ECONOMIC REVIEW juNE 2013
Table 5mdashHeterogeneity in Baccalaureate Effects (All specifications within one point of cutoffs)
School level Baccalaureateaverage Baccalaureate Baccalaureate grade
transition score taken grade IV specification(1) (2) (3) (4)
Panel A Full sample
1Grade ge cutoff 0107 0000 0018 0163(0001) (0001) (0002) (0020)
Linear spline Yes Yes Yes YesR2 0790 0054 0483 mdash
Observations 1857376 1857376 1256038 1256038
Panel B Top tercile
1Grade ge cutoff 0158 0003 0048 0317(0002) (0002) (0003) (0022)
Linear spline Yes Yes Yes YesR2 0749 0028 0448 0448
Observations 756141 756141 579566 579566
Panel C Bottom tercile
1Grade ge cutoff 0099 minus0008 minus0005 minus0063(0003) (0004) (0009) (0099)
Linear spline Yes Yes Yes YesR2 0459 0050 0223 0222
Observations 392475 392475 212282 212282
Panel D Towns with four or more schools
1Grade ge cutoff 0097 0000 0016 0162(0001) (0001) (0002) (0023)
Linear spline Yes Yes Yes YesR2 0792 0053 0483 mdash
Observations 1806411 1806411 1223341 1223341
Panel E Towns with three schools
1Grade ge cutoff 0333 minus0007 0028 0085(0007) (0009) (0016) (0050)
Linear spline Yes Yes Yes YesR2 0745 0069 0488 mdash
Observations 31149 31149 19877 19877
Panel F Towns with two schools
1Grade ge cutoff 0697 0020 0179 0249(0010) (0013) (0023) (0032)
Linear spline Yes Yes Yes YesR2 0726 0093 0475 mdash
Observations 19816 19816 12820 12820
Notes All regressions are clustered at the student level and include cutoff fixed effects Standard errors are in parentheses All panels present reduced form specifications where the key independent variable is a dummy for whether a studentrsquos transition score is greater than or equal to the cutoff For comparison panel A replicates the (within one point) specifications in Tables 3 and 4 Panels B and C present analogous specifications for the top and bottom tercile of cutoffs respectively Panels D E and F present analogous results among towns with four or more schools towns with three schools and towns with two schools respectively
Significant at the 1 percent level Significant at the 5 percent level Significant at the 10 percent level
1311pop-eleches and urquiola going to a better schoolVol 103 no 4
The bottom line is that access to a higher-ranked school might be valuable to both high and low-scoring children but statistical power constrains our ability to further explore such heterogeneity More generally school effects are difficult to identify and sample size issues might account for some of the variation in conclu-sions observed in the literature46
46 In addition online Appendix Table A7 explores how track choices change around the cutoffs Gaining access to a higher-ranked school does not on average imply automatically attending a better track but instead the pattern is
Figure 3 Top and Bottom Terciles of Between-School Cutoffs
Notes All panels are based on administrative data for the 2001ndash2003 admission cohorts and restrict observations to individuals with transition scores within 02 points of a cutoff The left-hand-side panels plot (001 point) tran-sition score cell means of the dependent variable The right-hand-side panels plot analogous means of residuals from a regression of the dependent variable on cutoff fixed effects In each panel the solid lines are fitted values of regressions of the dependent variable on a linear trend in the transition score estimated separately on each side of the cutoff Panels A B E and F refer to the top tercile of between-school cutoffs ordered by the scores at which they take place panels C D G and H to the bottom tercile The dependent variable in panels AndashD is the average transition score of the peers students encounter at school the dependent variable in panels EndashH is the Baccalaureate exam grade
8
825
85
Sch
ool l
evel
sc
ore
Sch
ool l
evel
sc
ore
Sch
ool l
evel
sc
ore
Sch
ool l
evel
sc
ore
ndash02 ndash01 0 01 02 ndash02 ndash01 0 01 02
ndash02 ndash01 0 01 02 ndash02 ndash01 0 01 02
ndash02 ndash01 0 01 02 ndash02 ndash01 0 01 02
ndash02 ndash01 0 01 02 ndash02 ndash01 0 01 02
Score distance to cutoff
Panel A Top cutoffs avg trans scoremdashno controls
ndash02
ndash01
0
01
02
ndash02
ndash01
0
01
02
ndash02
ndash01
0
01
02
ndash02
ndash01
0
01
02
Score distance to cutoff
Panel B Top cutoffs avg trans scoremdashcontrols
66
685
71
Score distance to cutoff
Panel C Bottom cutoffs avg trans scoremdashno controls
Score distance to cutoff
Panel D Bottom cutoffs avg transition scoremdashcontrols
84
855
87
Gra
de
Score distance to cutoff
Panel E Top cutoffs Bacc grademdashno controls
Gra
de
Score distance to cutoff
Panel F Top cutoffs Bacc grademdashcontrols
72
735
75
Gra
de
Score distance to cutoff
Panel G Bottom cutoffs Bacc grademdashno controls
Gra
de
Score distance to cutoff
Panel H Bottom cutoffs Bacc grademdashcontrols
1312 THE AMERICAN ECONOMIC REVIEW juNE 2013
D Behavioral Responses and Equilibrium Effects
Using our survey data we now investigate whether a major educational inter-vention like giving a child access to a higher-ranked school might lead to behav-ioral responses As noted our analysis does not attempt to isolate to what extent specific responses (eg those on the part of parents teachers or peers) account for the impact that attending a higher-ranked school has on childrenrsquos academic achievement47
To present results in this area we make some notes on the structure of Tables 6ndash8 All of these estimate specification (7) but the level to which data are aggregated varies across panels In each table panel A aggregates outcomes to the school level panel B aggregates them to the track level and panel C presents them at the child or parent level For example in Table 6 one dependent variable is an indicator for whether Language teachers passed a certification exam Panel A thus compares the children who scored just above a threshold with those who scored just below and asks if on average their schools have more certified language teachers panel B asks if the tracks they are in are more likely to have certified teachers panel C asks if their own teacher is more likely to be certified48 Note that the variables from the principal survey only vary at the school level so panels B and C are blank for them As before for each variable we present two specifications in Tables 6ndash8 where our preferred one is that restricted to individuals within one transition score point from the cutoff we usually use these when discussing the results The corresponding full sample results are in online Appendix Tables A8ndashA10 Finally here we focus only on the top cutoffs Among our survey towns this restriction is relevant only for those with three schools (19 of the 59 towns in the sample) the two school towns of course contain only one cutoff49
In addition in Figure 4 panels A and B are aggregated to the school level C and D to the track level and E and F are at the studentparent level Since we have fewer observations in the survey data the cells that we plot are within 005 of a transition score from each other
Teacher CharacteristicsmdashFigure 4 and Table 6 describe the impact that scoring above a school cutoff has on the teacher characteristics that students experience The first two columns of Table 6 show that students above the cutoff are about 13 percent more likely to attend a school with a principal who claims to have the best teachers in town The remaining columns describe Language teacher qualifica-tions as provided by their schools based on administrative records50
nonlinear Scoring above a cutoff means that one is more likely to attend the middle ranked tracks (Social Sciences and Humanities) and less likely to attend the worst (Technical) and best (Math) tracks These effects are usually larger in markets with fewer schools (panels C and D) where schools offer a more limited range of tracks
47 Econometrically this would be hard to do without strong assumptions given that we have one source of argu-ably exogenous variation in the treatment (attending a higher-ranked school) and many variables that might account for this effect (eg teacher school parent and peer effects)
48 An individual studentrsquos outcome can be different from that observed in his track because some schools feature multiple classes within a track Our survey asked each student for his or her Language teacherrsquos name and we used that to match students to teachers and teacher characteristics as supplied by the school based on administrative data
49 This reflects that the difference in peer quality between the bottom two schools in three school towns was small
50 We focus on Language teachers since all children in all tracks take this subject
1313pop-eleches and urquiola going to a better schoolVol 103 no 4
The dependent variable in columns 3 and 4 is an indicator for whether teachers have attained the highest certification standardmdasha credential that about 60 percent of teachers in Romania have Panel A shows that relative to those who just miss students who score above a school cutoff attend schools where on average Language teachers are about 10 percent more likely to have reached this standard Panel B shows this effect is reduced to about 3 percent when one looks at the tracks students are enrolled in Panel C shows that the effect essentially disappears once one consid-ers the actual teachers assigned to studentsmdashthose just above a cutoff are not more likely to have a certified teacher than those just below
This conclusion is also visible in Figure 4 where panel A shows a sharp discon-tinuity in the school-level probability of Language teachers having the highest cer-tification standard Panel B shows significantly smaller discontinuities at the track level and panel C suggests no discontinuity in terms of the actual teacher students encounter
In short in terms of teacher certification differences between schools exist on average but these disappear when one considers the actual teachers experienced by students at the margin This is consistent with teachers sorting both across and
Table 6mdashTeachers
Principals perceive their school to be
Language teacher has the highest Language teacher
Language teacher is a ldquonovicerdquo
the best in teacher quality
certification standard
experience in years
(less than two years experience)
Within Within Within Within Within Within Within Within1 point IK 1 point IK 1 point IK 1 point IK
of cutoff bound of cutoff bound of cutoff bound of cutoff bound(1) (2) (3) (4) (5) (6) (7) (8)
Panel A School level
1Trans grade ge cutoff 0128 0112 0095 0087 1894 1790 minus0037 minus0033(0028) (0033) (0025) (0028) (0490) (0522) (0011) (0012)
Linear spline Yes Yes Yes Yes Yes Yes Yes YesR2 0490 0470 0610 0600 0600 0580 0600 0590
Observations 6290 7380 6065 6736 6065 6825 6065 6128
Panel B Track level
1Trans grade ge cutoff 0026 0037 minus0076 0118 minus0036 minus0027(0033) (0034) (0878) (0913) (0014) (0017)
Linear spline Yes Yes Yes Yes Yes YesR2 0480 0450 0410 0370 0450 0390
Observations 6065 7977 6065 8978 6065 8305
Panel C Studentparent level
1Trans grade ge cutoff minus0005 minus0011 minus0625 minus1077 minus0036 minus0026(0021) (0021) (0539) (0496) (0011) (0010)
Linear spline Yes Yes Yes Yes Yes YesR2 0370 0370 0310 0300 0360 0340
Observations 6065 5955 6065 7801 6065 7242
Notes All regressions include cutoff fixed effects Standard errors are in parentheses The regressions in panel A are clustered at the school-cohort level the regressions in panel B are clustered at the school-track-cohort level and the regressions in panel C are clustered at the student level All panels present reduced form specifications where the key independent variable is a dummy for whether a studentrsquos transition score is greater than or equal to the cutoff Panel A presents outcome variables that are aggregated at the school level Panel B presents outcome variables that are aggregated at the track level Panel C presents outcome variables that are at the child or parent level (see Section V)
Significant at the 1 percent level Significant at the 5 percent level Significant at the 10 percent level
1314 THE AMERICAN ECONOMIC REVIEW juNE 2013
within schools in a way associated with student stratification For example the pat-tern of results could reflect the highest certification teachers having a preference formdashand through seniority gravitating towardmdashthe highest academic ability chil-dren Consistent with this columns 5 and 6 (Table 6) reveal a similar pattern when teacher quality is measured using years of experience
We note that differences persist across panels for some of our measures of teacher quality Columns 7 and 8 show that attending a better school decreases the
03
04
05
06
07
03
04
05
06
07
02
03
04
05
06
07
Cer
tific
atio
n
ndash1 ndash05 0 05 1 ndash1 ndash05 0 05 1
ndash1 ndash05 0 05 1 ndash1 ndash05 0 05 1
ndash1 ndash05 0 05 1 ndash1 ndash05 0 05 1
Score distance to cutoff
Panel A No controls school level
ndash03
ndash02
ndash01
0
01
ndash03
ndash02
ndash01
0
01
ndash04
ndash03
ndash02
ndash01
0
01
Cer
tific
atio
n
Score distance to cutoff
Panel B Controls school levelC
ertif
icat
ion
Score distance to cutoff
Panel C No controls track level
Cer
tific
atio
n
Score distance to cutoff
Panel D Controls track level
Cer
tific
atio
n
Score distance to cutoff
Panel E No controls student level
Cer
tific
atio
n
Score distance to cutoff
Panel F Controls student level
Figure 4 Teacher Certification
Notes All panels are based on survey data for the 2005ndash2007 admission cohorts and restrict observations to indi-viduals with transition scores within one point of a cutoff The left-hand-side panels plot (005 point) transition score cell means of an indicator for whether teachers have attained the maximum certification standard The right-hand-side panels plot analogous means of residuals from a regression of the dependent variable on cutoff fixed effects The solid lines are fitted values of regressions of the dependent variable on a linear trend in the transition score estimated separately on each side of the cutoff Panels A and B present the outcome variable aggregated to the school level and panels C and D present it aggregated to the track level Panels E and F present the outcome variable at the child or parent level
1315pop-eleches and urquiola going to a better schoolVol 103 no 4
probability of having a ldquonovicerdquo teacher (one with two or fewer years of experience) not just on average but also at the margin51
Parental EffortmdashTable 7 and online Appendix Figures A3 and A4 describe the impact that access to a higher-ranked school has on measures of parental involve-ment and effort We focus on measures of participation at school and on variables intended to capture parentsrsquo interactions with their children such as the willingness to help with homework or pay for tutoring services52
The first four columns of Table 7 indicate that children above cutoffs attend schools where parents are on average more involved at school This emerges both in prin-cipals reports of parental participation (columns 1 and 2 panel A) and in parentsrsquo self-reports on volunteering (columns 3 and 4 panel A) However the impacts at the
51 On average teachers have about 15 years of experience with only 6 percent having less than two years52 To illustrate the variation in these dimensions 11 percent of parents report having volunteered in their childrsquos
classroom school office or library in the last year About 24 percent report having paid for private tutoring lessons a common practice in Romania (secondary education is free in Romania hence we do not consider tuition expenses as a measure of effort) Roughly 20 percent of parents claim to help with homework on a daily or almost daily basis
Table 7mdashParents
Principals perceive their school to be
Parents have volunteered
Parents have paid for tutoring
Parents help child
the best in parental participation
in the past year
services for child
with homework often
Within Within Within Within Within Within Within Within1 point IK 1 point IK 1 point IK 1 point IK
of cutoff bound of cutoff bound of cutoff bound of cutoff bound(1) (2) (3) (4) (5) (6) (7) (8)
Panel A School level
1Trans grade ge cutoff 0125 0130 0012 0012 0063 0064 0000 0000(0044) (0042) (0005) (0005) (0009) (0010) (0007) (0007)
Linear spline Yes Yes Yes Yes Yes Yes Yes YesR2 0480 0490 0710 0700 0750 0750 0740 0730
Observations 6139 5558 6522 7142 6501 7255 6488 9674
Panel B Track level
1Trans grade ge cutoff 0005 0006 0009 0020 minus0026 minus0022(0006) (0007) (0012) (0011) (0010) (0010)
Linear spline Yes Yes Yes Yes Yes YesR2 0490 0470 0550 0560 0500 0500
Observations 6522 7606 6501 5363 6488 7141
Panel C Studentparent level
1Trans grade ge cutoff minus0002 0007 minus0003 minus0003 minus0043 minus0033(0015) (0014) (0018) (0017) (0019) (0017)
Linear spline Yes Yes Yes Yes Yes YesR2 0070 0070 0130 0130 0090 0090
Observations 6522 7905 6501 6771 6488 8840
Notes All regressions include cutoff fixed effects Standard errors are in parentheses The regressions in panel A are clustered at the school-cohort level the regressions in panel B are clustered at the school-track-cohort level and the regressions in panel C are clustered at the student level All panels present reduced form specifications where the key independent variable is a dummy for whether a studentrsquos transition score is greater than or equal to the cutoff Panel A presents outcome variables that are aggregated at the school level Panel B presents outcome variables that are aggregated at the track level Panel C presents outcome variables that are at the child or parent level (see Section V)
Significant at the 1 percent level Significant at the 5 percent level Significant at the 10 percent level
1316 THE AMERICAN ECONOMIC REVIEW juNE 2013
track and individual level become small and statistically insignificant (columns 3 and 4 panels B and C) Online Appendix Figure A3 confirms that there is a discon-tinuity in parental volunteering at the school level but not at the parent level As was the case with teacher characteristics this implies differences between the average and marginal parental effort children who score just above cutoffs have peers whose parents participate more at school but their own parents do not participate more than those of children who score just below A similar conclusion emerges in columns 5 and 6 where we consider the frequency of parental expenditures on tutoring
At the same time there is evidence of parental behavioral responses in other dimensions Columns 7 and 8 in Table 7 consider the extent to which they help their children with homework Panel A shows that children who score above cutoffs attend schools where on average children are no more likely to receive parental help on a daily or almost daily basis This might not be surprising if the need for help declines with academic ability However the most striking result is shown in panel C (as well as in panel F of online Appendix Figure A4) children who score just above cutoffs are less likely to get help from their parents This suggests that at least in our setting parents might view their own effort and school quality as substitutes
Interaction with PeersmdashOur first stage result is that children who score above cutoffs are on average exposed to peers that have higher average transition scores53 This result is confirmed and expanded upon by columns 1 and 2 of Table 8 which measure peer quality using principalsrsquo ranking of student quality among schools within their towns
According to the often cited linear-in-means model these findings would imply positive peer effects for the children who make it into a higher-ranked school54 However scoring above a cutoff could adversely impact children if their relative ability matters since this makes them ldquoa small fish in a big pondrdquo Indeed models which stress relative comparisons suggest negative effects through a reduction in confidence andor self-esteem
To explore this possibility we first investigate whether children who score just above cutoffs actually perceive being lower in their peer ability distribution Columns 3 and 4 use questions which asked children about their rank within their track The responses ranged from 1 to 7 with higher numbers indicating a better ability rank Panels A and B show that children in higher-ranked schools are more likely to feel they are strong relative to their peers further as might be expected if individuals have over-optimistic views the coefficient is positive rather than zero More interestingly panel C confirms that in contrast children who score just above cutoffs rank themselves lower than those who score just belowmdashthe coefficients are negative and significant in this case This might not be surprising given that Romaniarsquos student allocation system is well understood by students
Finally we explore whether such feelings of inferiority are associated with the nature of childrenrsquos interaction with their peers We measure this using an index of negative interactions that averages four indicators for whether children report
53 The first stage for this particular sample is shown in columns 7ndash9 of panel D Table 354 A number of papers investigate the existence and functional form of peer effects (eg Hoxby and
Weingarth 2006 Lavy Paserman and Schlosser 2007 and Jackson 2010b)
1317pop-eleches and urquiola going to a better schoolVol 103 no 4
that in the last month their peers have (i) been mean to them (ii) hit them (iii) taken their things without asking or (iv) made them feel marginalized The pos-sible responses for each of these items ranged from zero (did not happen at all in the past month) to five (happened daily) the average of 012 across all four indica-tors suggests that these events are relatively rare The results in Table 8 (columns 5 and 6) do not reveal average differences at the school level However the track and most importantly the individual level provide evidence of more frequent negative interactions for children who score just above cutoffs a pattern confirmed by the graph in panel F of online Appendix Figure A5 In short these results leave open the possibility that getting into a better school might result in feelings of insecurity or marginalization
Student EffortmdashFinally we explore effort responses on the part of students Our variables of interest are indicators for whether students did homework daily or almost
Table 8mdashPeers
Principals perceive their school to be
Childrsquos perception of hisher
Childrsquos experience of negative
the best in student quality
rank in his her track
interactions with peers
Within Within Within Within Within Within1 point IK 1 point IK 1 point IK
of cutoff bound of cutoff bound of cutoff bound(1) (2) (3) (4) (5) (6)
Panel A School level
1Trans grade ge cutoff 0336 0333 0172 0159 0004 0005(0045) (0046) (0028) (0032) (0008) (0008)
Linear spline Yes Yes Yes Yes Yes YesR2 0470 0470 0690 0680 0690 0690
Observations 6513 6737 6478 8264 6500 6612
Panel B Track level
1Trans grade ge cutoff 0090 0100 0012 0014(0031) (0033) (0011) (0011)
Linear spline Yes Yes Yes YesR2 0520 0520 0480 0490
Observations 6478 9666 6500 8162
Panel C Studentparent level
1Trans grade ge cutoff minus0134 minus0126 0045 0036(0059) (0051) (0019) (0017)
Linear spline Yes Yes Yes YesR2 0120 0130 0080 0080
Observations 6478 9009 6500 8289
Notes All regressions include cutoff fixed effects Standard errors are in parentheses The regressions in panel A are clustered at the school-cohort level the regressions in panel B are clustered at the school-track-cohort level and the regressions in panel C are clustered at the student level All panels present reduced form specifications where the key independent variable is a dummy for whether a studentrsquos transition score is greater than or equal to the cut-off Panel A presents outcome variables that are aggregated at the school level Panel B presents outcome variables that are aggregated at the track level Panel C presents outcome variables that are at the child or parent level (see Section V)
Significant at the 1 percent level Significant at the 5 percent level Significant at the 10 percent level
1318 THE AMERICAN ECONOMIC REVIEW juNE 2013
daily in the month prior to the survey an assessment of which our survey solicited from both parents and the children themselves The results are presented in the first four columns of online Appendix Table A11 where panel A suggests that students in better schools do more homework on average In this case this effect persists on the margin at least for the parental reports which suggest a 5 percent increase in the probability of doing homework on a daily or almost daily basis55 Finally columns 5 and 6 show that while on average children at better schools perceive homework to be easier the coefficient ceases to be statistically significant and changes sign at the margin suggesting that perhaps not surprisingly marginal children encounter more difficulty with homework at higher-ranked schools56
E Within Track Analysis
Thus far we have focused on the reduced-form effects of having the chance to attend a better school or track within a school This is a natural first approach given that students apply for high schooltrack combinations In this section we consider the effects of being able to enroll in a better class within a given track
Specifically the Ministry of Education stipulates that after students are admit-ted to a particular track they should be allocated to classes containing at most 28 students57 The Ministry does not specify the details of this allocation this is decided by each school Our survey data suggest that many schools further stratify children into classes based on their transition scores58
To estimate the effect of having access to a better class (within a track) we focus only on tracks which had slot offerings that were multiples of 28 (ie 56 84 etc) and which were also filled at the time of the admission process59 We ranked the students in these tracks in descending order based on their transition scores and calculated class level cutoff scores based on the transition score of the 28th (or 56th or 84th etc) student As above we stacked the data by keeping on each side of a particular cutoff the 28 students within a track with scores closest to the cutoff Also as above this analysis should yield intent to treat estimates of scoring above a particular class level cutoff60
Understanding these effects is interesting for two reasons First by looking at chil-dren in different classes but in the same track we make comparisons between students who are exposed to the same curriculum Second considering classes allows us to ana-lyze behavioral responses in a way that more closely approximates the experimental
55 The results on childrenrsquos homework effort are confirmed graphically in online Appendix Figure A656 In online Appendix Table A12 we explore how the main behavioral responses differ if one compares school
markets with two versus three schools Online Appendix Table A13 similarly analyzes how these vary with whether one looks at the top or bottom half of cutoffs according to the test score levels at which they are located These exercises do not generally produce evidence of a substantial amount of heterogeneity in the magnitude of behavioral responses
57 After being allocated to a particular class students usually spend the next four years with the same peers58 In anecdotal evidence our conversations with headmasters confirm that many schools have this policy59 As mentioned our identification strategy is based on the fact that the majority of schools reach their pre-
announced capacity constraint As noted however enrollment in many of the less desirable schools is less than the number of initial slot offerings In contrast to the administrative data we have exact information on school and track capacities in this exercise because it was collected in the survey
60 Again while not every school in our sample allocates children to classes based only on the transition score as long as a fraction of schools do so we can estimate the effects of being able to attend a better class within a track
1319pop-eleches and urquiola going to a better schoolVol 103 no 4
setting of Duflo Dupas and Kremer (2011) where an RD analysis compares students who are on the margin of being assigned to low or high achievement classes
Table 9 presents the results at the class (panel A) and child or parent level (panel B) For variables that do not vary within classes such as class-level peer quality or teacher qualifications the results in both panels are identical and are therefore presented only once Column 1 begins by illustrating the ldquofirst stagerdquo
Table 9mdashClass Effects (All specifications within one point of cutoffs)
First stage Teachers Parents
Language Language Parents Parents ParentsClass teacher Language teacher has have have helplevel has the teacher two or less volunteered paid for child with
transition highest experience years in the tutoring homeworkscore certification (in years) experience past year services often(1) (2) (3) (4) (5) (6) (7)
Panel A Class level
1Trans grade ge cutoff 0127 0046 1832 minus0006 0006 0026 0004(0017) (0021) (0500) (0006) (0005) (0007) (0005)
Linear spline Yes Yes Yes Yes Yes Yes YesR2 0890 0560 0600 0530 0560 0740 0590
Observations 5396 5179 5179 5179 5362 5346 5349
Panel B Studentparent level
1Trans grade ge cutoff minus0008 minus0001 minus0012(0012) (0016) (0015)
Linear spline Yes Yes YesR2 0120 0250 0120
Observations 5373 5357 5360
Peers Child
Childrsquos Childrsquos Child does Child does Childperception negative homework homework perceivesof hisher interaction almost almost homework
rank in with every day every day to betrack peers (child report) (parent report) easy(8) (9) (10) (11) (12)
Panel A Class level (continued)1Trans grade ge cutoff 0044 minus0007 0021 0017 0032
(0019) (0005) (0008) (0007) (002)Linear spline Yes Yes Yes Yes YesR2 0620 0520 0720 0700 0620
Observations 5342 5350 5385 5355 4443
Panel B Studentparent level (continued)1Trans grade ge cutoff minus0142 minus0018 0003 0010 minus0032
(0047) (0013) (0017) (0015) (0042)Linear spline Yes Yes Yes Yes YesR2 0200 0100 0240 0230 0190
Observations 5353 5361 5396 5366 4453
Notes All regressions include cutoff fixed effects Standard errors are in parentheses The regressions in panel A are clustered at the school-class-cohort level and the regressions in panel B are clustered at the student level All panels present reduced form specifications where the key independent variable is a dummy for whether a studentrsquos transi-tion score is greater than or equal to the cutoff Panel A presents outcome variables that are aggregated at the class level Panel B presents outcome variables that are at the child or parent level (see Section V)
Significant at the 1 percent level Significant at the 5 percent level Significant at the 10 percent level
1320 THE AMERICAN ECONOMIC REVIEW juNE 2013
showing that there is a clear discontinuity in classroom peer quality at the class cut-offs An increase of 013 points in the average transition emerges from a regression using observations within 1 point of the cutoffs Although the effect is highly signifi-cant its magnitude is about half the size of the track-based estimates and about one fourth the size of the school-based estimates This reflects that there is significantly less variability in the transition scores between classes within schooltracks
Columns 2ndash4 consider the same teacher characteristics examined in Table 6 The evidence suggests that teacher sorting is also prevalent across classes in a schooltrack Students who score above a class cutoff are exposed to teachers who are 5 percent more likely to have the highest certification and have 18 more years of experience61
The remaining columns present all the other outcome variables featured in our pre-vious analysis of the survey data (measures of teacher certification parental participa-tion and childrenrsquos interaction with peers) with results that are qualitatively similar to those found above For example although the parent of the child who just makes it into a better class is not more likely to pay for tutoring services this child is more likely to be exposed to peers whose parents buy such services At the same time several key coefficients in this table especially the marginal effects in panel B are imprecisely estimated which could be explained both by the smaller sample sizes and the fact that the differences in educational environments (column 1) are less stark than in the school or track level analysis Nevertheless the bottom line is that many of the behavioral responses observed abovemdashparticularly the sorting of more qualified teachers to better classesmdashcan also be observed across classes within the same track
F Effects across Cohorts
Finally we investigate whether the behavioral responses we study have a dynamic component For example do studentsrsquo responses emerge only gradually during their high school years For the sake of space Table 10 focuses only on specifications including students within one transition score point of the cutoffs For reference panel A repeats previous specifications at the student level For example the depen-dent variable in column 2 is the Language teacher experience measured in years The coefficient (minus0625) is from Table 6 column 8 panel C and shows there is no change (at the cutoff) in the experience of the teacher students encounter
Panel B explores whether these effects vary with time by looking at how they change across the three entry cohorts we surveyed 2005 2006 and 2007 This com-parison allows us to explore if there are differences according to whether students are in their second third or fourth year of high school This is achieved by includ-ing an indicator for whether studentsrsquo transition scores were above the cutoff and interacting this dummy with indicators for the 2005 and 2006 cohorts such that the first coefficient refers to the 2007 (the youngest) cohort
The results contain some interesting variation For example columns 6 and 7 suggest that childrenrsquos feelings of academic inferiority and the frequency of their negative interactions with peers are more marked in earlier stages of high school
61 The small and insignificant result on novice teachers (column 4) is not surprising given the results in Table 6 which suggested no difference in this dimension across tracks
1321pop-eleches and urquiola going to a better schoolVol 103 no 4
This might not be surprising to the extent that the transition scores contain noise and therefore the children ranked lowest upon entry are unlikely to on average turn in the worst performance during the year As this information is revealed studentsrsquo self assessment and their peers perceptions might change affecting behavior
Similarly the reductions in parental help with homework happen early on and are partially reversed by the senior year Specifically in column 5 the key coefficient is significant for the youngest cohort (2007) but the joint test for the oldest cohort (2005) is not statistically significant ( p-value = 029) This is consistent for exam-ple with parents gradually realizing that their childrsquos enrollment in a higher-ranked school might not eliminate her need for support Consistent with this column 4 shows that while the parents of children who just qualify for more selective schools are not more likely to invest in tutoring in the second year of high school by the fourth they are in fact more likely to do so If tutoring raises academic achievement (eg Banerjee et al 2007) then this might contribute toward finding school effects
Table 10mdashMarginal Effects across Cohorts
First stage Teachers Parents Peers
School level
transition score
Language teacher
experience measured
in years
Language teacher has
two or fewer
years of experience
Indicator for parents
having paid for tutoring services
Indicator for parents
helping child with homework
often
Childrsquos perception of hisher
rank in hisher class
Childrsquos experience
of negative
interactions with peers
(1) (2) (3) (4) (5) (6) (7)
Panel A Studentparent level
1Trans grade ge cutoff 0477 minus0625 minus0036 minus0003 minus0043 minus0134 minus0045(0018) (0539) (0011) (0018) (0019) (0059) (0019)
Bandwidth within 1 point of cutoff Yes Yes Yes Yes Yes Yes YesR2 0700 0310 0360 0130 0090 0120 0080
Observations 6559 6065 6065 6501 6488 6478 6500
Panel B Studentparent level by cohort
1Trans grade ge cutoff 0483 minus0764 minus0027 minus0029 minus0061 minus0165 minus0055(0022) (0688) (0014) (0020) (0026) (0075) (0025)
1Trans grade ge 0043 0384 minus0024 0013 0018 minus0012 minus0002 cutoff times cohort2006 (0024) (0738) (0016) (0021) (0028) (0083) (0025)1Trans grade ge minus0060 0047 minus0004 0065 0037 0103 0031 cutoff times cohort2005 (0024) (0775) (0015) (0026) (0027) (0083) (0027)Bandwidth within 1 point of cutoff Yes Yes Yes Yes Yes Yes YesR2 0700 0310 0360 0130 0090 0120 0080
Observations 6559 6065 6065 6501 6488 6478 6500
p-statistic (1Trans grade ge cutoff + 1Trans grade ge
000 058 000 049 008 002 002
cutoff times cohort2006 = 0)p-statistic (1Trans grade ge 000 031 001 016 029 042 029 cutoff + 1Trans grade ge cutoff times cohort2005 = 0)
Notes All regressions are clustered at the student level and include cutoff fixed effects Standard errors are in paren-theses All panels present reduced form specifications where the key independent variable is a dummy for whether a studentrsquos transition score is greater than or equal to the cutoff Panel A presents outcome variables that are aggre-gated at the child or parent level Panel B presents outcome variables that are at the child or parent level and it also includes interactions for being in the 2005 and 2006 entry cohort with the dummy for whether a studentrsquos transition score is greater than or equal to the cutoff (see Section V)
Significant at the 1 percent level Significant at the 5 percent level Significant at the 10 percent level
1322 THE AMERICAN ECONOMIC REVIEW juNE 2013
by the fourth but not the second year Finally columns 2 and 3 show less evidence of variation across cohorts in terms of teacher characteristics
To summarize we also find evidence that in Romania some of the behavioral responses identified have a dynamic component This is relevant for example because it implies that the estimated effects of experimental or quasi-experimental analyses might depend on whether academic outcomes are measured at the ninth or 12th grade level
VI Conclusion
In fields ranging from Labor to Development Economics great interest surrounds the impact of educational quality on individual outcomes This impact is difficult to measure mainly because it is hard to find situations in which comparable students enroll in schools of different quality
In this paper our first contribution has been to address this obstacle by analyz-ing Romaniarsquos educational system which allocates students to high schools in one of the most systematic procedures observed around the world This mechanism yields a large number of RD-based quasi-experiments enabling us to add to the literature with unusually large sample sizes and an exploration of the heterogene-ity in effects at different points of the test score distribution Our second contribu-tion has been to implement a specialized survey in a subset of towns using it to explore behavioral responses that arise when a child has the opportunity to attend a higher-ranked school
Our first reduced form result is that access to a better-ranked school has a positive impact on cognitive outcomes as measured by a high-stakes exam This has not been a consistent finding in the literature as some papersmdashincluding some which also rely on an RD approachmdashfind little indication that enrolling in a higher- achievement school or class raises learning
Our second set of results provides evidence of significant behavioral responses and equilibrium effects Specifically we find that teachers sort in response to the stratification of students such that an individual who just makes it into a more selec-tive school is assigned a teacher who is less qualified than the average instructor at the school and possibly no different than the teacher she would have encountered at the school she just avoided This teacher sorting may be an equilibrium outcome that has developed over time in this stratified school system62 Similarly while children who gain access to higher ranked schools encounter greater average parental partici-pation there is little evidence that their own parents increase their commitment to education and in fact there is some indication that they reduce the extent to which they help with homework Along the same lines while children who make it into more selective schools are exposed to better peers they also seem to realize they are weaker and feel marginalized For the behavioral responses by parents and children we provide evidence that these effects have a dynamic componentmdashthe estimates depend on how many years the child has attended a particular school
62 As noted we are not the first to highlight behavioral responses on the part of teachers For example Duflo Dupas and Kremerrsquos (2011) experimental setting reveals that in Kenya increased shirking by teachers can counter-act the positive impact of class size reduction on learning
1323pop-eleches and urquiola going to a better schoolVol 103 no 4
While the magnitude and even the direction of these responses may reflect institu-tions that are specific to Romania their existence reflects that educational markets are complex settings in which several agents interact As a result the causal mecha-nisms that link a given school input to outcomes like wages or learning are likely to be complicated Thus our results provide support for theoretical work suggesting that educational interventions should be analyzed with reference to their effects on the behavior of agents involved in the educational process eg Das et al (2013) MacLeod and Urquiola (2009) and Albornoz-Crespo Berlinski and Cabrales (2010)
These results also have implications for the experimental evaluation of educational interventions This research typically relies on partial equilibrium experiments that hold constant factors including responses like those explored here additionally it often measures outcomes in the short run If dynamic behavioral responses are rele-vant however then the very nature (and impact) of a given intervention may change as actors have a chance to respond Further some of these responses may only be observed when an intervention is taken to scale and sustained These possibilities amplify the usual concerns regarding small scale experimentsrsquo external validity
REFERENCES
Abdulkadiro g lu Atila Joshua D Angrist and Parag A Pathak 2011 ldquoThe Elite Illusion Achieve-ment Effects at Boston and New York Exam Schoolsrdquo National Bureau of Economic Research Working Paper 17264
Acemoglu Daron 2010 ldquoTheory General Equilibrium and Political Economy in Development Eco-nomicsrdquo Journal of Economic Perspectives 24 (3) 17ndash32
Albornoz-Crespo Facundo Samuel Berlinski and Antonio Cabrales 2010 ldquoIncentives Resources and the Organization of the School Systemrdquo CEPR Discussion Paper 7964
Banerjee Abhijit V Shawn Cole Esther Duflo and Leigh Linden 2007 ldquoRemedying Education Evi-dence from Two Randomized Experiments in Indiardquo Quarterly Journal of Economics 122 (3) 1235ndash64
Banerjee Abhijit V and Esther Duflo 2008 ldquoThe Experimental Approach to Development Econom-icsrdquo National Bureau of Economic Research Working Paper 14467
Becker Gary S 1964 Human Capital A Theoretical and Empirical Analysis with Special Reference to Education Chicago University of Chicago Press
Becker Gary S 1981 A Treatise on the Family Cambridge MA Harvard University Press Becker Gary S and Nigel Tomes 1986 ldquoHuman Capital and the Rise and Fall of Familiesrdquo Journal
of Labor Economics 4 (3) S1ndash39Behrman Jere R Shahrukh Khan David Ross and Richard Sabot 1997 ldquoSchool Quality and Cog-
nitive Achievement Production A Case Study for Rural Pakistanrdquo Economics of Education Review 16 (2) 127ndash42
Brown Philip H 2006 ldquoParental Education and Investment in Childrenrsquos Human Capital in Rural Chinardquo Economic Development and Cultural Change 54 (4) 759ndash89
Case Anne and Angus Deaton 1998 ldquoLarge Cash Transfers to the Elderly in South Africardquo Economic Journal 108 (450) 1330ndash61
Case Anne and Angus Deaton 1999 ldquoSchool Inputs and Educational Outcomes in South Africardquo Quarterly Journal of Economics 114 (3) 1047ndash84
Clark Damon 2010 ldquoSelective Schools and Academic Achievementrdquo BE Journal of Economic Analysis and Policy Advances in Economic Analysis and Policy 10 (1)
Cullen Julie Berry Brian A Jacob and Steven Levitt 2006 ldquoThe Effect of School Choice on Partici-pants Evidence from Randomized Lotteriesrdquo Econometrica 74 (5) 1191ndash1230
Dale Stacy Berg and Alan B Krueger 2002 ldquoEstimating the Payoff to Attending a More Selective College An Application of Selection on Observables and Unobservablesrdquo Quarterly Journal of Economics 117 (4) 1491ndash1527
Das Jishnu Stefan Dercon James Habyarimana Pramila Krishnan Karthik Muralidharan and Venkatesh Sundararaman 2013 ldquoSchool Inputs Household Substitution and Test Scoresrdquo Ameri-can Economic Journal Applied Economics 5 (2) 29ndash57
1324 THE AMERICAN ECONOMIC REVIEW juNE 2013
Deaton Angus 2010 ldquoInstruments Randomization and Learning about Developmentrdquo Journal of Economic Literature 48 (2) 424ndash55
Dobbie Will and Roland G Fryer Jr 2011 ldquoExam High Schools and Academic Achievement Evi-dence from New York Cityrdquo National Bureau of Economic Research Working Paper 17286
Duflo Esther Pascaline Dupas and Michael Kremer 2011 ldquoPeer Effects Teacher Incentives and the Impact of Tracking Evidence from a Randomized Evaluation in Kenyardquo American Economic Review 101 (5) 1739ndash74
Hahn Jinyong Petra Todd and Wilbert Van der Klaauw 2001 ldquoIdentification and Estimation of Treatment Effects with a Regression-Discontinuity Designrdquo Econometrica 69 (1) 201ndash09
Hastings Justine Thomas Kane and Douglas Staiger 2009 ldquoHeterogeneous Preferences and the Effi-cacy of Public School Choicerdquo Unpublished
Hoekstra Mark 2009 ldquoThe Effect of Attending the Flagship State University on Earnings A Discon-tinuity-Based Approachrdquo Review of Economics and Statistics 91 (4) 717ndash24
Hoxby Caroline M and Gretchen Weingarth 2006 ldquoTaking Race out of the Equation School Reas-signment and the Structure of Peer Effectsrdquo Unpublished
Imbens Guido and Karthik Kalyanaraman 2009 ldquoOptimal Bandwith Choice for the Regression Dis-continuity Estimatorrdquo National Bureau of Economic Research Working Paper 14726
Imbens Guido W and Thomas Lemieux 2008 ldquoRegression Discontinuity Designs A Guide to Prac-ticerdquo Journal of Econometrics 142 (2) 615ndash35
Jackson C Kirabo 2010a ldquoDo Students Benefit from Attending Better Schools Evidence from Rule-Based Student Assignments in Trinidad and Tobagordquo Economic Journal 120 (549) 1399ndash1429
Jackson C Kirabo 2010b ldquoPeer Quality or Input Quality Evidence from Trinidad and Tobagordquo National Bureau of Economic Research Working Paper 16598
Jacoby Hanan G 2002 ldquoIs There an Intrahousehold lsquoFlypaper Effectrsquo Evidence from a School Feed-ing Programmerdquo Economic Journal 112 (476) 196ndash221
Jensen Robert T 2003 ldquoDo Private Transfers lsquoDisplacersquo the Benefits of Public Transfers Evidence from South Africardquo Journal of Public Economics 88 (1-2) 89ndash112
Krueger Alan B 1999 ldquoExperimental Estimates of Education Production Functionsrdquo Quarterly Jour-nal of Economics 114 (2) 497ndash532
Lankford Hamilton Susanna Loeb and James Wyckoff 2002 ldquoTeacher Sorting and the Plight of Urban Schools A Descriptive Analysisrdquo Educational Evaluation and Policy Analysis 24 (1) 37ndash62
Lavy Victor M Daniele Paserman and Analia Schlosser 2007 ldquoInside the Black Box of Ability Peer Effects Evidence from Variation in High and Low Achievers in the Classroomrdquo Unpublished
Lee David S and Thomas Lemieux 2010 ldquoRegression Discontinuity Designs in Economicsrdquo Journal of Economic Literature 48 (2) 281ndash355
Liu Haiyong Thomas A Mroz and Wilbert van der Klaauw 2010 ldquoMaternal Employment Migra-tion and Child Developmentrdquo Journal of Econometrics 156 (1) 212ndash28
MacLeod W Bentley and Miguel Urquiola 2009 ldquoAnti-Lemons School Reputation and Educational Qualityrdquo National Bureau of Economic Research Working Paper 15112
Malamud Ofer and Cristian Pop-Eleches 2010 ldquoGeneral Education versus Vocational Training Evi-dence from an Economy in Transitionrdquo Review of Economics and Statistics 92 (1) 43ndash60
McCrary Justin 2008 ldquoManipulation of the Running Variable in the Regression Discontinuity Design A Density Testrdquo Journal of Econometrics 142 (2) 698ndash714
Moffitt Robert 1992 ldquoIncentive Effects of the US Welfare System A Reviewrdquo Journal of Economic Literature 30 (1) 1ndash61
Park Albert Xinzheng Shi Chang-Tai Hsieh and Xuehui An 2008 ldquoDoes School Quality Matter Evidence from a Natural Experiment in Rural Chinardquo Unpublished
Pop-Eleches Cristian and Miguel Urquiola 2013 ldquoGoing to a Better School Effects and Behavioral Responses Datasetrdquo American Economic Review httpdxdoiorg101257aer10341289
Rosenzweig Mark R and Kenneth I Wolpin 1994 ldquoParental and Public Transfers to Young Women and their Childrenrdquo American Economic Review 84 (5) 1195ndash1212
Saavedra Juan 2009 ldquoThe Learning and Early Labor Market Effects of College Quality A Regres-sion Discontinuity Analysisrdquo Unpublished
Sekhri Sheetal and Yona Rubinstein 2010 ldquoDo Public Colleges in Developing Countries Provide Better Education than Private Onesrdquo Unpublished
Thistlewaite Donald L and Donald T Campbell 1960 ldquoRegression-Discontinuity Analysis An Alternative to the Ex Post Facto Experimentrdquo Journal of Educational Psychology 51 (6) 309ndash17
Todd Petra E and Kenneth I Wolpin 2003 ldquoOn the Specification and Estimation of the Production Function for Cognitive Achievementrdquo Economic Journal 113 (485) F3ndash33
- Going to a Better School Effects and Behavioral Responses
-
- IenspConceptual Framework
- IIenspThe Student Allocation Mechanism
- IIIenspData
-
- A Administrative Data
- B Survey Data
-
- IVenspEmpirical Strategy
-
- A Empirical Setup for a Single Between-School Cutoff
- B Summarizing Information for Many Cutoffs
-
- VenspResults
-
- A The First Stage
- B Baccalaureate Outcomes
- C Heterogeneity in Baccalaureate Outcomes
- D Behavioral Responses and Equilibrium Effects
- E Within Track Analysis
- F Effects across Cohorts
-
- VIenspConclusion
- REFERENCES
-
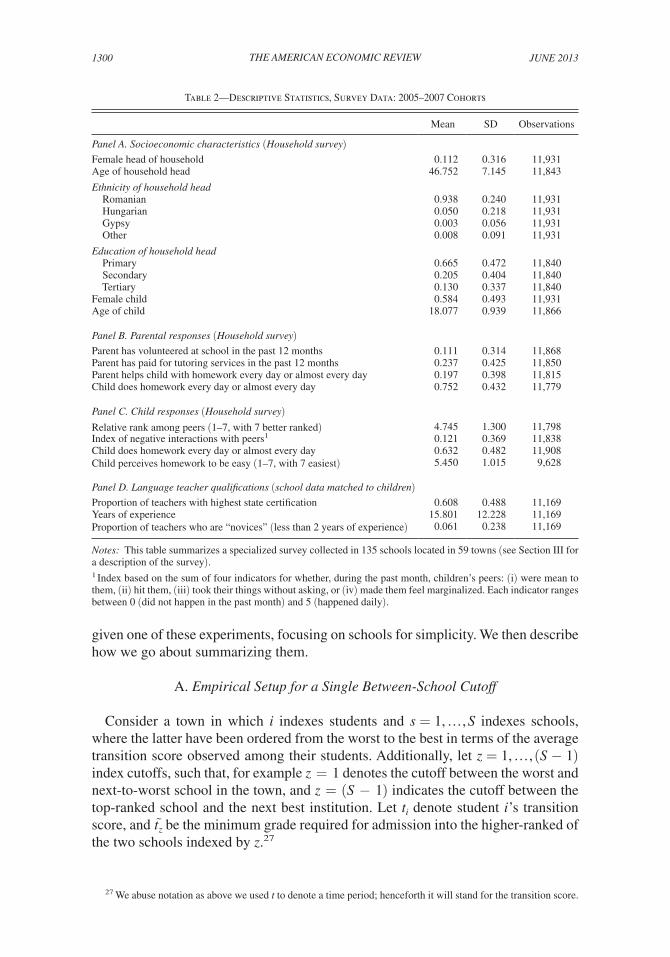
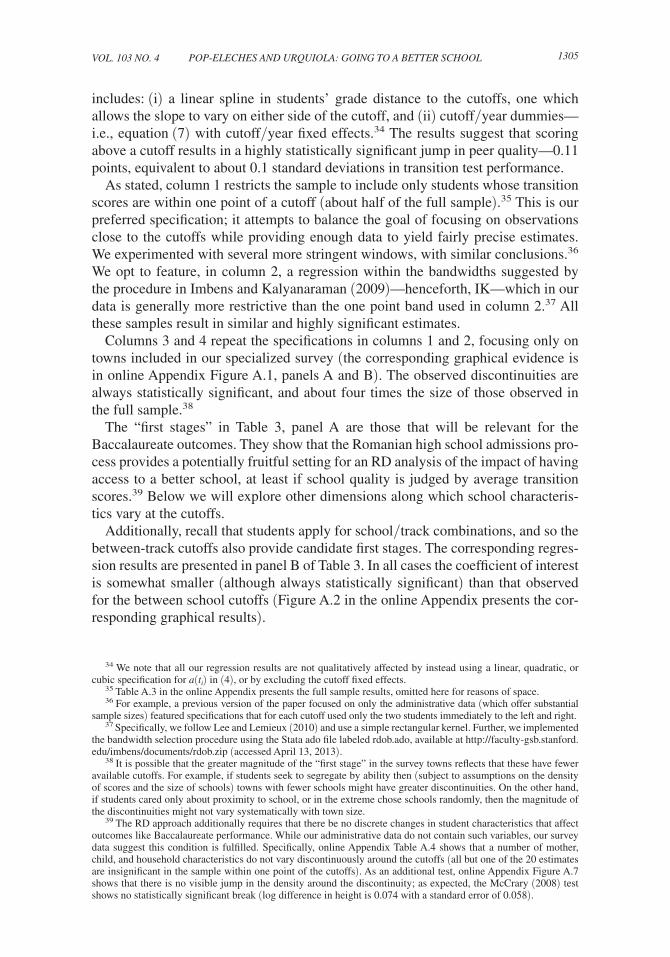
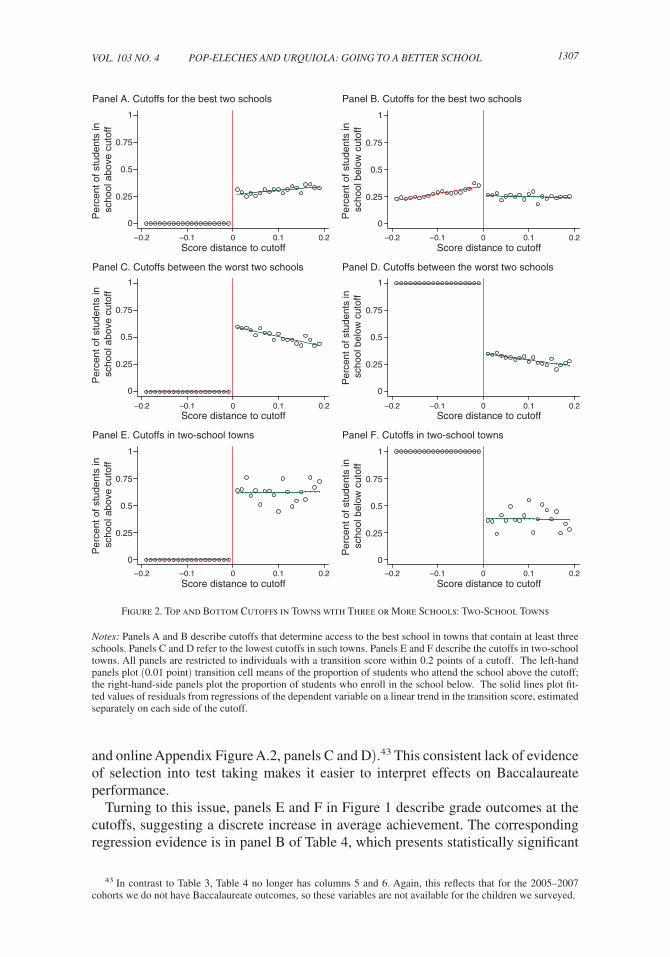
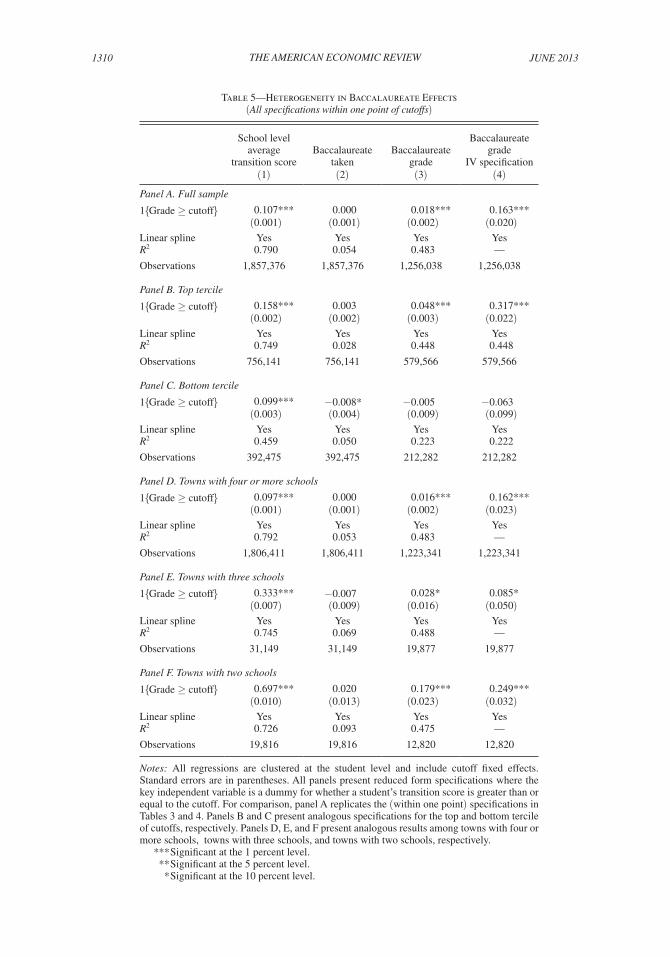
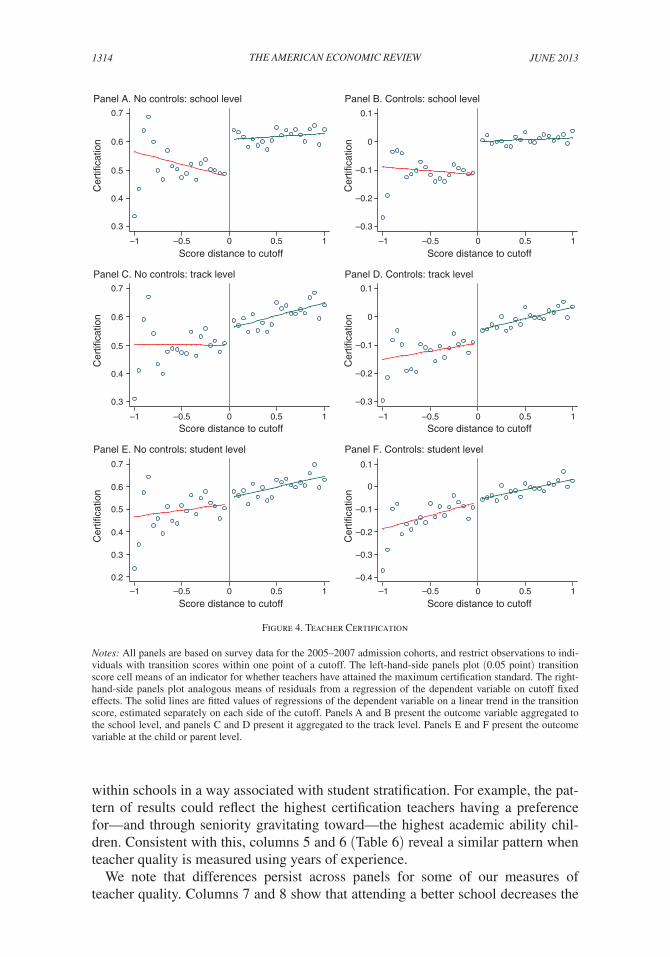
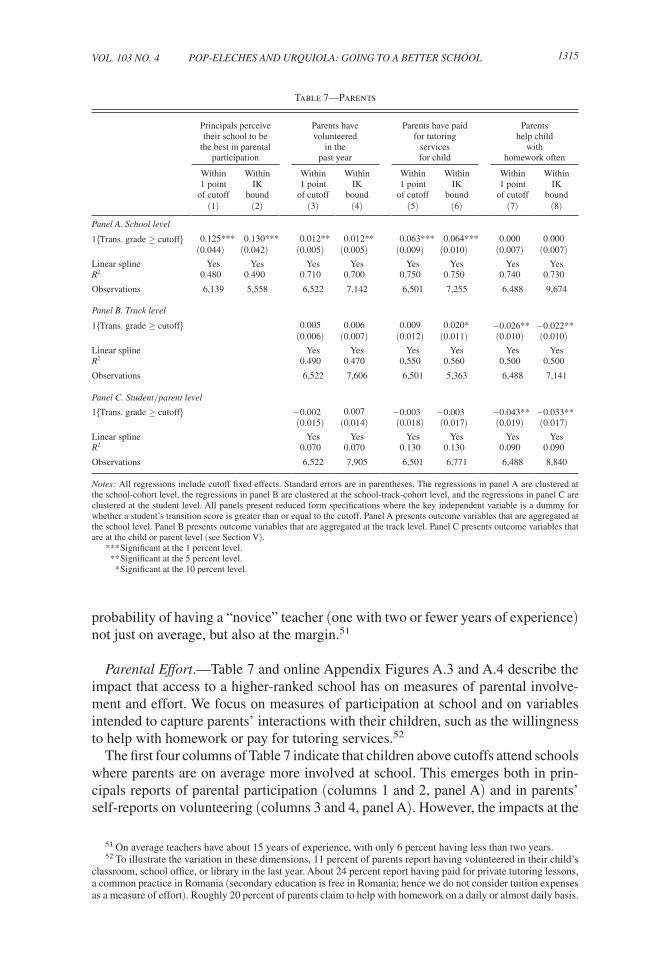
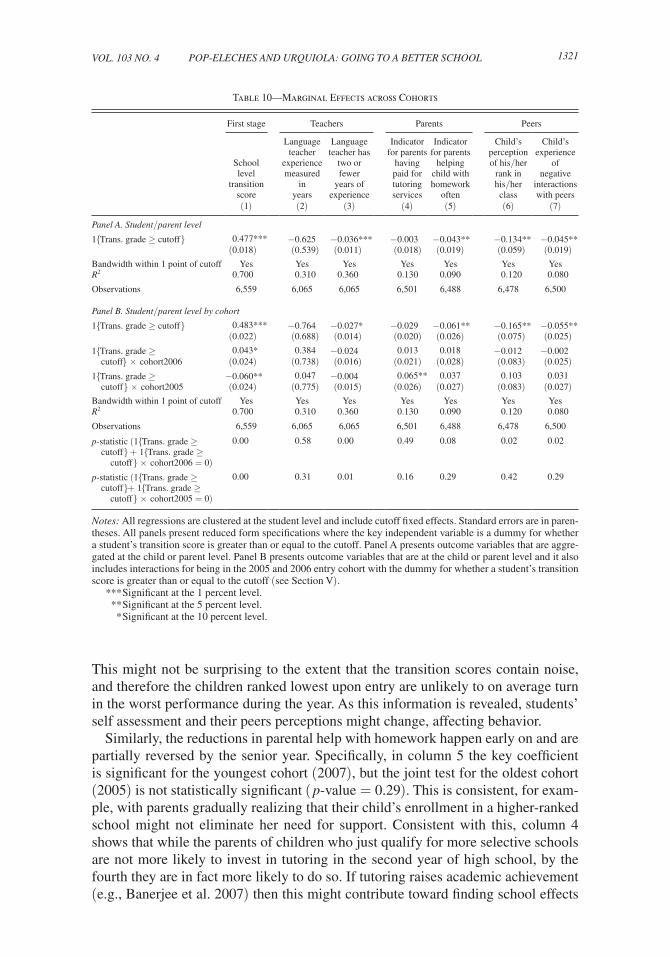