going into the affordable care act: measuring the size ... · the congressional budget office...
TRANSCRIPT

NBER WORKING PAPER SERIES
GOING INTO THE AFFORDABLE CARE ACT: MEASURING THE SIZE, STRUCTURE AND PERFORMANCE
OF THE INDIVIDUAL AND SMALL GROUP MARKETS FOR HEALTH INSURANCE
Pinar Karaca-MandicJean M. Abraham
Kosali SimonRoger Feldman
Working Paper 19719http://www.nber.org/papers/w19719
NATIONAL BUREAU OF ECONOMIC RESEARCH1050 Massachusetts Avenue
Cambridge, MA 02138December 2013
This work was supported by the Robert Wood Johnson Foundation’s State Health Reform AssistanceNetwork (State Network) grant to the State Health Access Data Assistance Center (SHADAC). Theviews expressed herein are those of the authors and do not necessarily reflect the views of the NationalBureau of Economic Research.
NBER working papers are circulated for discussion and comment purposes. They have not been peer-reviewed or been subject to the review by the NBER Board of Directors that accompanies officialNBER publications.
© 2013 by Pinar Karaca-Mandic, Jean M. Abraham, Kosali Simon, and Roger Feldman. All rightsreserved. Short sections of text, not to exceed two paragraphs, may be quoted without explicit permissionprovided that full credit, including © notice, is given to the source.

Going into the Affordable Care Act: Measuring the Size, Structure and Performance of theIndividual and Small Group Markets for Health InsurancePinar Karaca-Mandic, Jean M. Abraham, Kosali Simon, and Roger FeldmanNBER Working Paper No. 19719December 2013JEL No. I1,I13,I28
ABSTRACT
The Affordable Care Act (ACA) will dramatically alter health insurance markets and the sources throughwhich individuals obtain coverage. As the ACA is implemented, it is essential to monitor the intendedand the unintended consequences of these regulations. To evaluate the changes in health insurancemarkets linked to the ACA, it is critical to consistently measure the size and structure of health insurancemarkets, as well as the performance of participating health insurers, prior to and post-ACA. In thispaper we discuss challenges of describing the size, structure, and performance of the individual andsmall group markets. Next, we discuss improvements in data availability starting in 2010 to addresssome of these concerns. Finally, using data from the National Association of Insurance Commissioners(NAIC), we evaluate insurance market structure and performance during 2010-2012, focusing on enrollment,the number of participating insurers, premiums, claims spending, MLR, and administrative expenses.
Pinar Karaca-MandicDivision of Health Policy and ManagementUniversity of Minnesota420 Delaware Street SE, MMC 729Minneapolis, MN 55455and [email protected]
Jean M. AbrahamDepartment of Health Policy and ManagementUniversity of Minnesota20 Delaware St SEMMC 729Minneapolis, MN [email protected]
Kosali Simon School of Public and Environmental Affairs Indiana University Rm 359 1315 East Tenth Street Bloomington, IN 47405-1701 and NBER [email protected]
Roger Feldman Health Policy and Management School of Public Health University of Minnesota Mayo Mail Code 729 420 Delware Street S.E. Minneapolis, MN 55455-0392 [email protected]

1
Going into the Affordable Care Act: Measuring the Size, Structure and Performance of the
Individual and Small Group Markets for Health Insurance
Pinar Karaca-Mandic, University of Minnesota and NBER
Jean M. Abraham, University of Minnesota
Kosali Simon, Indiana University and NBER
Roger Feldman, University of Minnesota
Acknowledgements This work was supported by the Robert Wood Johnson Foundation’s State Health Reform Assistance Network (State Network) grant to the State Health Access Data Assistance Center (SHADAC).
I. Introduction
The Affordable Care Act (ACA) will dramatically alter health insurance markets and the sources
through which individuals obtain coverage. All low-income Americans above the poverty line who lack
access to affordable employer-sponsored insurance will be eligible for subsidies to purchase individual
insurance in state-based Exchanges (or “Marketplaces”). This provision of the ACA will greatly expand
the size and importance of the individual market. The Congressional Budget Office projects that
approximately 17% of the non-elderly population will obtain coverage in the individual market by 2016
(Congressional Budget Office, 2012); today that number stands at only 5%.
Only 35.2% of private-sector establishments with fewer than 50 employees offered health
insurance to their employees in 2012. In contrast, 95.9% of those with 50 or more employees did so.1
Establishment of Small Business Health Options Program (SHOP) exchanges in 2014 will simplify the
health insurance shopping experience for small employers (50 or fewer full-time equivalent employees) as
1 http://meps.ahrq.gov/mepsweb/data_stats/summ_tables/insr/national/series_1/2012/tia1a.htm (accessed September 23, 2013)

2
well as allow their employees to choose from among options in an ‘exchange like’ setting, although
without access to exchange tax credits.2
The ACA also increases regulation of health insurers and health insurance markets, for example,
by controlling premium increases through rate review regulation and by regulating insurers’ medical loss
ratios (MLRs), which broadly represents the proportion of health insurance premium revenues that is paid
out in medical claims. Additional ACA provisions require policies to include essential benefits and limit
price variance through modified community rating.
The MLR regulations were among the first ACA provisions to be implemented. Beginning in
January 2011, insurers in the individual and small group markets must spend at least 80 percent of their
premium revenue on medical care and quality improvement activities while insurers in the large group
market must have MLRs of at least 85 percent. Insurers must provide annual information on their MLRs
to the U.S. Department of Health and Human Services. Those that fail to meet the 80% and 85%
minimum MLR thresholds for the individual/small group and large group segments must provide
equivalent rebates to their policyholders beginning in 2012.
While the MLR regulation monitors the ratio of spending on medical benefits to premiums,
another ACA provision, rate review regulation, complements it by controlling premium increases. Under
rate review regulation, insurers must document and publicly justify “unreasonable premium increases”
when they file advance notice of rates starting with the 2011 plan year. Before the ACA, states had
substantial variation in their authority to review rates (Kaiser Family Foundation, 2010). Almost half of
the states had “prior approval” rate regulation in which regulators could review the rates3 and approve or
disapprove proposed changes. In contrast, other states had “file and use” regulations in which insurers had
to provide actuarial justification for rate increases, but could proceed with rate increases without state
2 SHOP exchanges will administer the small business health care tax credits, but these are much more limited than the individual subsidies provided through the Exchange. More details on the small business tax credits can be found at http://www.irs.gov/uac/Small-Business-Health-Care-Tax-Credit-for-Small-Employers and http://www.taxpayeradvocate.irs.gov/calculator/SBHCTC.htm 3 The “rate” is distinct from the “premium”. While the premium is the total cost of the policy paid by an individual or group (i.e. family), rate is the “unit cost” of the policy. Rates may vary by number of dependents in a policy, benefit design of the policy, age, gender, previous claims experience, and geographic location.

3
approval. However, the state reserved the right to intervene if the rates were later found to be
“unreasonable.” Only a few states lacked any regulatory authority over rates. States also had different
criteria for deeming rates to be reasonable.4 States differed in levels of enforcement of their regulations as
well as in the strength of their regulatory oversight. While the ACA does not require any changes to the
states’ existing rate review regulation authority, various states have amended their laws to align them
better with the federal law.
As the ACA is implemented, it is essential to monitor the intended and the unintended
consequences of these regulations. To evaluate the changes in health insurance markets linked to the
ACA, it is critical to consistently measure the size and structure of health insurance markets, as well as the
performance of participating health insurers, prior to and post-ACA.
In this paper we discuss challenges of describing the size, structure, and performance of the
individual and small group markets. Next, we discuss improvements in data availability starting in 2010
to address some of these concerns. Finally, using data from the National Association of Insurance
Commissioners (NAIC), we evaluate insurance market structure and performance during 2010-2012,
focusing on enrollment, the number of participating insurers, premiums, claims spending, MLR, and
administrative expenses.
II. The Size of the Individual and Small Group Markets for Health Insurance
Individual Market
Estimates based on the Current Population Survey (CPS) suggest that approximately 5% of the
U.S. population has individually-purchased coverage (Kaiser Family Foundation, 2011,
http://kff.org/other/state-indicator/total-population/). However, estimates vary widely across different
federal surveys. Abraham, Karaca-Mandic and Boudreaux (2013) estimated the size of the individual
market for health insurance during the period just before passage of the ACA. The authors also
4 While most states used medical trends, rate history and MLR in determining whether the rates were “unreasonable”, they used different thresholds.

4
documented strengths and limitations of particular federal surveys and administrative data sources for
addressing questions about the individual market. They considered four prominent federal surveys: the
National Health Interview Survey (NHIS); the Medical Expenditure Panel Survey Household Component
(MEPS-HC); the Annual Social and Economic Supplement to the Current Population Survey (CPS); and
the American Community Survey (ACS). They also considered an administrative data source from the
National Association of Insurance Commissioners (NAIC).
Abraham et al. (2013) found that federal survey estimates of the individual market vary widely –
from 9.5 million non-elderly in MEPS to 25 million in the ACS (Table1). Their study suggests three
important measurement issues outlined in Table 1. First, surveys differ in how they elicit coverage in the
individual market. Rather than asking respondents directly if they are covered by individual health
insurance, they ask about “directly purchased” coverage with different purchasing arrangements (e.g.
from an insurance company or a group such as a school).Second, surveys vary in differentiating the types
of individual policies (e.g. comprehensive coverage, limited benefit, disease-specific, or short-term). In
fact, none of the surveys ask whether the health plan includes comprehensive medical and hospital
coverage. Even if the surveys asked such questions, individuals may not be aware of the
comprehensiveness of their plans unless they are frequent health care users. This is important, because
some ACA regulations, such as the MLR regulation and the expansion of the individual market under
Exchanges, apply only to comprehensive coverage.5
Abraham et al. (2013) highlighted a third point: surveys differ in the reference period of the
insurance questions (e.g. coverage at the interview date versus coverage any time during the previous
calendar year). While “point-in-time” surveys that ask about coverage at the interview date avoid recall
bias, they miss individuals who held coverage during the year but dropped it prior to the interview date.
For example, the CPS asks if a respondent had individual coverage at any time during the previous
5 https://www.federalregister.gov/articles/2012/05/16/2012-11753/medical-loss-ratio-requirements-under-the-patient-protection-and-affordable-care-act. Also see Congressional Research Service (September 18,2012) http://www.fas.org/sgp/crs/misc/R42735.pdf

5
calendar year. This framing has the greatest potential for recall bias (Klerman et al. 2009). Moreover, it is
not possible to know whether a respondent held individual coverage at the time of the interview, part of
the year, or throughout the entire year. These are important measurement issues, especially because
enrollment patterns in the individual market are typically dynamic throughout the year. Many who buy
individual policies use it to bridge short-term coverage gaps (e.g. transitions from job-to-job or school-to-
job and retirement-to-Medicare eligibility).
To partially reconcile large differences across the surveys, Cantor et al. (2007) and Mach and
O’Hara (2011) defined a coverage hierarchy, whereby individuals who report multiple coverage types are
assigned to only one category. The hierarchy prioritizes coverage types in the following order: public,
employer-sponsored coverage, direct purchase, and uninsured. Their basic premise is that a substantial
portion of people who report both individual market and another coverage types on these surveys really
have one comprehensive policy. For example, an individual could be covered primarily through an
employer-sponsored policy, but also have a single-service dental plan and thus report both employer
sponsored insurance and the direct purchase option. This adjustment (also presented in Table 1) to
redefine coverage types into just one main type by using a hierarchy results in a smaller estimate of the
size of individual market and a tighter alignment across different federal surveys (8,215,358 in MEPS and
16,635,033 in ACS).
Small Group Market
In contrast to the individual market, not all household surveys discussed above can measure
coverage obtained through the small employer group market because most household surveys do not ask
working individuals about the size of their employer. Several studies have used the size of the worker’s
establishment in conjunction with whether the establishment has more than one location as a proxy for
firm size (Abraham, DeLeire and Royalty, 2009; Monheit and Schone, 2004). However, this approach
would classify a large-firm employee working in an establishment with few employees as a small-firm
employee. Even if the survey asks respondents for firm size, it is unclear whether workers can accurately

6
assess this, especially when the firm has multiple locations. Nationally representative employer surveys
such as the MEPS-Insurance Component (MEPS-IC), in contrast, can estimate the size of the small group
market more accurately than household surveys.
The MEPS-IC samples public and private-sector establishments, collecting information on their
health insurance offerings and characteristics of the workers and workplace. A firm could have one or
more establishments, but each surveyed establishment provides information on the total number of
employees across all establishments, which allows an inference of firm size; firm size is also checked
against administrative sources. National and state-level estimates of insurance coverage by year are
publicly available from the MEPS-IC.6
Using several statistics reported in these tables, we estimated the number of employees with health
insurance in firms with fewer than 50 employees (Table 2). In 2009, approximately 10,587,185 small-firm
employees had employer-sponsored health insurance (9,359,072 through fully-insured plans and
1,228,113 through self-insured plans). These numbers do not include dependents of the primary insurance
holders. Previous research estimated an average of one dependent per employee in small firms (Karaca-
Mandic, Abraham, and Phelps, 2011), which suggests a total of 21,174,370 enrollees in the small group
market and 18,718,144 in fully-insured plans. Estimates of small group insurance also come from Kaiser
HRET/surveys, although their sample size of small employers is typically limited and the micro-data are
not easily accessed by researchers.
Thus, prior estimates of the size of the individual market have relied on household surveys and
provide a range of sizes due to the inherently difficult nature of discerning individual level coverage. In
contrast, estimates of the small group market come from employer surveys linked to administrative data
and are more reliable. The challenges in estimating the size of these markets spill over to difficulties in
defining the target populations of ACA insurance market policies. Having discussed these challenges, we
6 Summary statistics at http://meps.ahrq.gov/mepsweb/data_stats/quick_tables.jsp#insurance contain publicly released data. Researchers wishing to use the MEPS-IC must obtain approval from the Census Bureau and the Internal Revenue Service and must access the data at a Census Research Data Center.

7
turn our attention to measures of the structure of these markets, including the number of participating
insurers, market shares, and concentration.
III. The Structure of the Individual and Small Group Markets for Health Insurance Assessing the structure of the individual and small group markets has been hampered by lack of
data on these insurers. Until 2011, the National Association of Insurance Commissioners (NAIC) was the
only national administrative data source available to identify insurers operating in the individual and
group markets. NAIC is the organization of insurance regulators from the 50 states, the District of
Columbia, and the five U.S. territories. The NAIC data represent a compilation of health insurer filings of
Annual Statements to the Insurance Department of each state in which they sell their products. Prior to
2010, NAIC data on detailed state-level insurer level/aggregated information on premiums earned and
written, amounts paid and incurred for provision of health care services, and member months of coverage
by “line of business” came from the Exhibit of Premiums, Enrollment, and Utilization, also known as the
“State Page.” Lines of business include comprehensive individual coverage, comprehensive group
coverage, Medicare supplements, vision, dental, FEHBP, Medicare, and Medicaid. However, the NAIC
data have several major limitations. First, the vast majority of insurers operating in California are
regulated by the California Department of Managed Health Care and do not file with the NAIC.
Second, as already alluded to, one cannot easily use pre-2010 NAIC data to study health insurance
industry structure. One difficulty in using the NAIC data prior to 2010 relates to the classification of
insurers into categories based on their primary business. Insurers with more than 95% of their business in
health insurance were required to file as health insurers, and they filled out “exhibits” (essentially
questionnaires) in the Health Blanks (including the “State Page”). However, life, fraternal, and
property/casualty insurers that also write health insurance policies (but for whom health insurance is 95%
or less of their business) did not file the same Health Blanks. As a result, until 2010, such organizations
were not required to file information on enrollment, premiums, or claims specific to comprehensive

8
(hospital and medical) coverage in individual and group market segments under the State Page.7 Lack of
such information made it impossible to assess the number of insurers selling comprehensive medical
insurance in the individual market and the group market using the NAIC data. Major life insurers could
potentially have a large market share in these market segments, yet it was not possible to gauge the extent
of their presence and their share of total premiums in any state and year. While each insurance regulator’s
website typically lists the insurers operating in that state, one cannot easily obtain detailed information
about their market shares.
Another problem with the NAIC data prior to 2010 is that insurer filings did not distinguish
whether the insurer operated in the small group versus the large group market. Similarly, enrollment,
premiums, claims and other financial information was filed under the “group market” business line
segment rather than distinguishing between the small and large group markets.
Following passage of the ACA, NAIC has actively collaborated with the U.S. Department of
Health and Human Services (HHS) to design standard measures, definitions and methodologies related to
the regulatory targets such as the MLR.8 Starting in the 2010 filing year, insurers file new supplementary
information with the NAIC. Karaca-Mandic and Abraham (2013) summarized the features of NAIC’s
new reporting exhibit titled the Supplemental Health Care Exhibit (SHCE).This exhibit is similar to the
earlier State Pages, but it is also filed by life, fraternal, and property/casualty insurers (starting with filing
year of 2010) that sell health insurance policies in the individual, small, and large group (fully-insured)
markets. SHCE includes detailed information on the number of covered lives, number of policies,
member months, health premiums earned, federal taxes, state insurance, premium and other taxes,
incurred claims, incurred expenses for improving health care quality as well as detailed information on
claims adjustment expenses, general and administrative expenses. In the SHCE, insurers separately report
7 See Abraham and Karaca-Mandic (2011) and Karaca-Mandic and Abraham (2013) and Karaca-Mandic, Abraham and Simon (2013) for more detail on the comprehensiveness of the NAIC data. Dafny, Dranove et al (2011) also discuss the NAIC data. 8 For example, see the list of NAIC responsibilities as of April 2010 at: http://www.naic.org/documents/index_health_reform_naic_tasks.pdf
9
on comprehensive medical coverage in the individual, small group and large group markets, as well as on
mini-med plans (with annual limits of $250,000 per person per year), for each state in which they operate.
A new independent source of data on insurers is the MLR regulatory filings collected by the U.S.
Department of Health and Human Services’ Center for Consumer Information and Oversight (CCIIO)
starting in 2011. There is some uncertainty regarding what fraction of insurers report data. A recent Kaiser
study (see below) used the 2011 CCIIO regulatory filings and found estimates of individual and small
group market size very similar to the NAIC. Since these data start in 2011, it is not possible to use them
for pre-post comparisons.
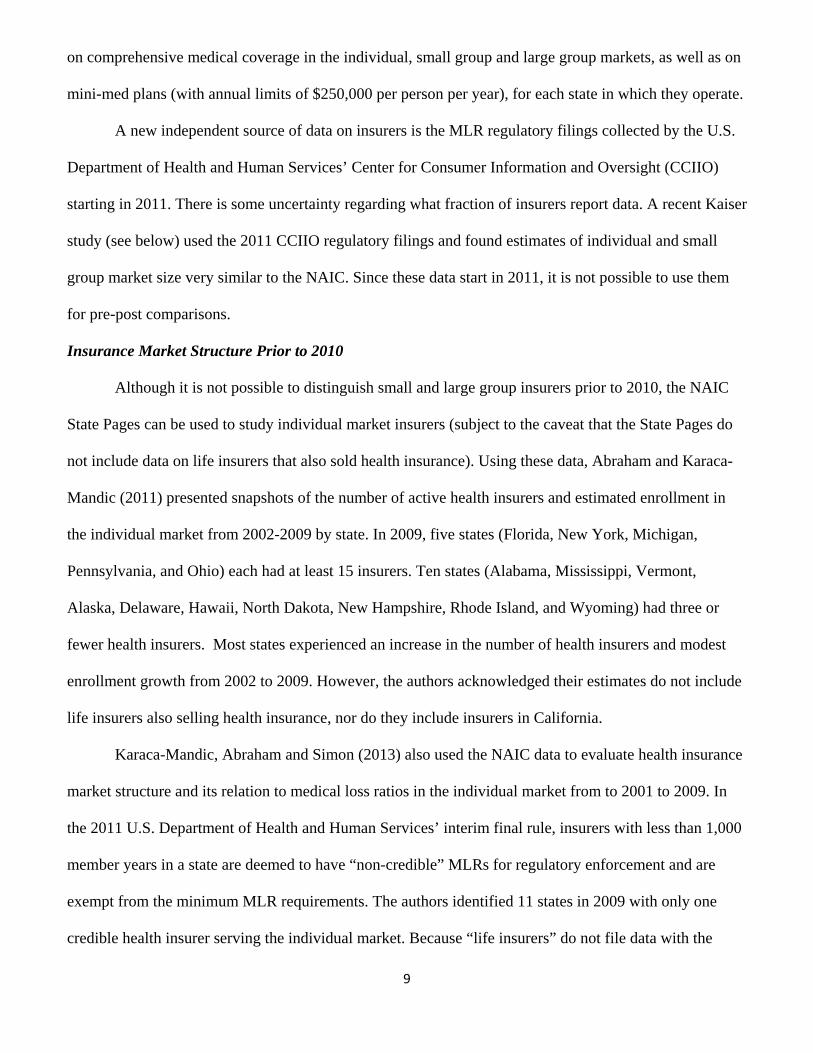
Insurance Market Structure Prior to 2010
Although it is not possible to distinguish small and large group insurers prior to 2010, the NAIC
State Pages can be used to study individual market insurers (subject to the caveat that the State Pages do
not include data on life insurers that also sold health insurance). Using these data, Abraham and Karaca-
Mandic (2011) presented snapshots of the number of active health insurers and estimated enrollment in
the individual market from 2002-2009 by state. In 2009, five states (Florida, New York, Michigan,
Pennsylvania, and Ohio) each had at least 15 insurers. Ten states (Alabama, Mississippi, Vermont,
Alaska, Delaware, Hawaii, North Dakota, New Hampshire, Rhode Island, and Wyoming) had three or
fewer health insurers. Most states experienced an increase in the number of health insurers and modest
enrollment growth from 2002 to 2009. However, the authors acknowledged their estimates do not include
life insurers also selling health insurance, nor do they include insurers in California.
Karaca-Mandic, Abraham and Simon (2013) also used the NAIC data to evaluate health insurance
market structure and its relation to medical loss ratios in the individual market from to 2001 to 2009. In
the 2011 U.S. Department of Health and Human Services’ interim final rule, insurers with less than 1,000
member years in a state are deemed to have “non-credible” MLRs for regulatory enforcement and are
exempt from the minimum MLR requirements. The authors identified 11 states in 2009 with only one
credible health insurer serving the individual market. Because “life insurers” do not file data with the

10
NAIC, additional work is necessary to confirm that this really indicates these states had monopoly-like
markets. In additional analysis of these 11 states using data from the state commissioners’ web pages as
well as the NAIC data from SHCE in 2010 and 2011, they confirmed that the credible health insurer
identified was in fact the dominant insurer in the state (in terms of market share). However, the authors
found that “life insurers” in all these states also sold health insurance to individuals. The largest life
insurer had only 4 to-8% of the total premium revenue in most of these markets, but there were a few
states in which the largest life insurer accounted for 10 to 16% of individual health insurance premiums.
Insurance Market Structure in 2010 and After
Starting with the 2010 filing year, the SHCE provides a unique opportunity to construct a
complete picture of both the individual and the small group health insurance markets. Because the exhibit
is filed by life, fraternal, and property/casualty insurers in addition to health insurers, it is now possible to
construct counts of all insurance carriers selling comprehensive health insurance. The reported number of
policies, covered lives, member months and premiums earned can be used to conduct a more complete
market share analysis because it is now possible to include the market shares of the non-health insurers.
Similarly, given that information is now available on all market participants, one can construct measures
of market structure (e.g. the Herfindahl index) by states. In addition, the fully-insured small and large
group markets can be separately identified, and thus the SHCE presents the first opportunity to examine
the small group market.
In this paper, we used the 2010-2012 SHCE to examine the numbers of insurers in the individual
and small group markets by state, lines of business (health insurance or life insurance)9, and whether they
are credible or not. In 2010 and 2011, credible firms were defined as those having at least 1,000 member
years. Credible firms with fewer than 75,000 member years were considered “partially credible” by
DHSS, while those with at least 75,000 member years were considered “fully credible”. Starting in 2012,
9 Property/Casualty and Fraternal insurers are extremely small players in health insurance markets. For example, they account for less than one percent of premium revenues for individual market comprehensive major medical policies (Abraham and Karaca-Mandic, 2011).

11
“credible experience” is defined in a cumulative manner. If an insurer has fewer than 75,000 member
years in 2012 in a given state and segment (e.g. individual, small group), its MLR is calculated using data
reported for both the 2011 and 2012 MLR reporting years (Department of Health and Human Services,
December 1, 2010, MLR Interim Rule). Therefore, even though an insurer may be “non-credible” (fewer
than 1,000 member years) for the 2012 reporting year alone, it is not necessarily exempt from MLR
regulation if it has at least 1,000 combined member years for 2011 and 2012. For 2012, we thus define
credible insurers as those with at least 1,000 member years combined for 2011 and 2012.
Table 3 presents the numbers of credible and non-credible insurers in 2010 and 2012 by state in
the individual market, distinguishing health and life insurers. Table 4 presents the breakdown of
enrollment by credible versus non-credible and by health and life insurers in the state in 2010 and 2012.
Tables 5 and 6 repeat the same exercises for the small group market.
Table 3 shows that life insurers participate actively in the individual market. In 2010, states had,
on average, four credible health insurers, three non-credible health insurers, seven credible life insurers,
and 31 non-credible life insurers. The 2012 data reveal similar patterns, although slightly smaller numbers
of credible and non-credible life insurers (eight and 19 on average, respectively). States with only one
credible health insurer in 2010 (AK, DE, MS, MD, NH, RI, WY) had at least 2 to 4 credible life insurers,
except for RI and ND (only one credible life insurer). The majority of states with only two credible health
insurers in 2010 (AL, ID, IA, IN, KS, NC, NE, NV, OK, TN) had at least five credible life insurers.
Credible life insurers were largely absent from the remaining states with only two credible health insurers
in 2010 (two in KY, one in ME, and none in HI and VT). Table 4 shows that credible health insurers
comprised 70% of the individual market in 2010, on average, followed by credible life insurers (26%) and
non-credible life insurers (4%). Overall, non-credible health insurers had a negligible market share
(average of 0.01%). These figures remained stable in 2012.
Relative to the individual market, the small group market had more credible health insurers in
2012 (on average seven per state), slightly fewer non-credible health insurers (on average two) and

12
substantially fewer credible and non-credible life insurers (on average four and five, respectively) (Table
5). Credible health insurers comprised about 80% of the small group market by market share. Credible life
insurers comprised the remaining fraction of the market (about 20%), leaving non-credible health and life
insures with a negligible market share (Table 6).
In Table 7, we describe entry and exit of insurers as well as transitions from credible to non-
credible status and vice-versa between 2010 and 2012. Of the 534 credible life and health insurers in the
individual market in 2010, 455 remained credible in 2011, of which 437 remained credible also in 2012.
Fifty-seven were not credible in 2011, and 22 exited the market in 2011.
Transition from non-credible to credible status was uncommon. Among 1,727 non-credible
insurers in 2010, 34 became credible and 1,157 remained non-credible in 2011. Of these 1,157 non-
credible insurers, 51 became credible, 815 remained non-credible, and 219 exited the market in 2012.The
exit rate of these non-credible insurers was high, with 536 of the 1,727 non-credible insurers from 2010
exiting in 2011.
In the small group market, most credible insurers in 2010 were credible also in 2011 and 2012
(470 of 585). Many non-credible insurers in 2010 remained non-credible in 2011 and 2012 (274 out of
500). As in the individual market, a large fraction of the non-credible insurers from 2010 exited in 2011
(100 of 500).
To investigate market structure further, we computed the Herfindahl-Hirschman index (HHI) for
the individual market (Figure 1 for 2010, Figure 2 for 2012) and the small group market (Figure 3 for
2010, Figure 4 for 2012). We present a 4-category breakdown of HHI by state using the DOJ/FTC
Horizontal Merger Guidelines: <1,500 (unconcentrated); 1,500-2,499 (moderately concentrated); 2,500-
4,999 (highly concentrated); 5,000 and above (highly concentrated). Fourteen states had an individual
market HHI less than 2,500 in both years. Similarly, in the small group market, the number of states with
HHI less than 2,500 remained stable (18 in 2010, and 20 in 2012). Several states had HHIs exceeding
5,000 in 2012 (individual market: AL, AR, IA, KY, NC, ND, NE, NH, NM, RI, SD, VA, VT; small group

13
market: AK, AL, KY, MS, ND, RI) suggesting that the individual market is highly concentrated in many
states. The average HHI in the individual market across all states increased from 2010 to 2012 (3,680 and
3,920 respectively). The corresponding median and the 90th percentiles of the HHI also increased during
this time period (median: from 3,300 to 3,266; 90th percentile: from 6,368 to 6,958).
These NAIC data describing market structure are consistent with findings from the CCIIO
Medical Loss Ratio Annual Reporting Data (available only after 2011) prepared by the Centers for
Medicare and Medicaid Services (CMS). In an analysis of the 2011 data, researchers from the Kaiser
Family Foundation reported market shares of the dominant, second-largest and third-largest insurers by
state (Kaiser State Health Facts, available online10). For example, in our analysis of the NAIC data, AL is
one of the most concentrated individual markets (HHI of 8,313 in 2012). Kaiser’s analysis shows that the
dominant insurer in the individual market of AL (Blue Cross and Blue Shield of Alabama) had 90%
market share. In another high HHI state in our analysis, NC (HHI of 7,312 in 2012), Blue Cross Blue
Shield of NC was the dominant insurer with 83% market share in Kaiser’s analysis. Similarly, in RI (HHI
of 9,072 in 2012), Blue Cross & Blue Shield of Rhode Island had 95% market share. Kaiser’s analysis of
the small group market is also comparable with our analysis based on NAIC data. In our analysis, the
states with highest small-group market HHI were AL (9,429 in 2012) and MS (7,639 in 2012). Kaiser’s
analysis shows that the largest insurer in AL (Blue Cross and Blue Shield of Alabama) had 97% market
share. In MS, Mississippi Insurance Group was the dominant carrier in MS with 73% market share.
Overall, the small group market was less concentrated relative to the individual market. Average HHI
across all states were 3,252 in 2010 and 3,353 in 2012.
IV. The Performance of Insurers in the Individual and Small Group Markets for Health Insurance
10 http://kff.org/other/state-indicator/individual-insurance-market-competition/ (accessed 9/23/ 2013)
and http://kff.org/other/state-indicator/small-group-insurance-market-competition/ (accessed 9/23/2013)

14
Many empirical studies have investigated factors – primarily market structure and regulations –
that explain variation in health insurance premiums. A smaller body of recent research has focused on
estimating the size of insurers’ loading fees and/or medical loss ratios. The ACA medical loss ratio
regulations implemented in 2011 have created heightened awareness of the latter. Other measures of
insurer performance less commonly examined include insurer administrative expenses and operating
margins.
Evaluating Insurer Performance Prior to 2010
Abraham and Karaca-Mandic (2011) analyzed the potential impact of the ACA’s regulation of
insurers’ medical loss ratios (MLR, the percentage of premium that goes to clinical services). Using the
NAIC State Pages data from 2002, 2005 and 2009, they documented large variation in individual market
MLRs by state, with enrollment-weighted average MLRs ranging from 0.629 in New Hampshire to more
than 1.0 in Alabama, Massachusetts, Michigan, and North Dakota in 2009. Additionally, they estimated
that 29% of insurer-state observations with 32% of individual market enrollment would have MLRs
(based on the historical definition) below the 80% minimum threshold imposed by the ACA regulations.
Karaca-Mandic, Abraham and Simon (2013) also used NAIC data from 2001 through 2009 to
compare the MLR and the percentage of premiums spent on administrative expenses in more and less
competitive markets, measured by the number of insurers. They found that markets with only one
credible insurer (least 1,000 member-years of enrollment) have lower MLRs, controlling for insurer
characteristics, health care provider market structure and other market attributes, and population-level
demographics and health status.
A concern with viewing MLR regulations as limiting insurer market power is that the MLR is only
one component of the price-cost margin; the other component is the share of premiums spent on
administrative costs. Therefore, insurers could respond to the MLR regulation by altering administrative
costs in ways that leave the price-cost margin unchanged. For example, insurers could reduce their efforts
to manage utilization, leading to lower administrative expenses, higher claims payments, and higher

15
MLRs. While some reduction in utilization management may be desirable for improving access to
efficient health care (e.g., through lower levels of denials or pre-approvals), this reduction could also lead
to increased claims for low-value medical care. Karaca-Mandic, Abraham and Simon (2013) found no
evidence that insurers’ administrative expenses as a percentage of premiums are related to insurance
market structure. Thus, their results are largely consistent with the suggestion that health insurance
regulators can use MLRs to measure market power in the individual health insurance market, but with
notable caveats relating to measurement issues, limited ability to capture product and firm heterogeneity
that can influence differences in price-cost margins, and other potential unintended consequences of the
regulation.
Most studies of the small group market focus on state regulations in the 1990s and their effect on
premiums (Buchmueller and DiNardo, 2002; Marquis and Long, 2002; Monheit and Schone, 2004,
Davidoff, Blumberg, and Nichols, 2005; Simon, 2005). Karaca-Mandic, Feldman, and Graven (2013)
recently investigated the effects of competition in the market for insurance agents and brokers on
premiums for small employers (50 or fewer employees). Using the Medical Expenditure Panel Survey –
Insurance Component and data from the National Association of Health Underwriters, they found that
premiums of policies offered by small employers are lower in markets with stronger competition among
insurance agents and brokers.
A less examined performance measure is the health insurance loading fee (L) that represents the
portion of a premium not related to medical care – largely administrative costs. The loading fee typically
is modeled as a multiplier to expected claims:
claimsLprem )1(
For example, if premium is $125, and expected claims are $100, the loading fee is 0.25 or 25%. The
loading fee is closely rated to the MLR. Prior to passage of federal health reform, the MLR was defined
as the ratio of expected claims paid by the insurer to the premium. Expressing the loading fee as a
multiplier of expected claims, the MLR can be written as:

16
)1/(1 LMLR
In this framework, the loading fee captures an insurer’s costs for general administration, underwriting,
marketing, broker commissions, medical management and claims adjudication, as well as any profits or
net income for a non-profit insurer.
The most commonly reported loading fee estimates by firm size date back more than two decades,
when the Hay/ Huggins Company prepared an actuarial study for the U.S. Congress House Committee on
Education and Labor in 1988. These estimates reflected the underwriting practices of major insurers and
suggested loading fees of about 40% for the smallest firms (1-4 employees), 25% for those slightly larger
(20-49 employees), and 18% for those with 50-99 employees. Hay/Huggins also reported that loading
fees decline to 16% for employers with 100-499 employees and 12% for those with up to 2,500
employees. These estimates from the 1980s are still cited frequently in the literature, including current
health economics and health insurance texts (Phelps, 2010).
Using data from the confidential MEPS Household Component–Insurance Component Linked
File, Karaca-Mandic, Abraham, and Phelps (2011) recently generated new estimates of loading fees and
how they differ across the firm size distribution. They found that firms of up to 100 employees face
similar loading fees of approximately 34%. Loads decline with firm size and are estimated to be 15% for
firms with between 101 and 10,000 employees and 4% for firms with more than 10,000 workers.
Insurer Performance in 2010 and After
Starting in the 2010 filing year, the SHCE includes line items for insurers to compute each
component of the MLR as defined by the regulation. The SHCE also has a line item for the MLR. In
comparison with the period before 2010, the ACA regulations made several changes to the historical
definition of the MLR (the ratio of claims to premiums). First, the ACA classifies insurers’ expenses for
certain quality improvement activities as “clinical benefits” that can be counted similarly as medical
claims. Certain activities for fraud and abuse detection and recovery can be included in the numerator of

17
the MLR. Second, federal and state taxes, licensing and regulatory fees are deducted from premiums
earned in the denominator.
Using data from the SHCE, several studies have examined insurer filings for reporting years of
2010 (considered as a pre-MLR regulation year) and 2011. The General Accounting Office (2011)
analyzed insurers’ MLRs in the individual and group markets. Using 2010 data and the new ACA
standards described above, GAO found wide variation in MLRs in the individual market, with only 43%
of credible insurers and 48% of covered lives at or above the 2011 standard. These percentages were
notably higher for the small and large group markets. Hall and McCue (2012), examining the NAIC’s
2010 data, estimated that rebates paid to consumers would have reached almost $2 billion ($1 billion in
the individual market, $0.5 billion in the small group, and $0.5 billion in the large group market) if the
MLR regulation had been implemented in 2010.
However, it is important to note that measurement of MLR in the SHCE does not exactly match
the MLR used by the HHS to determine rebates. In fact, the MLR reported in the SHCE is labeled as the
“preliminary MLR.” Several adjustments are needed to properly calculate MLR rebates. The first is a
“credibility” adjustment to reflect that insurers with smaller enrollment face more variable claims and
premiums, and thus should be given additional room to meet the MLR threshold. Under formulae
published in the Interim Final Rule of the regulation, insurers with more than 1,000 but fewer than 75,000
member-years (known as partially-credible insurers) receive a credibility adjustment of up to 8.3% to
their preliminary MLR on a sliding scale. Insurers with 75,000 or more member-years (fully credible) do
not receive any credibility adjustment. Using the member-years reported in the SHCE, it is possible to
calculate the credibility adjustment.
A second adjustment allows insurers that sell high deductible policies to increase the MLR. The
rationale for this adjustment is that administrative cost is generally a disproportionately higher share of
the premiums in high deductible policies because the deductible reduces claims costs and premiums but

18
not administrative costs. Because the SHCE does not include benefit design information, it is not possible
to calculate this adjustment with only the SHCE data.
Third, HHS’s rebate calculations allow claims paid through March of the following year to be
included in the numerator of the MLR. Because the SHCE is for the reporting year only, it is not possible
to make this adjustment.11
Finally, starting with the 2012 filing year, the SHCE calculation of the MLR becomes more
complex because the rebate calculation requires the MLR experience of partially credible insurers to be
aggregated across several years. For the 2012 reporting year, MLR for these insurers has to be calculated
combining 2011 and 2012 data (which we detail below).12 Similarly, the credibility adjustment for 2012 is
calculated by aggregating member years over 2011 and 2012.
Several recent studies have used 2010 and 2011 SHCE filings to evaluate the early impact of the
medical loss ratio regulation. McCue and Hall (December 2012) examined changes in administrative costs
and profit margins. They found reductions of about $209 million in administrative costs in the individual
market and $190 million in the small group market. The authors also documented reductions in profits in
the individual market of about $351 million, but increases in profits in the small group market of about
$226 million. While the average MLR increased from 80.8% to 84.1% in the individual market, it stayed
about the same (83.6%) in the small group market.
In a follow-up study, McCue, Hall and Liu (2013) distinguished between for-profit and non-profit
insurers and found that reductions in administrative costs and operating margins were primarily driven by
for-profit insurers in the individual market. Non-profit insurers already had high MLRs in 2010 relative to
for-profit insurers (88.1% vs. 71.8%). In the small group market, the percentage of premiums spent on
administrative costs declined more among for-profit firms (from 19.4% in 2010 to 18.7% among for-
profits, from 12$ to 11.9% among non-profits). Surprisingly, however, operating margins (defined as the
11http://www.naic.org/documents/committees_e_health_reform_solvency_impact_exposure_related_doc_shce_preliminary_mlr_cautionary_statement.pdf 12 Beginning in the 2013 reporting year, information from two years prior to the MLR reporting year will be used

19
percentage of premiums not spent on clinical services or administrative costs) increased slightly from
1.6% to 2.8% among non-profits with no significant change among for-profits.
Abraham, Karaca-Mandic and Simon (2013) also examined the 2010 and 2011 SHCE filings to
analyze the early responses of individual and small group market insurers to the MLR regulation.
Controlling for various factors – insurers’ ownership type and HMO status, insurance market competition,
and existing state laws – they expected to find heterogeneous responses by insurers’ baseline
characteristics. They found that several factors were significantly related to insurers’ MLRs. Individual
market insurers with more enrollments in other market segments have lower MLRs, on average, as do for-
profit organizations (2.25 percentage points lower). In contrast, HMOs have MLRs that are 4.58
percentage points higher on average, which may reflect higher actuarial value plans. In the small group
market, an insurer’s overall enrollment across all states and segments is inversely related to its MLR, but
the magnitude is small. Additionally, small group insurers that operate in more concentrated markets,
measured by the Herfindahl Hirschman index, have significantly lower MLRs. In contrast, insurers that
operate in states with existing MLR regulations have higher MLRs.
In terms of early responses to the MLR regulation, the authors found that individual market
insurers with 2010 MLRs that are more than 10 percentage points under the 80% threshold experienced a
10.94 percentage point increase in MLR from 2010 to 2011 (controlling for the influence of other factors),
while those within five points under the threshold experienced only a 2.91 percentage point increase in
MLR. Individual market insurers with MLRs more than 10 points above the threshold in 2010 reported a
decrease, on average, relative to insurers that were only slightly above the 80% threshold. A similar
pattern of changes in insurers’ MLRs occurred in the small group market.
The Kaiser Family Foundation (April 2012) used data from SHCE filings for 2011 to project
rebates of $426 million, $377 million and $541 million in the individual, small group and large group
markets respectively. In 2012 consumers actually received about $1.1 billion in rebates for the 2011
reporting year ($394 million in the individual market, $321 million in the small group market, and $386

20
million in the large group market).13 The similarity in projected rebates using the 2011 SHCE filings and
actual rebates reported by CMS is encouraging in terms of the ability to use NAIC data to study insurance
market performance.
Cox, Claxton and Levitt (2013) used the SHCE data for 2010-2012 filings of “preliminary MLRs”
and projected that rebates for the 2012 reporting year would be about half the $1.1 billion received for the
previous year. The CMS reported in August 2013 that rebates for the 2012 reporting year were $193
million in the individual market, $203 million in the small group market, and $109 million in the large
group market, again verifying the credibility of MLRs reported in the SHCE.14
In this paper, we present the first estimates in key insurer performance measures from the 2012
SCHE filings. In Figures 5 and 6, we estimate changes in premiums earned and claims incurred per
member year in the individual and small group markets in 2010 and 2012. These amounts are inflated to
reflect 2012 dollars. On average, premiums per member year increased from $2,786 in 2010 to $3,124 in
2012, and claims per member year increased from $2,154 in 2010 to $2,735 in 2012 in the individual
market. Both premiums are claims per member year were remarkably stable in the small group market.
In Figures 7 and 8, we decompose the premiums spent for clinical services (i.e. the preliminary
MLR), administrative costs and the operating margin (residual from clinical services and administrative
costs) in the individual and small group markets. While the operating margin declined steadily over the
time period in the individual market (from 6% in 2010 to 1% in 2012), it was stable in the small group
market (around 5-6%). Administrative costs as a percentage of the premiums also declined steadily in the
individual market (19% in 2010, 16% in 2011, and 14% in 2012), and declined slightly in the small group
market (13% in 2010, 12% in 2011, and 11% in 2012).
Next, we present estimates of MLRs in the two markets from 2010 through 2012. As discussed
above, calculation of rebates using the preliminary MLR reported in SCHE is complicated. To calculate
13 http://www.hhs.gov/news/press/2012pres/09/20120911a.html (accessed October 1, 2013). McCue and Hall (December 2012) also report the rebates that CMS announced. 14 http://www.cms.gov/CCIIO/Resources/Data-Resources/Downloads/2012-mlr-rebates-by-state-and-market.pdf (accessed October 1, 2013)

21
rebates, HHS adjusts the MLRs based on credibility, plan design (i.e. deductibles), and claims paid
through March of the following year. Moreover, for the 2012 reporting year, insurer experience was
aggregated over 2011 and 2012 reporting years if the insurer had fewer than 75,000 member years
(partially credible) in the state and the segment (individual, small group or large group market) in 2012.15
This means that both the numerator and the denominator of the MLR formula must be aggregated over the
two years before taking their ratio. Moreover, insurers can include rebates paid in the previous year in the
numerator to avoid double counting (MLR Interim Final Rule). An insurer’s credibility and the
subsequent credibility adjustment to MLR are also based on its aggregated member years in 2011 and
2012.
We were able to conduct the aggregation exercise for the 2012 reporting year. We also made the
credibility adjustment for the size of the insurer from member years reported in the SCHE. However, we
could not adjust for benefit design or claims payments up to the first quarter of the following year.
Table 8 presents our estimates of MLR for fully credible insurers with at least 75,000 member
years in the state-segment. The unique number of such insurers and the number of insurer-state
observations are very similar, suggesting that such insurers are typically local, operating in just one state.
The average MLR increased from 80.39% (95% CI 76.76%-84.03%) in 2010 to 85.38% (95% CI
83.21%-87.54%) in 2012 in the individual market, with 89% of the insurers meeting the MLR threshold
of 80%. Changes in MLRs in the small group market are smaller (83.56% in 2010, and 84.88% in 2012).
Median MLRs in 2012 are 83.55% and 83.7% in the individual and small group markets respectively.
Table 9 reports summary statistics based on preliminary MLRs (with no adjustment), as well as
MLRs adjusted for aggregation and credibility for the partially credible insurers. The number of partially
credible insurers in either the individual or the small group market is noticeably higher than the number
fully credible insurers reported in Table 8. In 2012, 169 unique insurers represented 409 insurer-state
15 Starting 2013, the experience for partially credible insurers is aggregated over three years (for example over 2011,
2012 and 2013 for the reporting year of 2013).

22
observations in the individual market, and 244 unique insurers represented 437 insurer-state observations
in the small group market. Not surprisingly, the percentage of insurers meeting the 80% MLR threshold
increased over time in both markets. Based on preliminary MLRs reported in SHCE (with no adjustment)
for 2012, 60% of the insurers in the individual market, and 68% of those in the small group meet the
MLR threshold. However, when adjusted for the aggregation of 2012 reporting year with the 2011
reporting year, these numbers decline to 51% and 67% respectively suggesting that aggregation rule
penalizes insurers if they have low MLRs in 2011. After incorporating the credibility adjustment to the
aggregation adjustment, the percentage of insurers meeting the MLR threshold in 2012 increases (61% in
the individual market, 76% in the small group market). In terms of the average MLR in 2012, the
aggregation adjustment moved the average MLR from 85.39% (preliminary) to 83.82%, but the additional
credibility adjustment moved it up about three percentage points to 87% in the individual market. The
adjustments moved the average MLR similarly in the small group market in 2012 from 84.14%
(preliminary) to 83.24% (aggregation adjustment) and to 85.58% (aggregation and credibility
adjustments).
V. Other Measurement Issues
The SHCE was developed with the primary purpose of measuring relevant components of
insurers’ MLRs (claims, premiums, quality improvement, and expenses for detection of fraud and abuse)
as well as tracking their administrative expenses (e.g., claims adjudication, total general and
administrative expenses including sales and brokers fees), and other financial aspects of the health
insurers. Because the MLR regulation currently applies to individual and group markets only, the SCHE
lacks information on other business segments represented in the State Pages (Medicare supplement,
Dental, Vision, Federal Employees Health Benefit Plan, Title XVIII Medicare and Title XIX Medicaid).
Another limitation of the SHCE is that it lacks information on health services utilization
encounters such as physician and non-physician ambulatory encounters and hospital inpatient days
incurred, which is included in the Health State Pages. While one could use the SHCE together with the

23
Health State Pages to obtain a more complete picture, life insurers and other non-health insurers selling
health insurance still do not file the Health State Pages.
Finally, the figures reported in the SHCE do not allow for calculating exact rebates as discussed
above. While it is possible to make credibility adjustments for partially credible insurers, neither the
SHCE nor the State Pages includes information on the share of high-deductible plans or premiums. As
another adjustment we did not discuss earlier, an insurer with 50% or more of earned premiums attributed
to newly issued policies can be excluded from the MLR reports because they are likely to have lower
claims. The SCHE and the State Pages do not include information on the share of newly issued policies.
As the ACA changes of 2014 begin to be implemented, it would of course be valuable for
researchers to track consumers’ and insurers’ participation in health insurance exchanges. For example,
Federal household surveys could include questions on the scope of the insurance policy (e.g.
comprehensive or limited benefit), premiums and subsidies for the policy, as well as whether the policy
was purchased in the exchange. Similarly, employer-based surveys such as MEPS-IC could incorporate
additional questions to measure small employers’ participation in SHOP exchanges (for example, whether
they participated, the metal levels, and the premiums of the policies). NAIC could also request
information that separates each insurer’s business separately in and out of the exchange in each state both
for the individual and small group markets.
VI. Conclusion
We provided a synthesis of the research available to measure and evaluate the size, structure and
performance of the individual and small group markets. We discussed the availability and use of different
data sets in measuring these concepts and we highlighted important measurement problems and possible
solutions to consider when assessing the performance of health insurance markets as the ACA is fully
implemented. Finally, we presented new estimates from 2012 using the NAIC SCHE filings.
Even after coverage hierarchies are imposed, Federal household surveys give widely different
estimates of how many individuals were covered in the individual market prior to the ACA. While it is

24
premature to know precisely how the individual market will evolve given the introduction of Exchanges
and additional regulatory structures created by ACA, we will presumably have better information on
enrollment starting in 2014. Nevertheless, it may be difficult to track changes in enrollment and to
conduct studies based on a pre/post-ACA design using the Federal household surveys because of the
limitations in properly estimating the size of the individual market at the baseline. Unlike in the individual
market, we have better estimates of the small group market enrollment from the MEPS-IC.
The NAIC was the only source available to identify insurers operating in the individual and group
markets until 2011. However, the NAIC data were quite limited until 2010, when major improvements
occurred through the introduction of the SHCE. This new exhibit filed by all insurers allows for
estimating participation of non-health insurers (e.g., life insurers) in health insurance markets and
provides a break-down of the group market into small and large groups. We used the NAIC data from
2010-2012 to estimate the share of life insurers as well as changes in market structure (counts of insurers
and HHI) during this period.
The SHCE provides a unique opportunity to construct a complete picture of both the individual and
small group health insurance markets starting with the 2010 filing year. Although we only have one “pre-
ACA” year (2010) for early implemented ACA provisions such as the MLR regulation, we can make
some assessments of ACA effects. Despite the fact that MLR measurement from the SHCE does not
exactly match CMS’s measurement of MLR for rebates, the SHCE seems to perform well in predicting
rebates.

25
Table 1: Individual Market Coverage Information and Estimates by Survey, 2009
MEPS NHIS CPS ACS Survey Question(s) Was anyone in the
family covered by health insurance from any source listed on the card?
Which kind of health insurance or health care coverage do you have? Include those that pay for only one type of service (nursing home care, accidents or dental care). Exclude private plans that provide extra cash while hospitalized). Which one of these categories best describes how this plan was obtained?
At any time during 2009, (was/were) (you/ anyone in this household) covered by a health insurance plan that (you/they) PURCHASED DIRECTLY FROM AN INSURANCE COMPANY, that is, not related to current or past employment?
Is this person currently covered by any of the following types of health insurance or coverage plans?
Response Option Indicating Directly Purchased or Individual Market Coverage
(1) Directly from an insurance agent; (2) Directly from a company; (3) Directly from an HMO
(1)Through workplace (self-employed or professional association) (2) Purchased directly (3) Through school2
(1) Yes "Insurance purchased directly from an insurance company."
Reference Period Point-in-Time and Monthly Point-In-Time
Any time during year
Point-In-Time
Recall Period of Item None-6 months None 4-16 months None
Estimate of the Non-Elderly Population, U.S. reporting Directly Purchased insurance
Point-In-Time
Any Time During Year Point-In-Time
Any Time During Year
Point-In-Time
9,550,414
11,240,406 14,030,479 18,454,383 25,319,985
Estimate of the Non-Elderly Population, U.S. reporting Directly Purchased insurance adjusted for Coverage Hierarchy1
8,215,358 13,379,765 10,812,180 16,635,033
Source: Abraham J., Karaca-Mandic, P., Boudreaux M. “Sizing Up the Individual Market for Health Insurance: A
Comparison of Survey and Administrative Data Sources”, Medical Care Research and Review, 2013, Aug; 70(4): 418-33: Tables 1, 2, and 3 (reproduced with authors’ permission).
1. Hierarchical assigns a maximum of one type of coverage to a respondent. Prioritization of coverage types is public, employer sponsored, and directly purchased

26
Table 2: Estimates of employees with health insurance coverage in firms with less than 50 employees 2009 2010 2011 2012
(1) Total number of employees1 29,804,923
29,792,468
29,717,915
30,615,432
(2) % of Employees in firms that offer health insurance2
59.6 57.8 54.7 52.9
(3) % of Employees enrolled in health insurance in firms that offer health insurance3
59.6 59.2 58.6 57.7
(4) % of Enrollees that are enrolled in self‐insured plans in firms that offer insurance4
11.6 12.5 10.8 12.5
(5) Total estimated number of employees with health insurance coverage (1)*(2)*(3)/10000
10,587,185 10,194,268 9,525,840 9,344,840
(6) Covered under self‐insured plans
1,228,113 1,274,284 1,028,791 1,168,105
(7) Covered under non‐self‐insured plans
9,359,072 8,919,984 8,497,049 8,176,735
1. Table I.B.1(2009) Number of private-sector employees by firm size and selected characteristics: United States, 2009 http://meps.ahrq.gov/mepsweb/data_stats/summ_tables/insr/national/series_1/2009/tib1.htm 2. Table I.B.2(2009) Percent of private-sector employees in establishments that offer health insurance by firm size and
selected characteristics: United States, 2009 http://meps.ahrq.gov/mepsweb/data_stats/summ_tables/insr/national/series_1/2009/tib2.htm
3. Table I.B.2.b(2009) Percent of private-sector employees that are enrolled in health insurance at establishments that offer health insurance by firm size and selected characteristics: United States, 2009establishments that offer health insurance by firm size and selected characteristics: United States, 2009 http://meps.ahrq.gov/mepsweb/data_stats/summ_tables/insr/national/series_1/2009/tib2b.htm
4. Table I.B.2.b.(1)(2009) Percent of private-sector enrollees that are enrolled in self-insured plans at establishments that offer health insurance by firm size and selected characteristics: United States, 2009 http://meps.ahrq.gov/mepsweb/data_stats/summ_tables/insr/national/series_1/2009/tib2b1.htm

27
Table 3: Number of insurers selling comprehensive health insurance in the individual market
2010 2012
Health Insurer Life Insurer Health Insurer Life Insurer
State Credible Non‐
Credible Credible Non‐
Credible Credible Non‐
Credible Credible Non‐
Credible
AK 1 1 4 9 2 0 4 8
AL 2 0 5 39 1 0 4 30
AR 3 2 4 38 2 3 4 28
AZ 4 4 14 29 3 2 18 16
CA 1 0 10 39 1 1 11 24
CO 3 7 15 33 3 6 16 18
CT 3 3 4 25 3 4 7 14
DC 3 2 1 19 3 4 2 18
DE 1 3 2 22 2 2 3 15
FL 9 6 17 48 12 3 19 22
GA 5 4 15 40 6 4 16 22
HI 2 0 0 12 2 0 0 9
IA 2 3 5 32 2 3 6 23
ID 3 0 5 23 3 2 3 15
IL 4 6 18 34 3 9 19 19
IN 2 5 14 34 3 4 16 18
KS 2 4 7 30 2 4 9 23
KY 2 4 2 31 2 3 3 23
LA 5 1 8 33 5 1 7 24
MA 6 6 1 32 7 5 2 21
MD 6 3 5 32 5 5 5 18
ME 2 3 1 21 2 2 1 13
MI 4 6 13 33 9 8 12 17
MN 4 2 4 35 5 3 3 23
MO 5 8 11 36 4 6 14 23
MS 1 1 6 35 1 2 7 27
MT 3 1 5 22 2 1 6 15
NC 2 5 14 35 2 4 16 16
ND 1 2 1 18 2 2 4 14
NE 2 1 7 31 3 0 8 24
NH 1 2 3 21 1 1 3 14
NJ 7 2 0 29 7 2 2 18
NM 3 0 3 37 2 0 5 24
NV 2 5 8 31 3 3 8 19
NY 14 4 2 34 12 3 5 16
OH 5 11 10 39 5 11 13 25
OK 2 3 8 34 1 4 10 23
OR 7 3 2 30 7 2 2 20
PA 14 4 11 36 18 7 12 20

28
RI 1 2 1 16 1 2 0 8
SC 3 2 9 42 4 1 10 24
SD 3 2 2 30 5 1 2 18
TN 2 4 9 39 3 4 12 26
TX 3 10 25 42 2 10 23 23
UT 3 1 7 30 3 1 5 17
VA 5 5 6 43 5 6 7 26
VT 2 1 0 10 2 1 0 12
WA 9 3 3 25 9 3 3 17
WI 9 6 10 30 9 6 13 21
WV 1 2 3 38 1 2 3 25
WY 1 2 4 24 1 2 7 17
U.S. Average 4 3 7 31 4 3 8 19"Data Source: National Association of Insurance Commissioners, by permission. The NAIC does not endorse any analysis or conclusions based upon the use of its data."
Data from California is incomplete
Credible firms have at least 1,000 member‐years. In 2012, "credible" status is defined by the aggregated member‐years over 2011 and 2012 for insurers with < 75,000 member‐years

29
Table 4: Enrollment and market share by type of insurer in the individual market 2010 2012
Health Insurer Life Insurer Health Insurer Life Insurer
State
Total Member Years, 2010 Credible
Non‐Credible Credible
Non‐Credible
Total Member Years, 2012 Credible
Non‐Credible Credible
Non‐Credible
AK 16072 0.59 0.04 0.32 0.06 15004 0.67 0 0.27 0.05
AL 176526 0.87 0 0.1 0.02 167361 0.91 0 0.08 0.01
AR 118450 0.84 0 0.12 0.04 113218 0.85 0 0.12 0.02
AZ 255356 0.51 0 0.47 0.01 261828 0.51 0 0.48 0
CA 986547 0.52 0 0.48 0 1095684 0.59 0 0.41 0
CO 299793 0.46 0 0.53 0.01 268419 0.49 0 0.5 0.01
CT 107938 0.6 0 0.37 0.03 111942 0.55 0.01 0.44 0.01
DC 19524 0.8 0 0.09 0.11 18274 0.79 0 0.16 0.05
DE 18496 0.5 0.01 0.33 0.16 17209 0.56 0 0.37 0.07
FL 847542 0.71 0 0.28 0 835051 0.69 0 0.31 0
GA 353740 0.69 0 0.29 0.01 382239 0.67 0 0.32 0
HI 30913 0.99 0 0 0.01 28359 1 0 0 0
IA 177363 0.86 0 0.11 0.03 177532 0.89 0.01 0.09 0.01
ID 127000 0.77 0 0.22 0.01 99469 0.95 0 0.05 0
IL 457366 0.7 0 0.29 0 145949 0.18 0 0.82 0
IN 179663 0.62 0 0.35 0.03 174907 0.65 0 0.34 0
KS 126792 0.28 0 0.69 0.04 120897 0.37 0 0.61 0.02
KY 148638 0.94 0 0.04 0.02 133826 0.96 0 0.03 0.01
LA 179178 0.86 0 0.12 0.02 170759 0.91 0 0.08 0.01
MA 105980 0.95 0 0.02 0.03 81084 0.98 0 0 0.01
MD 188040 0.78 0 0.22 0.01 179917 0.72 0 0.27 0.01
ME 37236 0.63 0 0.34 0.02 33239 0.62 0 0.37 0.01
MI 332637 0.6 0 0.37 0.02 323341 0.62 0 0.37 0
MN 245068 0.87 0 0.12 0.01 247707 0.92 0 0.07 0.01
MO 239103 0.62 0 0.35 0.02 245707 0.65 0 0.34 0.01
MS 79547 0.54 0 0.38 0.08 79251 0.59 0 0.36 0.04
MT 52903 0.58 0 0.4 0.02 50626 0.68 0 0.3 0.03
NC 417102 0.85 0 0.14 0.01 430755 0.9 0 0.1 0
ND 42441 0.81 0.03 0.12 0.05 43590 0.84 0.02 0.13 0.02
NE 108392 0.67 0 0.29 0.04 121894 0.73 0 0.25 0.02
NH 34484 0.67 0 0.27 0.06 35450 0.81 0 0.16 0.02
NJ 122853 0.99 0 0 0.01 147306 0.98 0 0.01 0
NM 61800 0.9 0 0.06 0.04 29822 0.84 0 0.11 0.05
NV 87327 0.44 0.02 0.51 0.03 90886 0.46 0 0.53 0.01
NY 129440 0.92 0.01 0.04 0.03 139101 0.93 0.01 0.05 0.01
OH 202135 0.53 0.01 0.44 0.03 323139 0.75 0 0.24 0
OK 120415 0.63 0 0.31 0.06 43093 0.11 0.02 0.83 0.04
OR 185768 0.89 0.01 0.09 0.01 169248 0.92 0 0.07 0.01

30
PA 471105 0.77 0 0.22 0.01 444163 0.79 0 0.2 0
RI 30949 0.47 0.01 0.52 0 16495 0.95 0.01 0 0.04
SC 133799 0.58 0.01 0.35 0.06 126116 0.66 0 0.32 0.02
SD 59021 0.89 0.01 0.07 0.03 62808 0.96 0 0.02 0.02
TN 235107 0.68 0 0.28 0.03 238119 0.74 0 0.25 0.01
TX 734307 0.57 0 0.42 0.01 290110 0.02 0 0.97 0
UT 141189 0.68 0 0.31 0.01 136231 0.65 0 0.35 0.01
VA 317279 0.84 0 0.14 0.02 315664 0.87 0 0.12 0.01
VT 17516 0.99 0 0 0.01 18470 0.99 0 0 0.01
WA 315470 0.93 0 0.07 0 284273 0.98 0 0.02 0
WI 176491 0.55 0 0.42 0.03 172402 0.63 0.01 0.36 0
WV 22109 0.41 0.01 0.38 0.2 24017 0.62 0.01 0.29 0.08
WY 24423 0.42 0.01 0.37 0.2 22177 0.39 0.03 0.51 0.07 U.S. Total 10098333 9304128
U.S. Average 0.7 0 0.26 0.04 0.72 0 0.26 0.02
"Data Source: National Association of Insurance Commissioners, by permission. The NAIC does not endorse any analysis or conclusions based upon the use of its data."
Data from California is incomplete
Credible firms have at least 1,000 member‐years. In 2012, "credible" status is defined by the aggregated member‐years over 2011 and 2012 for insurers with < 75,000 member‐years

31
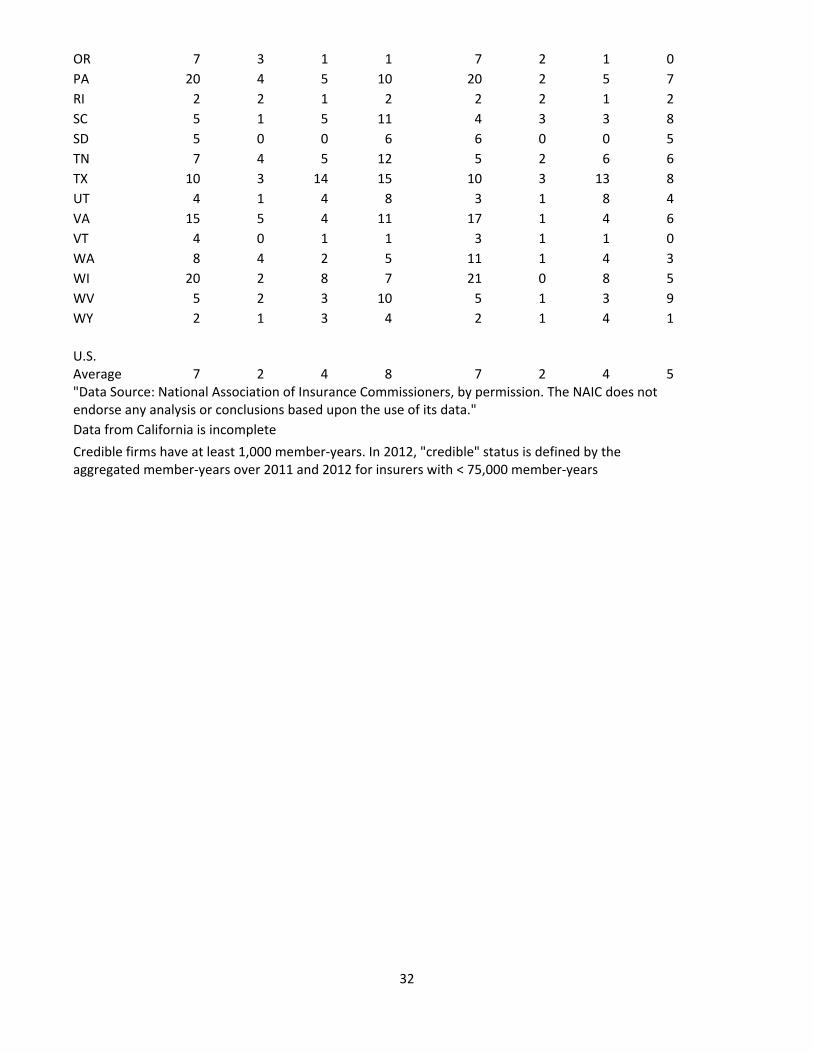
Table 5: Number of insurers selling comprehensive health insurance in the small group
market
2010 2012
Health Insurer Life Insurer Health Insurer Life Insurer
State Credible Non‐
Credible Credible Non‐
Credible Credible Non‐
Credible Credible Non‐
Credible
AK 2 0 2 5 2 0 4 1
AL 2 1 1 8 2 1 1 7
AR 5 2 2 11 7 0 1 9
AZ 8 3 9 12 6 1 8 9
CA 2 0 7 9 2 0 6 7
CO 8 3 3 9 7 1 3 6
CT 8 0 4 6 6 0 2 6
DC 6 4 3 5 6 5 3 2
DE 4 5 1 6 4 5 1 5
FL 13 1 3 8 13 4 4 3
GA 12 0 11 10 13 1 11 7
HI 5 0 0 1 5 0 0 1
IA 7 4 2 9 8 2 1 7
ID 4 1 0 7 4 1 1 5
IL 12 6 12 13 10 4 9 11
IN 6 5 12 12 7 4 14 7
KS 4 3 7 9 4 4 7 6
KY 4 4 1 9 6 1 1 7
LA 5 2 2 7 6 1 3 6
MA 12 2 3 6 12 2 3 7
MD 11 2 2 2 12 1 2 4
ME 4 0 2 4 4 0 2 2
MI 8 2 13 11 17 0 11 4
MN 7 1 0 5 8 1 0 4
MO 10 5 7 12 7 5 7 7
MS 1 2 4 7 3 0 4 5
MT 3 0 2 7 3 0 3 5
NC 6 1 4 11 6 1 5 7
ND 3 2 1 3 3 2 1 2
NE 3 0 6 10 3 1 4 9
NH 5 2 2 4 5 0 0 4
NJ 9 1 3 3 8 1 3 2
NM 5 1 3 8 4 1 1 3
NV 10 2 6 11 8 2 6 7
NY 22 2 2 5 19 1 4 2
OH 17 4 6 18 16 2 9 13
OK 6 1 8 8 4 2 6 7
32
OR 7 3 1 1 7 2 1 0
PA 20 4 5 10 20 2 5 7
RI 2 2 1 2 2 2 1 2
SC 5 1 5 11 4 3 3 8
SD 5 0 0 6 6 0 0 5
TN 7 4 5 12 5 2 6 6
TX 10 3 14 15 10 3 13 8
UT 4 1 4 8 3 1 8 4
VA 15 5 4 11 17 1 4 6
VT 4 0 1 1 3 1 1 0
WA 8 4 2 5 11 1 4 3
WI 20 2 8 7 21 0 8 5
WV 5 2 3 10 5 1 3 9
WY 2 1 3 4 2 1 4 1
U.S. Average 7 2 4 8 7 2 4 5"Data Source: National Association of Insurance Commissioners, by permission. The NAIC does not endorse any analysis or conclusions based upon the use of its data."
Data from California is incomplete
Credible firms have at least 1,000 member‐years. In 2012, "credible" status is defined by the aggregated member‐years over 2011 and 2012 for insurers with < 75,000 member‐years

33
Table 6: Enrollment and market share by type of insurer in the small group market
2010 2012
Health Insurer Life Insurer Health Insurer Life Insurer
State
Total Member Years, 2010 Cred. Non‐Cred. Cred.
Non‐Cred.
Total Member Years, 2012 Cred.
Non‐Cred. Cred.
Non‐Cred.
AK 27193 0.81 0 0.13 0.06 32982 0.75 0 0.25 0
AL 333464 0.96 0 0.03 0.01 300824 0.98 0 0.02 0
AR 128104 0.73 0 0.25 0.02 135260 0.83 0 0.16 0.01
AZ 310048 0.41 0 0.58 0.01 224005 0.35 0 0.64 0.01
CA 737370 0.39 0 0.61 0 714052 0.38 0 0.62 0
CO 296943 0.59 0 0.4 0 234853 0.6 0 0.39 0.01
CT 303407 0.96 0 0.04 0.01 246543 0.98 0 0.01 0
DC 125154 0.89 0.01 0.09 0 97986 0.88 0.01 0.1 0
DE 55031 0.91 0.03 0.04 0.02 54266 0.97 0.01 0.01 0.01
FL 873558 0.66 0 0.34 0 823504 0.74 0 0.25 0
GA 529174 0.77 0 0.23 0 610714 0.78 0 0.22 0
HI 191901 1 0 0 0 168746 1 0 0 0
IA 204892 0.88 0.01 0.11 0.01 164182 0.9 0 0.08 0.01
ID 99273 0.97 0 0 0.02 85064 0.98 0 0.01 0.01
IL 733237 0.75 0 0.24 0 260338 0.53 0 0.47 0.01
IN 293311 0.66 0 0.32 0.01 334529 0.74 0 0.26 0.01
KS 240971 0.19 0 0.8 0.01 194569 0.25 0 0.74 0
KY 184178 0.96 0.01 0.02 0.01 183265 1 0 0 0
LA 327749 0.89 0 0.1 0.01 287175 0.92 0 0.08 0
MA 679117 0.96 0 0.04 0 581971 0.98 0 0.02 0
MD 426090 0.92 0 0.08 0 353976 0.93 0 0.07 0
ME 93656 0.61 0 0.39 0 81686 0.72 0 0.28 0
MI 499867 0.7 0 0.29 0.01 654179 0.9 0 0.1 0
MN 272651 1 0 0 0 316387 1 0 0 0
MO 399047 0.7 0 0.29 0.01 322929 0.78 0 0.22 0
MS 128627 0.8 0.01 0.18 0.01 117300 0.9 0 0.09 0.01
MT 57293 0.84 0 0.12 0.04 51845 0.88 0 0.11 0.01
NC 440594 0.77 0 0.22 0.01 350545 0.81 0 0.18 0
ND 82930 0.98 0 0.01 0 67569 0.98 0 0.01 0.01
NE 96726 0.66 0 0.31 0.03 88153 0.8 0 0.19 0.01
NH 107310 0.97 0 0.02 0.01 87754 0.99 0 0 0.01
NJ 873581 0.98 0 0.02 0 711940 0.98 0 0.01 0
NM 81586 0.82 0 0.17 0 40989 0.85 0 0.15 0
NV 128670 0.68 0.01 0.3 0.01 105508 0.65 0.01 0.34 0.01
NY 1785384 0.97 0 0.02 0144482
0 0.94 0 0.06 0
OH 842523 0.9 0 0.1 0 955972 0.86 0 0.13 0
OK 202981 0.61 0 0.38 0.01 80669 0.38 0 0.61 0.01

34
OR 234594 0.93 0 0.07 0 228449 0.94 0 0.06 0
PA 1110624 0.94 0 0.06 0106283
6 0.98 0 0.02 0
RI 101552 0.75 0.01 0.23 0.01 85611 0.77 0.01 0.22 0
SC 195703 0.85 0 0.14 0.01 158375 0.9 0 0.09 0.01
SD 57999 0.99 0 0 0.01 52654 0.99 0 0 0.01
TN 427090 0.82 0.01 0.17 0.01 353371 0.82 0 0.18 0
TX 1197943 0.53 0 0.47 0 757686 0.25 0 0.75 0
UT 213549 0.75 0 0.24 0.01 244766 0.77 0 0.23 0
VA 536232 0.91 0 0.08 0.01 465807 0.91 0 0.09 0
VT 66264 0.62 0 0.38 0 60698 1 0 0 0
WA 236052 0.8 0.01 0.2 0 275131 0.84 0 0.16 0
WI 368754 0.5 0 0.49 0 407307 0.58 0 0.42 0
WV 72228 0.87 0 0.09 0.03 70902 0.96 0 0.03 0.01
WY 25910 0.64 0.02 0.32 0.03 24148 0.62 0.01 0.34 0.02U.S. Total 18038085 15814790
U.S. Average 0.79 0 0.2 0.01 0.81 0 0.19 0
"Data Source: National Association of Insurance Commissioners, by permission. The NAIC does not endorse any analysis or conclusions based upon the use of its data."
Data from California is incomplete Cred: Credible. Credible firms have at least 1,000 member‐years. In 2012, "credible" status is defined by the aggregated member‐years over 2011 and 2012 for insurers with < 75,000 member‐years

35
Table 7: Entry and Exit of Insurers 2010‐2012
Comprehensive Individual Market
Small Group Market
Credible 2012
Not Credible
2012
Not Present 2012
Total Credible
2012
Not Credible
2012
Not Present 2012
Total
Present in 2010, Credible
Credible in 2011
437 0 18 455 470 0 35 505
Not Credible in 2011
37 11 9 57 21 12 12 45
Not Present in 2011
1 2 19 22 0 0 35 35
Total 475 13 46 534 491 12 82 585 Present in 2010, Not-Credible
Credible in 2011
32 0 2 34 24 0 0 24
Not Credible in 2011
51 815 291 1157 40 274 62 376
Not Present in 2011
0 41 495 536 0 7 93 100
Total 83 856 788 1727 64 281 155 500
Entered in 2011, Credible 11 8 19 38 12 0 1 13 Entered in 2011, Not-Credible
13 160 104 277 12 27 16 55
Entered in 2012 3 129 0 132 9 27 0 36
Credible firms have at least 1,000 member-years. In 2012, "credible" status is defined by the aggregated member-years over 2011 and 2012 for insurers with < 75,000 member-years

36
Figure 1: Herfindahl‐Hirschman Index (HHI) for the Individual Market, 2010
Figure 2: Herfindahl‐Hirschman Index (HHI) for the Individual Market, 2012

37
Figure 3: Herfindahl‐Hirschman Index (HHI) for the Small Group Market, 2010
Figure 4: Herfindahl‐Hirschman Index (HHI) for the Small Group Market, 2012

38
Figure 5: Premiums and Claims in the Individual Market, $ (inflated to 2012)
Note: All dollar amounts are inflated to 2012 dollars. Figure 6: Premiums and Claims in the Small group Market, $ (inflated to 2012)
All dollar amounts are inflated to 2012 dollars.
2010 2011 2012
Prem/Member Year 2786 2831 3124
Claims/Member Year 2154 2313 2735
0
500
1000
1500
2000
2500
3000
3500
2010 2011 2012
Prem/Member Year 4173 4240 4160
Claims/Member Year 3436 3479 3462
0
500
1000
1500
2000
2500
3000
3500
4000
4500

39
Figure 7: Distribution of Premiums, Individual Market
Note: Claims include spending for other clinical services, quality improvement activities and spending for detection of fraud
Figure 8: Distribution of Premiums, Small Group Market
Note: Claims include spending for other clinical services, quality improvement activities and spending for detection of fraud
2010 2011 2012
Margin 6 3 1
Admin 19 16 14
Claims 74 81 85
0
10
20
30
40
50
60
70
80
90
100%Premiums
2010 2011 2012
Margin 5 6 5
Admin 13 12 11
Claims 82 82 84
0
10
20
30
40
50
60
70
80
90
100
%Premiums

40
Table 8: Medical Loss Ratios, 2010‐2012, Fully Credible Insurers (at least 75,000 member years)
Individual Market Small Group Market
2010 2011 2012 2010 2011 2012
Unique Number of Insurers 27 30 28 56 57 53
Number of Insurer‐State Obs. 28 31 28 64 64 57
Percent Met MLR Threshold (%) 46 77 89 73 80 88
MLR
Mean 80.39 83.64 85.38 83.56 83.34 84.88
(95% CI) (76.76 ‐ 84.03)
(81.59 ‐ 85.69)
(83.21‐87.54)
(82.06 ‐ 85.05)
(82.22 ‐ 84.47)
(83.70 ‐ 86.06)
Median 79.3 81.8 83.55 82.7 83.25 83.7

41
Table 9: Medical Loss Ratios, 2010‐2012, Partially Credible Insurers (at least 1,000 member years, but
less than 75,000 member years)
Individual Market Small Group Market
2010 2011 2012 2010 2011 2012
Unique Number of Insurers 184 178 169 274 256 244
Number of Insurer‐State Obs. 506 492 409 520 477 437
Percent Met MLR Threshold (%)
No adjustment 34 46 60 58 61 68 2012 adjusted for aggregation 34 46 51 58 61 67 adjusted for size credibility + 2012 adjusted for aggregation 41 55 61 70 75 76
MLR
No adjustment Mean 74.06 79.91 85.39 81.49 82.48 84.14
95% CI (72.17 ‐ 75.96)
(78.06 ‐ 81.77)
(83.55 ‐ 87.24)
(80.28 ‐ 82.69)
(80.99 ‐ 83.97)
(83.02 ‐ 85.26)
Median 71.5 78 82.6 81.9 82 83.3
2012 adjusted for aggregation Mean 74.06 79.91 83.82 81.49 82.48 83.24
95% CI (72.17 ‐ 75.96)
(78.06 ‐ 81.77)
(82.09 ‐ 85.54)
(80.28 ‐ 82.69)
(80.99 ‐ 83.97)
(82.34 ‐ 84.15)
Median 71.5 78 80.32 81.9 82 82.55
adjusted for size credibility, and 2012 adjusted for aggregation Mean 78.43 84.35 86.68 85.18 86.06 85.58
95% CI (76.54 ‐ 80.33)
(82.50 ‐ 86.20)
(84.93 ‐ 88.43)
(83.98 ‐ 86.38)
(84.58 ‐ 87.55)
(84.66 ‐ 86.49)
Median 75.39 81.68 82.58 84.76 85.23 84.69

42
REFERENCES Abraham JM, DeLeire T, Royalty AB. Access to health insurance at small establishments: What can we learn from analyzing other fringe benefits? Inquiry 2009;46(3):253-273. Abraham JM, Karaca-Mandic P. Regulating the medical loss ratio: Implications for the individual market. American Journal of Managed Care 2011;17(3):211-224. Abraham JM, Karaca-Mandic P. The performance of private health insurers in the commercial market. In: T. Culyer, ed., Encyclopedia of Health Economics, eds. Tony Culyer, Waltham, MA: Elsevier. Forthcoming, 2013. Abraham JM, Karaca-Mandic P, Boudreaux M. Sizing up the individual market for health insurance: A comparison of survey and administrative data sources. Medical Care Research and Review 2013; 70(4):418-433. Abraham JM, Karaca-Mandic P, Simon K. How has the Affordable Care Act’s medical loss ratio regulation affected insurer behavior? Minneapolis, MN: University of Minnesota Working Paper, 2013. Buchmueller, T., and J. DiNardo. Did Community Rating Induce an Adverse Selection Death Spiral? Evidence From New York, Pennsylvania, and Connecticut, American Economic Review, 2002, 92(1): 280-294. Cantor JC, Monheit AC, Brownlee S, Schneider C. The adequacy of household survey data for evaluating the nongroup health insurance market. Health Services Research 2007;42(4):1739-1757. Congressional Budget Office. Updated estimates for the insurance coverage provisions of the affordable care act. Washington, DC: CBO, March 2012. Cox C, Claxton G, Levitt L. Beyond rebates: How much are consumers saving from the ACA’s medical loss ratio provision? Kaiser Family Foundation, June 6, 2013. Available at: http://kff.org/health-reform/perspective/beyond-rebates-how-much-are-consumers-saving-from-the-acas-medical-loss-ratio-provision/ Davidoff, A., L. Blumberg, and L. Nichols. State Health Insurance Market Reforms and Access to Insurance for High-Risk Employees, Journal of Health Economics,2005, 24: 725-750. Department of Health and Human Services. Health insurance issuers implementing medical loss ratio (MLR) requirements under the Patient Protection and Affordable Care Act. Federal Register 2010;75(230):74864-74934. Available at: http://www.gpo.gov/fdsys/pkg/FR-2010-12-01/pdf/2010-29596.pdf. (Accessed September 30, 2013.) Government Accountability Office. Private health insurance: Early indicators show that most insurers would have met or exceeded new medical loss ratio standards. GAO-12-90R, October 31, 2011. Available at: http://www.gao.gov/products/GAO-12-90R. (Accessed September 30, 2013.) Hall MA, McCue MJ. Estimating the impact of the medical loss ratio rule: A state-by-state analysis. New York, NY: The Commonwealth Fund, April 2012. http://kff.org/health-reform/perspective/beyond-rebates-how-much-are-consumers-saving-from-the-acas-medical-loss-ratio-provision/. (Accessed September 30, 2013.)

43
Kaiser Family Foundation. Rate review: Spotlight on state efforts to make health insurance more affordable. Executive Summary. December 2010. Available at: http://kaiserfamilyfoundation.files.wordpress.com/2013/01/8122.pdf. (Accessed October 1, 2013.) Karaca-Mandic P, Abraham J. Using data from the National Association of Insurance Commissioners for health reform evaluation. State Health Reform Assistance Issue Brief. Princeton, NJ: The Robert Wood Johnson Foundation, July 2013 Karaca-Mandic P, Abraham J, Phelps C. How do health insurance loading fees vary by group size?: Implications for healthcare reform. International Journal of Health Care Finance and Economics 2011;11(3):181-207. Karaca-Mandic P, Abraham J, Simon K. Is the medical loss ratio a good target measure for regulation in the individual market for health insurance? Health Economics. Forthcoming 2013. Karaca-Mandic P, Feldman R, Graven P. The role of agents and brokers in the market for health insurance. Working Paper #19342. Cambridge, MA: National Bureau of Economic Research, 2013. Klerman JA, Davern M, Call KT, Lynch V, Ringel, J. Understanding the current population survey's insurance estimates and the Medicaid 'undercount'. Health Affairs 2009;28(6):w991-w1001. Mach A, O’Hara B. Do people really have multiple health insurance plans? Estimates of nongroup health insurance in the American community survey. SEHSD. Working Paper Number 2011-28, 2011. Available at: http://www.census.gov/hhes/www/hlthins/publications/Multiple_Coverage.pdf. (Accessed July 2011.) Marquis, M. S., and S. Long. Effects of “Second Generation” Small Group Health Insurance Market Reforms, 1993 to 1997, Inquiry, 2002, 38: 365-380. McCue MJ, Hall MA. Insurers' responses to regulation of medical loss ratios. New York, NY: The Commonwealth Fund, December 2012. McCue MJ, Hall M, Liu X. Impact of medical loss regulation on the financial performance of health insurers. Health Affairs 2013;32(9):1546-1551. Monheit A, Schone BS. How has small group market reform affected employee health insurance coverage? Journal of Public Economics 2004;88(1-2):237-254. Phelps, C. (2010). Health economics. Reading, MA: Addison-Wesley. Simon, K. Adverse Selection in Health Insurance Markets? Evidence From State Small-Group Health Insurance Reforms, Journal of Public Economics, 2005, 89: 1865-1877