going global - digital riverinfo.digitalriver.com/rs/digitalriver/images/digitalriver_go...
TRANSCRIPT

Sponsored by
GOING GLOBAL

HOWARD WESTSR. DIRECTOR GLOBAL STRATEGIES
2
• Strategic decision maker with a background in global supply chain automation.
• Collaborates with Branded Manufactures to define strategic goals for Global Online Solutions.
• Over 15 years of experience implementing direct to consumer online solutions for some of the world’s most recognized brands.

3
GLOBAL ECOMMERCE MARKET AND TRENDS
STRATEGIES FOR EXPANDING YOUR BUSINESS GLOBALLY
• Market Analysis
• Mobile and Social Trends related to eCommerce
• How do companies “Go Global” online.
• Beware of the Operational Hurdles
• Marketplace strategies

4
GLOBAL INTERNET TRAFFIC BY REGION
$383b $1053b
$1252b $2357b
Source: Cysco Visual Networking Index Forecast, 2011-2016
Asia Pacific40.6%
Western Europe 22.4%
North America20.0%
Latin America7.7%
Central & Eastern
Europe 5.6%
Middle East & Africa 3.6%

5
DOES THIS TRANSLATE INTO ONLINE BUYERS?

6
52%
57%
64%
33%
64%
34%
84%
62%
31%
57%
UnitedStates
UnitedKingdom
Germany Japan Brazil Russia China India SouthAfrica
Nigeria
Global Average(54%)
% who say the prefer to shop online
Source: A.T. Kearney, July 2014

7
ECOMMERCE SPENDING WORLDWIDE
Asia Pacific174%
Middle East & Africa90%
World Wide 88%
Latin America55%
$431b $660b
$312b $445b$49b $73b
$383b $1053b$27b $51b
$48b $75b
$1252b $2357b
North America53%
Western Europe43%
Central & Eastern Europe48%
Source: eMarketer, Jan 2014; A.T. Kearney

8
ECOMMERCE PURCHASES BY CATEGORY
Category Global Avg.UnitedStates
United Kingdom Germany Japan India Brazil Russia China
South Africa Nigeria
Electronics 77% 83% 84% 90% 53% 79% 86% 71% 96% 60% 65%
Fashion and Apparel 76% 87% 85% 88% 66% 84% 75% 64% 97% 47% 65%
Services 76% 80% 76% 77% 63% 82% 70% 63% 87% 79% 80%
Books 73% 82% 82% 80% 65% 70% 75% 52% 89% 64% 71%
Music & Games 64% 74% 75% 66% 64% 65% 62% 43% 69% 64% 57%
Tickets 63% 74% 69% 63% 43% 79% 65% 51% 71% 69% 47%
Home Appliances 59% 46% 65% 58% 41% 67% 70% 62% 83% 41% 52%
Beauty Products 57% 50% 56% 62% 48% 68% 59% 53% 85% 41% 45%
Home Furnishings 52% 56% 65% 66% 53% 59% 48% 43% 65% 34% 30%
Sports and Outdoor 51% 56% 53% 66% 36% 52% 49% 51% 78% 35% 35%
Toys, Kids, Babies 48% 48% 53% 49% 32% 61% 47% 44% 75% 38% 34%
Groceries 45% 26% 60% 36% 68% 52% 29% 31% 90% 31% 30%
Household Items 45% 36% 48% 40% 41% 60% 35% 36% 84% 31% 35%
>70% 45%-70% <45%
% of survey respondents that purchased from this category in the past 90 days.

9
ECOMMERCE SPENDING VS. TRAFFIC
Source: eMarketer, Jan 2014; A.T. Kearney
45%
28%
19%
3%
3%
2%
40%
20%
22%
8%
6%
4%
Asia Pacific
North America
Western Europe
Latin America
Central & Eastern Europe
Middle East & Africa
0% 10% 20% 30% 40% 50%
Traffic
Sales

10

11
WHERE DO I GO NEXT?

12
HOW DO I GET THERE?


14
GO TO MARKET – REVENUE VS DIFFICULTY
United States
Canada
GermanyUnited Kingdom
Australia
France
Netherlands
Italy
Sweden
China
South Korea
New Zealand IrelandSpain
Brazil
Russia
Japan2.8
Denmark
Belgium
Singapore
Finland
Hong Kong
Luxembourg
Austria
Taiwan
India
Poland
MalaysiaCzech Republic
Turkey
Chile
Mexico
Switzerland
Indonesia
Greece
ArgentinaSouth Africa
IsraelUnited Arab Emirates
PortugalHungary
Vietnam
Thailand
Bulgaria
Colombia
Saudi Arabia
PeruRomania
EgyptKenyaUkraine
Nigeria
Ease o
f Im
ple
menta
tion
Revenue Opportunity

15
STRATEGIES FOR EXPANDING YOUR BUSINESS GLOBALLY
• How do companies “Go Global” online.
• Beware of the Operational Hurdles
• Marketplace strategies
16
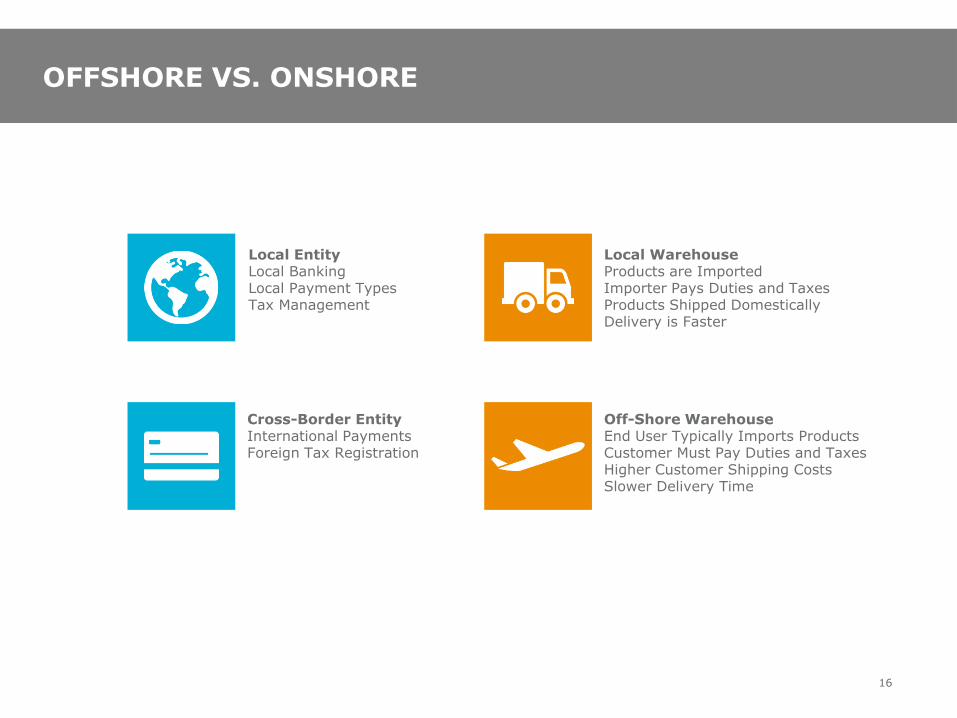
OFFSHORE VS. ONSHORE
Local EntityLocal BankingLocal Payment TypesTax Management
Cross-Border EntityInternational PaymentsForeign Tax Registration
Off-Shore WarehouseEnd User Typically Imports ProductsCustomer Must Pay Duties and Taxes Higher Customer Shipping CostsSlower Delivery Time
Local WarehouseProducts are ImportedImporter Pays Duties and TaxesProducts Shipped Domestically Delivery is Faster
OFFSHORE VS. ONSHORE

17
The Merchant of Record is the organization that is held financially liable by the acquiring bank (i.e., the financial institution that processes the customer's credit and/or debit card payments) for all full and partial returns to the customer's card as well as any chargebacks initiated by the customer.
The Seller of Record must be able to prove they have legal title of the product and is allowed to sell.
ISPs / Mailbox Providers
MERCHANT OF RECORD SELLER OF RECORD
Tax Collection & Remittance
Fraud Management &
Liability
Legal Entities
(in-country)
Security and Privacy
Banking Relationships
Compliance with all laws and regulations
UNDERSTANDING THE COMPLEXITIESOF COMMERCE GLOBALLY

18
INSTILLING KANDO THROUGH THE RIGHT EXPERIENCE
CRAWL / GOOD WALK / BETTER RUN / BEST
Cross-Border PaymentsInternational Credit CardPayPal
Off-Shore WarehouseCustomer is Importer of Record
LocalizationLanguageCurrency
LocalizationAddress Validation, Landed Costs of Duties & Taxes
LocalizationSite flow & Experience
LocalizationLanguageCurrency
Cross-Border PaymentsInternational Credit CardPayPal
Off-Shore WarehouseCustomer is Importer of Record
Local EntityLocal Credit CardsLocal Payment Types
Local WarehouseClient is Importer of Record
LocalizationLanguageCurrency
LocalizationSite flow & Experience
marketForceLocal Marketing expertise and services
HOW COMPANIES EXPAND GLOBALLY

CRAWL TO WALK
Fujisan JP
http://www.fujisan.co.jp/
Local Site, providing a
Japanese consumer with a
comfortable Japanese
experience.
19
Fujisan US
http://www.fujisan.com
Japanese site roughly
translated into English
Shipping from Japan to the
US.
FROM CRAWL TO WALK

CRAWL TO WALK
Rakutan JP
http://www.rakuten.co.jp/
Local Japanese Site
Japanese Specific marketing
20
Rakutan US
http://www.rakuten.com/
New US experience
Unique product marketing
Domestic Shipping
Complete US experience
RUNNING GLOBALLY

$1252b $2357b
84%
82%
60%
78%
81%
80%
100%
27%
48%
55%
33%
52%
44%
75%
26%
29%
38%
24%
35%
31%
58%
GLOBAL AVERAGE
ASIA PACIFIC
EUROPE
MID EAST/AFRICA
LATIN AMERICA
NORTH AMERICA
21
DEVICES USED FOR ONLINE SHOPPING
Source: Nielsen Global Survey of E-Commerce, Q1 2014
MOBILE DEVICE TABLETCOMPUTER

Branded manufacturers (manufacturers of branded products) are developing three sales channels that co-exist and each channel has its own unique strategy. They will continue to sell via traditional retailers and also on Rakutan or Amazon (marketplaces), but are increasingly adding emphasis to their direct-to-
consumer channel.
RETAIL
DIRECT-TO-CONSUMER
RAKUTAN-AMAZON
MULTIPLE SELLING CHANNELS CO-EXISTMULTIPLE SELLING CHANNELS CO-EXIST

GOING DIRECT VS. THROUGH A MARKETPLACE
23
Lower Price
HighService Level
LowService Level
Higher Price
Rakutan
Going Direct
JD.com
Tmall
Amazon
WORKING TOGETHER WITH MARKETPLACES

Forrester, February 2013 “The Marketing Case For A Branded Sales Channel ”
PwC research found that more than a third of consumers globally have purchased products directly from branded manufacturers. Forrester research reports that a third of consumers are interested in
buying directly from branded manufacturers for the reasons listed below:
Sources: PWC, Demystifying the online shopper 10 myths of multichannel retailing, January 2013:
UNIQUE SELECTION
Manufacturers are able to provide their full product range and increasingly value-added services or special SKUs
BRAND LOYALTY
Consumers want to buy direct
when they love the brand
WARRANTIES
Consumers believe they can
get better warranties and
guarantees from manufacturers
COUNTERFEIT PRODUCTS
Marketplaces often have knock-
off products mixed with
brands due to inventory co-
mingling
UNIQUE BUNDLES
Since manufacturers
control the assortment, they can offer unique
bundles and bundle pricing
AND/OR
KNOWLEDGE
Consumers believe manufacturers
know their products best and will provide better advice and support
WHY WILL COMSUMERS BUY FROM MANUFACTURES DIRECTLY INSTEAD OF RAKUTEN, AMAZON OR ALIBABA?

25

APPENDIX
26

MARKETING STRATEGIES
27

28
29

MARKET OVERVIEW
Online Activity
Total Population: 1,394 mln
Online Population: 670 mln
2014- 48% of Total Pop 2019- 60% of Total
Pop
Online buyers 365.3 mln
2014- 55% of online pop 2019- 72% of Total
Pop
Online Retail Revenue (excl travel sales)
2014- $439 bln 2019- RMB 1,088 bln
Market Trends & Insights
Top Category: Apparel. 43% growth
Motivation: Price (87%), Variety (76%),
Convenience (75%)
Frequency: 44% buy online weekly
Compliance: Vendor need to register local entity
and sales license for Online business
30
CHINA
$184
$149
$123
$117
$107
$85
$74
$67
$54
APPAREL
MEDIA
BEAUTY
FOOTWEAR
CE
IT & SOFTWARE
APPLIANCES
HOMEWARE
GROCERY
Online Sales by Category2014 Gross Revenue, USD Billions

MARKET OVERVIEW
Online Activity
Total Population: 1.3 bln
Online Population: 425 mln (32% of total pop)
Online Buyers: 63 mln (15% of online
population)
Online Retail Revenue (excl travel sales):
2016- $16 bln 2019- $ 30.9 bln
Online Retail via Mobile:
2016- $6.2 bln 2019- $19.1 bln
Market Trends & Insights
Business Model: Indian-owned entity must act
as ROR
Payment Methods: Low credit card penetration.
COD
Mobile is hot! Devices are primary access to
Internet. 81 mln smartphone sold in 2014
Logistics is next wave of investment.
31
INDIA
$10.1
$7.1
$5.1
$1.8
$1.7
$1.3
$0.4
$0.6
$3.1
CE
IT & SOFTWARE
APPAREL & FOOTWEAR
BEAUTY
MEDIA
HOMEWARE
APPLIANCES
GROCERY
OTHER
Online Sales by Category2019 Gross Revenue, USD Billions

MARKET OVERVIEW
Online Activity
Total Population:127 mln
Online population: 103 mln (81% of total pop)
Online Buyers: 73 mln (71% of online pop)
Online Retail Revenue (excl travel sales):
2014- $54 bln 2019- $86 bln
Market Trends & Insights
Leading Category: Apparel & Footwear. 43%
growth
Motivation: Price (87%), Variety (76%),
Convenience (75%)
Frequency: 44% buy online weekly
Compliance: Vendor need to register local entity
and sales license for Online business.
32
JAPAN
$9.1
$9.6
$10.1
$10.3
$10.4
$10.8
$15.2
$17.8
$22.4
IT & SOFTWARE
BEAUTY
OTHER
APPLIANCES
MEDIA
GROCERY
CE
HOMEWARE & FURNITURE
APPAREL & FOOTWEAR
Online Sales by Category2019 Gross Revenue, USD Billions

MARKET OVERVIEW
Online Activity
Total Population: 50 mln
Online Population: 42 mln (87% of total pop)
Online Buyers: 29 mln (70% of online pop)
Online Retail Revenue (excl travel sales)
2014- $21 bln 2019- $36 bln
Market Trends & Insights
Tech savvy with preference for luxury brands
Highest credit card penetration
Motivation: Avoid high imported product prices
Parcel forwarded used to avoid shipping charges
.
33
KOREA
$7.4
$6.2
$4.7
$4.4
$3.9
$2.8
$2.6
$2.1
APPAREL & FOOTWEAR
GROCERY
CE
IT & SOFTWARE
OTHER
BEAUTY
MEDIA
APPLIANCES
Online Sales by Category2019 Gross Revenue, USD Billions

MARKET OVERVIEW
Online Activity
Total Population: 23.4 mln (2013)
Online Population: 18.7 mln (2014, 80% of total
pop)
Online buyers 5.3 mln (30% of online pop, 2014)
Online Retail Revenue (excl travel sales): $33 bln
(2015)
Market Trends & Insights
125% mobile distribution. 25 mln 3G subscribers.
Growth mainly fuelled by m-commerce- 40% of
shoppers purchase from smartphones.
Omni channel- 30% of online stores in local
marketplaces have a physical store.
Shoppers very price sensitive.
34
TAIWAN
Online Sales by Category2014 Gross Revenue, USD Billions
$4.5
$3.5
$3.1
$0.8
$5.2
Apparel & Footwear
CE, IT & Software
Beauty
Media
Other