goes: current (10/12/11/n/o/p) to future...
TRANSCRIPT

GOES: Current (10/12/11/N/O/P) to Future (GOES-R+)
Timothy J. Schmit
NOAA/NESDIS/STAR
Advanced Satellite Products Branch (ASPP)
Madison, WI
and many others
UW-Madison
STAR SeminarMarch 17th, 2006

Many others to be acknowledged…
Tom Wrublewski Fred PrataSteve Kirkner Jim GurkaMat Gunshor Roger HeymannScott Bachmeier Rick KohrsEd Miller Wayne FeltzMike Weinreb Jaime DanielsSandy Ashton Eric ChipmanFred Wu SSEC Data CenterTim Walsh Tony WimmersDon Hillger ….Tony SchreinerGOES-N,O,P BookletJun LiPaul Menzel

and...
Achtor, Tom; Ackerman, Steve; Antonelli, Paolo; Aune, Bob; Bachmeier, Scott; Baggett, Kevin; Baum, Bryan; Flanagan, Dan; Ellrod, Gary; Feltz, Joleen; Feltz, Wayne; Frey, Rich; Griffin, Michael K.; Gumley, Liam; Gunshor, Mat; Gurka, James J.; Hillger, Don; Huang, Allen; Key, Jeff; Knuteson, Bob; Karnauskas, Kristopher; Li, Jun; Mecikalski, John; Menzel, Paul; Moeller, Chris; Mosher, Fred; Nelson, James; Nasiri, Shaima; Olander, Tim; Plokhenko, Youri; Prins, Elaine; Purdom, Jim; Rabin, Bob; Revercomb, Hank; Schmidt, Chris; Schreiner, Tony; Seemann-Wetzel, Suzanne; Sieglaff, Justin; Strabala, Kathy; Sun, Fengying; Tobin, Dave; Uhlenbrock, Nate; Velden, Chris; Wade, Gary; Whittaker, Tom; and Woolf, Hal, Heymann, Roger, …
Topics
GOES-12/11/10
GOES-NGOES-O/P
GOES-R+ABIHESData CompressionGUC-IVetc.
GIFTS
More information

Current GOES

A GOES (Geostationary Operational Environmental Satellite) Incident Report (GIR) was submitted.
GOES-12 Imager 4 um band just before eclipse
From D. Han
Imager Cloud-top pressure product affected…Due to the 4um data being affected…
These space looks showed large standard deviations.
During several space looks…

GOES-11• The current plan is for GOES-11 to come
out of storage in mid-June of 2006 and replace GOES-10 approximately on the 20th of July, 2006.
• Plan to transmit GVAR during the move to 135 West

Sample from GOES-11 view from 105 West

GOES-11 During PLT in 2000

GOES-10 at 60 West
Imager – 15 minute scans? Sounder – hourly scans?
Late 2006 or early 2007

GOES-10 at 60W
• Need to deal with a Large inclination– via on-ground remapping– Will be GVAR changes (to be announced)

GOES-10 Patch TemperatureOn March 10, 2006 (DOY 69), SOCC Engineers
changed the GOES-10 Sounder patch temperature from its MID setpoint (100.1 K) to its MID setpoint (92.5 K) at about 8:22 z (3:22 ET). The change was done during keep out zone time and prior to eclipse to minimize the impact on users. The temperature transition will take approximately 4 hours. The users may see slight data degradation (venetian blinding) in the first few frame after the eclipse (11:01:50 CONUS) until the patch
temperature stabilizes at its new setpoint. The signal to noise ratio will improve as a result of operation at a
lower patch (detector) temperature. The patch will be controlled at this temperature (92.5 K)until October 2006 when it will be switched back to MID setting during the
autumn eclipse/KOZ season.
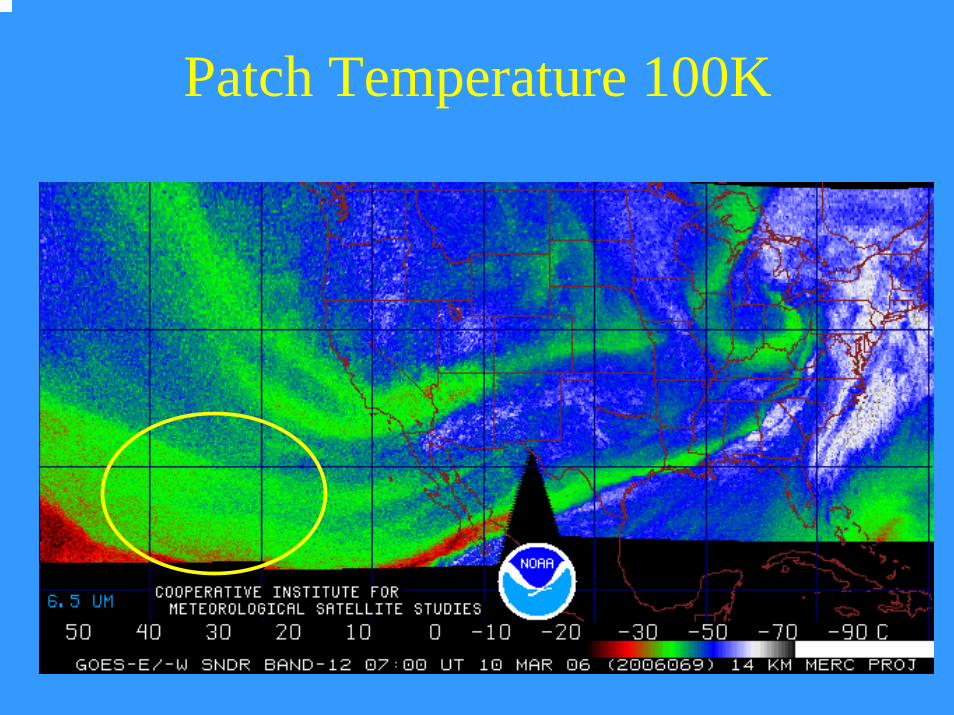
Patch Temperature 100K
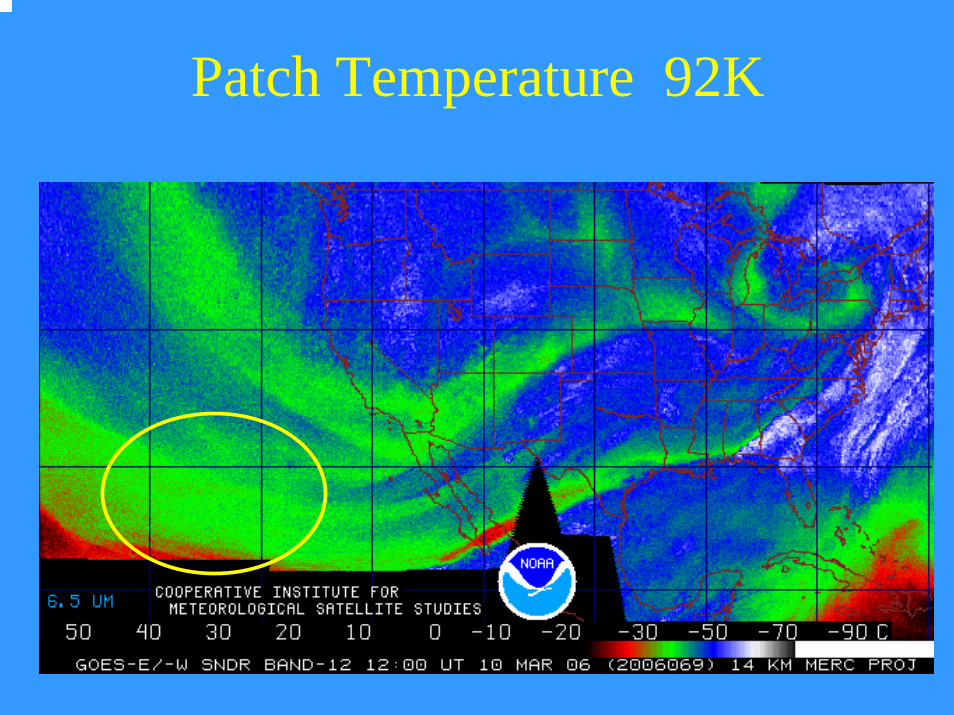
Patch Temperature 92K
Near-term GOES

Star Trackers
GOES-N Spacecraft

GOES-N Spacecraft
Images from NASA

GOES Schedules
• GOES-N is slated to be launched no earlier than early May 2006 and operational in mid-2008. GOES-N will be called GOES-13 when it reaches geostationary orbit.
• GOES-O is slated to be launched in 2007 and operational in late 2009.

GOES-8/12
GOES-N/PPosition of the boom allows for colder detectors and hence less instrument noise
GOES-N/O/P will have similar instruments to GOES-8-12, but will be on a different spacecraft bus. The new bus will allow improvements both to the navigation and registration, as well as the radiometrics.

Limitations of Current GOES Imagers
–Regional/Hemispheric scan conflicts–Low spatial resolution–Missing spectral bands–Eclipse and related outages
GOES-R (2012+) addresses the first 3 limitations, but GOES-N addresses the data
outage issues!

0100 UTC0100 UTC 0200 UTC0200 UTC 0300 UTC0300 UTC
0400 UTC0400 UTC 0500 UTC0500 UTC 0600 UTC0600 UTC
0700 UTC0700 UTC 0800 UTC0800 UTC 0900 UTC0900 UTC
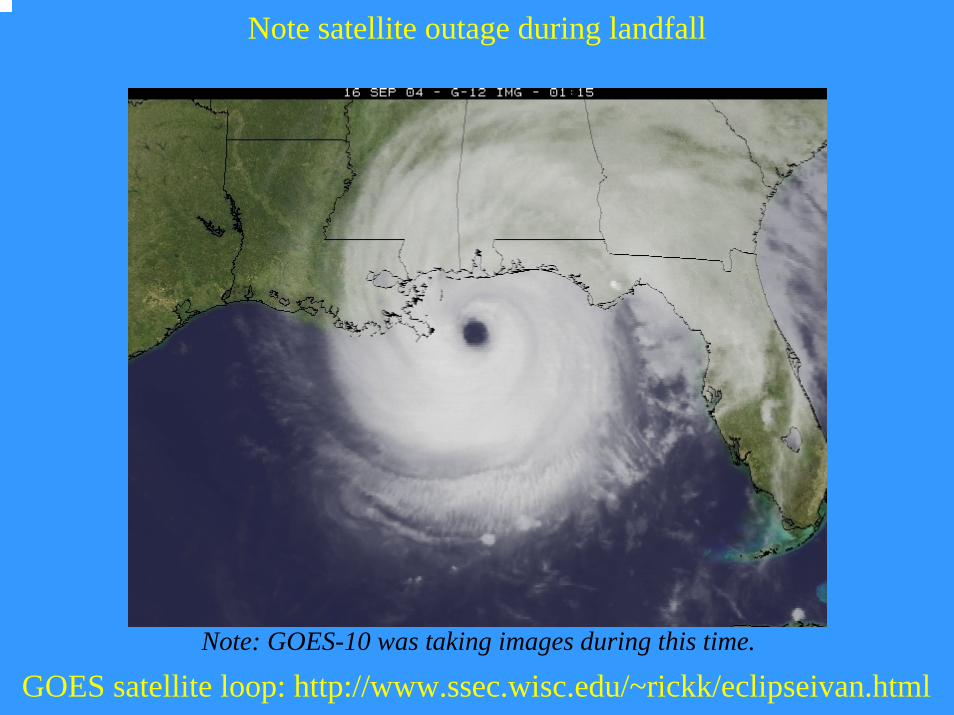
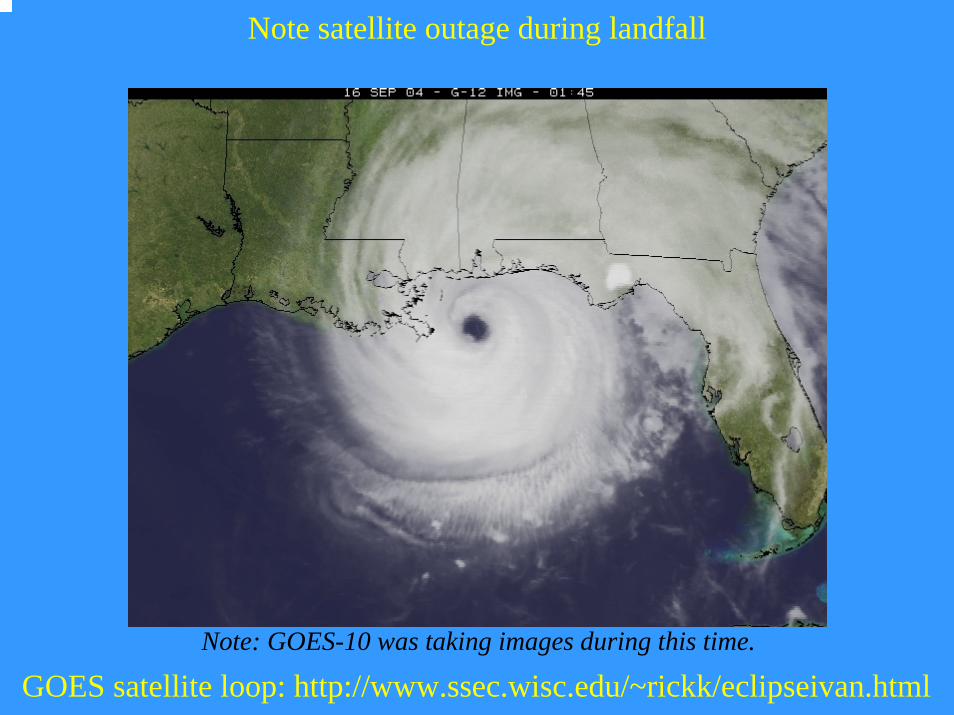
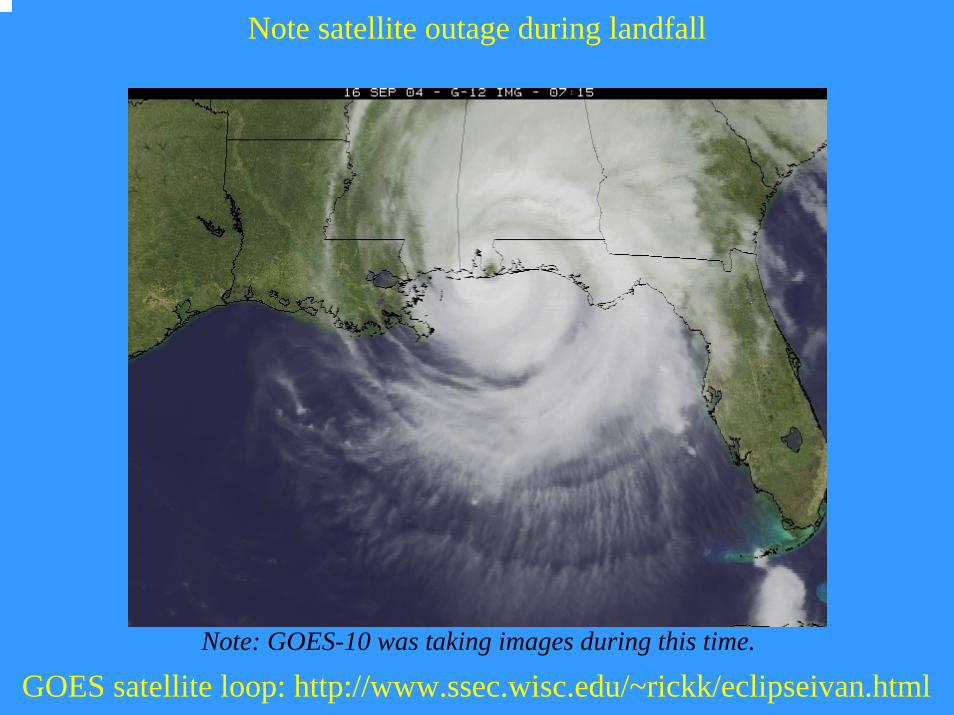
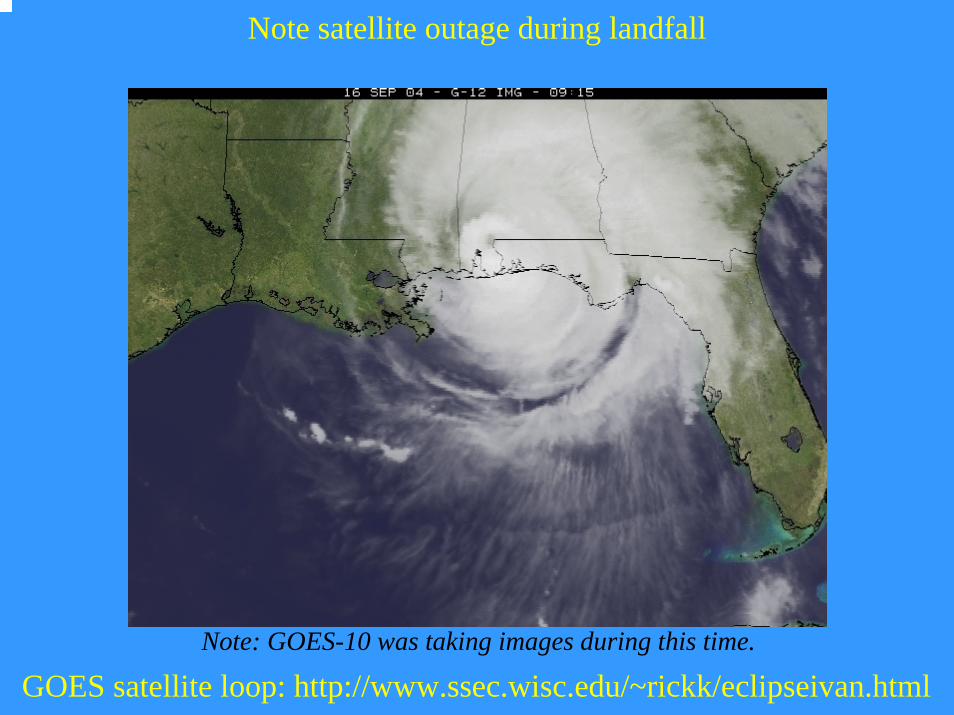
The Onset Of Hurricane Ivan: 16 September 2004
GOES-10 & -12 Sounder Cloud Top Pressure Coverage
Outage during landfall
GOES satellite loop: http://www.ssec.wisc.edu/~rickk/eclipseivan.html
Note satellite outage during landfall
Note: GOES-10 was taking images during this time.
GOES satellite loop: http://www.ssec.wisc.edu/~rickk/eclipseivan.html
Note satellite outage during landfall
Note: GOES-10 was taking images during this time.

GOES satellite loop: http://www.ssec.wisc.edu/~rickk/eclipseivan.html
Note satellite outage during landfall
Note: GOES-10 was taking images during this time.
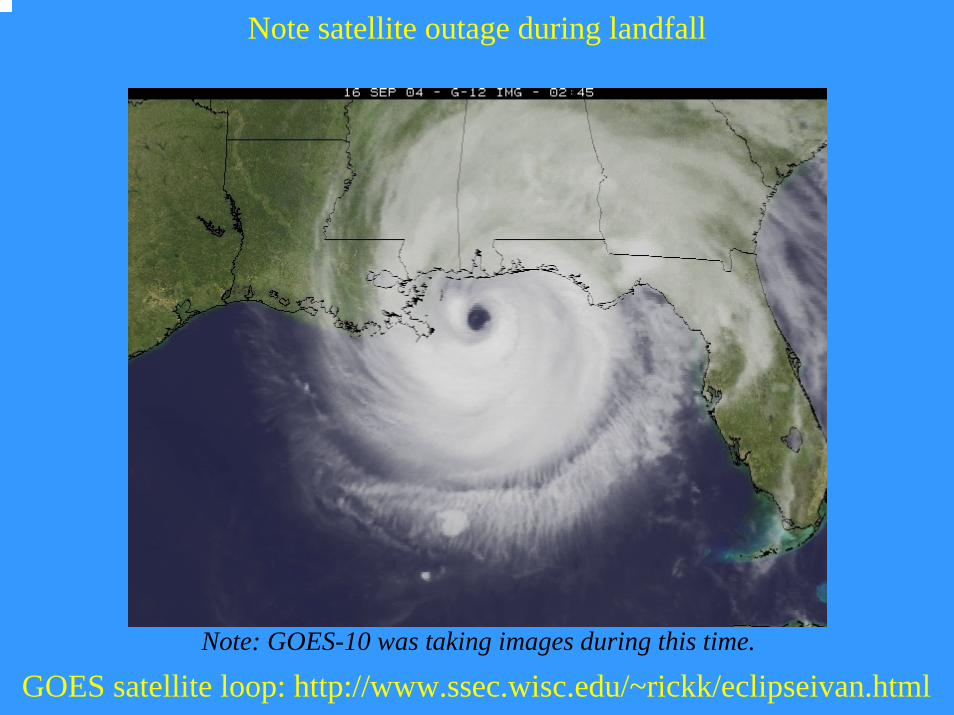
GOES satellite loop: http://www.ssec.wisc.edu/~rickk/eclipseivan.html
Note satellite outage during landfall
Note: GOES-10 was taking images during this time.

GOES satellite loop: http://www.ssec.wisc.edu/~rickk/eclipseivan.html
Note satellite outage during landfall
Note: GOES-10 was taking images during this time.

GOES satellite loop: http://www.ssec.wisc.edu/~rickk/eclipseivan.html
Note satellite outage during landfall
Note: GOES-10 was taking images during this time.

GOES satellite loop: http://www.ssec.wisc.edu/~rickk/eclipseivan.html
Note satellite outage during landfall
Note: GOES-10 was taking images during this time.
GOES satellite loop: http://www.ssec.wisc.edu/~rickk/eclipseivan.html
Note satellite outage during landfall
Note: GOES-10 was taking images during this time.

GOES satellite loop: http://www.ssec.wisc.edu/~rickk/eclipseivan.html
Note satellite outage during landfall
Note: GOES-10 was taking images during this time.

GOES satellite loop: http://www.ssec.wisc.edu/~rickk/eclipseivan.html
Note satellite outage during landfall
Note: GOES-10 was taking images during this time.

GOES satellite loop: http://www.ssec.wisc.edu/~rickk/eclipseivan.html
Note satellite outage during landfall
Note: GOES-10 was taking images during this time.
GOES satellite loop: http://www.ssec.wisc.edu/~rickk/eclipseivan.html
Note satellite outage during landfall
Note: GOES-10 was taking images during this time.
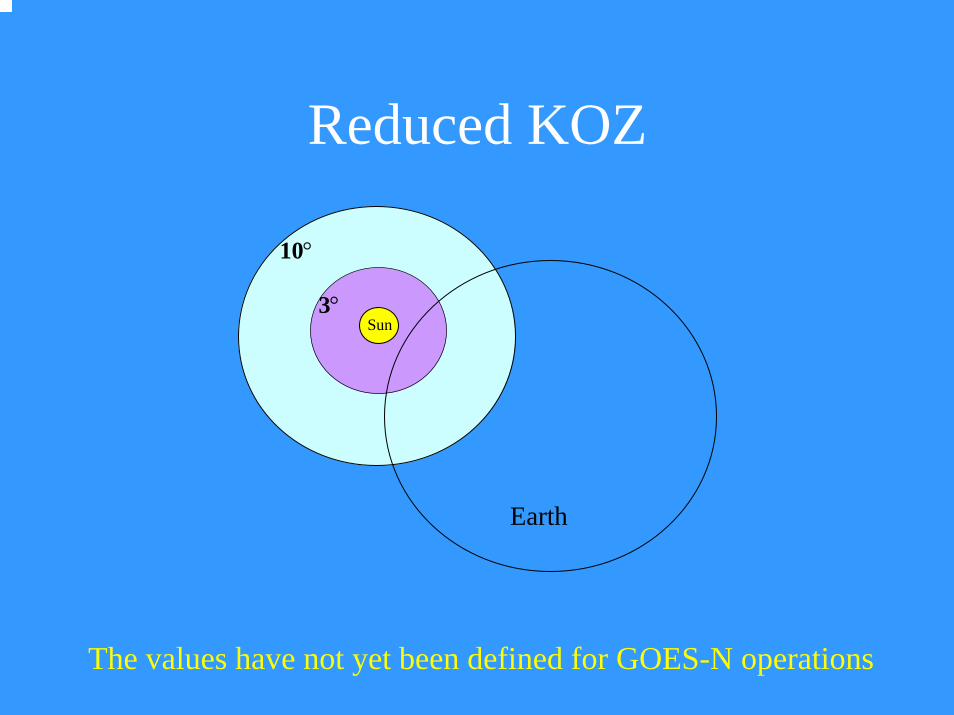
Reduced KOZ
The values have not yet been defined for GOES-N operations
Earth
10°
3°Sun
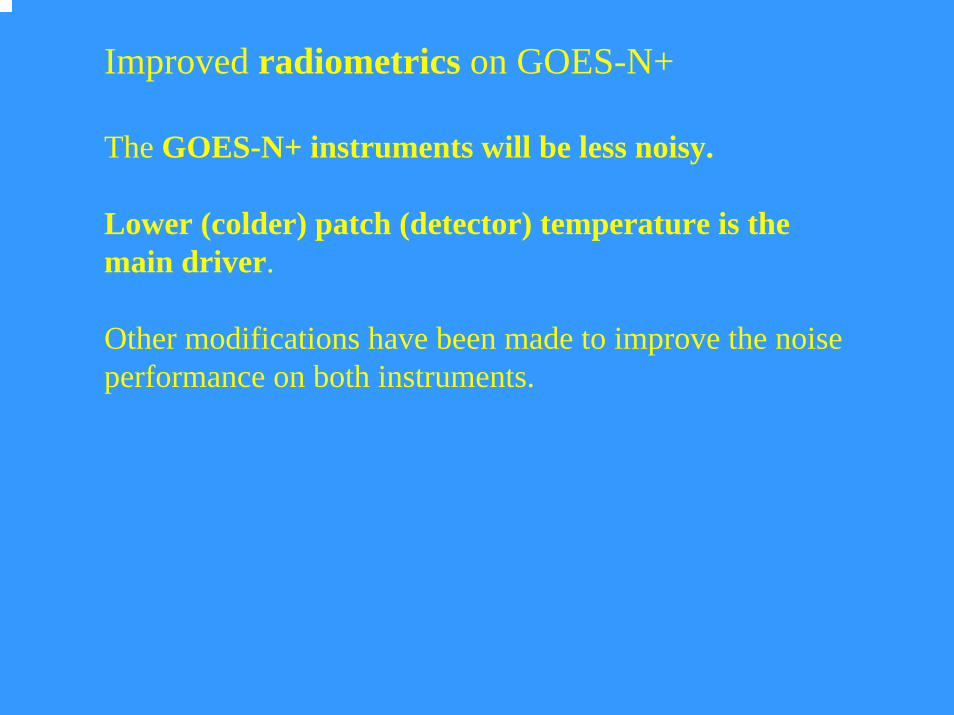
Improved radiometrics on GOES-N+
The GOES-N+ instruments will be less noisy.
Lower (colder) patch (detector) temperature is the main driver.
Other modifications have been made to improve the noise performance on both instruments.

Improved GOES-N (Sounder) noise compared to GOES-12
longwave shortwave
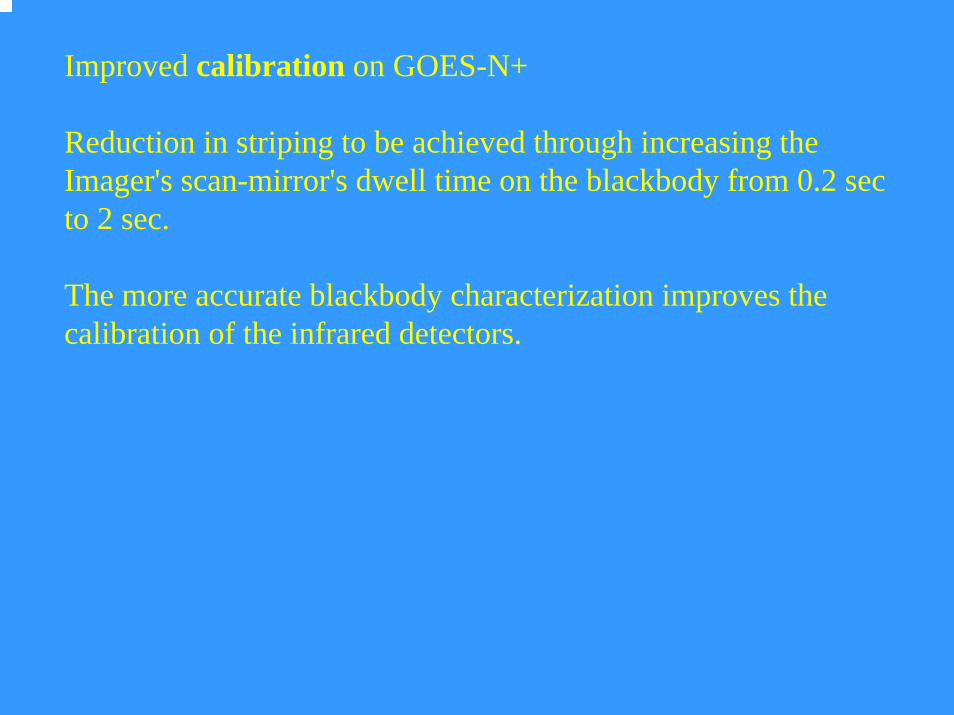
Improved calibration on GOES-N+
Reduction in striping to be achieved through increasing the Imager's scan-mirror's dwell time on the blackbody from 0.2 sec to 2 sec.
The more accurate blackbody characterization improves the calibration of the infrared detectors.
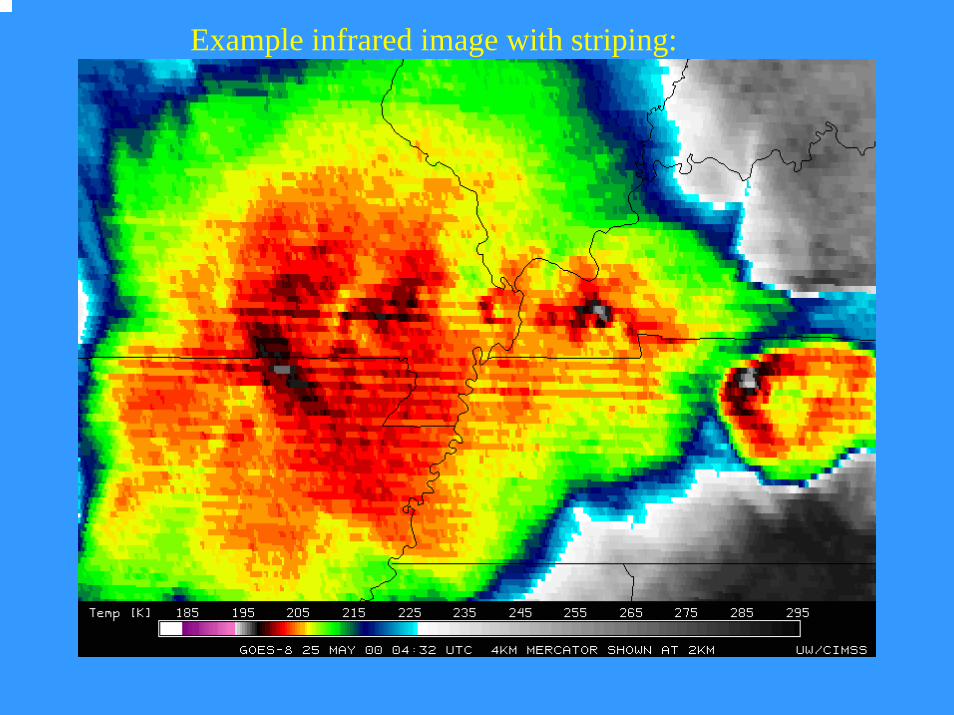
Example infrared image with striping:

Improved navigation on GOES-N+• The GOES-N navigation will be improved
• New spacecraft bus • Use of star trackers
• GOES-N performance will be verified on-orbit
GOES-I/M Performance & GOES-N Expected Performance
85 urad(~3 km)
168 urad= 6 km
Nighttime(IR)
53 urad(<2 km)
112 urad= 4 km
Daytime(Visible)
GOES-N+GOES-I/MNavigationat Nadir
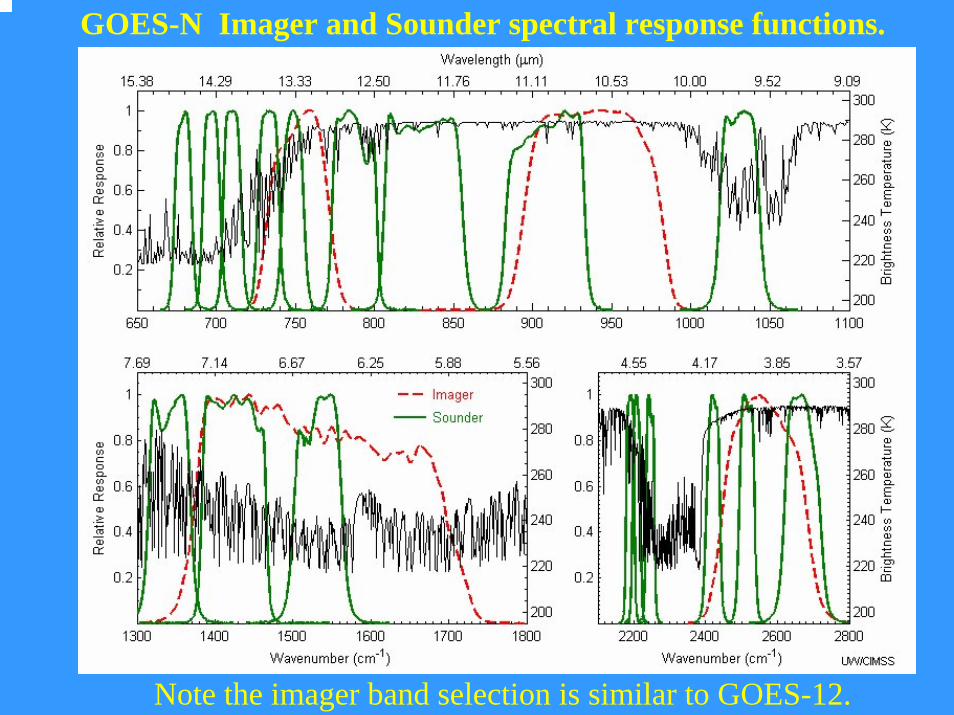
GOES-N Imager and Sounder spectral response functions.
Note the imager band selection is similar to GOES-12.

GOES-12 Imager and Sounder spectral response functions.
Note the imager band selection is similar to GOES-12.

GOES-N Imager Weighting Functions
CIMSS
Pres
sure

GOES-12 Imager Weighting Functions
CIMSS
Pres
sure

GOES-N Sounder Weighting FunctionsPr
essu
re

GOES-12 Sounder Weighting FunctionsPr
essu
re
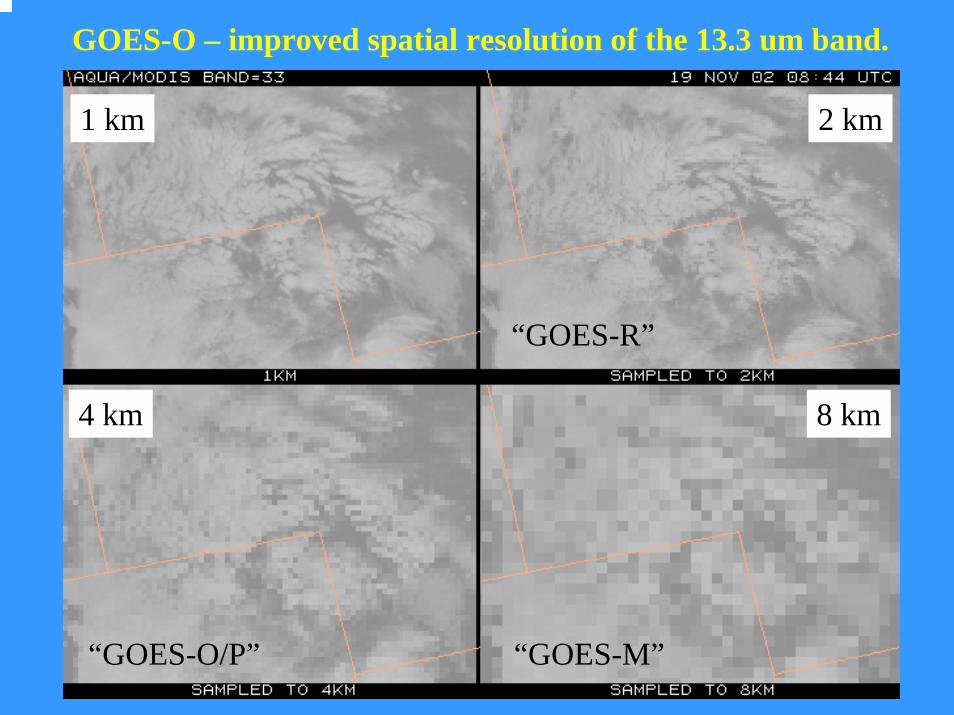
GOES-O – improved spatial resolution of the 13.3 um band.
4 km
1 km
8 km
2 km
“GOES-O/P” “GOES-M”
“GOES-R”

Future GOES

GOES R Baseline Instruments GOES R Baseline Instruments • Advanced Baseline Imager (ABI)• Hyperspectral Environmental Suite (HES)
– Disk Sounding– Severe Weather Mesoscale– Coastal Waters
• Geostationary Lightning Mapper (GLM)• Solar Instrument Suite (SIS)• Space Environment In Situ Suite (SEISS)• Auxiliary Services

Advanced Baseline Imager (ABI)• ITT Industries has been selected to build the
ABIs• Completed a successful System Preliminary
Design Review (December 2005)
Full Disk with stepped-edge

The Advanced Baseline Imager:
ABI Current
Spectral Coverage16 bands 5 bands
Spatial resolution 0.64 µm Visible 0.5 km Approx. 1 kmOther Visible/near-IR 1.0 km n/aBands (>2 µm) 2 km Approx. 4 km
Spatial coverageFull disk 4 per hour Every 3 hoursCONUS 12 per hour ~4 per hourMesoscale Every 30 sec n/a
Visible (reflective bands) On-orbit calibration Yes No
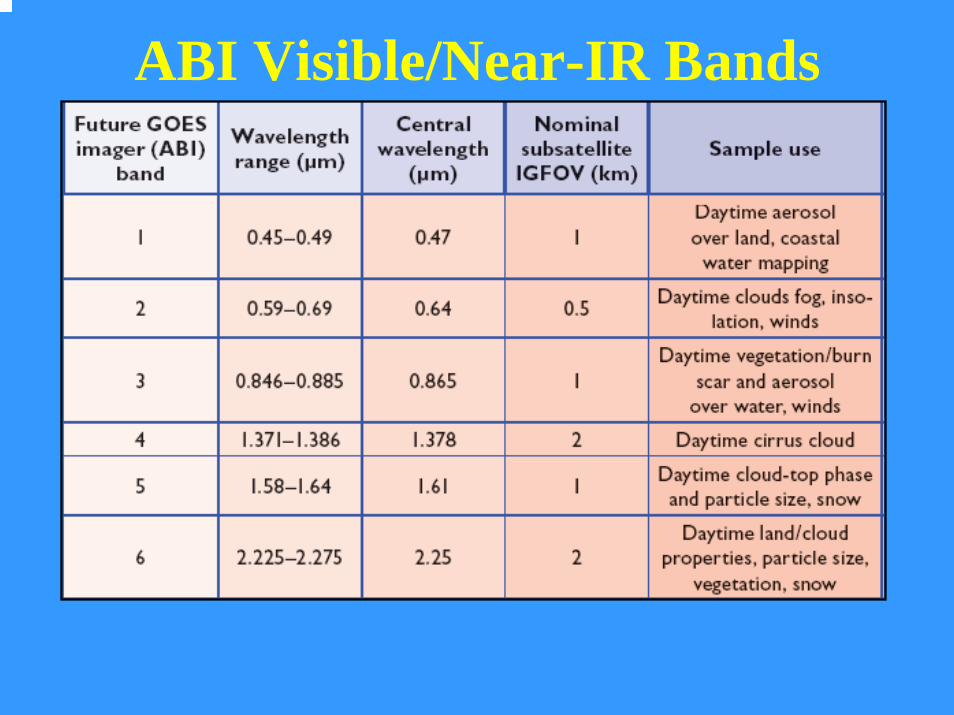
ABI Visible/Near-IR Bands

ABI IR Bands

The ABI visible and near-IR bands have many uses.
Visible and near-IR channels on the ABI
HazeClou
ds
Veg.
Cirrus
Part. si
ze
Snow, P
hase

While there are differences, there are also many similarities for the spectral bands on MET-8 and the Advanced Baseline Imager (ABI). Both the MET-8 and ABI have many more bands than the current operational imagers.

Simulating 5-minute full-disk IR imagery
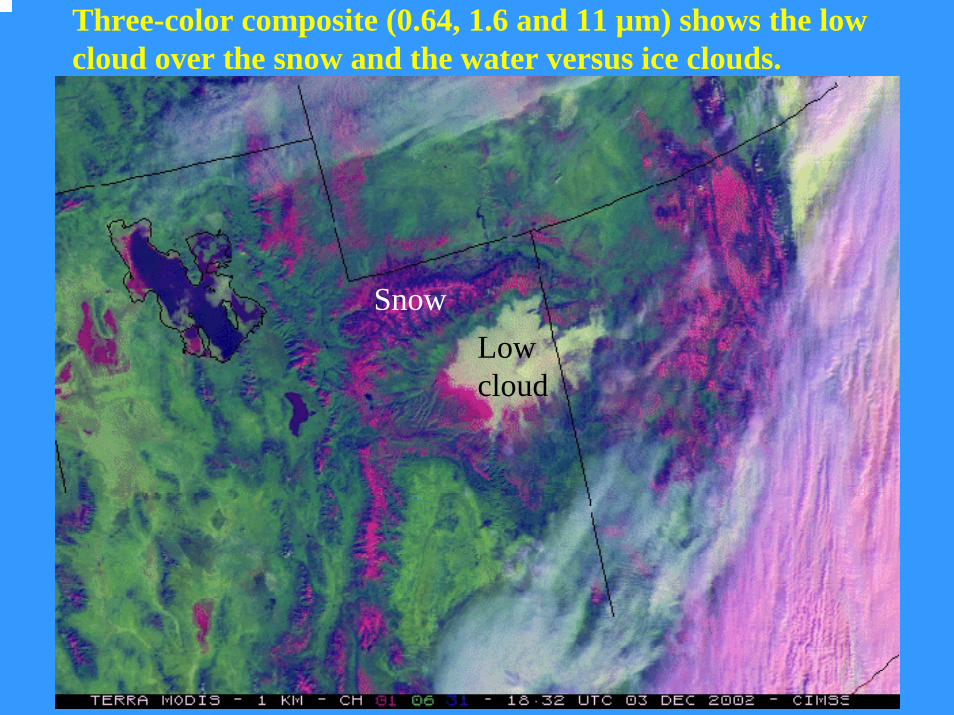
Three-color composite (0.64, 1.6 and 11 µm) shows the low cloud over the snow and the water versus ice clouds.
Low cloud
Snow

Simulated ABI (11-12 µm)
One day after the Mt. Cleveland eruption20 February 2001, 8:45 UTC
Volcanic Ash Plume: 11-12 and 8.5-11 µm images
UW/CIMSS
Simulated ABI (8.5-11 µm)

GOES-R ABI will detect SO2 plumesWater Vapor Band Difference convolved from AIRS data
sees SO2 plume from Montserrat Island, West Indies
Current GOES Imager can not detect SO2
Current G
OES Imager
No skill in monitoring
ABI 7.34 µm – 13.3 µm
SO2 Plume

GOES-R Simulated 3.9 micron DataPadua/Grand Prix FiresDate: 27-Oct-03 Time: 09:50 UTC
GOES-12 Simulated 3.9 micron DataPadua/Grand Prix FiresDate: 27-Oct-03 Time: 09:50 UTC
Brightness Temperature (K)
GOESGOES--R and GOESR and GOES--I/M I/M Simulations of Southern California FiresSimulations of Southern California Fires
1212

Simulated ABI
Mountain Waves in WV channel (6.7 µm) 7 April 2000, 1815 UTC
Actual GOES-8
Mountain waves over Colorado and New Mexico were induced by strong northwesterly flow associated with a pair of upper-tropospheric jet streaks moving
across the elevated terrain of the southern and central Rocky Mountains. The mountain waves appear more well-defined over Colorado; in fact, several aircraft
reported moderate to severe turbulence over that region.
UW/CIMSSBoth images are shown in GOES projection.

“ABI”
GOES

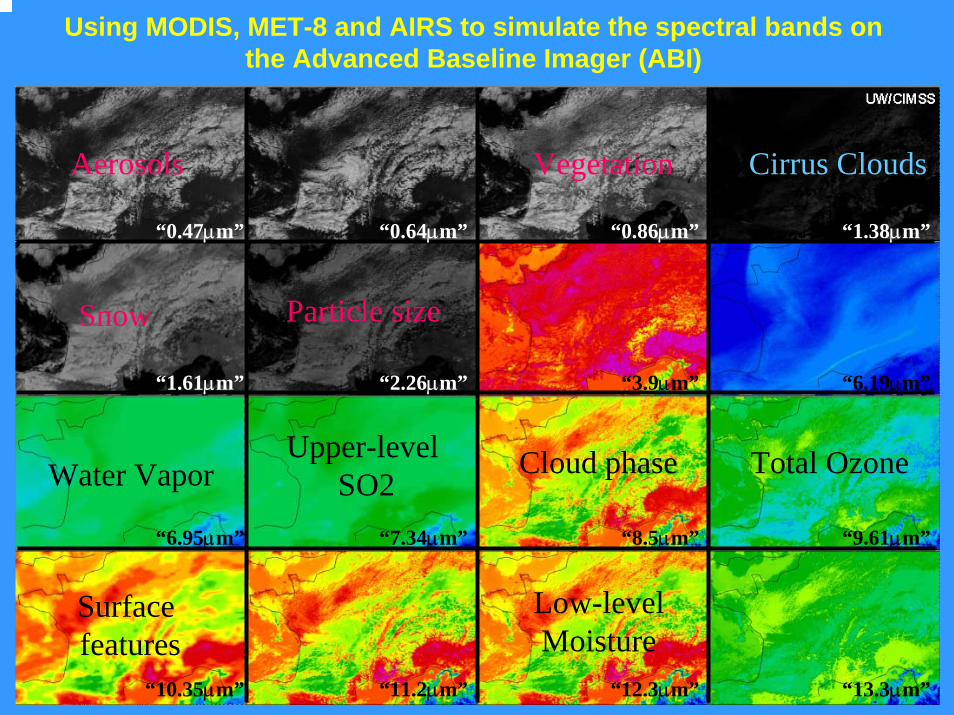
Using MODIS, MET-8 and AIRS to simulate the spectral bands on the Advanced Baseline Imager (ABI)
“0.64µm” “0.86µm” “1.38µm”
“1.61µm” “2.26µm” “3.9µm” “6.19µm”
“6.95µm” “7.34µm”
“0.47µm”
“8.5µm” “9.61µm”
“10.35µm” “11.2µm” “12.3µm” “13.3µm”

Similar bands on the GOES-12 Imager
“0.64µm” “0.86µm” “1.38µm”
“1.61µm” “2.26µm” “3.9µm” “6.19µm”
“6.95µm” “7.34µm”
“0.47µm”
“8.5µm” “9.61µm”
“10.35µm” “11.2µm” “12.3µm” “13.3µm”
Using MODIS, MET-8 and AIRS to simulate the spectral bands on the Advanced Baseline Imager (ABI)
“0.64µm” “0.86µm” “1.38µm”
“1.61µm” “2.26µm” “3.9µm” “6.19µm”
“6.95µm” “7.34µm”
“0.47µm”
“8.5µm” “9.61µm”
“10.35µm” “11.2µm” “12.3µm” “13.3µm”
Aerosols Vegetation Cirrus Clouds
Snow Particle size
Water VaporUpper-level
SO2Cloud phase Total Ozone
Low-levelMoisture
Surfacefeatures
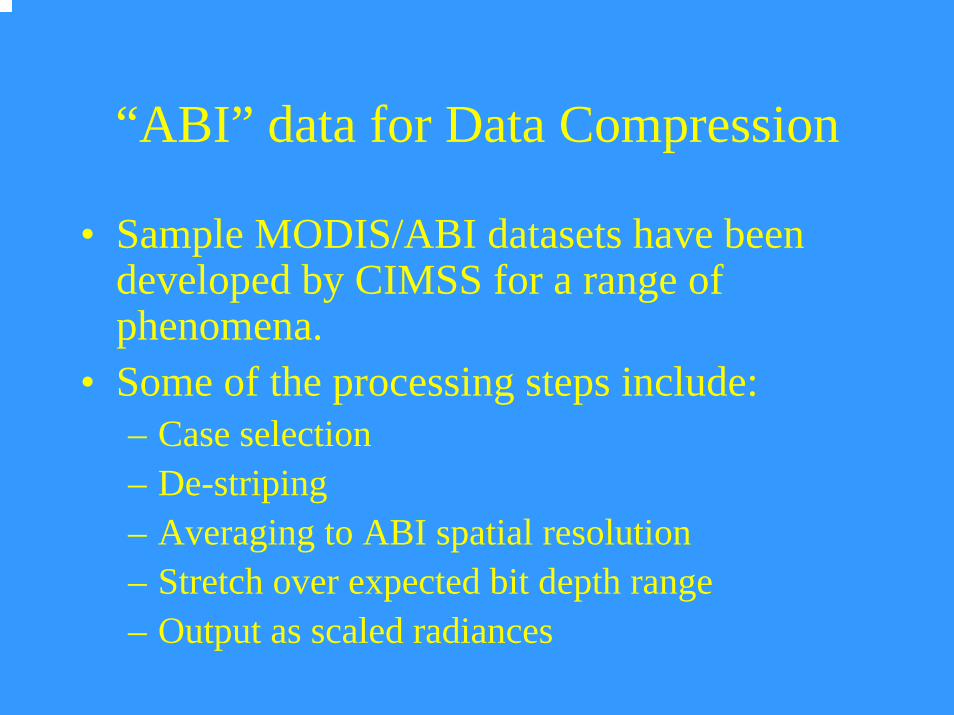
“ABI” data for Data Compression
• Sample MODIS/ABI datasets have been developed by CIMSS for a range of phenomena.
• Some of the processing steps include:– Case selection– De-striping– Averaging to ABI spatial resolution– Stretch over expected bit depth range– Output as scaled radiances


There are two anticipated scan modes for the ABI:- Full disk images every 15 minutes + CONUS images every 5 minutes + mesoscale. or - Full disk every 5 minutes.
Current GOES scans 5 times slowerthan the ABI

ABI can offer Continental US images every 5 minutes for routine monitoring of a wide range of events (storms, dust, volcanoes, fires, hurricanes, etc).
This is only every 15 or 30 minutes with the current GOES the routine mode.

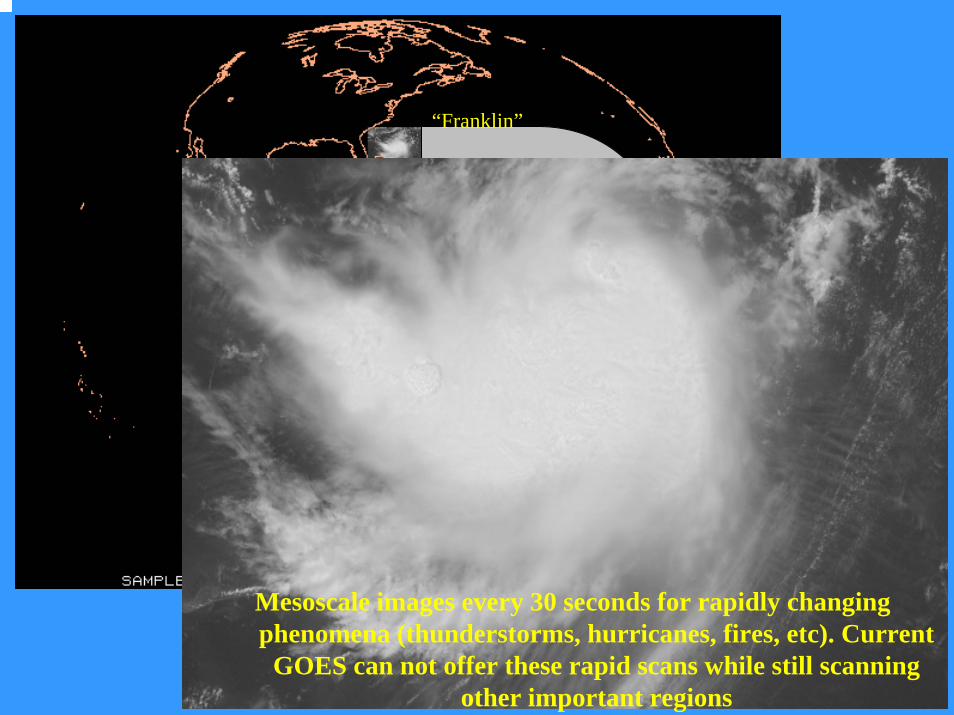
Mesoscale images every 30 seconds for rapidly changing phenomena (thunderstorms, hurricanes, fires, etc). Current
GOES can not offer these rapid scans while still scanning other important regions
“Franklin”

GOES-West view from 135

GOES-West view from 138

Fixed Grid Format • The distributed, calibrated and navigationally corrected
image data will be rectified [re-grid] to a fixed grid. The grid is defined relative to an ideal geostationary satellite viewpoint centered and fixed above the equator. The image pixels will have an angular separation in both the East/West and North/South directions of:– 14 microradians (0.5 km) in the 0.64 micron channel, – 28 microradians (1 km) in the 0.47, 0.86 and 1.61 um channel, – 56 microradians (2 km) in all other channels.

HES• The Hyperspectral Environmental Suite (HES)
will be located on a geostationary platform. – Late 2012– NOAA operational– Currently in formulation phase
• Two modes– Full Disk (10km)– Severe Weather/Mesoscale (4km)
• HES is an outgrowth of earlier ABS efforts– HES includes the functionality of the old Advanced
Baseline Sounder (ABS)

Current GOES, GIFTS and possible HES spectral coverage
GIFTSGIFTS
HES___ HES__________ HES_____
Spectral coverage details are not yet fully defined.

Guess CIMSS Physical
Guess CIMSS Physical
Inversion

Targeted observations -- look where we need the information
UW/NOAA
HES
Time (UTC)
ABI HES-Sounder
HES-CW
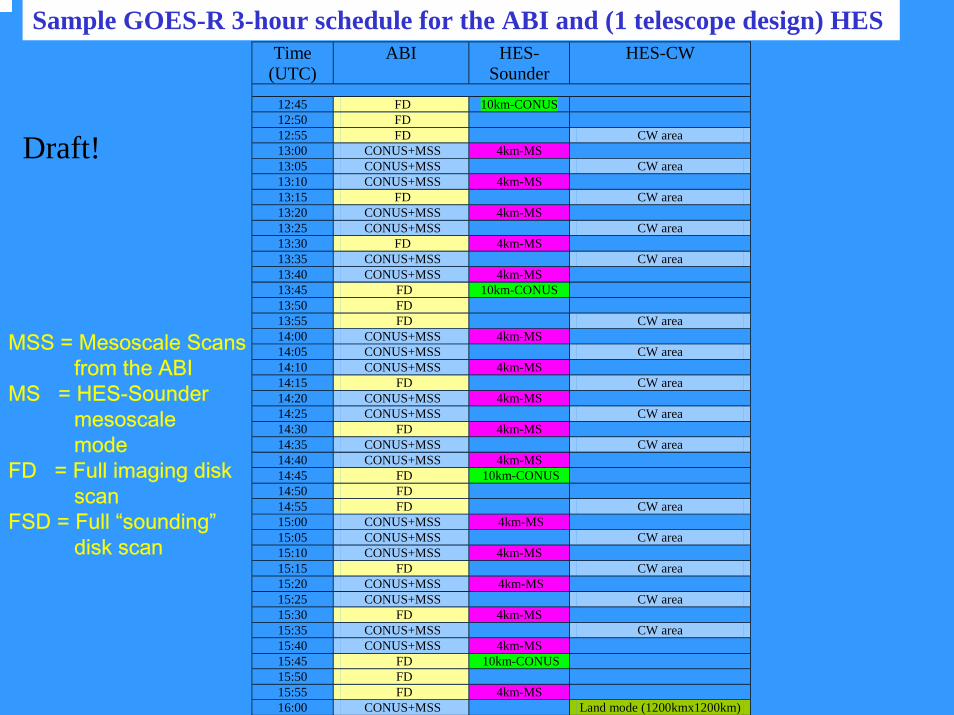
12:45 FD 10km-CONUS 12:50 FD 12:55 FD CW area 13:00 CONUS+MSS 4km-MS 13:05 CONUS+MSS CW area 13:10 CONUS+MSS 4km-MS 13:15 FD CW area 13:20 CONUS+MSS 4km-MS 13:25 CONUS+MSS CW area 13:30 FD 4km-MS 13:35 CONUS+MSS CW area 13:40 CONUS+MSS 4km-MS 13:45 FD 10km-CONUS 13:50 FD 13:55 FD CW area 14:00 CONUS+MSS 4km-MS 14:05 CONUS+MSS CW area 14:10 CONUS+MSS 4km-MS 14:15 FD CW area 14:20 CONUS+MSS 4km-MS 14:25 CONUS+MSS CW area 14:30 FD 4km-MS 14:35 CONUS+MSS CW area 14:40 CONUS+MSS 4km-MS 14:45 FD 10km-CONUS 14:50 FD 14:55 FD CW area 15:00 CONUS+MSS 4km-MS 15:05 CONUS+MSS CW area 15:10 CONUS+MSS 4km-MS 15:15 FD CW area 15:20 CONUS+MSS 4km-MS 15:25 CONUS+MSS CW area 15:30 FD 4km-MS 15:35 CONUS+MSS CW area 15:40 CONUS+MSS 4km-MS 15:45 FD 10km-CONUS 15:50 FD 15:55 FD 4km-MS 16:00 CONUS+MSS Land mode (1200kmx1200km)
Sample GOES-R 3-hour schedule for the ABI and (1 telescope design) HES
MSS = Mesoscale Scans from the ABI
MS = HES-Sounder mesoscale mode
FD = Full imaging disk scan
FSD = Full “sounding”disk scan
Draft!

• Visible image to show the cloud cover (GOES-East Example).• What follows is a HES example coverage loop.
Visible image example

HES-Sounding simulation at 10 km
20:45 UTC
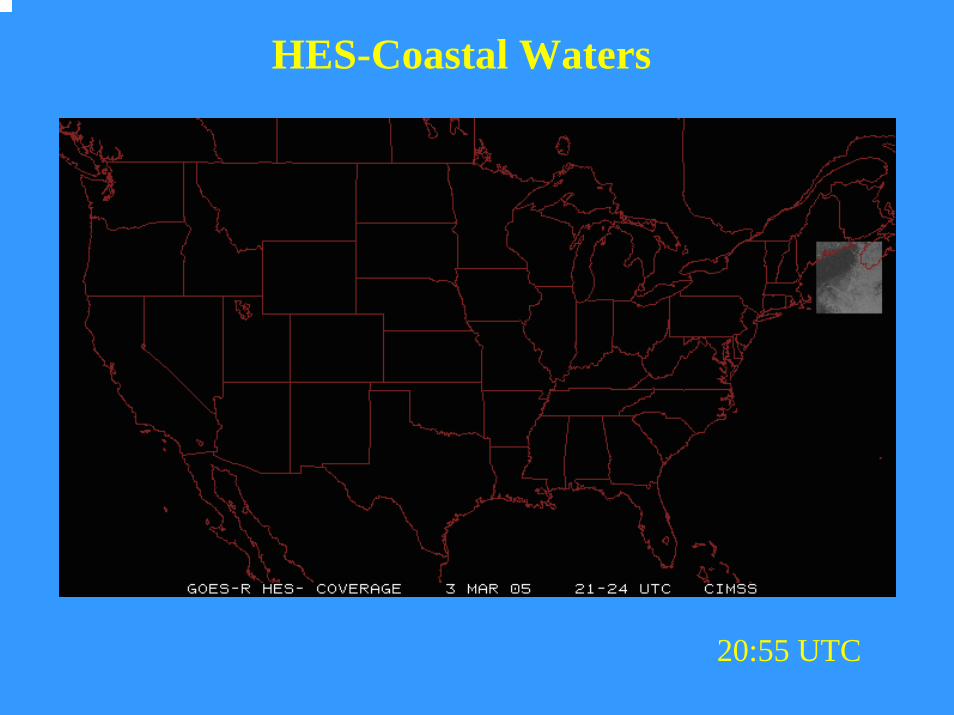
HES-Coastal Waters
20:55 UTC

21:00 UTC
HES-Sounding at 4 km

21:05 UTC
HES-Coastal Waters
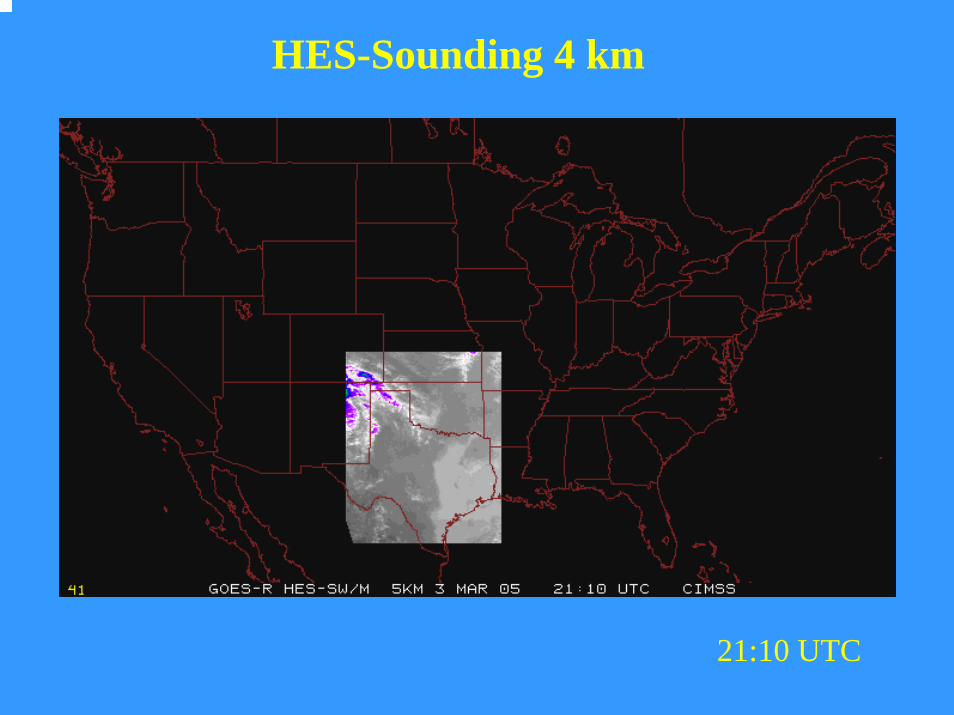
21:10 UTC
HES-Sounding 4 km
21:15 UTC
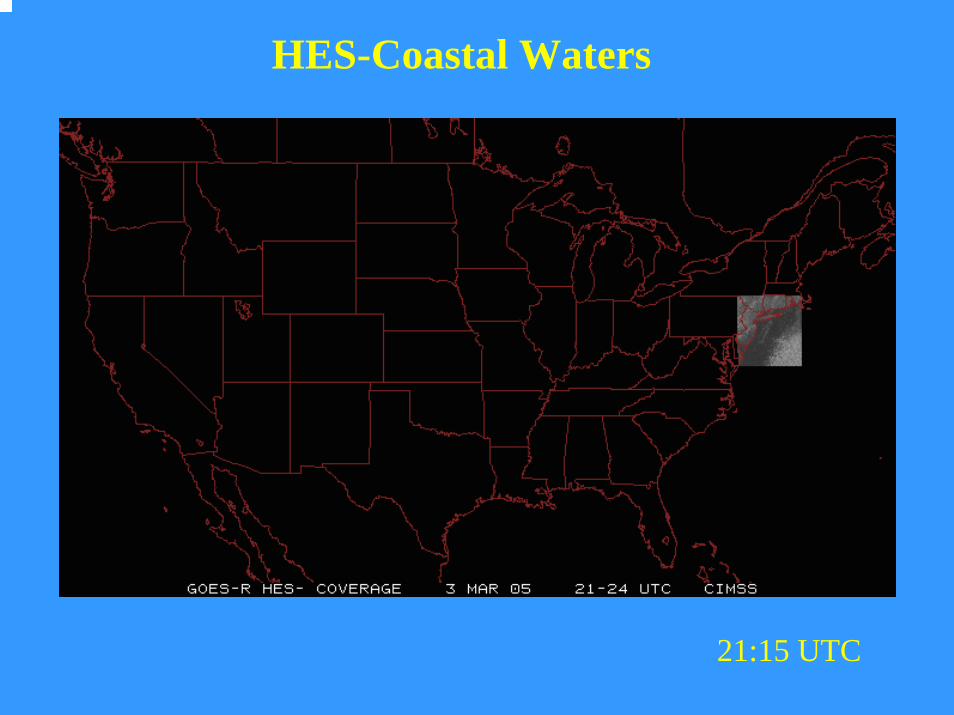
HES-Coastal Waters
21:20 UTC
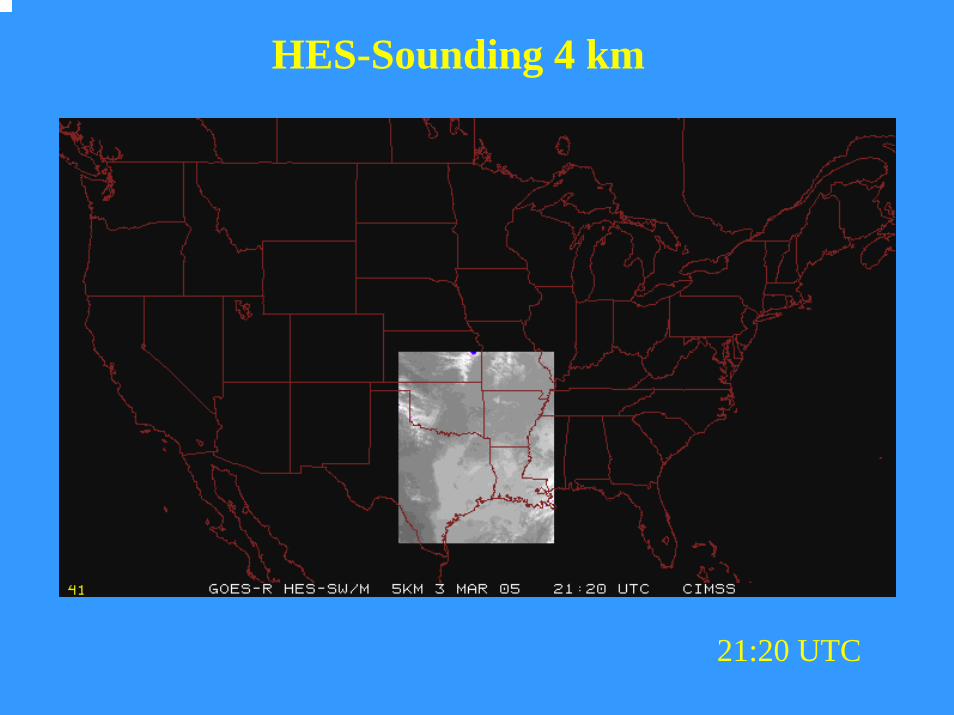
HES-Sounding 4 km
21:25 UTC
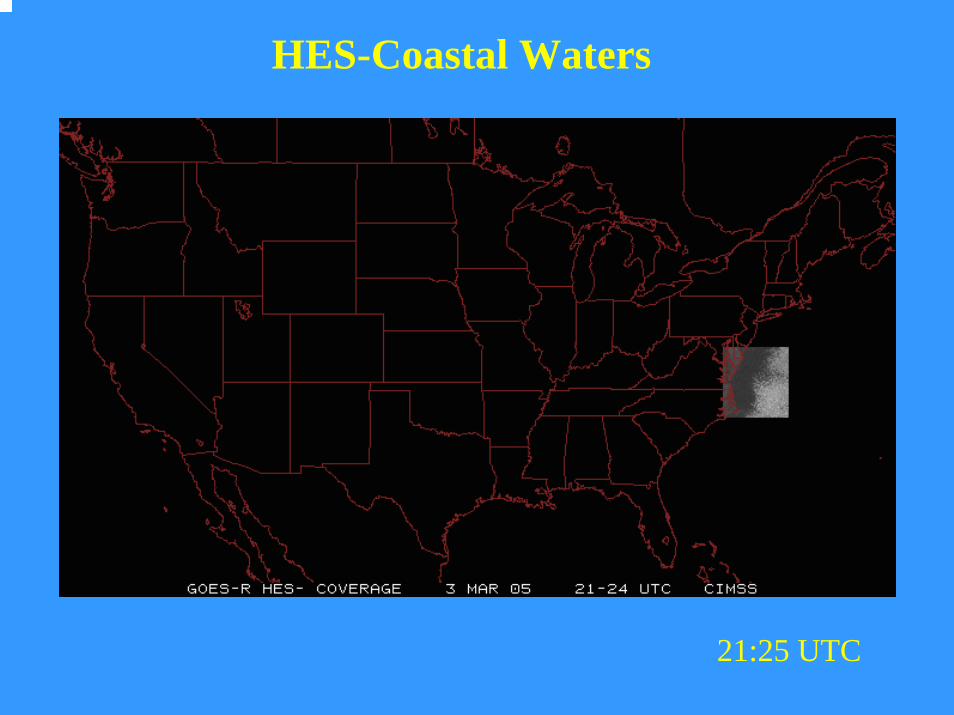
HES-Coastal Waters

21:30 UTC
HES-Sounding 4 km

21:35 UTC
HES-Coastal Waters

21:40 UTC
HES-Sounding 4 km

21:45 UTC
HES-Sounding 10 km

21:55 UTC
HES-Coastal Waters

22:00 UTC
HES-Sounding 4 km

22:05 UTC
HES-Coastal Waters

22:10 UTC
HES-Sounding 4 km

22:15 UTC
HES-Coastal Waters

22:20 UTC
HES-Sounding 4 km

22:25 UTC
HES-Coastal Waters

22:30 UTC
HES-Sounding 4 km

22:35 UTC
HES-Coastal Waters
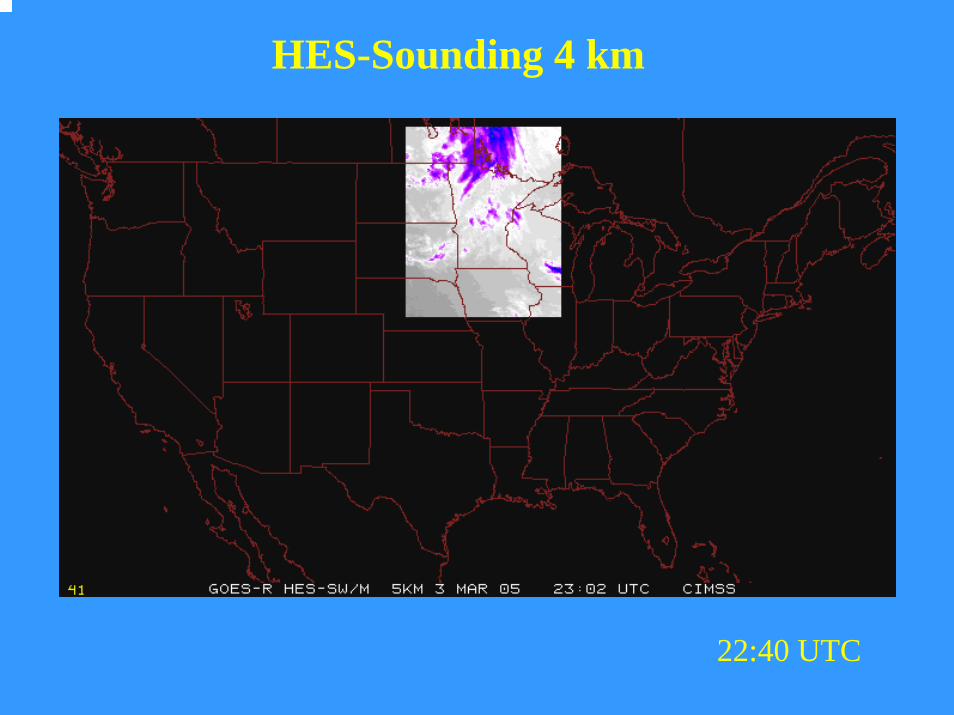
22:40 UTC
HES-Sounding 4 km
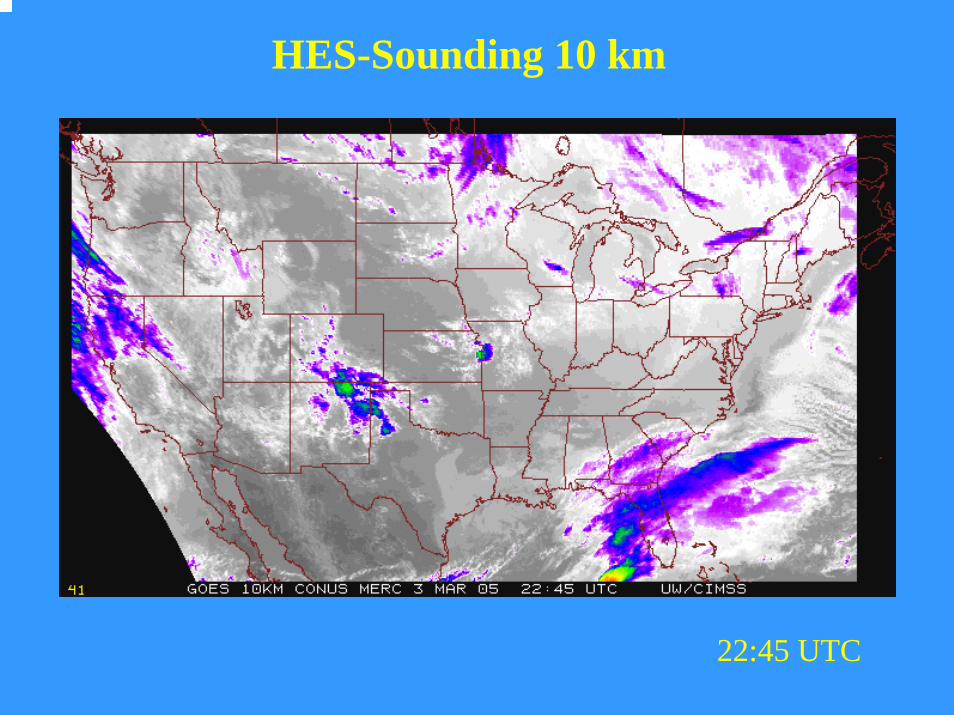
22:45 UTC
HES-Sounding 10 km
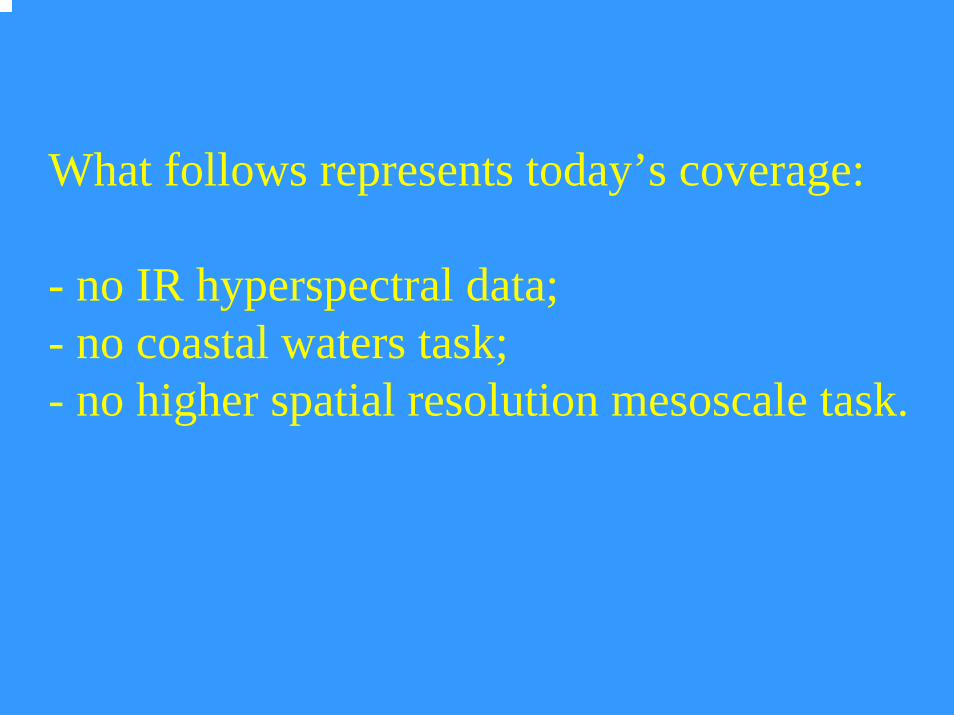
What follows represents today’s coverage:
- no IR hyperspectral data; - no coastal waters task;- no higher spatial resolution mesoscale task.
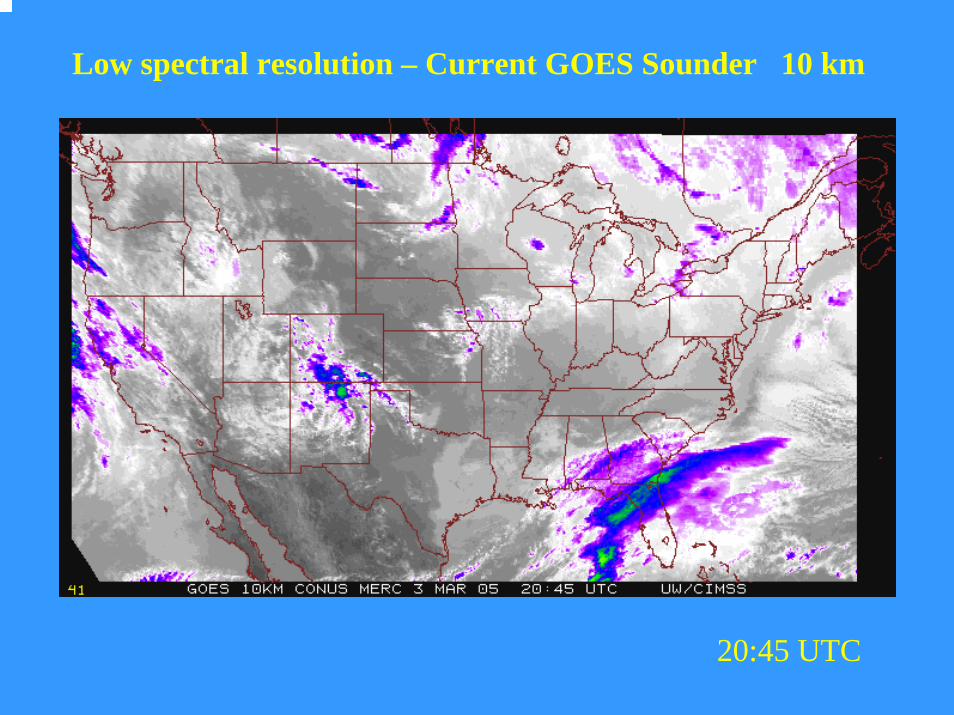
Low spectral resolution – Current GOES Sounder 10 km
20:45 UTC
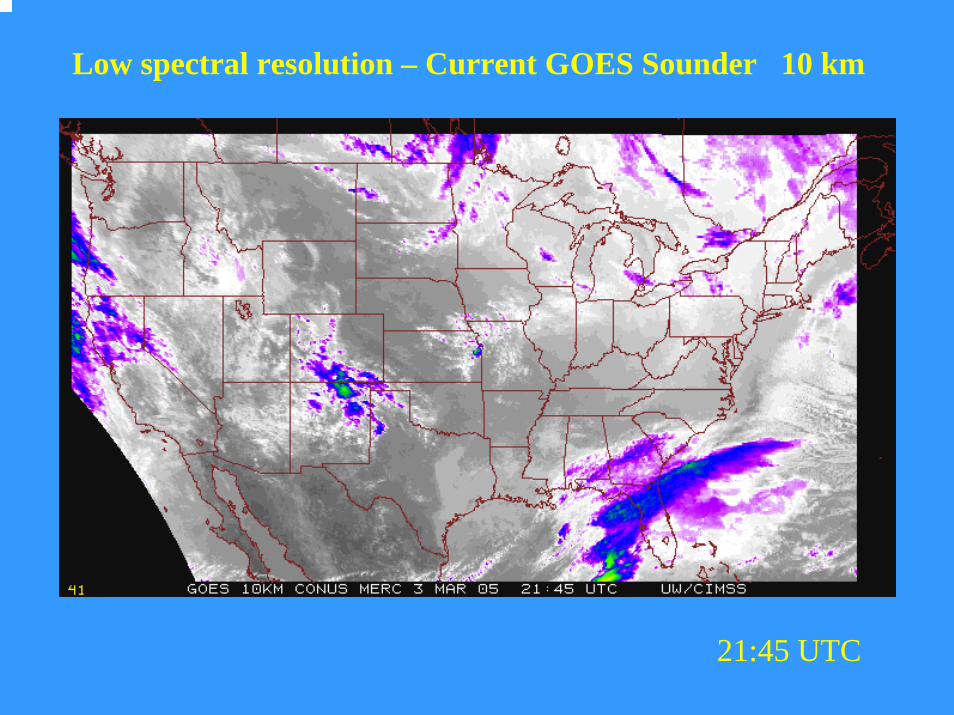
21:45 UTC
Low spectral resolution – Current GOES Sounder 10 km
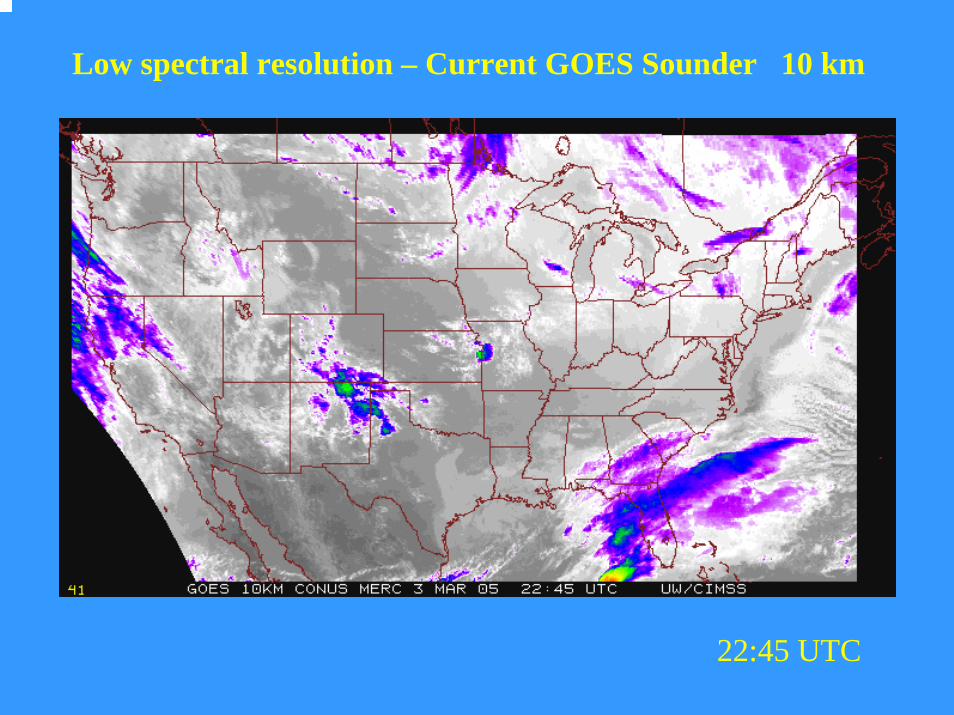
22:45 UTC
Low spectral resolution – Current GOES Sounder 10 km

From Dan Mandl, NASA
Real-time, autonomous test on February 5th
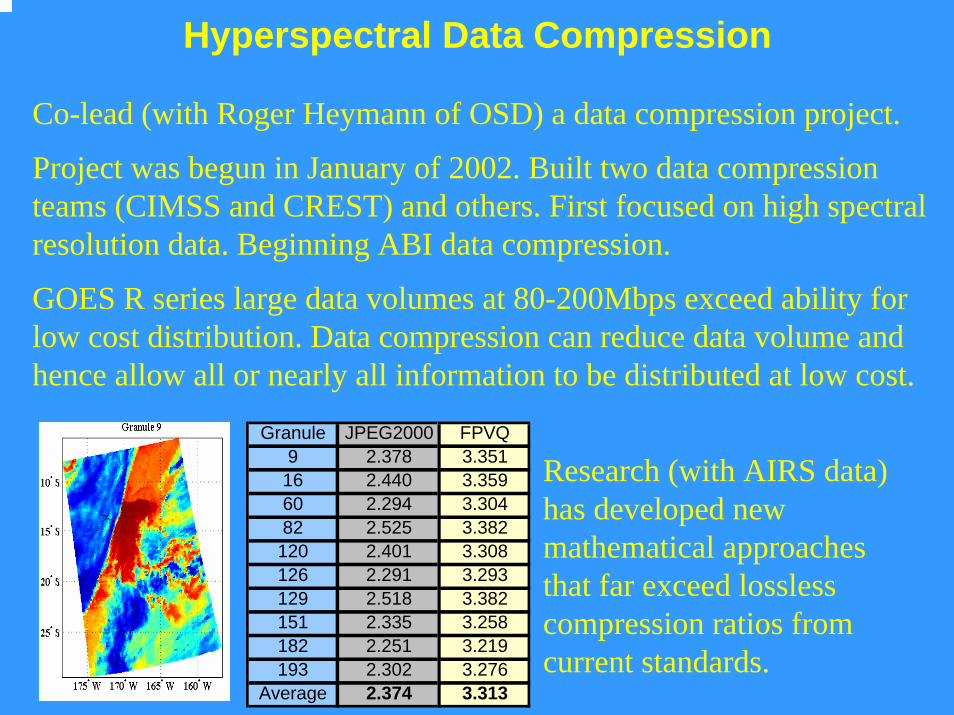
Hyperspectral Data Compression
Co-lead (with Roger Heymann of OSD) a data compression project.
Project was begun in January of 2002. Built two data compressionteams (CIMSS and CREST) and others. First focused on high spectral resolution data. Beginning ABI data compression.
GOES R series large data volumes at 80-200Mbps exceed ability for low cost distribution. Data compression can reduce data volume and hence allow all or nearly all information to be distributed at low cost.
Research (with AIRS data) has developed new mathematical approaches that far exceed lossless compression ratios from current standards.
Granule JPEG20009 2.37816 2.44060 2.29482 2.525120 2.401126 2.291129 2.518151 2.335182 2.251193 2.302
Average 2.374
FPVQ3.3513.3593.3043.3823.3083.2933.3823.2583.2193.2763.313

131
Fourth GOES-R Users’ Conference:
• May 1-3, 2006:– Location: Broomfield CO– Will focus on User Readiness
For more info:• http://www.osd.noaa.gov/announcement/index.htm
• There will be a poster session, abstracts due March 31st.

GIFTS
• GIFTS longwave signal to noise and focal plane detector operability performance summary from December 2005 thermal vacuum tests performed at Space Dynamics Laboratory in Logan, Utah. In both performance areas GIFTS is exceeding specification.
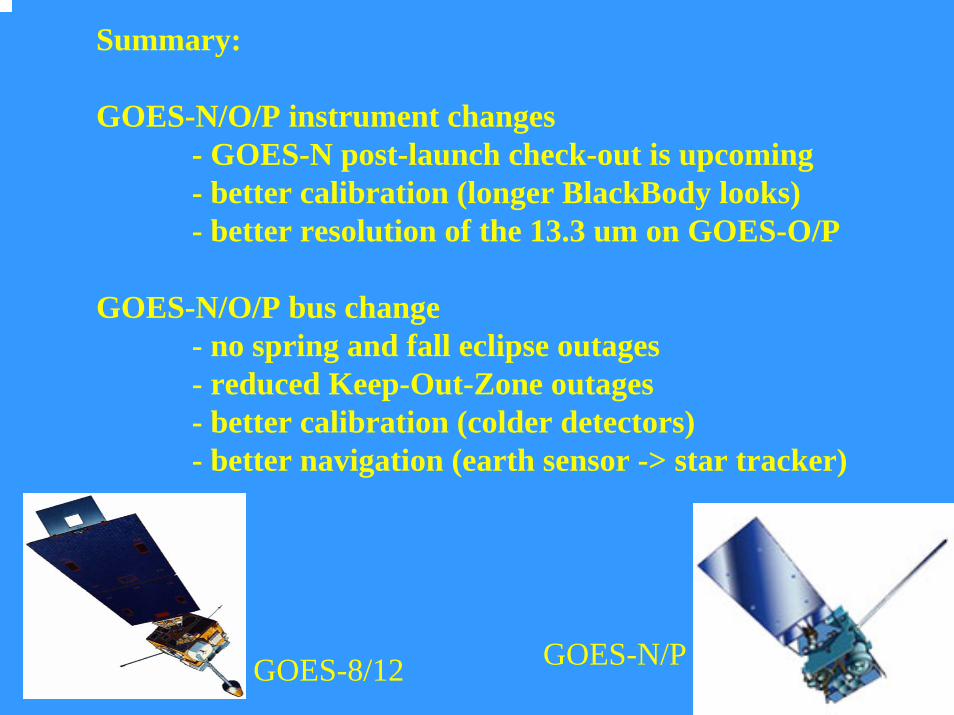
Summary:
GOES-N/O/P instrument changes- GOES-N post-launch check-out is upcoming- better calibration (longer BlackBody looks)- better resolution of the 13.3 um on GOES-O/P
GOES-N/O/P bus change- no spring and fall eclipse outages- reduced Keep-Out-Zone outages- better calibration (colder detectors)- better navigation (earth sensor -> star tracker)
GOES-8/12 GOES-N/P

Approximate spectral and spatial resolutions of US GOES Imagers~ Band Center (um)
GOES-6/7 GOES-8/11 GOES-12/N GOES-O/P GOES-R+
0.470.640.861.61.382.23.96.2
6.5/6.7/77.38.59.7
10.3511.212.313.3
14km 8 4 2
Vis
ible
Nea
r-IR
Infr
ared
Box size represents detector size
“MSI mode”

The great amount of information from the GOES-R will offer a continuation of current products and services.
These products, based on validated requirements, will cover a wide range of phenomena. This includes applications relating to: weather, ocean, land, climate, and hazards.
The ABI improves over the current GOES Imager the spectral, temporal, spatial and radiometric performance.
The Advanced Baseline Imager (ABI), along with the Hyperspectral Environmental Suite (HES), and the Geostationary Lightning Mapper (GLM) on GOES-R will enable much improved monitoring compared to current capabilities.
Summary

More information• GOES-11 PLT NOAA Tech Memo• GOES-I/M Databook• http://www.osd.noaa.gov/GOES/GOES_NQ
Booklet.pdf• GOES-N Databook

AMS ABI BAMS article by Schmit et al. from August 2005
ABI Research Home page:• http://cimss.ssec.wisc.edu/goes/abi/
NOAA GOES-R page: • https://osd.goes.noaa.gov/
GOES and MODIS Galleries:• http://cimss.ssec.wisc.edu/goes/misc/interesting_images.html• http://www.ssec.wisc.edu/~gumley/modis_gallery/
ABI Documentation from NASA: • http://goespoes.gsfc.nasa.gov/abihome.htm
ABI Simulated Spectral Response functions:• ftp://ftp.ssec.wisc.edu/ABI/SRF
More information

http://www.osd.noaa.gov/GOES/GOES_NQBooklet.pdf

Disclaimer
The views, opinions, and findings contained in this report are those of
the author and should not be construed as an official National
Oceanic and Atmospheric Administration or U.S. Government
position, policy, or decision.