godrej consumer products -...
TRANSCRIPT

Edelweiss Research is also available on www.edelresearch.com, Bloomberg EDEL <GO>, Thomson First Call, Reuters and Factset. Edelweiss Securities Limited
Godrej Consumer Products’ (GCPL) 12.1% YoY revenue growth came in line with our estimate, while EBITDA & adjusted PAT (up 20.8% YoY and 25.3% YoY, respectively) surpassed it. In our under coverage consumer pack, GCPL is the only company in Q4FY17 to report double digit sales spurt helped by successful innovations and strong recovery in hair colour—while India business sales jumped 10% YoY with 5% YoY volume growth, international sales grew 16% YoY. Consolidated EBITDA margin jumped 165bps YoY; standalone business EBITDA margin expanded 232bps YoY without resorting to cut in ad spends (unlike peers). GCPL has declared bonus issue in the 1:1 ratio. Maintain ‘BUY’ on dips.
Strong show on most parameters Key positives: (i) robust 13% YoY sales spurt in hair care post 2 quarters of negative or
nil growth (2% YoY dip in Q3FY17); (ii) 9% YoY growth in personal wash led by mid
single digit volumes, post 2 consecutive quarters of sales dip; (iii) 23% YoY sales surge
in other brands (air fresheners, Cinthol deos, liquid detergents etc); (iv) 313bps YoY and
267bps YoY jump in standalone and consolidated gross margins; and (v) 61% YoY CCG
in Africa and 19% YoY CCG in LATAM; Key negatives: (i) 4% YoY growth in household
insecticide (HI) impacted by erratic weather in March, especially in North India; and
(ii) flat CCG in Indonesia impacted by soft HI (excluding HI, CCG stood at 9% YoY).
Q4FY17 conference call highlights Domestic business is expected to clock high single digit volume growth. Has seen
some impact of Patanjali in soaps in a couple of states in North, but it is not material—
Godrej No.1 is recovering. GCPL expects double digit growth to sustain in hair colour as
it will continue competitive investment in brand building and focus on volume share.
Gross indirect tax paid by the company is in the 22‐23% range; will pass on most of
the benefit to consumers to boost demand.
Outlook and valuations: Positive; maintain ‘BUY’
We like GCPL’s sharp focus on innovation and cost efficiency. Africa business growth is
encouraging and is likely to be enhanced by entry in HI and wet hair care through SON,
which is likely to be EPS accretive. At CMP, the stock is trading at 34.6x FY19E EPS. We
recommend ‘BUY’ on dips and rate it ‘SO’ with target price of INR2,008.
RESULT UPDATE
GODREJ CONSUMER PRODUCTSHair care adds bright hue; margin sustains robust run
EDELWEISS 4D RATINGS
Absolute Rating BUY
Rating Relative to Sector Outperform
Risk Rating Relative to Sector High
Sector Relative to Market Underweight
MARKET DATA (R: GOCP.BO, B: GCPL IN)
CMP : INR 1,929
Target Price : INR 2,008
52‐week range (INR) : 1,958 / 1,272
Share in issue (mn) : 340.6
M cap (INR bn/USD mn) : 657 / 10,168
Avg. Daily Vol.BSE/NSE(‘000) : 224.5 SHARE HOLDING PATTERN (%)
Current Q2FY17 Q1FY17
Promoters *
63.3 63.3 63.3
MF's, FI's & BK’s 2.2 2.1 1.7
FII's 28.4 28.4 29.0
Others 6.1 6.2 6.1
* Promoters pledged shares (% of share in issue)
: Nil
PRICE PERFORMANCE (%)
Stock Nifty
EW Consumer goods Index
1 month 13.5 1.3 1.8
3 months 23.3 6.1 4.2
12 months 43.1 18.4 21.3
Abneesh Roy +91 22 6620 3141
Tanmay Sharma, CFA +91 22 4040 7586
Alok Shah +91 22 6620 3040
India Equity Research| Consumer Goods
May 9, 2017
Financials (INR mn)
Year to March Q4FY17 Q4FY16 % Change Q3FY17 % Change FY16 FY17E FY18E
Net rev. 23,898 21,313 12.1 24,022 (0.5) 84,239 92,679 104,015
EBITDA 5,507 4,559 20.8 5,168 6.6 16,533 18,977 22,155
Adjusted profit 3,871 3,088 25.3 3,613 7.1 11,611 13,040 15,599
Dil. EPS (INR) 11.4 9.1 10.6 34.1 38.3 45.8
Diluted P/E (x) 56.6 50.4 42.1
EV/EBITDA (x) 41.0 35.7 30.3
ROAE (%) 24.1 23.6 24.7
Consumer Goods
2 Edelweiss Securities Limited
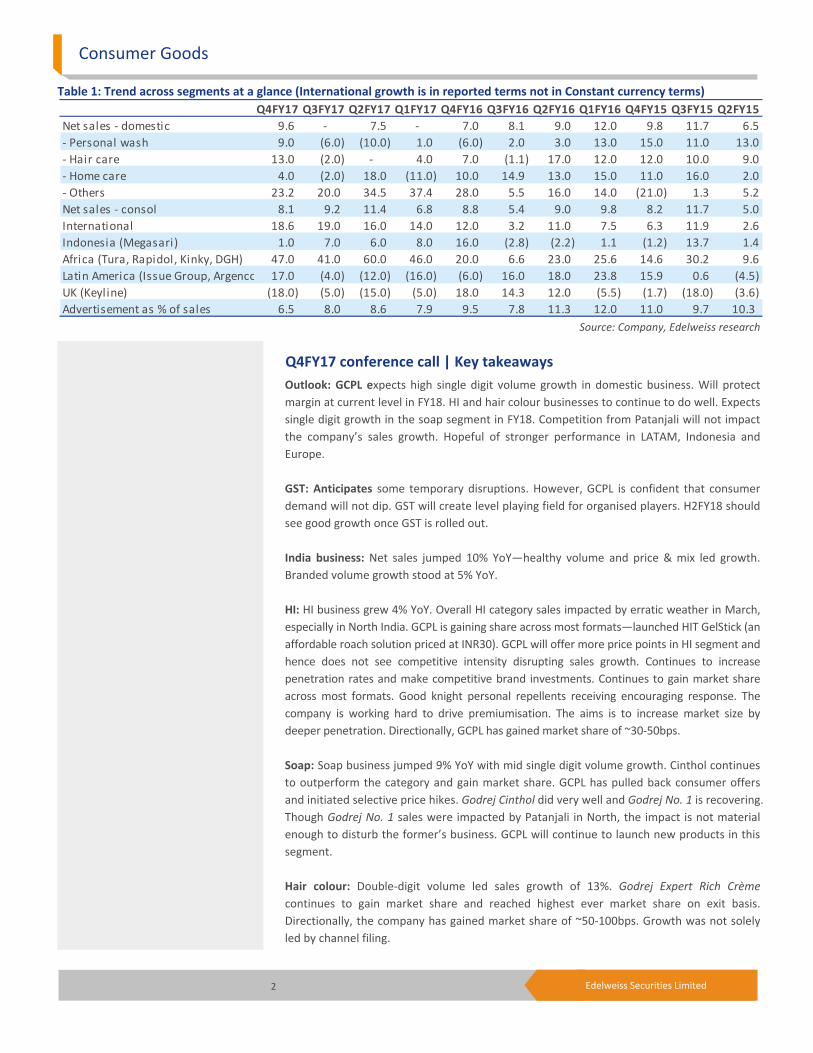
Table 1: Trend across segments at a glance (International growth is in reported terms not in Constant currency terms)
Source: Company, Edelweiss research
Q4FY17 conference call | Key takeaways
Outlook: GCPL expects high single digit volume growth in domestic business. Will protect
margin at current level in FY18. HI and hair colour businesses to continue to do well. Expects
single digit growth in the soap segment in FY18. Competition from Patanjali will not impact
the company’s sales growth. Hopeful of stronger performance in LATAM, Indonesia and
Europe.
GST: Anticipates some temporary disruptions. However, GCPL is confident that consumer
demand will not dip. GST will create level playing field for organised players. H2FY18 should
see good growth once GST is rolled out.
India business: Net sales jumped 10% YoY—healthy volume and price & mix led growth.
Branded volume growth stood at 5% YoY.
HI: HI business grew 4% YoY. Overall HI category sales impacted by erratic weather in March,
especially in North India. GCPL is gaining share across most formats—launched HIT GelStick (an
affordable roach solution priced at INR30). GCPL will offer more price points in HI segment and
hence does not see competitive intensity disrupting sales growth. Continues to increase
penetration rates and make competitive brand investments. Continues to gain market share
across most formats. Good knight personal repellents receiving encouraging response. The
company is working hard to drive premiumisation. The aims is to increase market size by
deeper penetration. Directionally, GCPL has gained market share of ~30‐50bps.
Soap: Soap business jumped 9% YoY with mid single digit volume growth. Cinthol continues
to outperform the category and gain market share. GCPL has pulled back consumer offers
and initiated selective price hikes. Godrej Cinthol did very well and Godrej No. 1 is recovering.
Though Godrej No. 1 sales were impacted by Patanjali in North, the impact is not material
enough to disturb the former’s business. GCPL will continue to launch new products in this
segment.
Hair colour: Double‐digit volume led sales growth of 13%. Godrej Expert Rich Crème
continues to gain market share and reached highest ever market share on exit basis.
Directionally, the company has gained market share of ~50‐100bps. Growth was not solely
led by channel filing.
Q4FY17 Q3FY17 Q2FY17 Q1FY17 Q4FY16 Q3FY16 Q2FY16 Q1FY16 Q4FY15 Q3FY15 Q2FY15
Net sales ‐ domestic 9.6 ‐ 7.5 ‐ 7.0 8.1 9.0 12.0 9.8 11.7 6.5
‐ Personal wash 9.0 (6.0) (10.0) 1.0 (6.0) 2.0 3.0 13.0 15.0 11.0 13.0
‐ Hair care 13.0 (2.0) ‐ 4.0 7.0 (1.1) 17.0 12.0 12.0 10.0 9.0
‐ Home care 4.0 (2.0) 18.0 (11.0) 10.0 14.9 13.0 15.0 11.0 16.0 2.0
‐ Others 23.2 20.0 34.5 37.4 28.0 5.5 16.0 14.0 (21.0) 1.3 5.2
Net sales ‐ consol 8.1 9.2 11.4 6.8 8.8 5.4 9.0 9.8 8.2 11.7 5.0
International 18.6 19.0 16.0 14.0 12.0 3.2 11.0 7.5 6.3 11.9 2.6
Indonesia (Megasari) 1.0 7.0 6.0 8.0 16.0 (2.8) (2.2) 1.1 (1.2) 13.7 1.4
Africa (Tura, Rapidol, Kinky, DGH) 47.0 41.0 60.0 46.0 20.0 6.6 23.0 25.6 14.6 30.2 9.6
Latin America (Issue Group, Argenco 17.0 (4.0) (12.0) (16.0) (6.0) 16.0 18.0 23.8 15.9 0.6 (4.5)
UK (Keyline) (18.0) (5.0) (15.0) (5.0) 18.0 14.3 12.0 (5.5) (1.7) (18.0) (3.6)
Advertisement as % of sales 6.5 8.0 8.6 7.9 9.5 7.8 11.3 12.0 11.0 9.7 10.3
Godrej Consumer
3 Edelweiss Securities Limited
Other brands: Clocked robust growth of 33% YoY. Aer pockets have been doing well with
double digit volume growth. The company is confident of driving strong growth in car and
room freshner category.
International business: Posted overall sales spurt of 16% YoY with 22% YoY constant
currency sales growth. Organic constant currency sales growth stood at 6% YoY with 1%
overall net sales growth. Overall international business margins jumped 150bps YoY.
Margins across geographies rose significantly—up 60bps YoY in Indonesia, 40bps YoY in
Africa, 670bps YoY in LatAM and 590bps YoY in Europe.
Indonesia: Clocked overall growth of 1% YoY, while CCG was flat. CCG, excluding HI, was 9%
YoY. Margin improvement was led by better product mix and cost control initiatives. Gained
share in HI and air fresheners on MAT basis. Has cross pollinated aer pockets to Indonesia.
NYU range of hair colours continued to receive encouraging response from trade and
consumers.
Fundamentals of HI segment remain strong and Q1FY18 should see strong growth in that
segment. Competitive intensity is waning in HI segment in Indonesia and expects marginal
recovery. Project PIE was launched, which will help sustain margin going forward.
Indonesia has seen flattish volume growth; volume and value equation is also largely flattish
for full year.
Africa: Africa business posted overall growth of 47% YoY with CCG of 61% YoY. Margin
increase was helped by calibrated price increases and mix. Focus on leveraging acquisition
of Strength of Nature to turbo charge building wet hair care platform in Africa. Relaunch of
Darling brand on the cards.
3 categories in Africa: Dry hair, wet hair and insecticides. Dry hair and wet hair segments
are USD1bn each; insecticides is about USD500mn. The company is planning to localise
manufacturing. This will help in better margin and help playing with product size, SKU size,
etc. In the dry hair business, full manufacturing is local; for wet hair, most manufacturing
will become local by Q2FY18.
LATAM: Overall growth and CCG stood at 17% YoY and 19% YoY, respectively. Sharp margin
expansion (670bps YoY) was due to expansion in gross margin and cost saving initiatives.
Many initiatives in Chile and Argentina to improve margins have worked well.
Europe: While sales declined 18% YoY, constant currency sales fell 5% YoY. Growth
impacted due to counterfeit stock related issues in Bio‐Oil and increased competitive
intensity in deodorants. Margin expansion (590bps YoY) was due to judicious marketing
investments and one‐time reversal of A&P provisions.
Raw material prices: Adequate stock of palm oil in place coupled with future covers too.
Going forward, the company expects palm oil prices to correct.
Innovations and new product launches: Lot of potential is driving deo stick. Early days, but
hand wash segment should also be sizable.
Consumer Goods
4 Edelweiss Securities Limited
Margins: Aim is to grow EBITDA at a pace faster than sales growth, thereby margin
expansion continues. With cost rationalisation, marketing cost management and product
innovations, the company believes there is still scope for margin expansion.
Debt and working capital: Reduction in receivables has been broad based and overall
working capital in organic business has dipped significantly.
Ad spends: The company did not cut A&P spends in Q4FY17. Ad spends will continue to
grow at 10% YoY. 2/3rd of A&P spends go into the core and balance into adjacencies and
new segments.
Dividend: Payout ratios have been fairly low compared to peers. GCPL now wants to reward
shareholders with better payout. Management believes it will be able to continue to sustain
higher payout ratio with free cash flows generated. It is not looking at big value acquisition.
Indirect tax rate: Current indirect tax at gross is 22%. However, with exemptions enjoyed
effective indirect tax rate is 16‐17%. If GST rate is 18%, this rate will still be at gross level and
the effective tax rate will be lower. Any benefit on GST will help GCPL drive demand by
passing on the benefit to customers.
Outlook and valuations: Positive; maintain ‘BUY’
GCPL continues to surpass category growth along with garnering market share across
segments and is one of the few companies to report double digit sales growth in the
domestic business. The company’s strategy of launching new and innovative products at
disruptive price points (recently entered outdoor HI, launched B Blunt Crème hair colour at
attractive price points) is bolstering growth, despite tough macro‐economic conditions.
Domestic margins are expected to benefit from supply chain efficiencies emanating from
Project PIE. The company also holds lower cost inventory, which amidst price hikes will help
sustain margin in the short term. International business has started improving led by cost
saving initiatives (Project Iceberg in Argentina, which has now been extended to Indonesia;
Project Symphony in Chile, etc) and share gains—all geographies clocked margin expansion
in Q4FY17. Entry in HI in Africa will be a key growth driver in Africa business, while
localisation of manufacturing will bolster supply chain system. SON acquisition has aid entry
in wet hair care and margins as well. Distribution measures, new launches (crème hair
colour in Indonesia) and cost saving measures in Indonesia will help drive growth and
sustain margin. Also, the company’s drive to improve distribution productivity and reach by
deploying more feet on ground and other steps will lend impetus to profitability.
We also like GCPL’s aggression in developing categories via new launches (Godrej Expert
Rich Crème in a multi‐application pack, Aer pocket, Godrej No1 Nature Soft –Glycerin &
Honey, Germ Protection, Cinthol Dio Stick, Cinthol Confidence+, etc) and cross pollination of
products across geographies. GCPL is expected to sustain strong double digit growth led by
entry in lower penetrated category, new product launches, pricing growth in the personal
wash category and sustain double digit growth in the hair colour segment. GCPL has
declared a dividend of INR15 per share in FY17 which is close to 40% payout, a sharp jump
from ~24% payout in FY16. The payout is expected to remain strong as GCPL is not
planning any big value expansion. We assign 36x on FY19E EPS to with target price of
INR2,008. We recommend 'BUY’ on dips and rate the stock 'Sector Outperformer' on
relative returns basis.

Godrej Consumer
5 Edelweiss Securities Limited
Chart 1: Sales growth in HI – Domestic business
Chart 2: Sales growth in hair care – Domestic business
Chart 3: Sales growth in soaps – Domestic business
Source: Company, Edelweiss research
(15.0)
(3.0)
9.0
21.0
33.0
45.0
Q4FY12
Q1FY13
Q2FY13
Q3FY13
Q4FY13
Q1FY14
Q2FY14
Q3FY14
Q4FY14
Q1FY15
Q2FY15
Q3FY15
Q4FY15
Q1FY16
Q2FY16
Q3FY16
Q4FY16
Q1FY17
Q2FY17
Q3FY17
Q4FY17
(%)
HI
(5.0)
5.0
15.0
25.0
35.0
45.0
Q4FY12
Q1FY13
Q2FY13
Q3FY13
Q4FY13
Q1FY14
Q2FY14
Q3FY14
Q4FY14
Q1FY15
Q2FY15
Q3FY15
Q4FY15
Q1FY16
Q2FY16
Q3FY16
Q4FY16
Q1FY17
Q2FY17
Q3FY17
Q4FY17
(%)
Hair care
(25.0)
(10.0)
5.0
20.0
35.0
50.0
Q4FY12
Q1FY13
Q2FY13
Q3FY13
Q4FY13
Q1FY14
Q2FY14
Q3FY14
Q4FY14
Q1FY15
Q2FY15
Q3FY15
Q4FY15
Q1FY16
Q2FY16
Q3FY16
Q4FY16
Q1FY17
Q2FY17
Q3FY17
Q4FY17
(%)
Personal wash
Consumer Goods
6 Edelweiss Securities Limited
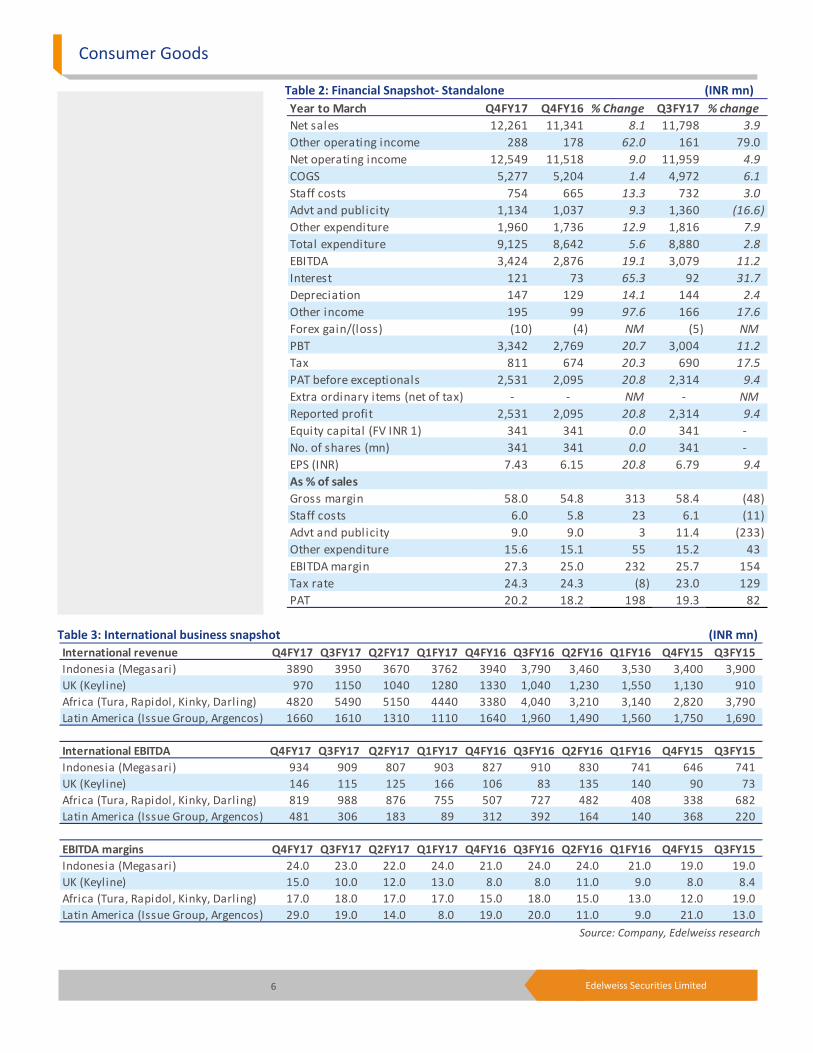
Table 2: Financial Snapshot‐ Standalone (INR mn)
Table 3: International business snapshot (INR mn)
Source: Company, Edelweiss research
Year to March Q4FY17 Q4FY16 % Change Q3FY17 % change
Net sales 12,261 11,341 8.1 11,798 3.9
Other operating income 288 178 62.0 161 79.0
Net operating income 12,549 11,518 9.0 11,959 4.9
COGS 5,277 5,204 1.4 4,972 6.1
Staff costs 754 665 13.3 732 3.0
Advt and publicity 1,134 1,037 9.3 1,360 (16.6)
Other expenditure 1,960 1,736 12.9 1,816 7.9
Total expenditure 9,125 8,642 5.6 8,880 2.8
EBITDA 3,424 2,876 19.1 3,079 11.2
Interest 121 73 65.3 92 31.7
Depreciation 147 129 14.1 144 2.4
Other income 195 99 97.6 166 17.6
Forex gain/(loss) (10) (4) NM (5) NM
PBT 3,342 2,769 20.7 3,004 11.2
Tax 811 674 20.3 690 17.5
PAT before exceptionals 2,531 2,095 20.8 2,314 9.4
Extra ordinary items (net of tax) ‐ ‐ NM ‐ NM
Reported profit 2,531 2,095 20.8 2,314 9.4
Equity capital (FV INR 1) 341 341 0.0 341 ‐
No. of shares (mn) 341 341 0.0 341 ‐
EPS (INR) 7.43 6.15 20.8 6.79 9.4
As % of sales
Gross margin 58.0 54.8 313 58.4 (48)
Staff costs 6.0 5.8 23 6.1 (11)
Advt and publicity 9.0 9.0 3 11.4 (233)
Other expenditure 15.6 15.1 55 15.2 43
EBITDA margin 27.3 25.0 232 25.7 154
Tax rate 24.3 24.3 (8) 23.0 129
PAT 20.2 18.2 198 19.3 82
International revenue Q4FY17 Q3FY17 Q2FY17 Q1FY17 Q4FY16 Q3FY16 Q2FY16 Q1FY16 Q4FY15 Q3FY15
Indonesia (Megasari) 3890 3950 3670 3762 3940 3,790 3,460 3,530 3,400 3,900
UK (Keyline) 970 1150 1040 1280 1330 1,040 1,230 1,550 1,130 910
Africa (Tura, Rapidol, Kinky, Darling) 4820 5490 5150 4440 3380 4,040 3,210 3,140 2,820 3,790
Latin America (Issue Group, Argencos) 1660 1610 1310 1110 1640 1,960 1,490 1,560 1,750 1,690
International EBITDA Q4FY17 Q3FY17 Q2FY17 Q1FY17 Q4FY16 Q3FY16 Q2FY16 Q1FY16 Q4FY15 Q3FY15
Indonesia (Megasari) 934 909 807 903 827 910 830 741 646 741
UK (Keyline) 146 115 125 166 106 83 135 140 90 73
Africa (Tura, Rapidol, Kinky, Darling) 819 988 876 755 507 727 482 408 338 682
Latin America (Issue Group, Argencos) 481 306 183 89 312 392 164 140 368 220
EBITDA margins Q4FY17 Q3FY17 Q2FY17 Q1FY17 Q4FY16 Q3FY16 Q2FY16 Q1FY16 Q4FY15 Q3FY15
Indonesia (Megasari) 24.0 23.0 22.0 24.0 21.0 24.0 24.0 21.0 19.0 19.0
UK (Keyline) 15.0 10.0 12.0 13.0 8.0 8.0 11.0 9.0 8.0 8.4
Africa (Tura, Rapidol, Kinky, Darling) 17.0 18.0 17.0 17.0 15.0 18.0 15.0 13.0 12.0 19.0
Latin America (Issue Group, Argencos) 29.0 19.0 14.0 8.0 19.0 20.0 11.0 9.0 21.0 13.0

Godrej Consumer
7 Edelweiss Securities Limited
Table 4: Constant currency YoY sales growth
Source: Company, Edelweiss research
Chart 4: One year forward PE
Source: Edelweiss research
Source: Edelweiss research
Q4FY17 Q3FY17 Q2FY17 Q1FY17 Q4FY16 Q3FY16 Q2FY16 Q1FY16 Q4FY15 Q3FY15 Q2FY15 Q1FY15
Reported net sales ‐ consol 16.0 8.0 7.0 6.8 8.8 5.4 9.0 11.0 8.0 12.0 5.0 10.0
International 22.0 28.0 25.0 18.0 18.0 9.0 18.0 13.0 14.0 13.0 12.0 17.0
Indonesia (Megasari) 0.5 13.0 (2.0) 3.0 13.0 3.0 8.0 8.0 6.0 19.0 15.0 21.0
Africa (Tura, Rapidol, Kinky, SON, DGH) 61.0 54.0 75.0 52.0 26.0 16.0 32.0 32.0 23.0 36.0 15.0 12.0
Latin America (Issue Group, Argencos) 19.0 24.0 20.0 10.0 31.0 28.0 29.0 29.0 27.0 25.0 31.0 26.0
UK (Keyline) (5.0) 16.0 (2.0) (3.0) 15.0 10.0 (2.0) (2.0) 7.0 (13.0) (9.0) 21.0
0
360
720
1,080
1,440
1,800
Apr‐11
Oct‐11
Apr‐12
Oct‐12
Apr‐13
Oct‐13
Apr‐14
Oct‐14
Apr‐15
Oct‐15
Apr‐16
Oct‐16
Apr‐17
(INR)
25x
30x
35x
20x
15x
25x
30x
35x
20x
15x
Consumer Goods
8 Edelweiss Securities Limited
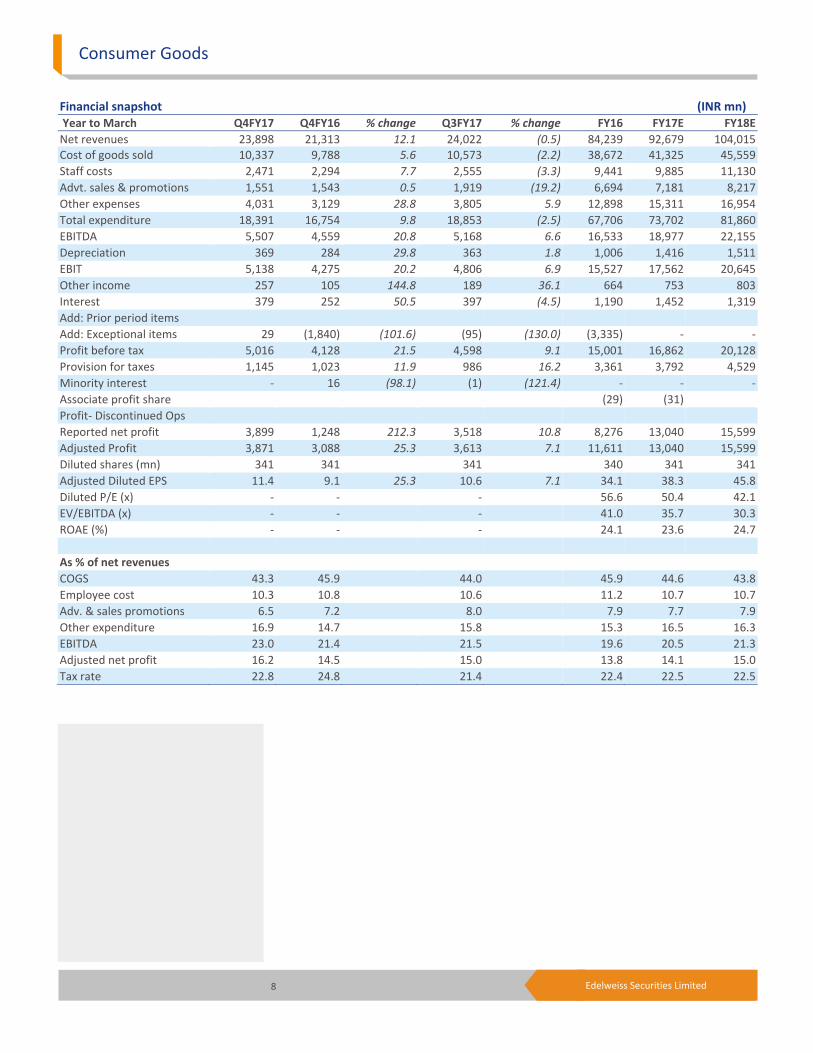
Financial snapshot (INR mn) Year to March Q4FY17 Q4FY16 % change Q3FY17 % change FY16 FY17E FY18E
Net revenues 23,898 21,313 12.1 24,022 (0.5) 84,239 92,679 104,015 Cost of goods sold 10,337 9,788 5.6 10,573 (2.2) 38,672 41,325 45,559
Staff costs 2,471 2,294 7.7 2,555 (3.3) 9,441 9,885 11,130
Advt. sales & promotions 1,551 1,543 0.5 1,919 (19.2) 6,694 7,181 8,217
Other expenses 4,031 3,129 28.8 3,805 5.9 12,898 15,311 16,954
Total expenditure 18,391 16,754 9.8 18,853 (2.5) 67,706 73,702 81,860
EBITDA 5,507 4,559 20.8 5,168 6.6 16,533 18,977 22,155
Depreciation 369 284 29.8 363 1.8 1,006 1,416 1,511
EBIT 5,138 4,275 20.2 4,806 6.9 15,527 17,562 20,645
Other income 257 105 144.8 189 36.1 664 753 803
Interest 379 252 50.5 397 (4.5) 1,190 1,452 1,319
Add: Prior period items
Add: Exceptional items 29 (1,840) (101.6) (95) (130.0) (3,335) ‐ ‐
Profit before tax 5,016 4,128 21.5 4,598 9.1 15,001 16,862 20,128
Provision for taxes 1,145 1,023 11.9 986 16.2 3,361 3,792 4,529
Minority interest ‐ 16 (98.1) (1) (121.4) ‐ ‐ ‐
Associate profit share (29) (31)
Profit‐ Discontinued Ops
Reported net profit 3,899 1,248 212.3 3,518 10.8 8,276 13,040 15,599
Adjusted Profit 3,871 3,088 25.3 3,613 7.1 11,611 13,040 15,599
Diluted shares (mn) 341 341 341 340 341 341
Adjusted Diluted EPS 11.4 9.1 25.3 10.6 7.1 34.1 38.3 45.8
Diluted P/E (x) ‐ ‐ ‐ 56.6 50.4 42.1
EV/EBITDA (x) ‐ ‐ ‐ 41.0 35.7 30.3
ROAE (%) ‐ ‐ ‐ 24.1 23.6 24.7
As % of net revenues
COGS 43.3 45.9 44.0 45.9 44.6 43.8
Employee cost 10.3 10.8 10.6 11.2 10.7 10.7
Adv. & sales promotions 6.5 7.2 8.0 7.9 7.7 7.9
Other expenditure 16.9 14.7 15.8 15.3 16.5 16.3
EBITDA 23.0 21.4 21.5 19.6 20.5 21.3
Adjusted net profit 16.2 14.5 15.0 13.8 14.1 15.0
Tax rate 22.8 24.8 21.4 22.4 22.5 22.5

Godrej Consumer
9 Edelweiss Securities Limited
Company Description
GCPL is a major player in the toilet soap, household insecticide and hair colour categories in
the Indian FMCG market. It is a leader in the hair colour category and has a vast product
range across various price points. Major brands include Godrej Expert Rich Hair Crème,
Godrej Hair Dye (liquid and powder), Godrej Kesh Kala oil and Nupur hair dyes in the mass
end and Renew and Coloursoft in the mass premium segment. It is the second‐largest toilet
soap marketer after Hindustan Unilever (HUL) and primary brands such as Godrej No. 1,
Cinthol and FairGlow.
In 2012, GCPL completed the acquisition of 51% stake in Godrej Sara Lee Limited which had
several leading brands such as GoodKnight, JET, HIT, Brylcreem and KIWI. GCPL is the leader
in the household insecticides category across all the formats.
To expand its geographical presence, GCPL had made few acquisitions in the past few years.
In FY06, it acquired Keyline brands in the UK with brands such as Cuticura and Erasmic. In
FY07, it took over Rapidol, a South African company with presence across ten countries in
Africa. It acquired Kinky, one of the leaders in the South African hair business for South
African Rand. Tura and Megasari are purchases that helped extend its presence in Africa and
Indonesia respectively. With acquisition of Darling Group Holding, leader in hair extension in
Africa, in Africa GCPL further strengthened its stronghold in the continent. It also entered
Chile, with acquisition of 60% stake in Cosmetica Nacional. GCPL acquired 30% stake in
B:Blunt salon services. The company strengthened its presence in the wet hair care market
with the acquisition of Strength of Nature. Investment Theme
GCPL boasts of patented technology for PHDs that has helped it drive usage of hair colours
at the lower end of the market. Recently with disruptive launch of crème based hair color at
low price point GCPL has raised competitive intensity in the segment and gained market
share form MNCs. In soaps, the company provides high‐quality value‐for‐money soaps with
its Godrej No1 which has helped it garner larger market share and plays the premiumisation
strategy with its Cinthol range. GCPL is the undisputed leader in the household insecticides
space across three categories and continues to expand the market with innovations. GCPL’s
international acquisitions are driving benefits from cross pollination of products and
technology. The company can be expected to benefit from its new ventures, increasing
consumer spending and inorganic growth going forward.
Key Risks
A slowdown in rural demand due to lower government spending or a monsoon failure could
impact GCPL’s revenues significantly.
Depreciating INR, Indonesian rupiah and Argentine Peso can impact profitability.
GCPL’s ability to gain market share in its soap segment could be adversely affected by the
aggression of HUL, ITC, Wipro, etc.
10 Edelweiss Securities Limited
Consumer Goods
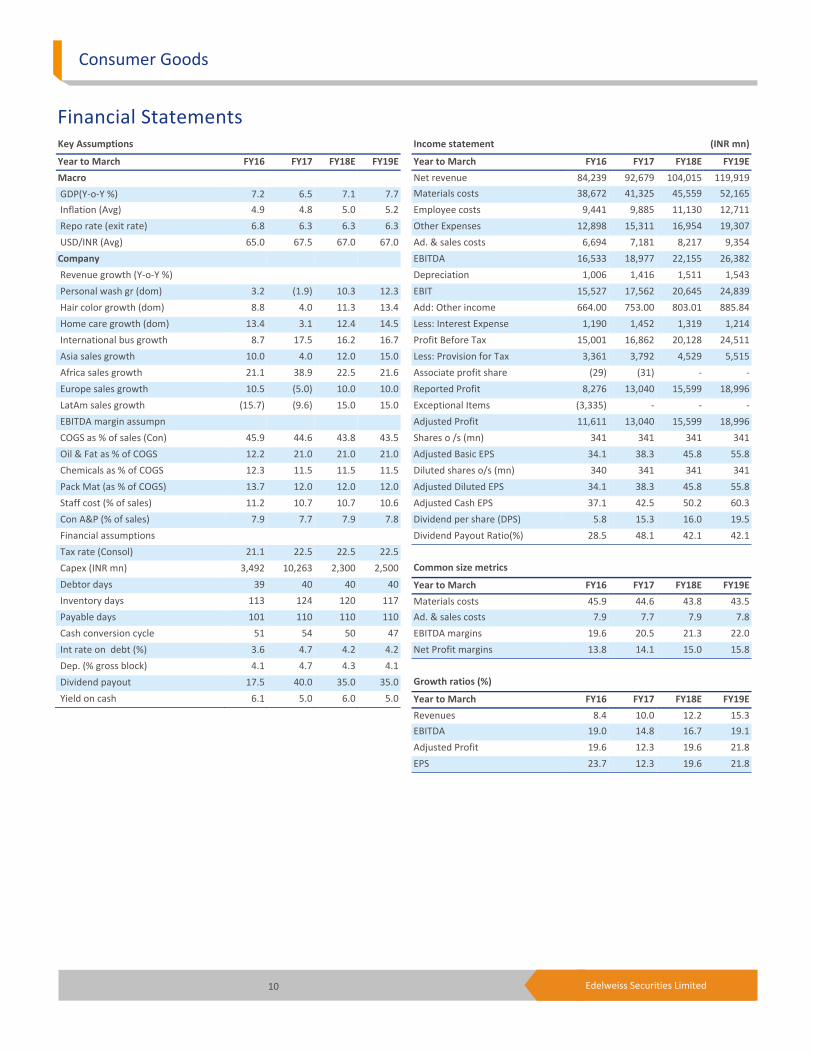
Financial Statements
Income statement (INR mn)
Year to March FY16 FY17 FY18E FY19E
Net revenue 84,239 92,679 104,015 119,919
Materials costs 38,672 41,325 45,559 52,165
Employee costs 9,441 9,885 11,130 12,711
Other Expenses 12,898 15,311 16,954 19,307
Ad. & sales costs 6,694 7,181 8,217 9,354
EBITDA 16,533 18,977 22,155 26,382
Depreciation 1,006 1,416 1,511 1,543
EBIT 15,527 17,562 20,645 24,839
Add: Other income 664.00 753.00 803.01 885.84
Less: Interest Expense 1,190 1,452 1,319 1,214
Profit Before Tax 15,001 16,862 20,128 24,511
Less: Provision for Tax 3,361 3,792 4,529 5,515
Associate profit share (29) (31) ‐ ‐
Reported Profit 8,276 13,040 15,599 18,996
Exceptional Items (3,335) ‐ ‐ ‐
Adjusted Profit 11,611 13,040 15,599 18,996
Shares o /s (mn) 341 341 341 341
Adjusted Basic EPS 34.1 38.3 45.8 55.8
Diluted shares o/s (mn) 340 341 341 341
Adjusted Diluted EPS 34.1 38.3 45.8 55.8
Adjusted Cash EPS 37.1 42.5 50.2 60.3
Dividend per share (DPS) 5.8 15.3 16.0 19.5
Dividend Payout Ratio(%) 28.5 48.1 42.1 42.1
Common size metrics
Year to March FY16 FY17 FY18E FY19E
Materials costs 45.9 44.6 43.8 43.5
Ad. & sales costs 7.9 7.7 7.9 7.8
EBITDA margins 19.6 20.5 21.3 22.0
Net Profit margins 13.8 14.1 15.0 15.8
Growth ratios (%)
Year to March FY16 FY17 FY18E FY19E
Revenues 8.4 10.0 12.2 15.3
EBITDA 19.0 14.8 16.7 19.1
Adjusted Profit 19.6 12.3 19.6 21.8
EPS 23.7 12.3 19.6 21.8
Key Assumptions
Year to March FY16 FY17 FY18E FY19E
Macro
GDP(Y‐o‐Y %) 7.2 6.5 7.1 7.7
Inflation (Avg) 4.9 4.8 5.0 5.2
Repo rate (exit rate) 6.8 6.3 6.3 6.3
USD/INR (Avg) 65.0 67.5 67.0 67.0
Company
Revenue growth (Y‐o‐Y %)
Personal wash gr (dom) 3.2 (1.9) 10.3 12.3
Hair color growth (dom) 8.8 4.0 11.3 13.4
Home care growth (dom) 13.4 3.1 12.4 14.5
International bus growth 8.7 17.5 16.2 16.7
Asia sales growth 10.0 4.0 12.0 15.0
Africa sales growth 21.1 38.9 22.5 21.6
Europe sales growth 10.5 (5.0) 10.0 10.0
LatAm sales growth (15.7) (9.6) 15.0 15.0
EBITDA margin assumpn
COGS as % of sales (Con) 45.9 44.6 43.8 43.5
Oil & Fat as % of COGS 12.2 21.0 21.0 21.0
Chemicals as % of COGS 12.3 11.5 11.5 11.5
Pack Mat (as % of COGS) 13.7 12.0 12.0 12.0
Staff cost (% of sales) 11.2 10.7 10.7 10.6
Con A&P (% of sales) 7.9 7.7 7.9 7.8
Financial assumptions
Tax rate (Consol) 21.1 22.5 22.5 22.5
Capex (INR mn) 3,492 10,263 2,300 2,500
Debtor days 39 40 40 40
Inventory days 113 124 120 117
Payable days 101 110 110 110
Cash conversion cycle 51 54 50 47
Int rate on debt (%) 3.6 4.7 4.2 4.2
Dep. (% gross block) 4.1 4.7 4.3 4.1
Dividend payout 17.5 40.0 35.0 35.0
Yield on cash 6.1 5.0 6.0 5.0

11 Edelweiss Securities Limited
Godrej Consumer
Peer comparison valuation
Market cap Diluted P/E (X) EV / EBITDA (X) ROAE (%)
Name (USD mn) FY18E FY19E FY18E FY19E FY18E FY19E
Godrej Consumer 10,168 42.1 34.6 30.3 25.1 24.7 26.0
Dabur 7,454 33.2 28.4 28.5 23.9 27.5 27.7
Emami 3,786 50.1 37.9 26.7 22.0 28.5 32.1
Hindustan Unilever 31,882 42.5 36.7 29.3 25.1 103.3 107.2
ITC 51,029 26.4 22.8 17.2 14.5 31.1 31.2
Marico 6,042 41.1 36.0 27.7 24.1 38.1 37.1
Median ‐ 41.6 35.3 28.1 24.0 29.8 31.6
AVERAGE ‐ 39.3 32.7 26.6 22.5 42.2 43.5
Source: Edelweiss research
Cash flow metrics
Year to March FY16 FY17 FY18E FY19E
Operating cash flow 8,391 18,075 17,524 20,258
Investing cash flow (4,946) (10,263) (2,300) (2,500)
Financing cash flow (1,875) (3,761) (10,890) (11,216)
Net cash Flow 1,570 4,051 4,333 6,542
Capex (3,492) (10,263) (2,300) (2,500)
Dividend paid (2,357) (6,278) (6,571) (8,002)
Profitability and efficiency ratios
Year to March FY16 FY17 FY18E FY19E
ROAE (%) 24.1 23.6 24.7 26.0
ROACE (%) 21.2 21.3 22.7 25.2
Inventory Days 113 124 120 117
Debtors Days 39 40 40 40
Payable Days 101 110 110 110
Cash Conversion Cycle 51 54 50 47
Current Ratio 1.8 1.8 2.0 2.2
Debt/EBITDA (x) 1.7 1.7 1.4 1.1
Debt/Equity (x) 0.6 0.6 0.4 0.4
Adjusted Debt/Equity 0.6 0.6 0.4 0.4
Net Debt/Equity 0.4 0.3 0.2 0.1
Interest Coverage Ratio 13.0 12.1 15.6 20.5
Operating ratios
Year to March FY16 FY17 FY18E FY19E
Total Asset Turnover 1.1 1.1 1.1 1.2
Fixed Asset Turnover 1.4 1.4 1.5 1.7
Equity Turnover 1.7 1.7 1.6 1.6
Valuation parameters
Year to March FY16 FY17 FY18E FY19E
Adj. Diluted EPS (INR) 34.1 38.3 45.8 55.8
Y‐o‐Y growth (%) 25.6 12.3 19.6 21.8
Adjusted Cash EPS (INR) 37.1 42.5 50.2 60.3
Diluted P/E (x) 56.6 50.4 42.1 34.6
P/B (x) 12.9 11.4 9.8 8.4
EV / Sales (x) 8.0 7.3 6.4 5.5
EV / EBITDA (x) 41.0 35.7 30.3 25.1
Dividend Yield (%) 0.3 0.8 0.8 1.0
Balance sheet (INR mn)
As on 31st March FY16 FY17 FY18E FY19E
Share capital 341 341 341 341
Reserves & Surplus 50,636 57,399 66,427 77,421
Shareholders' funds 50,977 57,739 66,767 77,761
Minority Interest 842 842 842 842
Short term borrowings 4,421 8,421 5,421 3,421
Long term borrowings 24,490 24,490 24,490 24,490
Total Borrowings 28,911 32,911 29,911 27,911
Long Term Liabilities 348 348 348 348
Def. Tax Liability (net) (413) (413) (413) (413)
Sources of funds 80,665 91,427 97,455 106,449
Gross Block 26,383 33,883 36,383 38,883
Net Block 8,471 4,555 5,544 6,502
Capital work in progress 437 3,200 3,000 3,000
Intangible Assets 54,633 64,633 64,633 64,633
Total Fixed Assets 63,540 72,388 73,177 74,134
Non current investments 344 344 344 344
Cash and Equivalents 8,988 13,039 17,373 23,914
Inventories 13,070 14,039 14,978 16,721
Sundry Debtors 11,180 10,157 11,399 13,142
Loans & Advances 3,857 3,857 3,857 3,857
Other Current Assets 118 118 118 118
Current Assets (ex cash) 28,225 28,171 30,352 33,839
Trade payable 10,372 12,454 13,730 15,721
Other Current Liab 10,061 10,061 10,061 10,061
Total Current Liab 20,433 22,515 23,791 25,782
Net Curr Assets‐ex cash 7,792 5,656 6,561 8,056
Uses of funds 80,665 91,427 97,455 106,449
BVPS (INR) 149.7 169.6 196.1 228.4
Free cash flow (INR mn)
Year to March FY16 FY17 FY18E FY19E
Reported Profit 8,276 13,040 15,599 18,996
Add: Depreciation 1,006 1,416 1,511 1,543
Interest (Net of Tax) 923 1,126 1,022 941
Others 3,507 357 297 273
Less: Changes in WC 5,997 (2,137) 905 1,495
Operating cash flow 7,716 18,075 17,524 20,258
Less: Capex 3,492 10,263 2,300 2,500
Free Cash Flow 4,224 7,812 15,224 17,758
12 Edelweiss Securities Limited
Consumer Goods
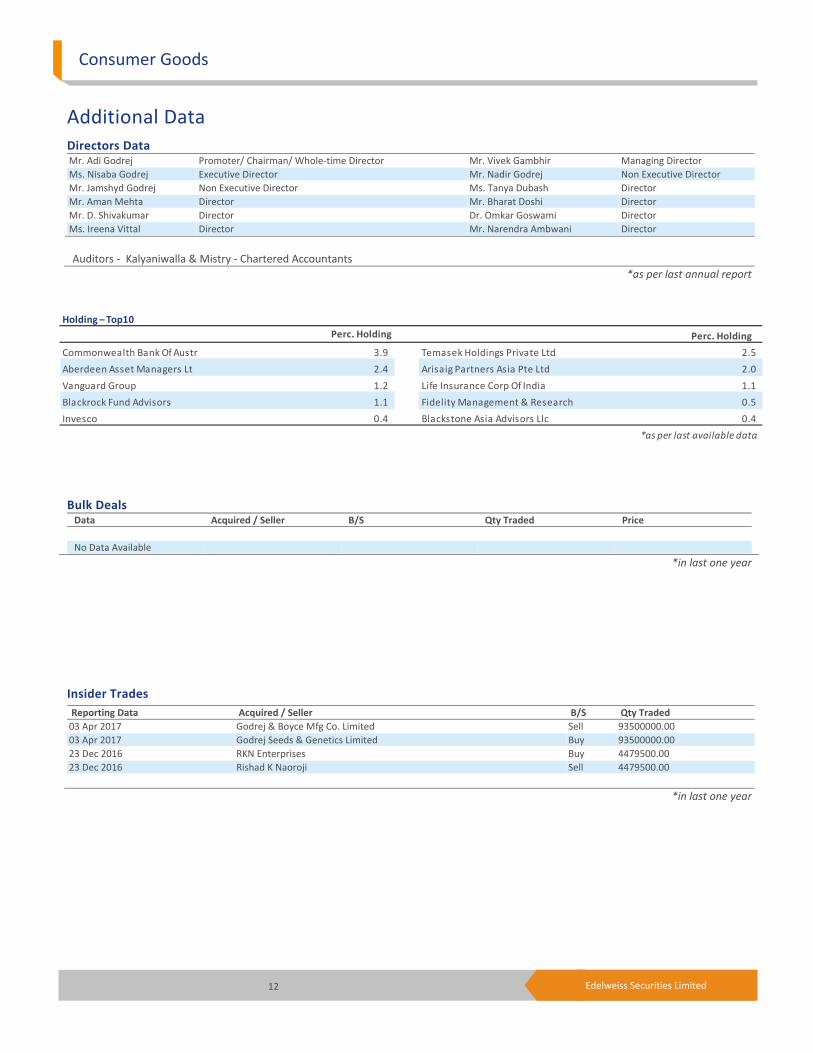
Holding – Top10
Perc. Holding Perc. Holding
Commonwealth Bank Of Austr 3.9 Temasek Holdings Private Ltd 2.5
Aberdeen Asset Managers Lt 2.4 Arisaig Partners Asia Pte Ltd 2.0
Vanguard Group 1.2 Life Insurance Corp Of India 1.1
Blackrock Fund Advisors 1.1 Fidelity Management & Research 0.5
Invesco 0.4 Blackstone Asia Advisors Llc 0.4
*as per last available data
Insider Trades Reporting Data Acquired / Seller B/S Qty Traded
03 Apr 2017 Godrej & Boyce Mfg Co. Limited Sell 93500000.00
03 Apr 2017 Godrej Seeds & Genetics Limited Buy 93500000.00
23 Dec 2016 RKN Enterprises Buy 4479500.00
23 Dec 2016 Rishad K Naoroji Sell 4479500.00
*in last one year
Bulk Deals Data Acquired / Seller B/S Qty Traded Price
No Data Available
*in last one year
Additional Data
Directors Data Mr. Adi Godrej Promoter/ Chairman/ Whole‐time Director Mr. Vivek Gambhir Managing Director
Ms. Nisaba Godrej Executive Director Mr. Nadir Godrej Non Executive Director
Mr. Jamshyd Godrej Non Executive Director Ms. Tanya Dubash Director
Mr. Aman Mehta Director Mr. Bharat Doshi Director
Mr. D. Shivakumar Director Dr. Omkar Goswami Director
Ms. Ireena Vittal Director Mr. Narendra Ambwani Director
Auditors ‐ Kalyaniwalla & Mistry ‐ Chartered Accountants
*as per last annual report

13 Edelweiss Securities Limited
Company Absolute
reco Relative
reco Relative
risk
Company Absolute
reco
Relative
reco
Relative
Risk
Asian Paints BUY SO M Bajaj Corp HOLD SU H
Berger Paints BUY SO L Britannia Industries BUY SO L
Colgate HOLD SP M Dabur BUY SO M
Emami BUY SO H GlaxoSmithKline Consumer
Healthcare
HOLD SU M
Godrej Consumer BUY SO H Hindustan Unilever HOLD SP L
ITC BUY SO M Marico BUY SO M
Nestle Ltd HOLD SP L Pidilite Industries BUY SO M
United Spirits HOLD SP H
RATING & INTERPRETATION
ABSOLUTE RATING
Ratings Expected absolute returns over 12 months
Buy More than 15%
Hold Between 15% and - 5%
Reduce Less than -5%
RELATIVE RETURNS RATING
Ratings Criteria
Sector Outperformer (SO) Stock return > 1.25 x Sector return
Sector Performer (SP) Stock return > 0.75 x Sector return
Stock return < 1.25 x Sector return
Sector Underperformer (SU) Stock return < 0.75 x Sector return
Sector return is market cap weighted average return for the coverage universe within the sector
RELATIVE RISK RATING
Ratings Criteria
Low (L) Bottom 1/3rd percentile in the sector
Medium (M) Middle 1/3rd percentile in the sector
High (H) Top 1/3rd percentile in the sector
Risk ratings are based on Edelweiss risk model
SECTOR RATING
Ratings Criteria
Overweight (OW) Sector return > 1.25 x Nifty return
Equalweight (EW) Sector return > 0.75 x Nifty return
Sector return < 1.25 x Nifty return
Underweight (UW) Sector return < 0.75 x Nifty return

14 Edelweiss Securities Limited
Consumer Goods
Edelweiss Securities Limited, Edelweiss House, off C.S.T. Road, Kalina, Mumbai – 400 098.
Board: (91‐22) 4009 4400, Email: [email protected]
Aditya Narain
Head of Research
Coverage group(s) of stocks by primary analyst(s): Consumer Goods
Asian Paints, Bajaj Corp, Berger Paints, Britannia Industries, Colgate, Dabur, Godrej Consumer, Emami, Hindustan Unilever, ITC, Marico, Nestle Ltd, Pidilite Industries, GlaxoSmithKline Consumer Healthcare, United Spirits
Distribution of Ratings / Market Cap
Edelweiss Research Coverage Universe
Rating Distribution* 161 67 11 240* 1stocks under review
Market Cap (INR) 156 62 11
Date Company Title Price (INR) Recos
Recent Research
08‐May‐17 Emami Lacklustre show; FY18 hinges on innovation, distribution; Result Update
1,085 Buy
03‐May‐17 Marico Strong volume growth; GST, inflationary scenario to bode well; Result Update
315 Buy
02‐May‐17 DaburIndia
Volumes in revival mode; GST key monitorable; Result Update
287 Buy
> 50bn Between 10bn and 50 bn < 10bn
Buy Hold Reduce Total
Rating Interpretation
Buy appreciate more than 15% over a 12‐month period
Hold appreciate up to 15% over a 12‐month period
Reduce depreciate more than 5% over a 12‐month period
Rating Expected to
One year price chart
1,000
1,200
1,400
1,600
1,800
2,000
May‐16
May‐16
Jun‐16
Jul‐16
Jul‐16
Aug‐16
Sep‐16
Oct‐16
Oct‐16
Nov‐16
Dec‐16
Dec‐16
Jan‐17
Feb‐17
Feb‐17
Mar‐17
Apr‐17
Apr‐17
(INR)
Godrej Consumer Products
15 Edelweiss Securities Limited
Godrej Consumer
DISCLAIMER
Edelweiss Securities Limited (“ESL” or “Research Entity”) is regulated by the Securities and Exchange Board of India (“SEBI”) and is licensed to carry on the business of broking, depository services and related activities. The business of ESL and its Associates (list available on www.edelweissfin.com) are organized around five broad business groups – Credit including Housing and SME Finance, Commodities, Financial Markets, Asset Management and Life Insurance.
This Report has been prepared by Edelweiss Securities Limited in the capacity of a Research Analyst having SEBI Registration No.INH200000121 and distributed as per SEBI (Research Analysts) Regulations 2014. This report does not constitute an offer or solicitation for the purchase or sale of any financial instrument or as an official confirmation of any transaction. Securities as defined in clause (h) of section 2 of the Securities Contracts (Regulation) Act, 1956 includes Financial Instruments and Currency Derivatives. The information contained herein is from publicly available data or other sources believed to be reliable. This report is provided for assistance only and is not intended to be and must not alone be taken as the basis for an investment decision. The user assumes the entire risk of any use made of this information. Each recipient of this report should make such investigation as it deems necessary to arrive at an independent evaluation of an investment in Securities referred to in this document (including the merits and risks involved), and should consult his own advisors to determine the merits and risks of such investment. The investment discussed or views expressed may not be suitable for all investors.
This information is strictly confidential and is being furnished to you solely for your information. This information should not be reproduced or redistributed or passed on directly or indirectly in any form to any other person or published, copied, in whole or in part, for any purpose. This report is not directed or intended for distribution to, or use by, any person or entity who is a citizen or resident of or located in any locality, state, country or other jurisdiction, where such distribution, publication, availability or use would be contrary to law, regulation or which would subject ESL and associates / group companies to any registration or licensing requirements within such jurisdiction. The distribution of this report in certain jurisdictions may be restricted by law, and persons in whose possession this report comes, should observe, any such restrictions. The information given in this report is as of the date of this report and there can be no assurance that future results or events will be consistent with this information. This information is subject to change without any prior notice. ESL reserves the right to make modifications and alterations to this statement as may be required from time to time. ESL or any of its associates / group companies shall not be in any way responsible for any loss or damage that may arise to any person from any inadvertent error in the information contained in this report. ESL is committed to providing independent and transparent recommendation to its clients. Neither ESL nor any of its associates, group companies, directors, employees, agents or representatives shall be liable for any damages whether direct, indirect, special or consequential including loss of revenue or lost profits that may arise from or in connection with the use of the information. Our proprietary trading and investment businesses may make investment decisions that are inconsistent with the recommendations expressed herein. Past performance is not necessarily a guide to future performance .The disclosures of interest statements incorporated in this report are provided solely to enhance the transparency and should not be treated as endorsement of the views expressed in the report. The information provided in these reports remains, unless otherwise stated, the copyright of ESL. All layout, design, original artwork, concepts and other Intellectual Properties, remains the property and copyright of ESL and may not be used in any form or for any purpose whatsoever by any party without the express written permission of the copyright holders.
ESL shall not be liable for any delay or any other interruption which may occur in presenting the data due to any reason including network (Internet) reasons or snags in the system, break down of the system or any other equipment, server breakdown, maintenance shutdown, breakdown of communication services or inability of the ESL to present the data. In no event shall ESL be liable for any damages, including without limitation direct or indirect, special, incidental, or consequential damages, losses or expenses arising in connection with the data presented by the ESL through this report.
We offer our research services to clients as well as our prospects. Though this report is disseminated to all the customers simultaneously, not all customers may receive this report at the same time. We will not treat recipients as customers by virtue of their receiving this report.
ESL and its associates, officer, directors, and employees, research analyst (including relatives) worldwide may: (a) from time to time, have long or short positions in, and buy or sell the Securities, mentioned herein or (b) be engaged in any other transaction involving such Securities and earn brokerage or other compensation or act as a market maker in the financial instruments of the subject company/company(ies) discussed herein or act as advisor or lender/borrower to such company(ies) or have other potential/material conflict of interest with respect to any recommendation and related information and opinions at the time of publication of research report or at the time of public appearance. ESL may have proprietary long/short position in the above mentioned scrip(s) and therefore should be considered as interested. The views provided herein are general in nature and do not consider risk appetite or investment objective of any particular investor; readers are requested to take independent professional advice before investing. This should not be construed as invitation or solicitation to do business with ESL.

16 Edelweiss Securities Limited
Consumer Goods
ESL or its associates may have received compensation from the subject company in the past 12 months. ESL or its associates may have managed or co‐managed public offering of securities for the subject company in the past 12 months. ESL or its associates may have received compensation for investment banking or merchant banking or brokerage services from the subject company in the past 12 months. ESL or its associates may have received any compensation for products or services other than investment banking or merchant banking or brokerage services from the subject company in the past 12 months. ESL or its associates have not received any compensation or other benefits from the Subject Company or third party in connection with the research report. Research analyst or his/her relative or ESL’s associates may have financial interest in the subject company. ESL and/or its Group Companies, their Directors, affiliates and/or employees may have interests/ positions, financial or otherwise in the Securities/Currencies and other investment products mentioned in this report. ESL, its associates, research analyst and his/her relative may have other potential/material conflict of interest with respect to any recommendation and related information and opinions at the time of publication of research report or at the time of public appearance.
Participants in foreign exchange transactions may incur risks arising from several factors, including the following: ( i) exchange rates can be volatile and are subject to large fluctuations; ( ii) the value of currencies may be affected by numerous market factors, including world and national economic, political and regulatory events, events in equity and debt markets and changes in interest rates; and (iii) currencies may be subject to devaluation or government imposed exchange controls which could affect the value of the currency. Investors in securities such as ADRs and Currency Derivatives, whose values are affected by the currency of an underlying security, effectively assume currency risk.
Research analyst has served as an officer, director or employee of subject Company: No
ESL has financial interest in the subject companies: No
ESL’s Associates may have actual / beneficial ownership of 1% or more securities of the subject company at the end of the month immediately preceding the date of publication of research report.
Research analyst or his/her relative has actual/beneficial ownership of 1% or more securities of the subject company at the end of the month immediately preceding the date of publication of research report: No
ESL has actual/beneficial ownership of 1% or more securities of the subject company at the end of the month immediately preceding the date of publication of research report: No
Subject company may have been client during twelve months preceding the date of distribution of the research report.
There were no instances of non‐compliance by ESL on any matter related to the capital markets, resulting in significant and material disciplinary action during the last three years except that ESL had submitted an offer of settlement with Securities and Exchange commission, USA (SEC) and the same has been accepted by SEC without admitting or denying the findings in relation to their charges of non registration as a broker dealer.
A graph of daily closing prices of the securities is also available at www.nseindia.com
Analyst Certification:
The analyst for this report certifies that all of the views expressed in this report accurately reflect his or her personal views about the subject company or companies and its or their securities, and no part of his or her compensation was, is or will be, directly or indirectly related to specific recommendations or views expressed in this report.
Additional Disclaimers
Disclaimer for U.S. Persons
This research report is a product of Edelweiss Securities Limited, which is the employer of the research analyst(s) who has prepared the research report. The research analyst(s) preparing the research report is/are resident outside the United States (U.S.) and are not associated persons of any U.S. regulated broker‐dealer and therefore the analyst(s) is/are not subject to supervision by a U.S. broker‐dealer, and is/are not required to satisfy the regulatory licensing requirements of FINRA or required to otherwise comply with U.S. rules or regulations regarding, among other things, communications with a subject company, public appearances and trading securities held by a research analyst account.
This report is intended for distribution by Edelweiss Securities Limited only to "Major Institutional Investors" as defined by Rule 15a‐6(b)(4) of the U.S. Securities and Exchange Act, 1934 (the Exchange Act) and interpretations thereof by U.S. Securities and Exchange Commission (SEC) in reliance on Rule 15a 6(a)(2). If the recipient of this report is not a Major Institutional Investor as specified above, then it should not act upon this report and return the same to the sender. Further, this report may not be copied, duplicated and/or transmitted onward to any U.S. person, which is not the Major Institutional Investor.

17 Edelweiss Securities Limited
Godrej Consumer
Access the entire repository of Edelweiss Research on www.edelresearch.com
In reliance on the exemption from registration provided by Rule 15a‐6 of the Exchange Act and interpretations thereof by the SEC in order to conduct certain business with Major Institutional Investors, Edelweiss Securities Limited has entered into an agreement with a U.S. registered broker‐dealer, Edelweiss Financial Services Inc. ("EFSI"). Transactions in securities discussed in this research report should be effected through Edelweiss Financial Services Inc. Disclaimer for U.K. Persons
The contents of this research report have not been approved by an authorised person within the meaning of the Financial Services and Markets Act 2000 ("FSMA"). In the United Kingdom, this research report is being distributed only to and is directed only at (a) persons who have professional experience in matters relating to investments falling within Article 19(5) of the FSMA (Financial Promotion) Order 2005 (the “Order”); (b) persons falling within Article 49(2)(a) to (d) of the Order (including high net worth companies and unincorporated associations); and (c) any other persons to whom it may otherwise lawfully be communicated (all such persons together being referred to as “relevant persons”). This research report must not be acted on or relied on by persons who are not relevant persons. Any investment or investment activity to which this research report relates is available only to relevant persons and will be engaged in only with relevant persons. Any person who is not a relevant person should not act or rely on this research report or any of its contents. This research report must not be distributed, published, reproduced or disclosed (in whole or in part) by recipients to any other person. Disclaimer for Canadian Persons
This research report is a product of Edelweiss Securities Limited ("ESL"), which is the employer of the research analysts who have prepared the research report. The research analysts preparing the research report are resident outside the Canada and are not associated persons of any Canadian registered adviser and/or dealer and, therefore, the analysts are not subject to supervision by a Canadian registered adviser and/or dealer, and are not required to satisfy the regulatory licensing requirements of the Ontario Securities Commission, other Canadian provincial securities regulators, the Investment Industry Regulatory Organization of Canada and are not required to otherwise comply with Canadian rules or regulations regarding, among other things, the research analysts' business or relationship with a subject company or trading of securities by a research analyst. This report is intended for distribution by ESL only to "Permitted Clients" (as defined in National Instrument 31‐103 ("NI 31‐103")) who are resident in the Province of Ontario, Canada (an "Ontario Permitted Client"). If the recipient of this report is not an Ontario Permitted Client, as specified above, then the recipient should not act upon this report and should return the report to the sender. Further, this report may not be copied, duplicated and/or transmitted onward to any Canadian person. ESL is relying on an exemption from the adviser and/or dealer registration requirements under NI 31‐103 available to certain international advisers and/or dealers. Please be advised that (i) ESL is not registered in the Province of Ontario to trade in securities nor is it registered in the Province of Ontario to provide advice with respect to securities; (ii) ESL's head office or principal place of business is located in India; (iii) all or substantially all of ESL's assets may be situated outside of Canada; (iv) there may be difficulty enforcing legal rights against ESL because of the above; and (v) the name and address of the ESL's agent for service of process in the Province of Ontario is: Bamac Services Inc., 181 Bay Street, Suite 2100, Toronto, Ontario M5J 2T3 Canada. Disclaimer for Singapore Persons
In Singapore, this report is being distributed by Edelweiss Investment Advisors Private Limited ("EIAPL") (Co. Reg. No. 201016306H) which is a holder of a capital markets services license and an exempt financial adviser in Singapore and (ii) solely to persons who qualify as "institutional investors" or "accredited investors" as defined in section 4A(1) of the Securities and Futures Act, Chapter 289 of Singapore ("the SFA"). Pursuant to regulations 33, 34, 35 and 36 of the Financial Advisers Regulations ("FAR"), sections 25, 27 and 36 of the Financial Advisers Act, Chapter 110 of Singapore shall not apply to EIAPL when providing any financial advisory services to an accredited investor (as defined in regulation 36 of the FAR. Persons in Singapore should contact EIAPL in respect of any matter arising from, or in connection with this publication/communication. This report is not suitable for private investors.
Copyright 2009 Edelweiss Research (Edelweiss Securities Ltd). All rights reserved