gobi altai, khangai and khentii mountains mapped by a
TRANSCRIPT

HAL Id: hal-03269846https://hal.archives-ouvertes.fr/hal-03269846
Submitted on 24 Jun 2021
HAL is a multi-disciplinary open accessarchive for the deposit and dissemination of sci-entific research documents, whether they are pub-lished or not. The documents may come fromteaching and research institutions in France orabroad, or from public or private research centers.
L’archive ouverte pluridisciplinaire HAL, estdestinée au dépôt et à la diffusion de documentsscientifiques de niveau recherche, publiés ou non,émanant des établissements d’enseignement et derecherche français ou étrangers, des laboratoirespublics ou privés.
Distributed under a Creative Commons Attribution| 4.0 International License
Gobi Altai, Khangai and Khentii Mountains mapped bya mixed-method cartographic approach for comparative
geophysical analysisPolina Lemenkova
To cite this version:Polina Lemenkova. Gobi Altai, Khangai and Khentii Mountains mapped by a mixed-method carto-graphic approach for comparative geophysical analysis. Mongolian Geoscientist, 2021, 26 (52), pp.62- 79. �10.5564/mgs.v26i52.1512�. �hal-03269846�

Lemenkova, 2021. Mongolian Geoscientist 26 (52) 62-79
DOI: https://doi.org/10.5564/mgs.v26i52.1512
62
ABSTRACT
Geologic and geophysical mapping has been so far limited to the traditional single-method GIS-based mapping. A new approach combining integrated analysis of data on geology, gravity, topography and geomorphology is presented for regional characterization of the geophysical setting in Mongolia: the Gobi Altai Mountains, the Khangai Mountains and Khentii Mountains with surrounding areas. Nine new maps have been produced from the high-resolution datasets: GEBCO, gravity raster, USGS geological data and SRTM-90 DEM geomorphological grid. Methodology includes three tools for cartographic data visualization: i) Generic Mapping Tools (GMT), ii) R programming language (‘raster’ and ‘tmap’ libraries); iii) QGIS. The results demonstrated strong agreement between the estimated values in gravity and topography grids, distribution of geological units and provinces over the country and geomorphological landforms with respect to the mountain ranges: Altai, Khangai and Khentii Mountains. The highest values in the gravity anomalies correspond to the mountain ranges in the Altai Mountains and Khangai Mountains (<80 mGal); high values correspond to the Khentii Mountains (20–60 mGal). Contrariwise, the basins of the Uvs Nuur and Khyargas Nuur show negative values (<-80 mGal). The NE- to NNE-oriented faulting and rift basins are clearly visible in the geophysical grids and geologic maps. The geomorphometric analysis performed based on the SRTM-90 DEM using R scripting demonstrated (1) slope, (2) aspect, (3) hillshade and (4) elevation models of Mongolia supported by histograms of data distribution and frequency. The study contributed to the cartographic methods and regional geological studies of Mongolia. Keywords: machine learning, automatization, Mongolia, GMT, R
ARTICLE INFO
Article history:
Received 21 February, 2021
Accepted 27 May, 2021
Gobi Altai, Khangai and Khentii Mountains mapped by a mixed-method cartographic approach for comparative geophysical analysis
Polina Lemenkova*
Department of Natural Disasters, Anthropogenic Hazards and Seismicity of the Earth, Schmidt Institute of Physics of the Earth, Russian Academy of Sciences, 123995, Russia.
*Corresponding author: [email protected] , ORCID: 0000-0002-5759-1089
© The Author(s). 2021 Open access This article is distributed under the terms of the Creative Commons Attribution 4.0 International License (https://creativecommons.org/licenses/by/4.0/), which permits unrestricted use, distribution, and reproduction in any medium, provided you give appropriate credit to the original author(s) and source, provide a link to the Creative Commons license, and indicate if changes were made.
INTRODUCTION Analysis of the correlations between the geophysical setting, topographic structure and subsurface geological processes is one of the challenging research problems in Earth sciences. This paper presents an integrated cartographical analysis of the geophysical and geological
setting of the Mongolian region, which has extremely specific and diverse geographic, geophysical and geological setting. The study area belongs to the Central Asian Orogenic Fold Belt, one of the largest accretionary orogens on Earth. The tectonics of Mongolia developed since Precambrian and experienced extensive
Original article
Mongolian Geoscientist

Lemenkova, 2021. Mongolian Geoscientist 26 (52) 62-79
63
tectonic movements up to the early Triassic which included episodes of continental growth and gradual geodynamical evolution. Mongolia is unique not only due to its geospatial location in the region of the Central Asia, but also the location between the oldest and largest tectonic structural elements of Asia. On the north, it crosses the Siberian platform which consists of the Proterozoic and Phanerozoic strata overlying the Archaean basement of the Siberian Craton. On the south, it borders the North China and Tarim platforms. The interaction of the tectonically different setting resulted in complex development and interplay of the fold belts and geologic complexes of different ages that occupy the entire region of Mongolia (Fig. 1). As a result of a complex tectonic history of Mongolia, its mountain structures are notably rich in ore and non-metallic minerals. Unique geological setting and mineral richness of the
country has long been attracting the attention of researchers. As a result, regular geophysical surveys in Mongolia have been undertaken to perform systematic geological exploration aimed at identifying patterns of spatial distribution of minerals. The aim of this paper, contributing to the existing works, is an extended integrated cartographic analysis using scripting methods of the Generic Mapping Tools (GMT) toolset and R programming language and synthesis of various aspects of geological, geophysical and geomorphological setting of Mongolia with a regional focus on its three units: Gobi Altai, Khangai and Khentii Mountains (Fig. 1). The framework of this paper applied the high-resolution datasets for geologic structural mapping, representation of major tectonic fold belts, folded regions, basins and geological provinces (e.g., Alashan, Altai-Sayan, Bogdashan, Temtsag Hailar, Tian Shan,
Fig. 1. Topographic map of Mongolia. Mapping: GMT. Source: author.

Lemenkova, 2021. Mongolian Geoscientist 26 (52) 62-79
64
Ulaanbaatar, Nyalga, Choibalsan Basin), mapping of geological units structurally divided by the age of formation, including both Precambrian and Phanerozoic eons, modeling geomorphological data by R language, and visualizing of a range of geophysical grid data (distribution of geoid and gravity field anomalies) for deep geophysical analysis of Mongolia. The improvements in cartographic data representation and visualization efficiency is a very important issue for the Earth sciences, especially geophysical and geological mapping. From a methodological point of view, mapping takes into account all aspects of data handling (data capture, data selection, data representation) and selection of methods (software, algorithms, functions) for preparation mapping layouts that effectively visualize geologic setting and geophysical anomalies with regard to the topography of the country. Integrated approach in Earth science signify the technical combination of geodata processing and geographic information systems (GIS) which includes both technical aspects of linking data processing with GIS, and the conceptual framework for linking technical issues with Earth sciences. Here cartographic issues present important contribution to geoscience as a supporting technological tools. Likewise, the conceptual framework is important because through technical tools cartography presents models of the Earth's structure and functionality of its elements (Dobson, 1992a, 1993). Besides technical issues of the cartographic data representation and mapping, regional geophysical aspects related to gravity and geoid of the terrain, geologic maps reflecting the tectonic processes, lithological and stratigraphic setting and early geologic evolution of the region are equally important for complex mapping of the region. In Mongolia, the variability of the topographic relief, geophysical anomalies, lithological setting and terrain surface varies over the country in W-E direction reflecting complex geologic formation and development, as well as tectonic processes that sculptured current geomorphology of the country. To undertake complex thematic mapping of
Mongolia, advanced cartographic methods of data representation and visualization are required. Methodological applications of GIS were under investigation both in pure cartographic research focused on technical issues of geoinformatics and data representation (Elidrissi et al. 2020; Gauger et al. 2007; Le Fillâtre et al. 2021; Araújo et al. 2019; Lemenkova, 2021, Höhle, 2021) and from the geological point of view (Gohl et al. 2006a, 2006b; Holguín and Sternberg, 2018; Graf et al. 2018). Difficulties in selecting suitable and optimal software for geologic mapping are caused both by the technical approaches of GIS (console- or menu-based) and by specific file format requirements (e.g., the QGIS reads the ArcGIS native .shp format, while GMT better operates with raster files, R 'raster' package enables direct SRTM file capture). Therefore, selecting GIS software and methods of geologic and geophysical mapping remains a challenge. Methods and tools for geomatic data analysis in geologic studies are diverse. Most of the GIS examples present methods of cartographic data visualization, cross-sectioning, plotting lithological stratigraphic columns, mapping, widely used in Earth sciences (Suetova et al. 2005), but others include statistical analysis, 3D modeling, environmental assessment (Lemenkova, 2020a; Klaučo et al. 2013, 2017), plotting ternary diagrams for petrochemical rock characteristics (Fanti et al. 2018; Lemenkova, 2019, 2020b), remote sensing based data capture and analysis. In contrast to these and other existing GIS-based geological studies, this research presents an innovative methodology of the geophysical mapping of Mongolia performed using the combination of the three cartographic approaches: scripting cartographic techniques by the Generic Mapping Tools (GMT), traditional GUI based cartographic visualization by the QGIS, and utilizing R programming language. This featured the efficiency of the programming and scripting application in cartography, because the machine learning methods adapted to the cartographic workflow increase the speed and precision of the data representation and improve graphical aesthetics of maps through the machine based graphics.

Lemenkova, 2021. Mongolian Geoscientist 26 (52) 62-79
65
GEOLOGICAL BACKGROUND Previous analysis of the geologic structure of Mongolia received from the existing literature sources shown significant variations in geological structure of the country varying spatially by the geographically distinct regions. Thus, the crust in southern Mongolia presents a part of the Central Asian Orogenic Belt, a vast accretionary orogen formed during opening and closure of the Palaeo-Asian Ocean in the late Proterozoic to Palaeozoic (Blight et al. 2010). Central Mongolian Baganuur Basin consists of the rift or pull-apart-basins subsided at the boundary between the Jurassic and the Lower Cretaceous in East Asia (Dill et al. 2004). Northern and central Mongolian coal-bearing basins contain mainly Jurassic sub-bituminous coal. Northern Mongolia is also notable for the North Khentii Gold belt which includes lode gold deposits: Gatsuurt, Sujigtei and Boroo (Kim et al. 2020). Eastern Mongolian province has Lower Cretaceous lignite (Erdenetsogt et al. 2009). Western part of central Mongolia is notable for the low rank bituminous coal in strata formed in the Permian period. Current crystalline basement of Mongolia was formed under the impact of complex history and geological evolution of Paleozoic terrane accretion and arc magmatism of the Central Asian Orogenic Belt that moved in southward direction to the Sulinkheer suture. The Sulinkheer highlights the closure of the Paleo-Asian Ocean in the late Permian to the Early Mesozoic (Miao et al., 2008). The tectonics of the Central-Eastern Mongolia was largely affected by the Indo-Asian collision and western Pacific subduction during Cenozoic. These processes finally resulted in present geography of Mongolia notable for the NE- to NNE-oriented faults and rift basins (Li et al. 2020a, 2020b). In general, the Central Asian Orogenic Belt grew southward in the Phanerozoic except for the Bayankhongor region in west-central Mongolia where the volcanic arc, accretionary prism, ophiolite and passive margin complexes accreted in NE moving off the Baydrag micro-continent (Osozawa et al. 2008). The variability of the Central Asian Orogenic Belt can be illustrated by the Gorkhi Formation in the Khangai–Khentei belt which consists of
the following stratigraphic elements: sandstone shale, alternating sandstone, shale of turbidite affinity, chert with intrusion of siliceous shale, basalt, limestone, clast-bearing mudstone (Kurihara et al. 2009). Remarkable geologic units of the Upper Mesozoic and Cenozoic stratigraphic sequences are presented by the actively evolving intra-continental Dzereg Basin located in the Altai, western Mongolia. The Dzereg Basin is sandwiched between the two ranges, marking the termination zones of the two regional-scale strike-slip fault systems (Howard et al. 2003). The geologic complexity of Mongolia largely resulted from the spatial variability of its tectonic evolution. For instance, the SE region of Mongolia (Gobi Desert) has been affected by the six major periods of deformation in the Paleozoic basement rocks and Mesozoic-Cenozoic basin of the East Gobi Basin, as defined by Heumann et al. (2018). The subduction and closure of the Mongolia-Okhotsk ocean marked the key event in Jurassic tectonics in Mongolia (Genyao et al. 2013). As a result, the basin evolution is roughly divided into the two main spatio-temporal marks with respect to the orogeny and collapse of the orogenic belt in Mongolia: i) the region to the north of the ocean was presented by the Early–Middle Jurassic basins developed from the back-arc extension; ii) the region to the south of the ocean was marked by the fossil sutures related to the subduction-related orogenesis. The southern Central Asian Orogenic Belt in SW Mongolia has a basin and range topography with Neoproterozoic and Palaeozoic units exposed at NW–SE directed ranges along major faults and with inter-montane basins filled by the Mesozoic and Cenozoic sediments (Hanžl et al. 2020). The Tugrug basin in the Gobi-Altai region of western Mongolia includes Mesozoic basins, normal faults, extensional growth strata, and partially inverted grabens (Johnson et al. 2015). The overall subsurface structure of the East Gobi basin reflects the Jurassic–Cretaceous intracontinental rift evolution through deposition of distinct stratigraphic sequences. Three major NE-SW-oriented fault zones divide the basin of Gobi into the following areas: i) North Zuunbayan strike-slip fault zone; ii) Unegt

Lemenkova, 2021. Mongolian Geoscientist 26 (52) 62-79
66
subbasin; iii) Zuunbayan subbasin (Johnson, 2004). The volcanic rocks of Mesozoic-Cenozoic age are distributed over Mongolia. Mesozoic volcanism in Mongolia is mainly emplaced during the late Jurassic-early Cretaceous. Late Cretaceous volcanism is mainly concentrated in East and South Mongolia. The continental deposits of the Mesozoic Era (Triassic (T), Jurassic (J), Cretaceous (C)) are widespread in Mongolia. The spatial difference in the distribution of these rocks can be illustrated by the dominating sedimentary complexes in the west and volcanic rocks in the east of the country. The Lower Triassic marine clastic rocks are recorded only in the NE of the country (Khentii Mountains). In contrast, the youngest rock complexes are presented by the Neogene (N) and Quaternary (Q) by the basalts and loose sediments (clay, sand, gravel).
METHODS AND MATERIALS
In this article, an integrated method combining several technical cartographic tools is proposed for complex geological, topographic and geophysical mapping of Mongolia. The integration of multi-source data for the analysis of geological data in context of regional topography and detecting relationships with satellite gravimetric data reflecting the deep geodynamic setting is an effective and practical technical tool for regional geomorphological and geophysical mapping. This includes including data capture, conversion, processing, representation and comprehensive geologic visualization for regional interpretation. Complex multi-source data analysis presents the basis for assessment of the effects of the geological and topographic factors on the variations in the geophysical phenomena, such as Earth’s gravity. Specifically, the gravitational effect of an Earth approximating ellipsoid is reflected in the satellite altimetry measurements, which well correlate with gravity anomalies caused by the deficit of the topographic masses in the depressions and the increase of the land masses in the mountain areas. The examples of such integrated approaches exist (Badarch et al. 2002; Badarch and Tomurtogoo, 2001; Yu et al. 2019).
Following the proposed approaches, this study adopts several datasets and technical tools for integrated mapping of Mongolia. Specifically, the GMT scripting toolset was used for topographic and geophysical mapping, Quantum GIS for geological mapping and libraries of R programming language for geomorphometric algorithm of terrain data modeling. The details of the techniques are explained in the respective sections below with examples of codes and scripts provided. The procedure of computing the geomorphological models consisted of two steps: (i) data capture and processing by the R library using embedded algorithms for slope, aspect, elevation and hill shade modeling (based on topographic DEM of Mongolia) from the heights grid; and (ii) visual representation of the geomorphometric parameters of Mongolia with statistical histograms of frequency of data distribution for the region of the study area by appying the ‘tmap’ library (map are shown in Fig. 6-9).
Data For topographic mapping (Fig. 1), this research used dataset from the General Bathymetric Chart of the Oceans (GEBCO) in which topographic and bathymetric coverage of the Earth is estimated using international cooperation by remote sensing measurements which resulted in high-resolution (15 arc-second, ca. 450 km) global grid (Schenke, 2016). To extract values for Mongolia from GEBCO, the ‘clip’ module of GMT was applied and used by the coordinates. The gravity grid has been mapped based on satellite derived data (Sandwell et al. 2014). The accuracy of the SRTM data is 90 m, while the accuracy of the GEBCO is 15 arc second. The Faye's gravity anomaly presents the free-air anomaly adjusted by the terrain correction. Computing the Faye's anomaly grid is necessary for modeling gravity anomaly data since it relates to the topographically corrected gravity anomalies restored by the Bouguer effect. Hence, the topography corrected anomaly with the considered effect of a Bouguer slab computed the Faye's anomaly. The geological analysis of data derived from the
Lemenkova, 2021. Mongolian Geoscientist 26 (52) 62-79
67
USGS Geological Survey shows that the region of Mongolia includes all age complexes of rocks. The ages of the outcrops include the range starting from the Precambrian units until the Quaternary constituting the geological structure of the country. The oldest complexes are common in all fold systems of Mongolia and are presented by the late Caledonian orogeny from the Ordovician to Early Devonian episodic phases of mountain building, and the Hercynian orogeny from the Late Paleozoic. The oldest complexes are represented by altered metamorphic rocks presented in two major complexes of Mongolia: i) dominating gneiss, marbles and amphibolite metamorphic rocks; and ii) dominating carbonate and quartzites. Comparing spatial differences in the geology of Mongolia, the ancient rock complexes are mostly distributed in the western half of the country, while Quaternary sediments mostly
dominate in the east. The Gobi Desert, located in the southern region of the country, is presented by the zone of the South Mongolian Hercynides, eugeosyncline complexes of the Silurian (S) and Devonian (D) and Carboniferous (C) age are developed. These complexes are marked by the very thick deposits of sediment from the former marine zone of the Paleozoic in which the products of volcanic activity are associated with clastic sediments. These include the greenstone volcanics of various composits, jasper, schist and greywacke formations. The Khangai and Khentii Mountains, located in the Central and NE regions of Mongolia are formed by the structures composed of geosyncline Devonian and Carboniferous siliceous terrigenous and shale complexes. The Paleozoic orogenic marine and continental formations of the Hercynides are represented by
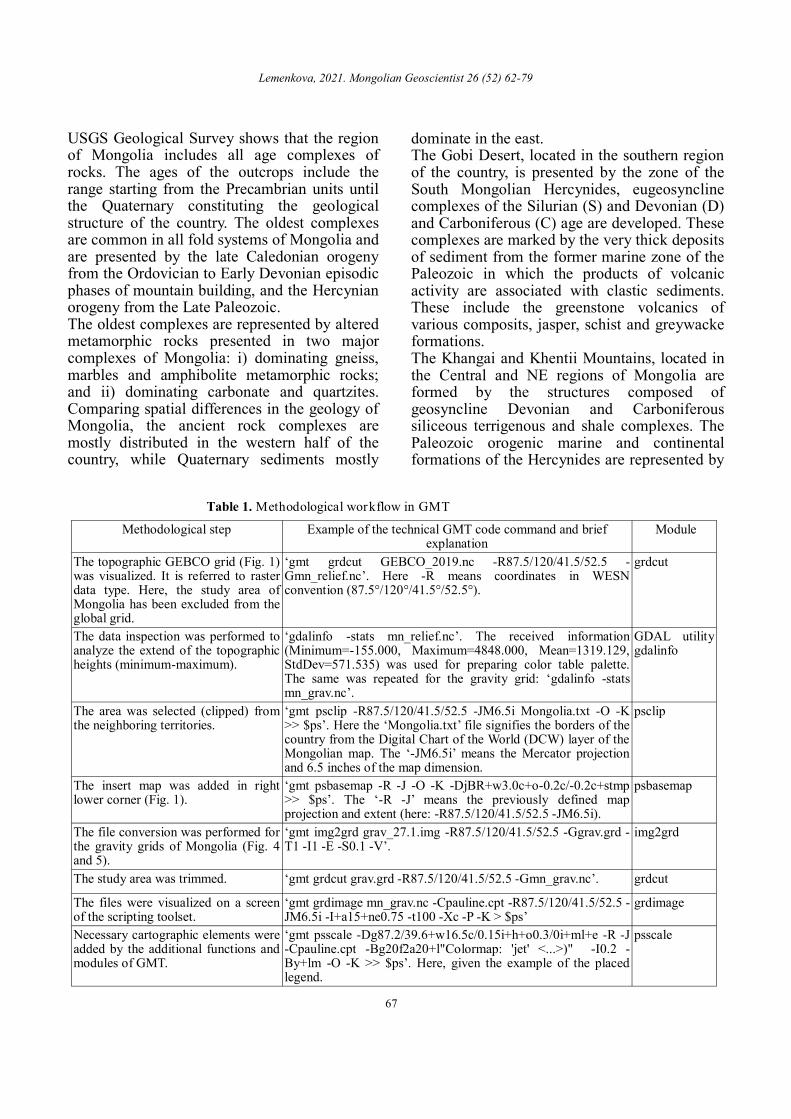
Methodological step Example of the technical GMT code command and brief explanation
Module
The topographic GEBCO grid (Fig. 1) was visualized. It is referred to raster data type. Here, the study area of Mongolia has been excluded from the global grid.
‘gmt grdcut GEBCO_2019.nc -R87.5/120/41.5/52.5 -Gmn_relief.nc’. Here -R means coordinates in WESN convention (87.5°/120°/41.5°/52.5°).
grdcut
The data inspection was performed to analyze the extend of the topographic heights (minimum-maximum).
‘gdalinfo -stats mn_relief.nc’. The received information (Minimum=-155.000, Maximum=4848.000, Mean=1319.129, StdDev=571.535) was used for preparing color table palette. The same was repeated for the gravity grid: ‘gdalinfo -stats mn_grav.nc’.
GDAL utility gdalinfo
The area was selected (clipped) from the neighboring territories.
‘gmt psclip -R87.5/120/41.5/52.5 -JM6.5i Mongolia.txt -O -K >> $ps’. Here the ‘Mongolia.txt’ file signifies the borders of the country from the Digital Chart of the World (DCW) layer of the Mongolian map. The ‘-JM6.5i’ means the Mercator projection and 6.5 inches of the map dimension.
psclip
The insert map was added in right lower corner (Fig. 1).
‘gmt psbasemap -R -J -O -K -DjBR+w3.0c+o-0.2c/-0.2c+stmp >> $ps’. The ‘-R -J’ means the previously defined map projection and extent (here: -R87.5/120/41.5/52.5 -JM6.5i).
psbasemap
The file conversion was performed for the gravity grids of Mongolia (Fig. 4 and 5).
‘gmt img2grd grav_27.1.img -R87.5/120/41.5/52.5 -Ggrav.grd -T1 -I1 -E -S0.1 -V’.
img2grd
The study area was trimmed. ‘gmt grdcut grav.grd -R87.5/120/41.5/52.5 -Gmn_grav.nc’. grdcut
The files were visualized on a screen of the scripting toolset.
‘gmt grdimage mn_grav.nc -Cpauline.cpt -R87.5/120/41.5/52.5 -JM6.5i -I+a15+ne0.75 -t100 -Xc -P -K > $ps’
grdimage
Necessary cartographic elements were added by the additional functions and modules of GMT.
‘gmt psscale -Dg87.2/39.6+w16.5c/0.15i+h+o0.3/0i+ml+e -R -J -Cpauline.cpt -Bg20f2a20+l"Colormap: 'jet' <...>)" -I0.2 -By+lm -O -K >> $ps’. Here, given the example of the placed legend.
psscale
Table 1. Methodological workflow in GMT

Lemenkova, 2021. Mongolian Geoscientist 26 (52) 62-79
68
a variety of clastic and volcanic rocks of the Upper Carboniferous and Permian episodes.
Mapping by QGIS In this research section, the QuantumGIS (QGIS.org, 2021) was used for mapping Fig. 2 and 3. Here the geologic data (units and provinces) on Mongolia have been visualized by using the USGS vector input data in the ArcGIS shape format (.shp) and the key categorical values on units and provinces were mapped by the Layout Manager using attributes values of the key columns of the geological data. The outputs are presented in Fig. 2 and 3.
Mapping by GMT The topographic and geophysical mapping and analysis was carried out using the Generic Mapping Tools (GMT) cartographic scripting toolset manufactured by Wessel et al. (2019). Each line of the code performed using specific modules of GMT produces an element plotted on the map: colored cover image, placed and adjusted legend, text annotations, modeled isolines and contours, riverine network, etc. To map the topographic and geophysical maps of Mongolia using the proposed GMT methodology in modular console-based structure, separate modules of GMT have been used in this analysis for stepwise cartographic visualization and data representation, explained in details in Table 1 below. Similar logic as demonstrated in the Table 1 has
been applied for mapping Fig. 1, 4 and 5 for topographic and geophysical data of Mongolia.
Mapping by R Programming by Python and R is the most common approach used in data sciences (Casanova-Arenillas et al. 2020; Gao et al. 2021). However, the application of R programming (R Core Team, 2020) as applied scripting is possible for geomorphologic data visualization using special cartographic R packages: ‘tmap’ (Tennekes, 2012) and ‘raster’ (Hijmans and van Etten, 2012). The data representation has been performed using RStudio environment (RStudio Team, 2017). The analysis of the geodata by R is summarized and presented in Table 2 with some technical methodological comments and explanations. The method has been developed using a combination of the two libraries of R, the ‘tmap’ and the ‘raster’. The method consists in the semi-automatic geomorphometric model and data extraction from SRTM-90 DEM, which is based on the two main processes: i) modeling slope, raster, elevation and hillshade by 'raster' package; ii) cartographic adjustments by ‘tmap’ package. After the models were received, the models were visualized using cartographic package ‘tmap’ which consists of the combination of codes and functions. That means, every cartographic element has been defined using the functionality of the package. The general
Methodological step Technical R code command and comment Function
The data have been captured. alt = getData("alt", country = "Mongolia", path = tempdir()) getData
Modeling of slope and aspect has been performed by embedded algo-rithm.
slope = terrain(alt, opt = "slope"). Here the algorithms was repeated for the aspect with replaced word ‘aspect’.
terrain
The hill shade was modeled hill = hillShade(slope, aspect, angle = 40, direction = 270). hillShade
Selecting plotting mode. Before the processing, the plotting mode was set up: tmap_mode("plot").
mode
Examining color palette The color palette was explored using the following function: tmaptools::palette_explorer().
tmaptools
Plotting graticule on the maps ‘tm_graticules(ticks = T, lines = T, labels.rot = c(15, 15), col = "azure3", lwd = 1, labels.size = 1.0).
tm_graticules
Plotting compass on the maps tm_compass(type = "radar", position=c("right", "top"), size = 8.0)
tm_compass
Table 2. Methodological workflow in R language

Lemenkova, 2021. Mongolian Geoscientist 26 (52) 62-79
69
scheme of coding consists in the following structure: map1 <- tmap_style("beaver") + tm_shape(slope, name = "Slope", title = "Slope") + tm_raster() + tm_scale_bar(). Each function was then adjusted using its special syntax which is filled in the brackets. The same procedure has been repeated for the Fig. 6-9. The resulting outputs are presented in the respective maps showing SRTM-90 DEM based geomorphometric modeling (slope, aspect, elevation and hillshade) of the topographic terrain relief of Mongolia.
RESULTS Fig. 1 shows the relief of Mongolia which presents a plateau with elevated plain at an altitude of 571-1320 m above sea level according to the GEBCO grid. The inspection of the grid gives the following results of the topography of Mongolia: data range from
minimum of -155.0 m to a maximum of 4848.0 m with mean at 1319.129 m and standard deviation (StdDev) at 571.535 m. The topography presents a slightly dissected, partially flat surface terrain, separated from the adjacent regions. Fig. 2 illustrates the disposition of the general geologic provinces of Mongolia. The Mongol-Okhotsk Fold Belt (dark blue color in Fig. 2) has a dominating place in the geology of Mongolia controlling its evolution. The Mongol-Okhotsk Fold Belt was formed in the Late Proterozoic period (Riphean-Vend) and then continued developing in the Paleozoic. The Mongol-Okhotsk Fold Belt presents a collision nappe-fold geologic structure, complicated by the intercontinental rifts. Another notable structure is presented by the Altay–Sayan Fold Belt (cyan color in Fig. 2) extending in the south-western region of the
Fig. 2. Geologic provinces of Mongolia. Data: USGS geological survey. Mapping: QGIS. Source: author.

Lemenkova, 2021. Mongolian Geoscientist 26 (52) 62-79
70
country. The Alashan-Yinshan fold and thrust belt is located in the south of the country stretching further to northern China to Yinshan Da and Xiao Hingganling Uplift in the south-east of the country which corresponds to the Lesser Khingan mountain range in the NE section of the Heilongjiang province, NE China. The variability of the geologic provinces, their complex disposition and overlapping reflect the geologic evolution of Mongolia. Fig. 3 shows the geologic units of Mongolia
where the complexity and a variety of various units and outcrops are visible. Among others, the units include the following most important geological structures in Mongolia: Ordovician Cambrian (CmO), Carboniferous (C), Cambrian (Cm), Devonian (D), Jurassic (J), Jurassic Cretaceous (JK), Cretaceous (K), Triassic (Tr), Tertiary (T), Quaternary (Q), Permian (P), Paleozoic (PZ). The variability of geometry in the outcrops as well as folds and faults within the region of Mongolia and the distribution of
Fig. 3. Geologic units of Mongolia. Data: USGS geological survey. The geological map covers the whole area of Mongolia and encompasses the landscapes within the Central Asian fold belt, formed by a complex mixture of all age complexes of rocks, from the Precambrian undifferentiated up to Cenozoic blocks formed the geological structure of Mongolia. The modern geologic units have following major elements: 1) Paleozoic highlands form elevated blocks represented by lower (Cambrian, Cm) in south-west and central Mongolia, Ordovician (O), Silurian (S), Devonian and Carboniferous (D, C), Permian (P); 2) Mesozoic hill areas of country in the north (M) with the differentiated Triassic (Tr) and Jurassic (J) outcrops in rugged, dissected landscapes and Cretaceous (K); 3) The eastern area of Gobi Desert is characterized by the Cenozoic (Paleogene, Pg) complexes which are present along much of the eastern region. (3) Extensive highland areas infilled with late Paleozoic (Carboniferous and Permian, CP) sediments include the Khentii Mountains (orange colors). The Devonian (D) complexes are notable in the west of the country in the Altai Mountains (ocher color). W, SW and central regions are presented by Quaternary (Q) basalt fields forming gently rolling surfaces. Mapping: QGIS. Source: author.

Lemenkova, 2021. Mongolian Geoscientist 26 (52) 62-79
71
various units showing sediments of different ages suggest that the initially formed basin have been transpressionally developed by faulting. Fig. 4 demonstrates the free-air gravity anomaly of Mongolia in Faye’s reduction. The terrain corrections for gravity data were included in the original dataset by the altimetry data from DEM. These consider the gravitational effect of the topography above m.s.l. near the estimating point. The terrain corrections are calculated in the free-air anomalies to obtain the topographically corrected anomaly data in the original dataset. The gravity grid has been mapped based on satellite derived marine gravity anomaly grid (Sandwell et al. 2014) and presents the high-resolution (1 arc-minute) data on gravity. According to the received results, the data range shows the following statistics: minimum =-233.017 mGal, maximum =
392.418 mGal, mean = -16.450 mGal, StdDev = 41.153 mGal.
CONCLUSIONS The area of the modern glacier in Mt. Tsambagarav in the Mongolian Altai Mountain Range in western Mongolia is reviewed in 1977, 1991, 2002 and 2017 using NDSI, NDPCSI and Landsat data. During the last 40 years the Mt. Tsambagarav has lost about ~52% of its modern glacier. The continuous trend in decrease of the modern glacier in Mt. Tsambagarav over the last seven decades coincided with those resulted from high mountains in the Mongolian Altai, which may have been related to impact of global warming. For further estimation of the impact of climate change on the modern glaciers, detailed field survey and geochronological analysis are required to check the spatial analysis presented
Fig. 4. Free-air gravity anomaly (Faye’s corrections) over the region of Mongolia (41.5°N to 52.5°N to 87.5°E to 120°E) demonstrates the strength of the Earth’s gravity minus the gravitational effect of an Earth approximating ellipsoid and the effect of topography relative to the topographic elevations at each pixel of the grid according to the resolution (1 arc-minute grid, based on the EGM-2008 dataset). Mapping: GMT. Source: author.

Lemenkova, 2021. Mongolian Geoscientist 26 (52) 62-79
72
in this study. Such work allows us to gain the complete understanding of response of the modern glacier in the high mountains of Mongolia to the climate and other controlling drivers. Hence, the highest values are recorded in the mountain uplifts and elevated surfaces of the Altay Mts and Hangayn Mts (over +80 mGal, red colors, Fig. 4). The gravity in the areas of Khentii Mts shown the extent between +20 to +60 mGal (dark yellow to orange colors in Fig. 4). In contrast, the Uvs Nuur Lake Basin in the NW of the country demonstrates notable negative values (below -80 mGal, dark blue color in Fig. 4). Likewise, free-air gravity over the Khyargas Nuur Lake Basin shows values between -80 to -60 mGal (blue color, Fig. 4). Fig. 5 presents the model of the vertical free-air gravity anomaly of Mongolia. Compared to the free-air gravity in Faye’s reduction, the vertical correction of the gravity measurements gives the wider data range as follows: Minimum=-
275.589 mGal/m, Maximum=490.174 mGal/m, Mean=-0.314 mGal/m, StdDev=39.126 mGal/m. Vertical correction of the gravity grid presents a high-pass filtered version of gravity that shows more detailed variations in the data due to the amended algorithms of the geophysical data representation. Vertical gravity anomaly presents the computed normal gradient of gravity which shows the rate of variations in gravity along with change of heights, as in free air. Thus, vertical gradient of gravity anomaly shows the difference between the actual and normal gravity at the same point. Similar to the Faye’s gravity, it demonstrates the lower values in the major river valleys of Mongolia (Selenge, Kherlen, Tes and Onon) and topographic depressions while higher in the mountain ranges (over 400 mGal). In this way, the link between the vertical gradient of gravity anomaly and curvature of the geoid, is related to the vertical gradient of gravity anomaly which shows the discrepancy between the mean curvatures of
Fig. 5. Vertical free-air gravity anomaly of Mongolia. Mapping: GMT. Source: author.

Lemenkova, 2021. Mongolian Geoscientist 26 (52) 62-79
73
geoid and quasi-geoid. Fig. 6 displays the elevation model based on SRTM-90 DEM of Mongolia showing the diverse relief of the country. The extend of the topography shows strongly asymmetric dimensions being roughly twice as long in WE direction (ca. 2400 km) compared to the SN (ca.1260 km). A number of mountain ranges
and ridges rise above the plateau with the highest (Mongolian Altai), extending in the W and SW of the country for a distance of ca. 900 km. The Mongolian Altai continues further in the lower separated ridges of the Gobi Altai. The most flat areas are colored grey and can be visible in the NE and E of the country. While visualizing the detailed qualitative slope models,
Fig. 6. Elevation model based on SRTM-90 DEM of Mongolia. Mapping: R. Source: author.
Fig. 7. Geomorphometric model of slope of Mongolia. Mapping: R. Source: author.

Lemenkova, 2021. Mongolian Geoscientist 26 (52) 62-79
74
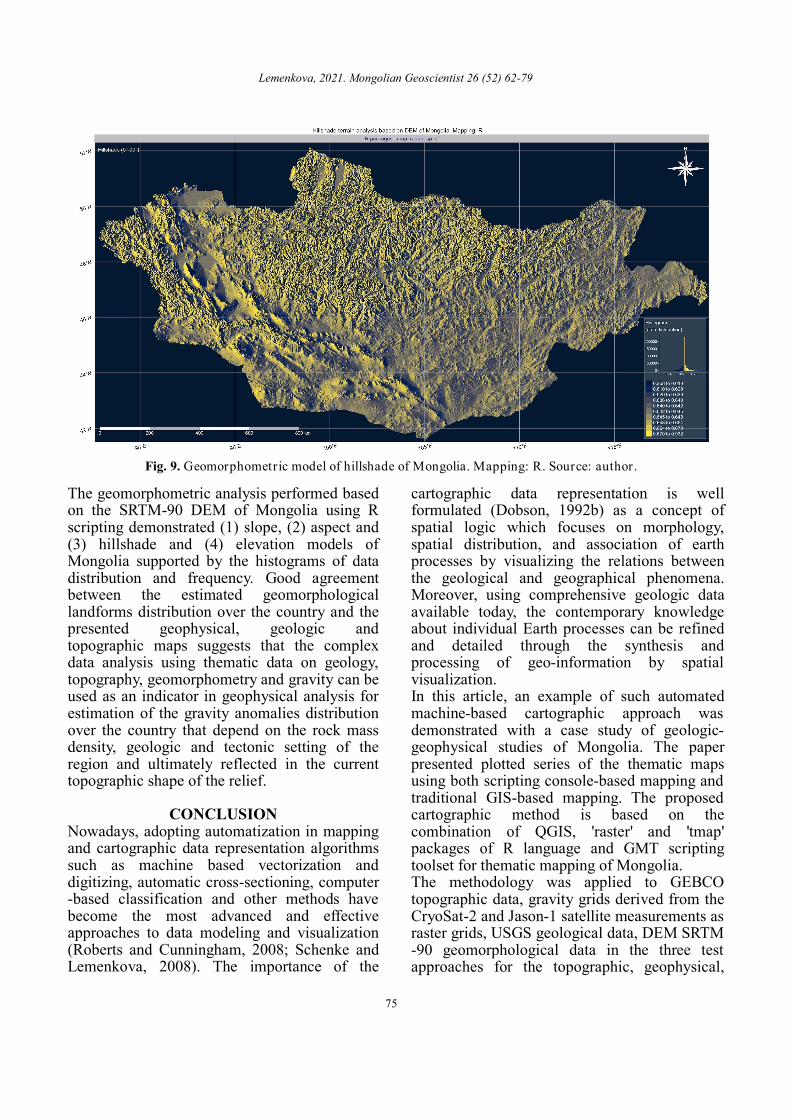
it should be noted that even small variations in relief may result in strong changes of hydrological and soil properties which shows the importance of the analysis of the terrain dissection for geological and environmental analysis. Therefore, the classification of the slopes in Mongolia has been made for 17 classes. Fig. 8 presents the results of the geomorphometric modeling of aspect of the surface terrain of Mongolia. Specifically, it shows the compass orientation divided generally for WEST convention (W-E-S-N) and then subdivided into the SW-SE-NW-NE (Fig. 8). The aspect map shows the automatically measured eight disposition of the aspect derived as the relative factor from the DEM relief, and the elevation–relief ratio from the elevation terrain map of Mongolia, to delimit land surface regions according to their compass orientation. The presented model (Fig. 8) shows a consequent multivariate classification of the slopes made by computer-based algorithm of 'raster' package of R that considers coordinates of each measured point and heights in meters. Fig. 9 depicts the geomorphometric model of the hillshade over Mongolia. In addition to considered curvature, slope and aspect of the previously calculated maps (Fig. 7 and 8), this
model applied the cartographic effects of the artificial light sources that creates an effective visualization of the terrain of Mongolia that may be applied for further data representation and geomorphological analysis. Thus, the conceptual hillshade classes implicitly reference the slope gradient and relative aspect position of the surface terrain resulting in mapped topographic sequence originally derived from the SRTM-90 DEM of Mongolia.
DISCUSSION Based on the integrated data analysis using the advanced cartographic solutions of GMT, R and QGIS and high-resolution datasets, a correlation between the topographic, geological and geophysical setting in Mongolia has been identified. The highest values in the free-air gravity in Faye’s reduction on Mongolia correspond to the mountain ranges that occurred in the region of Altai Mountains and Khangai Mountains (<80 mGal) and high values correspond to the Khentii Mountains (20 to 60 mGal). On the contrary, the basins of the Uvs Nuur and Khyargas Nuur demonstrate negative values (-80 mGal and below). The NE- to NNE-oriented faulting and rift basins are clearly visible both in the geophysical grids and on the geologic maps.
Fig. 8. Geomorphometric model of aspect of Mongolia. Mapping: R. Source: author.
Lemenkova, 2021. Mongolian Geoscientist 26 (52) 62-79
75
The geomorphometric analysis performed based on the SRTM-90 DEM of Mongolia using R scripting demonstrated (1) slope, (2) aspect and (3) hillshade and (4) elevation models of Mongolia supported by the histograms of data distribution and frequency. Good agreement between the estimated geomorphological landforms distribution over the country and the presented geophysical, geologic and topographic maps suggests that the complex data analysis using thematic data on geology, topography, geomorphometry and gravity can be used as an indicator in geophysical analysis for estimation of the gravity anomalies distribution over the country that depend on the rock mass density, geologic and tectonic setting of the region and ultimately reflected in the current topographic shape of the relief.
CONCLUSION Nowadays, adopting automatization in mapping and cartographic data representation algorithms such as machine based vectorization and digitizing, automatic cross-sectioning, computer-based classification and other methods have become the most advanced and effective approaches to data modeling and visualization (Roberts and Cunningham, 2008; Schenke and Lemenkova, 2008). The importance of the
cartographic data representation is well formulated (Dobson, 1992b) as a concept of spatial logic which focuses on morphology, spatial distribution, and association of earth processes by visualizing the relations between the geological and geographical phenomena. Moreover, using comprehensive geologic data available today, the contemporary knowledge about individual Earth processes can be refined and detailed through the synthesis and processing of geo-information by spatial visualization. In this article, an example of such automated machine-based cartographic approach was demonstrated with a case study of geologic-geophysical studies of Mongolia. The paper presented plotted series of the thematic maps using both scripting console-based mapping and traditional GIS-based mapping. The proposed cartographic method is based on the combination of QGIS, 'raster' and 'tmap' packages of R language and GMT scripting toolset for thematic mapping of Mongolia. The methodology was applied to GEBCO topographic data, gravity grids derived from the CryoSat-2 and Jason-1 satellite measurements as raster grids, USGS geological data, DEM SRTM-90 geomorphological data in the three test approaches for the topographic, geophysical,
Fig. 9. Geomorphometric model of hillshade of Mongolia. Mapping: R. Source: author.

Lemenkova, 2021. Mongolian Geoscientist 26 (52) 62-79
76
geological and geomorphometric mapping of Mongolia, respectively. The main geological settings of Mongolia, including all the four types (geologic, geophysical, topographic and geomorphometric), were successfully extracted from the processed raster grids and auxiliary vector data (DCW clip area) and visualized on the maps. The results are presenting a series of the nine (9) new maps, made the first time for Mongolia using integrated machine learning cartographic approach of GMT, R and QGIS. The applicability of the presented integrated multi-tool mapping achieved through the application of three methodologically different software resulted in the compatible map series in terms of projection, visualization and map extent which enabled to perform evaluation and overlay of the maps. The maps have been composed in GMT, R and QGIS using identical or similar cartographic layout composition and orientation to achieve cartographic agreement and edited using similar formatting, cartographic attributes and graphical elements topology. As a note for the future research, main difficulties that can be encountered in the application of the proposed methodology, may consist in the syntax of GMT or R, as well as some issues of data collection, conversion and processing by the three programs. As an advice for further development of this or similar work, the next steps may include other datasets available from the fieldwork and applying lithological data for regional analysis of Mongolia.
ACKNOWLEDGEMENTS This research was implemented into the framework of the project No. 0144-2019-0011, Schmidt Institute of Physics of the Earth, Russian Academy of Sciences. The author thanks the three anonymous reviewers and the editor for their comments and suggestions on previous version of the text. Their help substantially improved and clarified the manuscript.
REFERENCES Araújo, E.J., Chaves, A.A., Lorena, L.A.N.
2019. Improving the Clustering Search heuristic: An application to cartographic
labeling. Applied Soft Computing, v. 77, p. 261–273.
https://doi.org/10.1016/j.asoc.2018.11.003 Badarch, G., Cunningham, W.D., Windley, B.F.
2002. A new terrane subdivision for Mongolia: implications for the Phanerozoic crustal growth of Central Asia. Journal of Asian Earth Sciences, v. 21(1), p. 87–110. https://doi.org/10.1016/S1367-9120(02)00017-2
Badarch, G., Tomurtogoo, O. 2001. Tectonostratigraphic Terranes of Mongolia. Gondwana Research, v. 4(2), p. 143–144. https://doi.org/10.1016/S1342-937X(05)70667-5
Blight, J.H.S., Crowley, Q.G., Petterson, M.G., Gunningham, D. 2010. Granites of the Southern Mongolia Carboniferous Arc: New geochronological and geochemical constraints. Lithos, v. 116, p. 35–52.
https://doi.org/10.1016/j.lithos.2010.01.001
Casanova-Arenillas, S., Rodríguez-Tovar, F.J., Martínez-Ruiz, F. 2020. Applied ichnology in sedimentary geology: Python scripts as a method to automatize ichnofabric analysis in marine core images. Computers and Geosciences, v. 136, p. 104407.
https://doi.org/10.1016/j.cageo.2020.104407
Dill, H.G., Altangerel, S., Bulgamaa, J., Hongor, O., Khishigsuren, S., Majigsuren, Yo., Myagmarsuren, S., Heunisch, C. 2004. The Baganuur coal deposit, Mongolia: depositional environments and paleoecology of a Lower Cretaceous coal-bearing intermontane basin in Eastern Asia, International Journal of Coal Geology, v. 60 (2–4), p. 197–236.
https://doi.org/10.1016/j.coal.2003.09.008
Dobson, J.E. 1992a. Spatial Logic in Paleogeography and the Explanation of Continental Drift. Annals of the Association of American Geographers, v. 82(2), p. 187–206.
Dobson, J.E. 1992b. Exploring Geographical Analysis, 1991–92 International GIS Sourcebook, GIS World, Inc., Ft. Collins, Colorado.
Dobson, J. E. 1993. Commentary: A Conceptual Framework for Integrating Remote Sensing, GIS, and Geography. Photogrammetric Engineering and Remote Sensing, v. 59(10), p. 1491–1496.
Elidrissi, S., Omdi, F.E., El Azhari, A., Fagel,

Lemenkova, 2021. Mongolian Geoscientist 26 (52) 62-79
77
N., Daoudi, L. 2020. New application of GIS and statistical analysis in mapping the distribution of quaternary calcrete (Tensift Al Haouz area, Central Morocco). CATENA, v. 188, p. 104419.
https://doi.org/10.1016/j.catena.2019.104419
Erdenetsogt, B.-O., Lee, I., Bat-Erdene, D., Jargal, L. 2009. Mongolian coal-bearing basins: Geological settings, coal characteristics, distribution, and resources, International Journal of Coal Geology, v. 80(2), p. 87–104.
https://doi.org/10.1016/j.coal.2009.08.002 Fanti, F., Bell, P.R., Tighe, M., Milan, L.A.,
Dinelli, E. 2018. Geochemical fingerprinting as a tool for repatriating poached dinosaur fossils in Mongolia: A case study for the Nemegt Locality, Gobi Desert. Palaeogeography, Palaeoclimatology, Palaeoecology, v. 494, p. 51–64.
https://doi.org/10.1016/j.palaeo.2017.10.032 Gao, J., White, M.J., Bieger, K., Arnold, J.G.
2021. Design and development of a Python-based interface for processing massive data with the LOAD ESTimator (LOADEST). Environmental Modelling and Software, v. 135, p. 104897.
https://doi.org/10.1016/j.envsoft.2020.104897
Gauger, S., Kuhn, G., Gohl, K., Feigl, T., Lemenkova, P., Hillenbrand, C. 2007. Swath-bathymetric mapping. Reports on Polar and Marine Research, v. 557, p. 38–45.
https://doi.org/10.6084/m9.figshare.7439231 Genyao, W., Yuan, W., Min, L. 2013.
Palinspastic reconstruction and geological evolution of Jurassic basins in Mongolia and neighboring China, Journal of Palaeogeography, v. 2(3), p. 306–317.
https://doi.org/10.3724/SP.J.1261.2013.00033 Gohl, K., Eagles, G., Udintsev, G., Larter, R.D.,
Uenzelmann-Neben, G., Schenke, H.-W., Lemenkova, P., Grobys, J., Parsiegla, N., Schlueter, P., Deen, T., Kuhn, G., Hillenbrand, C.-D. 2006a. Tectonic and sedimentary processes of the West Antarctic margin of the Amundsen Sea embayment and PineIsland Bay, 2nd SCAR Open Science Meeting, 12–14 July 2006, Hobart, Tasmania, Australia. https://doi.org/10.6084/m9.figshare.7435484
Gohl, K., Uenzelmann-Neben, G., Eagles, G., Fahl, A., Feigl, T., Grobys, J., Just, J.,
Leinweber, V., Lensch, N., Mayr, C., Parsiegla, N., Rackebrandt, N., Schlüter, P., Suckro, S., Zimmermann, K., Gauger, S., Bohlmann, H., Netzeband, G., Lemenkova, P. 2006b. Crustal and Sedimentary Structures and Geodynamic Evolution of the West Antarctic Continental Margin and Pine Island Bay. Expeditionsprogramm Nr. 75 ANT XXIII/4 ANT XXIII/5, p. 11–12.
https://doi.org/10.13140/RG.2.2.16473.36961
Graf, J., Tabor, N.J., Ferguson, K., Winkler, D.A., Lee, Y.-N., May, S., Jacobs, L.L. 2018. Diagenesis of dinosaur eggshell from the Gobi Desert, Mongolia. Palaeogeography, Palaeoclimatology, Palaeoecology, v. 494, p. 65–74.
https://doi.org/10.1016/j.palaeo.2017.11.011 Hanžl, P., Guy, A., Battushig, A., Lexa, O.,
Schulmann, K., Kunceová, E., Hrdličková, K., Janoušek, V., Buriánek, D., Krejčí, Z., Jiang, Y., Otgonbaatar, D. 2020. Geology of the Gobi and Mongol Altai junction enhanced by gravity analysis: a key for understanding of the Mongolian Altaides. Journal of Maps, 16(2), 98–107.
https://doi.org/10.1080/17445647.2019.1700835
Heumann, M.J., Johnson, C.L., Webb, L.E. 2018. Plate interior polyphase fault systems and sedimentary basin evolution: A case study of the East Gobi Basin and East Gobi Fault Zone, southeastern Mongolia. Journal of Asian Earth Sciences, v. 151, p. 343–358. https://doi.org/10.1016/j.jseaes.2017.05.017
Hijmans, R.J., van Etten, J. 2012. raster: Geographic analysis and modeling with raster data. R package version 2.0-12.
http://CRAN.R-project.org/package=raster
Holguín, L.R., Sternberg, T. 2018. A GIS based approach to Holocene hydrology and social connectivity in the Gobi Desert, Mongolia, Archaeological Research in Asia, v. 15, p. 137–145. https://doi.org/10.1016/j.ara.2016.12.001
Howard, J.P., Cunningham, W.D., Davies, S.J., Dijkstra, A.H., Badarch, G. 2003. The stratigraphic and structural evolution of the Dzereg Basin, western Mongolia: clastic sedimentation, transpressional faulting and basin destruction in an intraplate, intracontinental setting. Basin Research, 15, 45–72.
https://doi.org/10.1046/j.1365-2117.2003.00198.x

Lemenkova, 2021. Mongolian Geoscientist 26 (52) 62-79
78
Höhle, J. 2021. Automated mapping of buildings through classification of DSM-based ortho-images and cartographic enhancement. International Journal of Applied Earth Observation and Geoinformation, v. 95, p. 102237.
https://doi.org/10.1016/j.jag.2020.102237 Johnson, C.L. 2004. Polyphase evolution of the
East Gobi basin: sedimentary and structural records of Mesozoic–Cenozoic intraplate deformation in Mongolia. Basin Research, v. 16, p. 79–99.
https://doi.org/10.1111/j.1365-2117.2004.00221.x Johnson, C.L., Constenius, K.C., Graham, S.A.,
Mackey, G., Menotti, T., Payton, A., Tully, J. 2015. Subsurface evidence for late Mesozoic extension in western Mongolia: tectonic and petroleum systems implications. Basin Research, v. 27, p. 272–294.
https://doi.org/10.1111/bre.12073
Kim, Y., Lee, I., Oyungerel, S., Altanzul, C., Jargal, L., Kim, N.K. 2020. Geology, mineralogy and stable isotope geochemistry of the Dzuunmod area in northern Mongolia: Constraints for gold ore genesis and sources. Ore Geology Reviews, v. 118, p. 103213. https://doi.org/10.1016/j.oregeorev.2019.103213
Klaučo, M., Gregorová, B., Stankov, U., Marković, V., Lemenkova, P. 2013. Determination of ecological significance based on geostatistical assessment: a case study from the Slovak Natura 2000 protected area. Open Geosciences, v. 5(1), p. 28–42. https://doi.org/10.2478/s13533-012-0120-0
Klaučo, M., Gregorová, B., Koleda, P., Stankov, U., Marković, V., Lemenkova, P. 2017. Land planning as a support for sustainable development based on tourism: A case study of Slovak Rural Region. Environmental Engineering and Management Journal, v. 2(16), p. 449–458.
https://doi.org/10.30638/eemj.2017.045
Kurihara, T., Tsukada, K., Otoh, S., Kashiwagi, K., Chuluun, M., Byambadash, D., Boijir, B., Gonchigdorj, S., Nuramkhan, M., Niwa, M., Tokiwa, T., Hikichi, G., Kozuka, T. 2009. Upper Silurian and Devonian pelagic deep-water radiolarian chert from the Khangai–Khentei belt of Central Mongolia: Evidence for Middle Paleozoic subduction–accretion activity in the Central Asian Orogenic Belt.
Journal of Asian Earth Sciences, v. 34(2), p. 209–225.
https://doi.org/10.1016/j.jseaes.2008.04.010
Le Fillâtre, V., Robert, E., Petrognani, S., Lesvignes, E., Cretin, C., Muth, X. 2021. Mapping the walls: High-resolution cartography applied to the analysis of prehistoric cave art in the Grotte du Mammouth (Domme, Dordogne, France). Journal of Archaeological Science, v. 127, p. 105332.
https://doi.org/10.1016/j.jas.2021.105332
Lemenkova, P. 2021. Exploring structured scripting cartographic technique of GMT for ocean seafloor modeling: A case of the East Indian Ocean. Maritime Technology and Research, v. 3(2), p. 162–184.
https://doi.org/10.33175/mtr.2021.248158
Lemenkova, P. 2020a. Using GMT for 2D and 3D Modeling of the Ryukyu Trench Topography, Pacific Ocean. Miscellanea Geographica, 25(3), 1–13.
https://doi.org/10.2478/mgrsd-2020-0038 Lemenkova, P. 2020b. GEBCO Gridded
Bathymetric Datasets for Mapping Japan Trench Geomorphology by Means of GMT Scripting Toolset. Geodesy and Cartography, v. 46(3), p. 98–112.
https://doi.org/10.3846/gac.2020.11524
Lemenkova, P. 2019. Statistical Analysis of the Mariana Trench Geomorphology Using R Programming Language. Geodesy and Cartography, v. 45(2), p. 57–84.
https://doi.org/10.3846/gac.2019.3785
Li, Z.-Q., Chen, J.-L., Zou, H., Wang, C.-S., Meng, Q.-A., Liu, H.-L., Wang, S.-Z. 2020a. Mesozoic–Cenozoic tectonic evolution and dynamics of the Songliao Basin, NE Asia: Implications for the closure of the Paleo-Asian Ocean and Mongol-Okhotsk Ocean and subduction of the Paleo-Pacific Ocean. Earth-Science Reviews, 103471.
https://doi.org/10.1016/j.earscirev.2020.103471 Li, X., Zhang, H., Wang, Y., Zhao, X., Ma, Z.,
Liu, K., Ma, Y. 2020b. Inversion of bedrock channel profiles in the Daqing Shan in Inner Mongolia, northern China: Implications for late Cenozoic tectonic history in the Hetao Basin and the Yellow River evolution. Tectonophysics, v. 790, p. 228558.
https://doi.org/10.1016/j.tecto.2020.228558

Lemenkova, 2021. Mongolian Geoscientist 26 (52) 62-79
79
Miao, L., Fan, W., Liu, D., Zhang, F., Shi, Y., Guo, F. 2008. Geochronology and geochemistry of the Hegenshan ophiolitic complex: Implications for late-stage tectonic evolution of the Inner Mongolia-Daxinganling Orogenic Belt, China. Journal of Asian Earth Sciences 32, 348-370.
https://doi.org/10.1016/j.jseaes.2007.11.005
Osozawa, S., Tsolmon, G., Majigsuren, U., Sereenen, J., Niitsuma, S., Iwata, N., Pavlis, T., Jahn, B.-M. 2008. Structural evolution of the Bayankhongor region, west-central Mongolia. Journal of Asian Earth Sciences, v. 33(5–6), p. 337–352.
https://doi.org/10.1016/j.jseaes.2008.01.003
QGIS.org, 2021. QGIS Geographic Information System. QGIS Association.
http://www.qgis.org
R Core Team, 2020. R: A language and environment for statistical computing. R 2Foundation for Statistical Computing, Vienna, Austria. URL:
https://www.R-project.org/ RStudio Team, 2017. RStudio: Integrated
Development Environment for R. RStudio, Inc., Boston, MA. https://www.RStudio.com/
Roberts, N.M.W., Cunningham, D. 2008. Automated alluvial fan discrimination, Quaternary fault identification, and the distribution of tectonically reactivated crust in the Gobi Altai region, southern Mongolia. International Journal of Remote Sensing, 29(3). 6957–6969.
https://doi.org/10.1080/01431160802220227
Sandwell, D.T., Müller, R.D., Smith, W.H.F., Garcia, E. and Francis, R., 2014. New global marine gravity model from CryoSat-2 and Jason-1 reveals buried tectonic structure. Science 7346(6205): 65–67.
https://doi.org/10.1126/science.1258213
Schenke, H. W., Lemenkova, P. 2008. Zur Frage der Meeresboden-Kartographie: Die Nutzung von AutoTrace Digitizer für die Vektorisierung der Bathymetrischen Daten in der Petschora-See. Hydrographische Nachrichten, v. 81, p. 16–21.
https://doi.org/10.6084/m9.figshare.7435538 Schenke, H. 2016. General Bathymetric Chart of
the Oceans (GEBCO). In: Harff J., Meschede M., Petersen S., Thiede J. (eds) Encyclopedia of Marine Geosciences. Encyclopedia of Earth Sciences Series. Springer, Dordrecht.
https://doi.org/10.1007/978-94-007-6238-1_63 Suetova, I.A., Ushakova, L.A., Lemenkova, P.
2005. Geoinformation mapping of the Barents and Pechora Seas. Geography and Natural Resources, v. 4, p. 138–142.
https://doi.org/10.6084/m9.figshare.7435535
Tennekes, M. 2012. tmap: Thematic Maps in R. Journal of Statistical Software, v. 84(6), p. 1-39.
Yu, K., Lehmkuhl, F., Schlütz, F., Diekmann, B., Mischke, S., Grunert, J., Murad, W., Nottebaum, V., Stauch, G., Zeeden, C. 2019. Late Quaternary environments in the Gobi Desert of Mongolia: Vegetation, hydrological, and palaeoclimate evolution. Palaeogeography, Palaeoclimatology, Palaeoecology, v. 514, p. 77–91.
https://doi.org/10.1016/j.palaeo.2018.10.004
Wessel, P., Luis, J.F., Uieda, L., Scharroo, R., Wobbe, F., Smith, W.H.F., Tian, D. 2019. The Generic Mapping Tools version 6. Geochemistry, Geophysics, Geosystems, v. 20, p. 5556–5564.
https://doi.org/10.1029/2019GC008515