goals and objectives • simple message • conceptual model
TRANSCRIPT

Goals and Objectives• Simple message• Conceptual model and definition• Prevalence• Testing• Classification• Risk factors• Relationship with other chronic diseases• Rationale for public health policy
KDIGO ‐ Controversies Conference Chronic Kidney Disease as a Global Public Health
Problem: Approaches and Initiatives 12‐14 October, 2006
Renaissance Amsterdam, Amsterdam

CKD is a Public Health Problem
• CKD is common• CKD is harmful• We have treatment

Conceptual Model for CKD
CKDdeathCKDCKDdeathdeath
ComplicationsComplicationsComplications
Screening Screening for CKDfor CKD
risk factors:risk factors:diabetesdiabetes
hypertensionhypertensionage >60age >60
family historyfamily historyUS ethnic US ethnic minoritiesminorities
CKD riskCKD riskreduction;reduction;
Screening forScreening forCKDCKD
DiagnosisDiagnosis& treatment;& treatment;
Treat Treat comorbidcomorbid
conditions;conditions;Slow Slow
progressionprogression
EstimateEstimateprogression;progression;
TreatTreatcomplications;complications;
Prepare forPrepare forreplacementreplacement
ReplacementReplacementby dialysisby dialysis
& transplant& transplant
NormalNormalNormal Increasedrisk
IncreasedIncreasedriskrisk
KidneyfailureKidneyKidneyfailurefailureDamageDamageDamage ↓ GFR↓↓ GFRGFR
11.3 m5.6%
7.7 m7.7 m3.8%
0.3 m0.2%

AKIN Vancouver Conference 2006njury
cuteidney
etwork
Conceptual Model for AKI
AntecedentsIntermediate StageAKIOutcomes
DeathDeathDeath
ComplicationsComplicationsComplications
NormalNormalNormal Increasedrisk
IncreasedIncreasedriskrisk
KidneyfailureKidneyKidneyfailurefailureDamageDamageDamage ↓ GFR↓↓ GFRGFR
AKI

NKF-K/DOQI Definition of CKDKDIGO Modifications (Amsterdam 2004)Structural or functional abnormalities of the kidneys
for >3 months, as manifested by either:1. Kidney damage, with or without decreased GFR,
as defined by• pathologic abnormalities• markers of kidney damage
– urinary abnormalities (proteinuria)– blood abnormalities (renal tubular syndromes)– imaging abnormalities
• kidney transplantation2. GFR <60 ml/min/1.73 m2, with or without kidney
damage

Where we are today:• Albuminuria is useful for detection,
evaluation and management of CKD
• Spot urine albumin-to-creatinine ratio is easier to measure and correlates with timed excretion rate
• Ratio >30 mg/g is a maker of CKD• Lower level is a risk factor for CVD
Next steps:• Urine albumin standardization• Variation by sex, race, ethnicity
and age• Hypothesized relationship to
generalized endothelial dysfunction
• Hypothesized surrogate marker for CKD progression
An International Symposium, New York, May 16-18, 2004
Role of Albuminuria in Health and Disease:Predicting Targets and Outcomes of Therapy
Guest Editors: De Zeeuw D; Bakris G; Pfeffer MKidney International 2004: 66 (Supplement 92): S1-S127

Where we are today:• eGFR is useful for detection,
evaluation and management of CKD
• eGFR is more accurate than serum creatinine alone
• eGFR is less accurate at higher vs. lower levels
• eGFR reporting (numeric value only for eGFR <60)
Next steps to improve performance (especially at higher GFR):• Creatinine standardization• Race/ethnicity terms• New equations
• new filtration markers•(cystatin C)
• additional variables• new derivations

Performance of MDRD Study Equation Using Calibrated and Non-Calibrated Creatinine
Study N mGFRNon-Calibrated
CreatinineCalibrated Creatinine
%Δ P30 %Δ P30MDRD Study 1085 40 -0.1 90 0.1 90AASK 1205 57 7.7 85 2.1 86DCCT 787 124 14.9 81 10.1 85DRDS 126 115 13.5 76 -0.8 79CSG 266 78 15.6 75 14.6 75CRIC 446 50 8.0 82 8.7 81CCF CKD 695 34 2.5 71 0.6 71CCF Donors 301 106 8.4 86 14.4 84Mayo CKD 221 48 8.0 76 0.4 76Mayo Donors 372 102 28.9 54 13.5 87Pooled 5504 68 9.0 80 5.8 83
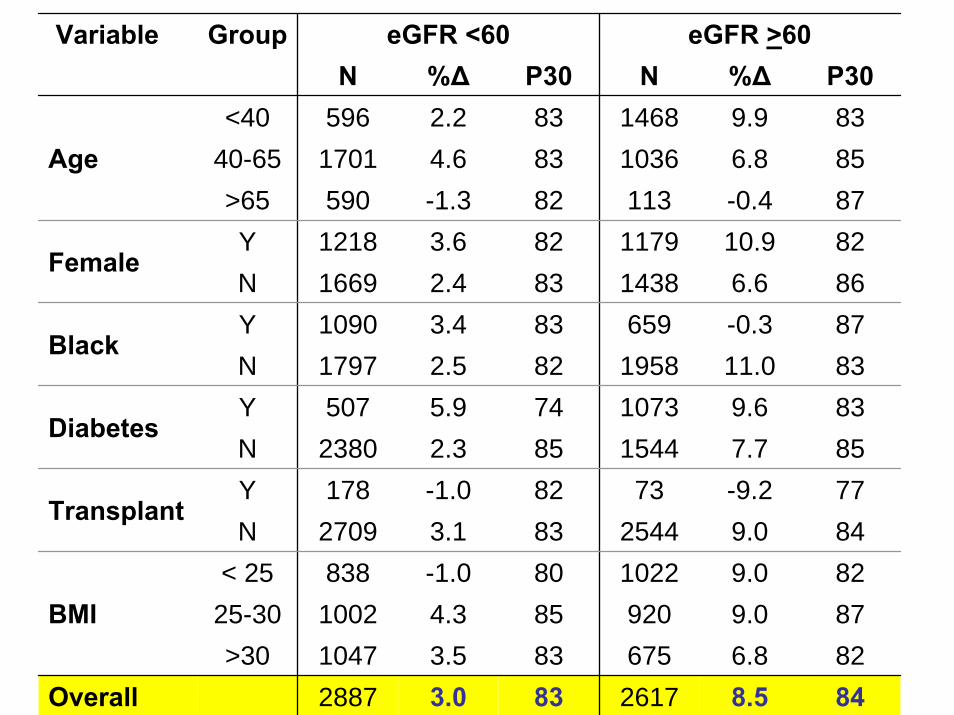
Variable Group eGFR <60 eGFR >60N %Δ P30 N %Δ P30
<40 596 2.2 83 1468 9.9 8340-65 1701 4.6 83 1036 6.8 85>65 590 -1.3 82 113 -0.4 87Y 1218 3.6 82 1179 10.9 82N 1669 2.4 83 1438 6.6 86Y 1090 3.4 83 659 -0.3 87N 1797 2.5 82 1958 11.0 83Y 507 5.9 74 1073 9.6 83N 2380 2.3 85 1544 7.7 85Y 178 -1.0 82 73 -9.2 77N 2709 3.1 83 2544 9.0 84
< 25 838 -1.0 80 1022 9.0 8225-30 1002 4.3 85 920 9.0 87>30 1047 3.5 83 675 6.8 82
Overall 2887 3.0 83 2617 8.5 84
BMI
Transplant
Diabetes
Black
Female
Age

Interpretation of CKD Testing
Marker of Kidney Damage
GFR CKD What to do?
+ < 60 Y Action Plan+ > 60 Y Action Plan
- < 60 Y Action Plan*- > 60 N
Because of bias in MDRD Study equation in non-CKD populations, some individuals with normal measured GFR may have GFR estimates just below 60. Individual decision-making is required.

Classifications of CKD
• Severity (stage)• Treatment (HD vs. PD)• Diagnosis (cause)• Prognosis (progression, CVD)

Stages of CKD, Related ICD 9 Codes and Classification by Treatment
Stage
Description
GFR (mL/min per
1.73 m2) ICD 9 Code
Treatment
At increased risk
>60 (with CKD risk
factors)
None
1 Kidney damage with normal or
↑ GFR
>90 585.1
2 Kidney damage with mild ↓
GFR
60–89 585.2
3 Moderate ↓ GFR
30–59 585.3
4 Severe ↓ GFR 15–29 585.4
T if kidney transplant recipient
5 Kidney failure <15 (or dialysis)
585.5 585.6 (if ESRD)
V codes for dialysis or transplantation
D if dialysis (HD or PD)

Simplified Classification of CKDby Diagnosis
Disease Major Types (Examples) Diabetic kidney
disease Type 1 and type 2 diabetes
Nondiabetic kidney
diseases
Glomerular diseases (autoimmune diseases, systemic infections, drugs, neoplasia)
Vascular diseases (renal artery disease, hypertension, microangiopathy)
Tubulointerstitial diseases (urinary tract infection, stones, obstruction, drug toxicity)
Cystic diseases (polycystic kidney disease)
Diseases in the transplant
Acute rejection Allograft nephropathy (chronic rejection, calcineurin
toxicity, glomerulopathy) Recurrent diseases (glomerular diseases)

Proposed Classification using ICD Codes CKD Classification
DiseaseStage
andTreat-ment
Marker ofKidney Damage
Disease(ICD Code)
Type 1 Proteinuria
Type 2 Proteinuria
Glomerulardiseases
Hematuria+Proteinuria
Vascular diseases +Proteinuria
Tubulointersitialdiseases
+Pyuria,+Proteinuria,
+Imaging studiesCystic diseases Cysts
Non-diabetickidney disease not
otherwise specified
+Proteinuria
Transplant +Proteinuria
Non-Diabetic Kidney Disease
585.X
(585.6For
ESRD)
With Vcodes
forD or T
Diabetic Kidney Disease

Conceptual Model for CKD
CKDdeathCKDCKDdeathdeath
ComplicationsComplicationsComplications
NormalNormalNormal Increasedrisk
IncreasedIncreasedriskrisk
KidneyfailureKidneyKidneyfailurefailureDamageDamageDamage ↓ GFR↓↓ GFRGFR
SusceptibilitySusceptibilityfactorsfactors
InitiationInitiationfactorsfactors
ProgressionProgressionfactorsfactors
ProgressionProgressionfactorsfactors
EndEnd--StageStage(outcome)(outcome)
factorsfactors

Risk Factor Definition ExamplesSusceptibility factors
Increase susceptibility to kidney damage
Older age, family history of CKD, U.S. racial or ethnic minority status, reduced kidney mass, hyperfiltration states
Initiation factors Directly initiate kidney damage
Diabetes, high blood pressure, obesity, dyslipidemia,autoimmune diseases, infections, stones, obstruction
Progression factors
Cause worsening kidney damage and faster GFR decline
Higher level of proteinuria
End-stage (outcome) factors
Increase morbidity and mortality in kidney failure
Lower dialysis dose (Kt/V), temporary vascular access, anemia, low serum albumin level, late referral
CKD Risk Factors
Factors that are implicated at different stages in the development and progression of CKDare listed in the initial category in which they could potentially appear.

Conceptual Model for CKD
CKDdeathCKDCKDdeathdeath
Chronic DiseasesChronic DiseasesChronic Diseases
NormalNormalNormal Increasedrisk
IncreasedIncreasedriskrisk
KidneyfailureKidneyKidneyfailurefailureDamageDamageDamage ↓ GFR↓↓ GFRGFR
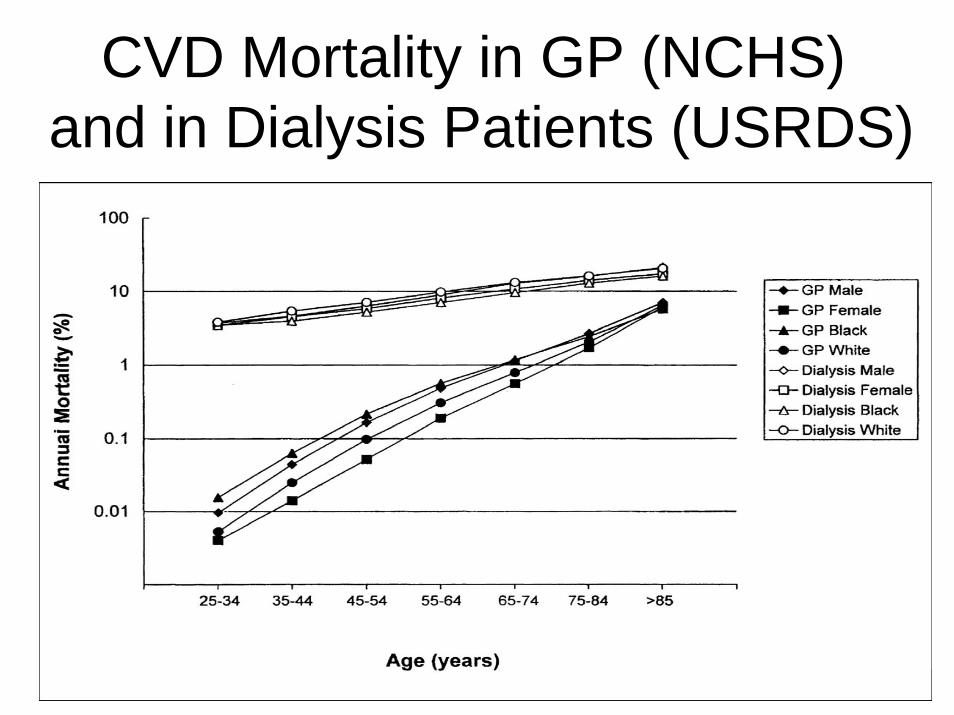
CVD Mortality in GP (NCHS)and in Dialysis Patients (USRDS)

Rates of Death from Any Cause and from CVD by Estimated GFR
Go et al NEJM 2004

CKD as a Risk Factor for CVDin CVD Risk Factor Conditions
CVD Risk Factor CKD prevalence
CKD as a risk factor
for CVD morbidity
CKD as a risk factor
for CVD mortalityHypertension ↑ ↑ ↑
Diabetes ↑ ↑ ↑
Dyslipidemia ↑ ↑ ↑

Rationale for Public Health Policy• CVD is most common cause of death in developed nations• CKD is common in people with CVD risk factors
– Hypertension, diabetes, dyslipidemia
• CKD multiplies risk for CVD• Patients with CVD risk factors and CKD are more ill
compared to those without CKD– Risk factor levels are higher– Risk factor control is more difficult– CVD outcomes are worse– Costs of care are higher
• CVD risk factor management differs in patients with CKD compared to those without CKD
• Treatments are available and effective NOW– To reduce CVD risk– To manage complications of CKD– To slow kidney disease progression

Chronic Kidney Disease is a Public Health Problem
• CKD is common– 11% of US adults– Higher prevalence in patients with CVD
risk factors• CKD is harmful
– Increased risk for CVD– Complications of decreased kidney
function– Progression to kidney failure
• We have treatment

Recommendations
• CKD testing for all patients with CVD risk factor conditions
• CKD Action Plan for all patients found to have CKD

CKD as a Risk Factor forAdverse Outcomes of Infectious Diseases
Infectious Disease CKD prevalence
CKD as a risk factor
for ID morbidity
CKD as a risk factor
for ID mortalityHCV
HBV
HIV
TB
Malaria

CKD as a Risk Factor for Adverse Outcomes of Cancer
Cancer CKD prevalence
CKD as a risk factor
for cancer morbidity
CKD as a risk factor
for cancer mortality
Kidney and urinary tract tumors
Other solid tumors
Hematologicmalignancies

CKD Concepts Where We Are Now
Where We Need to Go
Conceptual Model Well developed Link to AKI and AKD
Definition Inclusive Markers of damage
StandardizationRace/ethnicity terms
Optimal useWorld
Link to ICD I0-11Diagnosis, Prognosis
Focus on CVD risk factors
ID, cancer
Simple messagesCoordinate with other
chronic diseases
Testing Spot urine albumin-to-creatinine ratio >30 mg/g;eGFR <60 ml/min/1.73 m2
Prevalence US
Classification Severity (ICD9)Treatment
Risk Factors Framework
Outcomes CVD
Public Policy

CKD
Classification Surveillance Public policy
Consequences
CKD as a Global Public Health Problem
Day One
Day Two
and causes