goa economy in figures 20 10goadpse.gov.in/publications/goa-economy-in-figures-2010.pdf2 government...
TRANSCRIPT
1
FOREWORD
It is of immense pleasure to release this small brochure containing
“Goa Economy in figures - 2010 " which gives important Statistical indicators as at the time of
Statehood in 1987 and those for the years 2008-09 & 2009-10. The vide array of Socio- Economic
Indicators presented in the brochure will enable readers to comprehend at a glance the impressive
progress registered by the State since it attained Statehood.
The valuable cooperation extended by the various Departments of the State Government, Local
Bodies, Government of India and other organizations in making available the requisite data to bring
out this publication in time is gratefully acknowledged.
Shri G.V.Gauns, Research Assistant and Shri Amol A. Sawant, Investigator, have prepared this
brochure under the guidance of Shri. S. Shanbhogue, Jt. Director, in the Publication Division of the
Directorate of Planning, Statistics and Evaluation.
Constructive suggestions to improve the brochure in future are always welcome.
(Anand Sherkhane)
Director
Place: Panaji – Goa.
Date: 30 /05/2010.
2
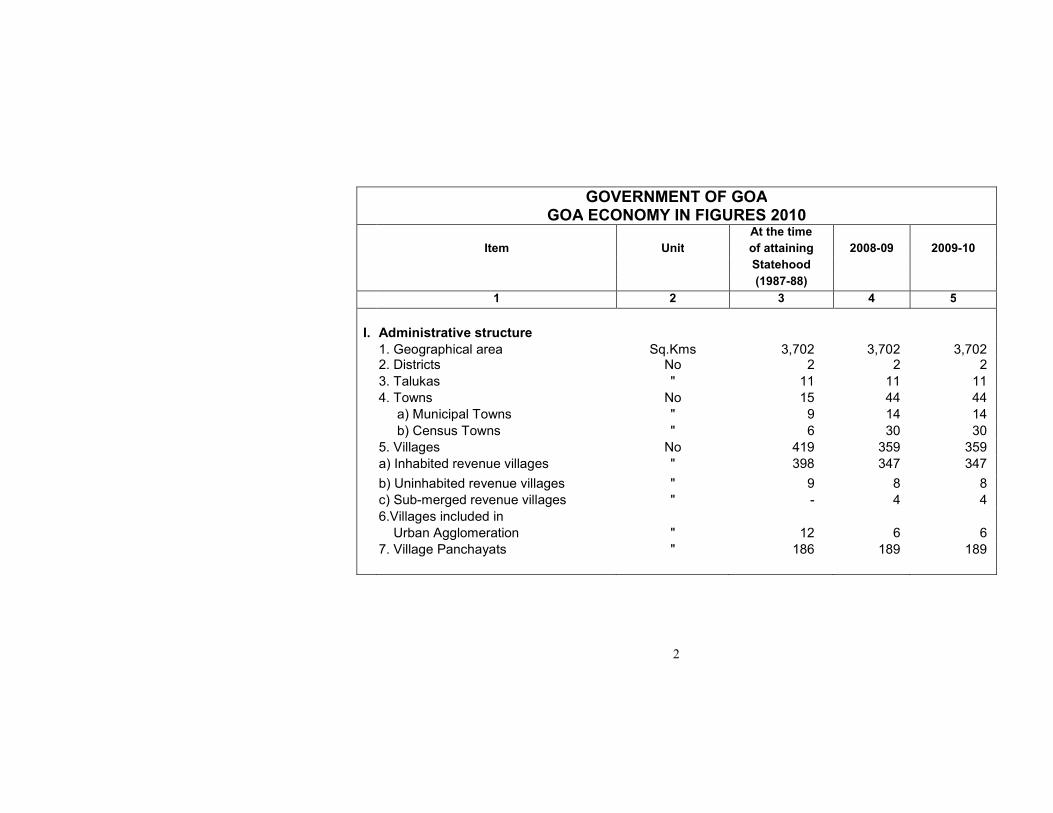
GOVERNMENT OF GOA GOA ECONOMY IN FIGURES 2010
At the time
Item Unit of attaining 2008-09 2009-10
Statehood
(1987-88)
1 2 3 4 5
I. Administrative structure
1. Geographical area Sq.Kms 3,702 3,702 3,702 2. Districts No 2 2 2
3. Talukas " 11 11 11
4. Towns No 15 44 44
a) Municipal Towns " 9 14 14
b) Census Towns " 6 30 30
5. Villages No 419 359 359
a) Inhabited revenue villages " 398 347 347
b) Uninhabited revenue villages " 9 8 8
c) Sub-merged revenue villages " - 4 4
6.Villages included in
Urban Agglomeration " 12 6 6
7. Village Panchayats " 186 189 189
3
At the time
Item Unit of attaining 2008-09 2009-10
Statehood
(1987-88)
1 2 3 4 5
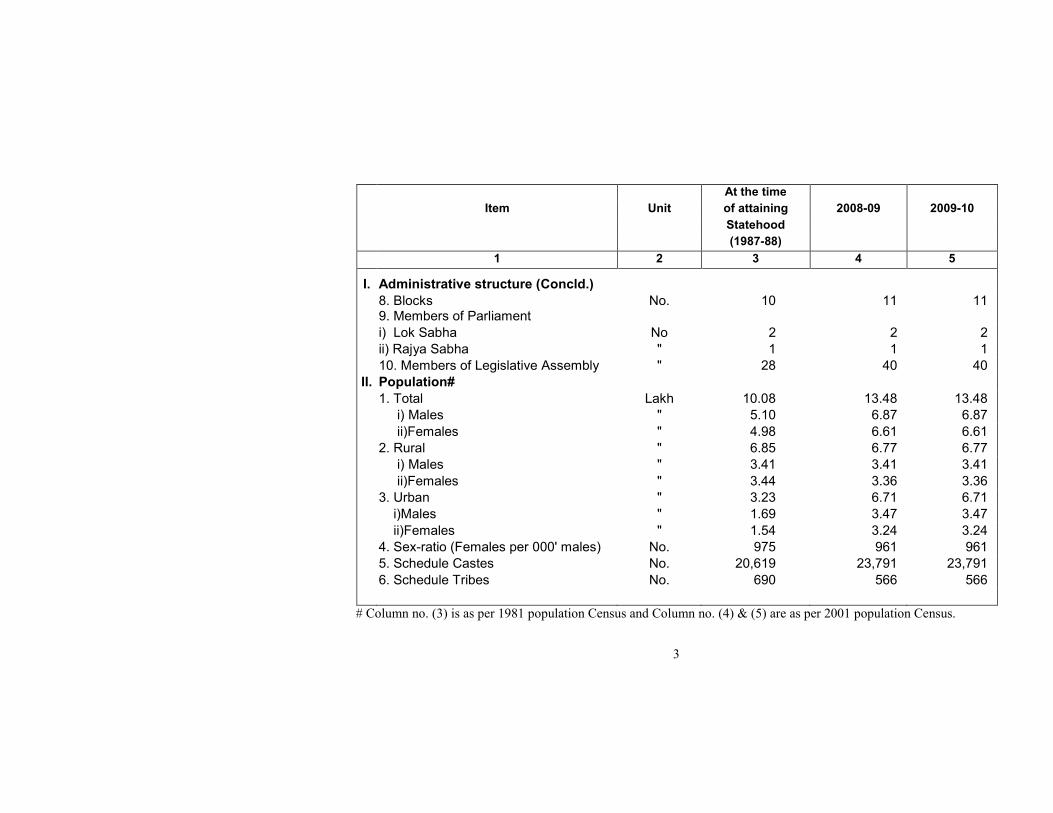
I. Administrative structure (Concld.)
8. Blocks No. 10 11 11 9. Members of Parliament
i) Lok Sabha No 2 2 2
ii) Rajya Sabha " 1 1 1
10. Members of Legislative Assembly " 28 40 40
II. Population#
1. Total Lakh 10.08 13.48 13.48
i) Males " 5.10 6.87 6.87
ii)Females " 4.98 6.61 6.61
2. Rural " 6.85 6.77 6.77
i) Males " 3.41 3.41 3.41
ii)Females " 3.44 3.36 3.36
3. Urban " 3.23 6.71 6.71
i)Males " 1.69 3.47 3.47
ii)Females " 1.54 3.24 3.24
4. Sex-ratio (Females per 000' males) No. 975 961 961
5. Schedule Castes No. 20,619 23,791 23,791
6. Schedule Tribes No. 690 566 566
# Column no. (3) is as per 1981 population Census and Column no. (4) & (5) are as per 2001 population Census.
4
At the time
Item Unit of attaining 2008-09 2009-10
Statehood
(1987-88)
1 2 3 4 5
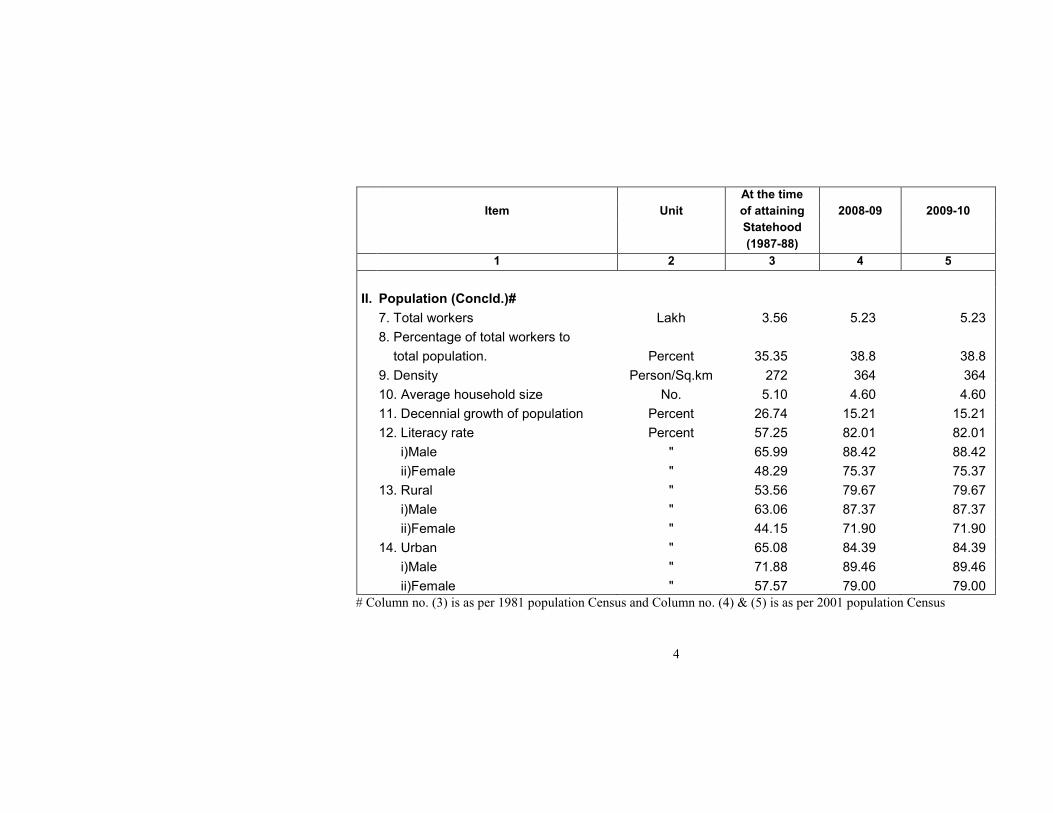
II. Population (Concld.)#
7. Total workers Lakh 3.56 5.23 5.23
8. Percentage of total workers to
total population. Percent 35.35 38.8 38.8
9. Density Person/Sq.km 272 364 364
10. Average household size No. 5.10 4.60 4.60
11. Decennial growth of population Percent 26.74 15.21 15.21
12. Literacy rate Percent 57.25 82.01 82.01
i)Male " 65.99 88.42 88.42
ii)Female " 48.29 75.37 75.37
13. Rural " 53.56 79.67 79.67
i)Male " 63.06 87.37 87.37
ii)Female " 44.15 71.90 71.90
14. Urban " 65.08 84.39 84.39
i)Male " 71.88 89.46 89.46
ii)Female " 57.57 79.00 79.00
# Column no. (3) is as per 1981 population Census and Column no. (4) & (5) is as per 2001 population Census
5
At the time
Item Unit of attaining 2008-09 2009-10
Statehood
(1987-88)
1 2 3 4 5
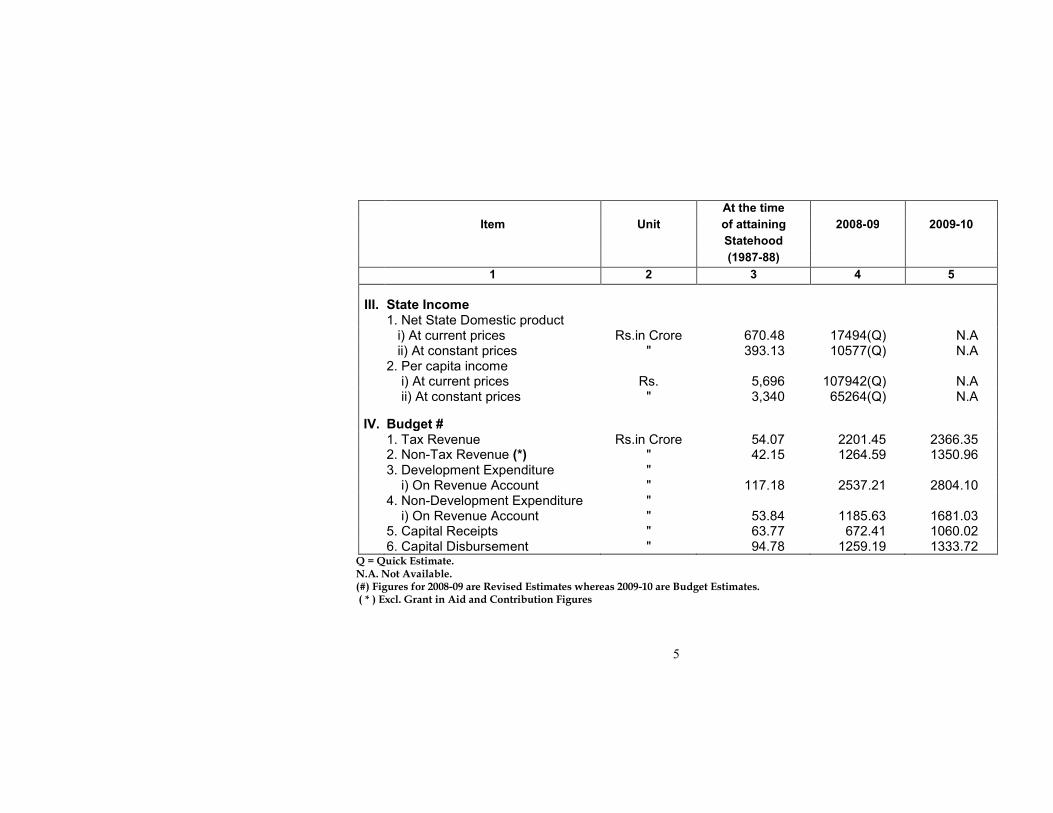
III. State Income 1. Net State Domestic product i) At current prices Rs.in Crore 670.48 17494(Q) N.A ii) At constant prices " 393.13 10577(Q) N.A 2. Per capita income i) At current prices Rs. 5,696 107942(Q) N.A ii) At constant prices " 3,340 65264(Q) N.A
IV. Budget # 1. Tax Revenue Rs.in Crore 54.07 2201.45 2366.35 2. Non-Tax Revenue (*) " 42.15 1264.59 1350.96 3. Development Expenditure " i) On Revenue Account " 117.18 2537.21 2804.10 4. Non-Development Expenditure " i) On Revenue Account " 53.84 1185.63 1681.03 5. Capital Receipts " 63.77 672.41 1060.02 6. Capital Disbursement " 94.78 1259.19 1333.72
Q = Quick Estimate. N.A. Not Available. (#) Figures for 2008-09 are Revised Estimates whereas 2009-10 are Budget Estimates. ( * ) Excl. Grant in Aid and Contribution Figures
6
At the time Item Unit of attaining 2008-09 2009-10 Statehood (1987-88)
1 2 3 4 5
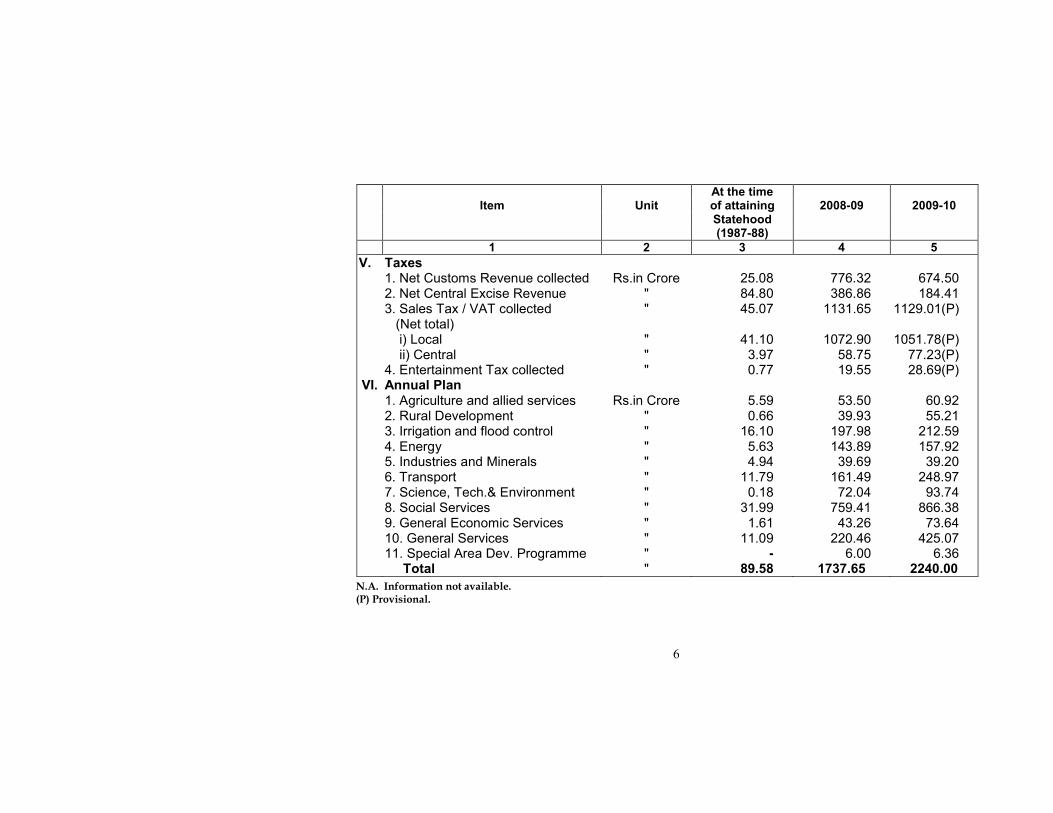
V. Taxes 1. Net Customs Revenue collected Rs.in Crore 25.08 776.32 674.50 2. Net Central Excise Revenue " 84.80 386.86 184.41 3. Sales Tax / VAT collected
(Net total) " 45.07 1131.65 1129.01(P)
i) Local " 41.10 1072.90 1051.78(P) ii) Central " 3.97 58.75 77.23(P) 4. Entertainment Tax collected " 0.77 19.55 28.69(P)
VI. Annual Plan 1. Agriculture and allied services Rs.in Crore 5.59 53.50 60.92 2. Rural Development " 0.66 39.93 55.21 3. Irrigation and flood control " 16.10 197.98 212.59 4. Energy " 5.63 143.89 157.92 5. Industries and Minerals " 4.94 39.69 39.20 6. Transport " 11.79 161.49 248.97 7. Science, Tech.& Environment " 0.18 72.04 93.74 8. Social Services " 31.99 759.41 866.38 9. General Economic Services " 1.61 43.26 73.64 10. General Services " 11.09 220.46 425.07 11. Special Area Dev. Programme " - 6.00 6.36 Total " 89.58 1737.65 2240.00
N.A. Information not available. (P) Provisional.
7
At the time Item Unit of attaining 2008-09 2009-10 Statehood (P)
(1987-88)
1 2 3 4 5
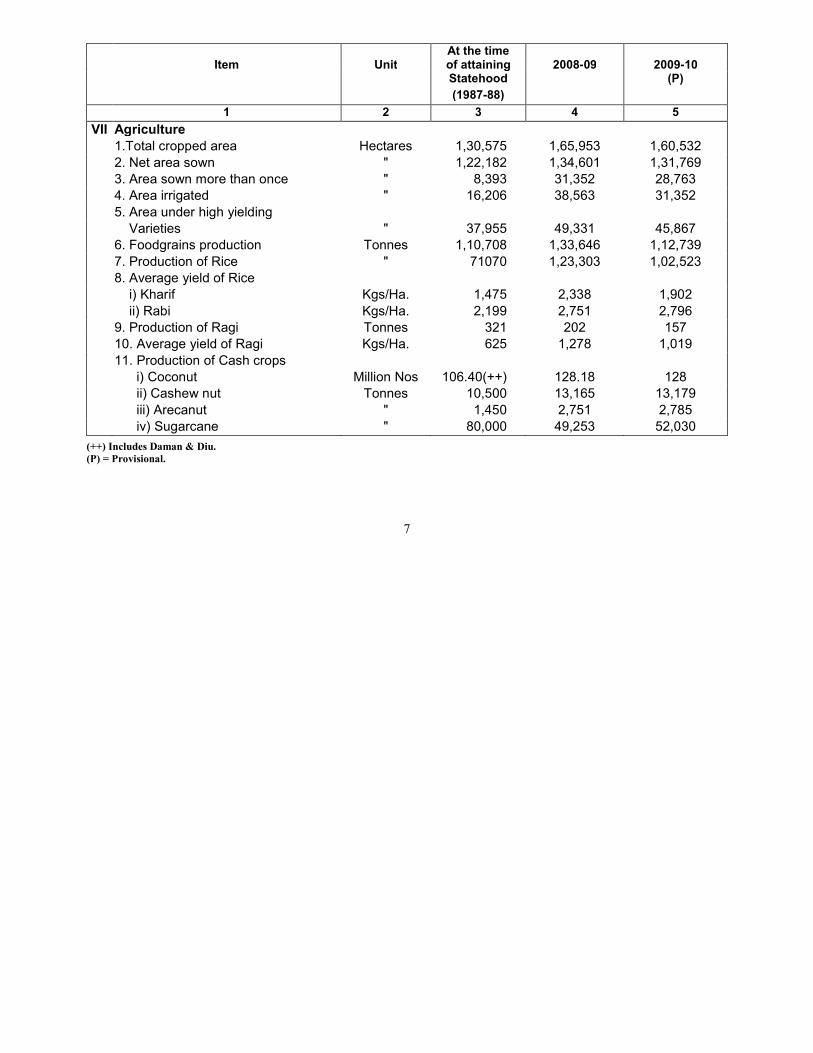
VII Agriculture
1.Total cropped area Hectares 1,30,575 1,65,953 1,60,532
2. Net area sown " 1,22,182 1,34,601 1,31,769
3. Area sown more than once " 8,393 31,352 28,763
4. Area irrigated " 16,206 38,563 31,352
5. Area under high yielding
Varieties " 37,955 49,331 45,867
6. Foodgrains production Tonnes 1,10,708 1,33,646 1,12,739
7. Production of Rice " 71070 1,23,303 1,02,523
8. Average yield of Rice
i) Kharif Kgs/Ha. 1,475 2,338 1,902
ii) Rabi Kgs/Ha. 2,199 2,751 2,796
9. Production of Ragi Tonnes 321 202 157
10. Average yield of Ragi Kgs/Ha. 625 1,278 1,019
11. Production of Cash crops
i) Coconut Million Nos 106.40(++) 128.18 128
ii) Cashew nut Tonnes 10,500 13,165 13,179
iii) Arecanut " 1,450 2,751 2,785
iv) Sugarcane " 80,000 49,253 52,030
(++) Includes Daman & Diu.
(P) = Provisional.
8
At the time Item Unit of attaining 2008-09 2009-10
Statehood (1987-88)
1 2 3 4 5
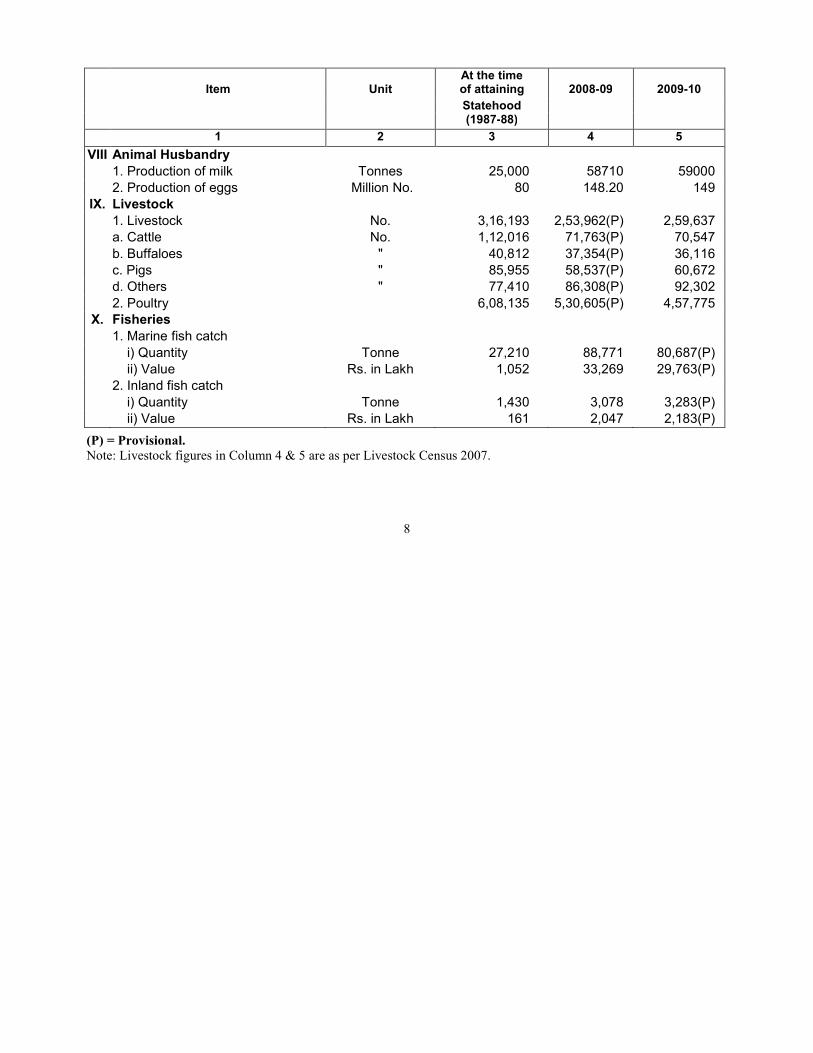
VIII Animal Husbandry
1. Production of milk Tonnes 25,000 58710 59000
2. Production of eggs Million No. 80 148.20 149
IX. Livestock
1. Livestock No. 3,16,193 2,53,962(P) 2,59,637
a. Cattle No. 1,12,016 71,763(P) 70,547
b. Buffaloes " 40,812 37,354(P) 36,116
c. Pigs " 85,955 58,537(P) 60,672
d. Others " 77,410 86,308(P) 92,302
2. Poultry 6,08,135 5,30,605(P) 4,57,775
X. Fisheries
1. Marine fish catch
i) Quantity Tonne 27,210 88,771 80,687(P)
ii) Value Rs. in Lakh 1,052 33,269 29,763(P)
2. Inland fish catch
i) Quantity Tonne 1,430 3,078 3,283(P)
ii) Value Rs. in Lakh 161 2,047 2,183(P)
(P) = Provisional. Note: Livestock figures in Column 4 & 5 are as per Livestock Census 2007.
9
At the time Item Unit of attaining 2008-09 2009-10
Statehood (1987-88)
1 2 3 4 5
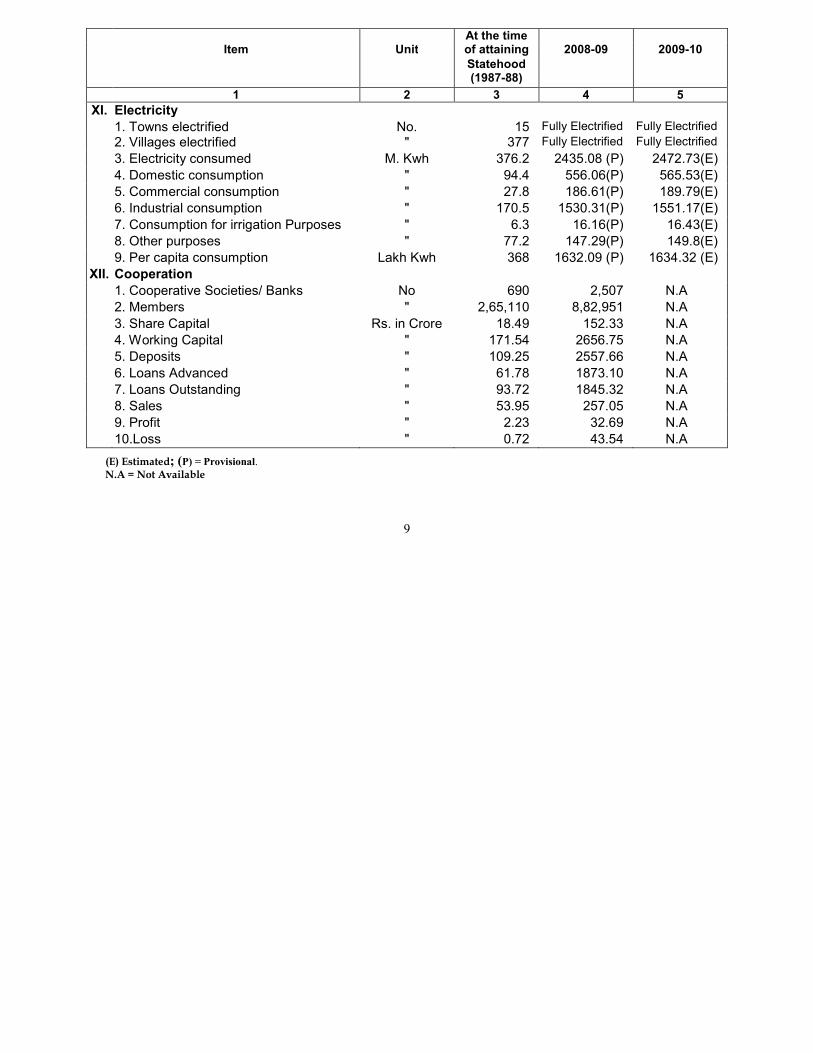
XI. Electricity
1. Towns electrified No. 15 Fully Electrified Fully Electrified
2. Villages electrified " 377 Fully Electrified Fully Electrified
3. Electricity consumed M. Kwh 376.2 2435.08 (P) 2472.73(E)
4. Domestic consumption " 94.4 556.06(P) 565.53(E)
5. Commercial consumption " 27.8 186.61(P) 189.79(E)
6. Industrial consumption " 170.5 1530.31(P) 1551.17(E)
7. Consumption for irrigation Purposes " 6.3 16.16(P) 16.43(E)
8. Other purposes " 77.2 147.29(P) 149.8(E)
9. Per capita consumption Lakh Kwh 368 1632.09 (P) 1634.32 (E)
XII. Cooperation
1. Cooperative Societies/ Banks No 690 2,507 N.A
2. Members " 2,65,110 8,82,951 N.A
3. Share Capital Rs. in Crore 18.49 152.33 N.A
4. Working Capital " 171.54 2656.75 N.A
5. Deposits " 109.25 2557.66 N.A
6. Loans Advanced " 61.78 1873.10 N.A
7. Loans Outstanding " 93.72 1845.32 N.A
8. Sales " 53.95 257.05 N.A
9. Profit " 2.23 32.69 N.A
10.Loss " 0.72 43.54 N.A
(E) Estimated; (P) = Provisional. N.A = Not Available
10
At the time Item Unit of attaining 2008-09 2009-10 Statehood (1987-88)
1 2 3 4 5
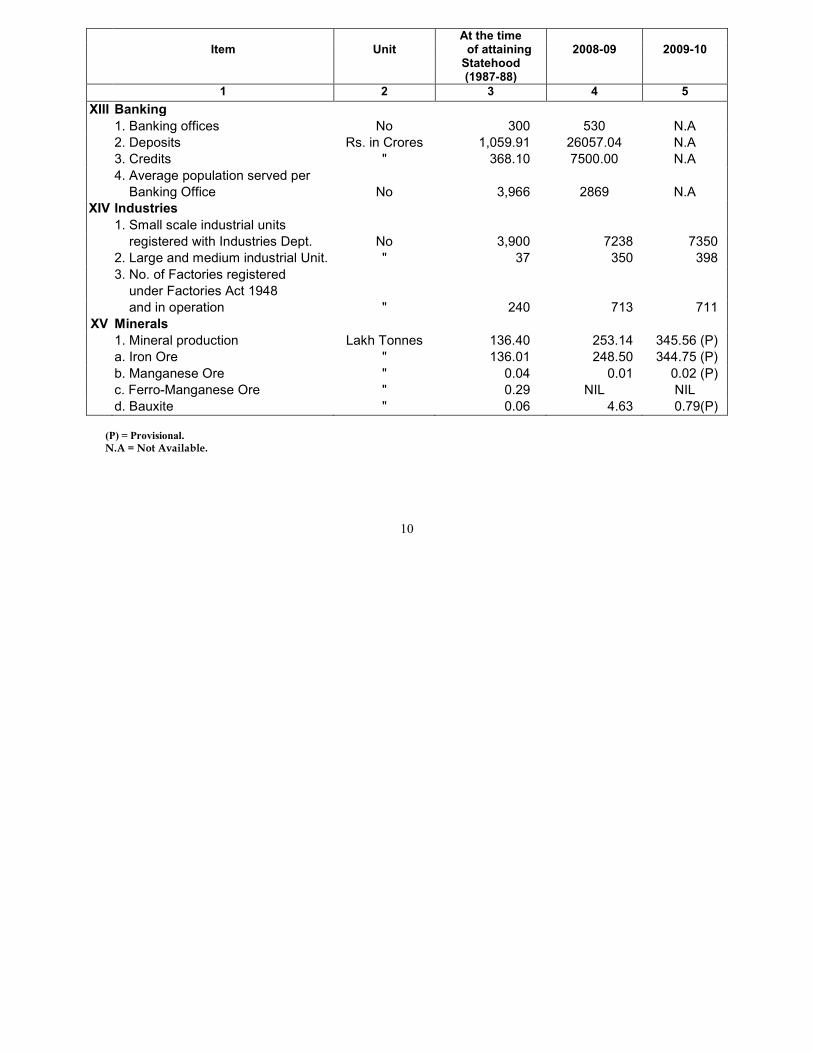
XIII Banking
1. Banking offices No 300 530 N.A
2. Deposits Rs. in Crores 1,059.91 26057.04 N.A
3. Credits " 368.10 7500.00 N.A
4. Average population served per
Banking Office No 3,966 2869 N.A
XIV Industries
1. Small scale industrial units
registered with Industries Dept. No 3,900 7238 7350
2. Large and medium industrial Unit. " 37 350 398
3. No. of Factories registered
under Factories Act 1948
and in operation " 240 713 711
XV Minerals
1. Mineral production Lakh Tonnes 136.40 253.14 345.56 (P)
a. Iron Ore " 136.01 248.50 344.75 (P)
b. Manganese Ore " 0.04 0.01 0.02 (P)
c. Ferro-Manganese Ore " 0.29 NIL NIL
d. Bauxite " 0.06 4.63 0.79(P)
(P) = Provisional.
N.A = Not Available.
11
At the time Item Unit of attaining 2008-09 2009-10 Statehood (1987-88)
1 2 3 4 5
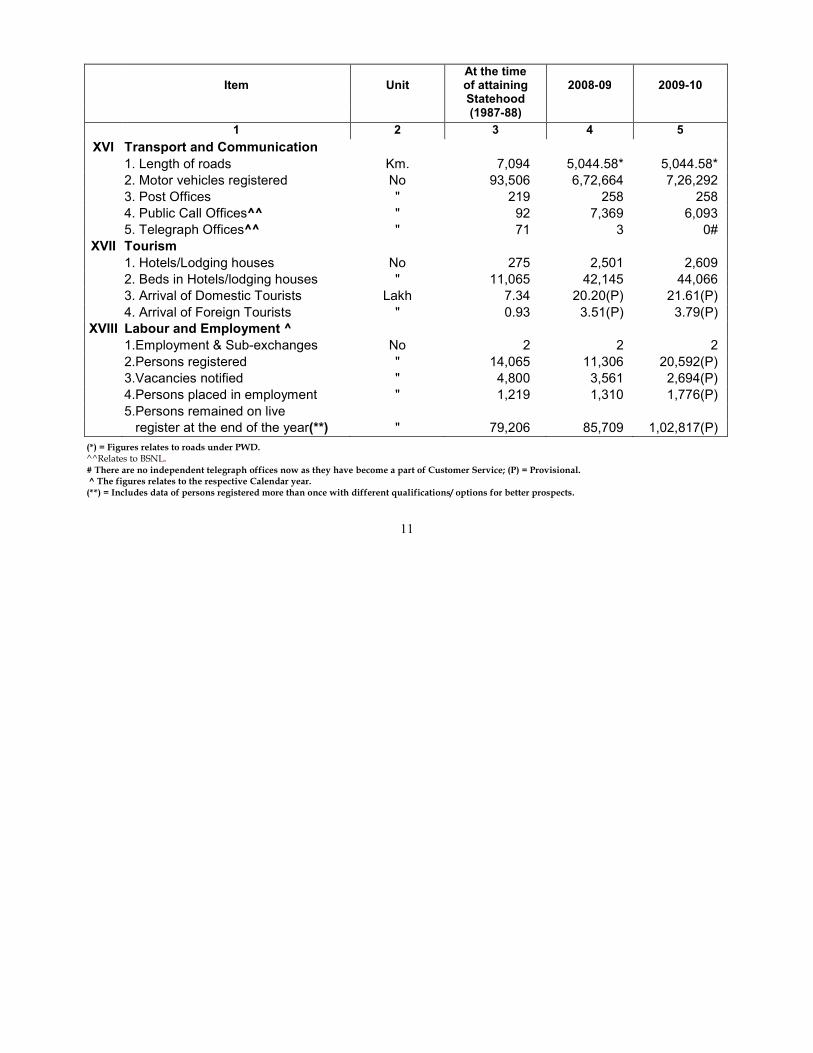
XVI Transport and Communication
1. Length of roads Km. 7,094 5,044.58* 5,044.58*
2. Motor vehicles registered No 93,506 6,72,664 7,26,292
3. Post Offices " 219 258 258
4. Public Call Offices^^ " 92 7,369 6,093
5. Telegraph Offices^^ " 71 3 0#
XVII Tourism
1. Hotels/Lodging houses No 275 2,501 2,609
2. Beds in Hotels/lodging houses " 11,065 42,145 44,066
3. Arrival of Domestic Tourists Lakh 7.34 20.20(P) 21.61(P)
4. Arrival of Foreign Tourists " 0.93 3.51(P) 3.79(P)
XVIII Labour and Employment ^
1.Employment & Sub-exchanges No 2 2 2
2.Persons registered " 14,065 11,306 20,592(P)
3.Vacancies notified " 4,800 3,561 2,694(P)
4.Persons placed in employment " 1,219 1,310 1,776(P)
5.Persons remained on live
register at the end of the year(**) " 79,206 85,709 1,02,817(P)
(*) = Figures relates to roads under PWD. ^^Relates to BSNL. # There are no independent telegraph offices now as they have become a part of Customer Service; (P) = Provisional. ^ The figures relates to the respective Calendar year. (**) = Includes data of persons registered more than once with different qualifications/ options for better prospects.
12
At the time Item Unit of attaining 2008-09 2009-10
Statehood
(1987-88)
1 2 3 4 5
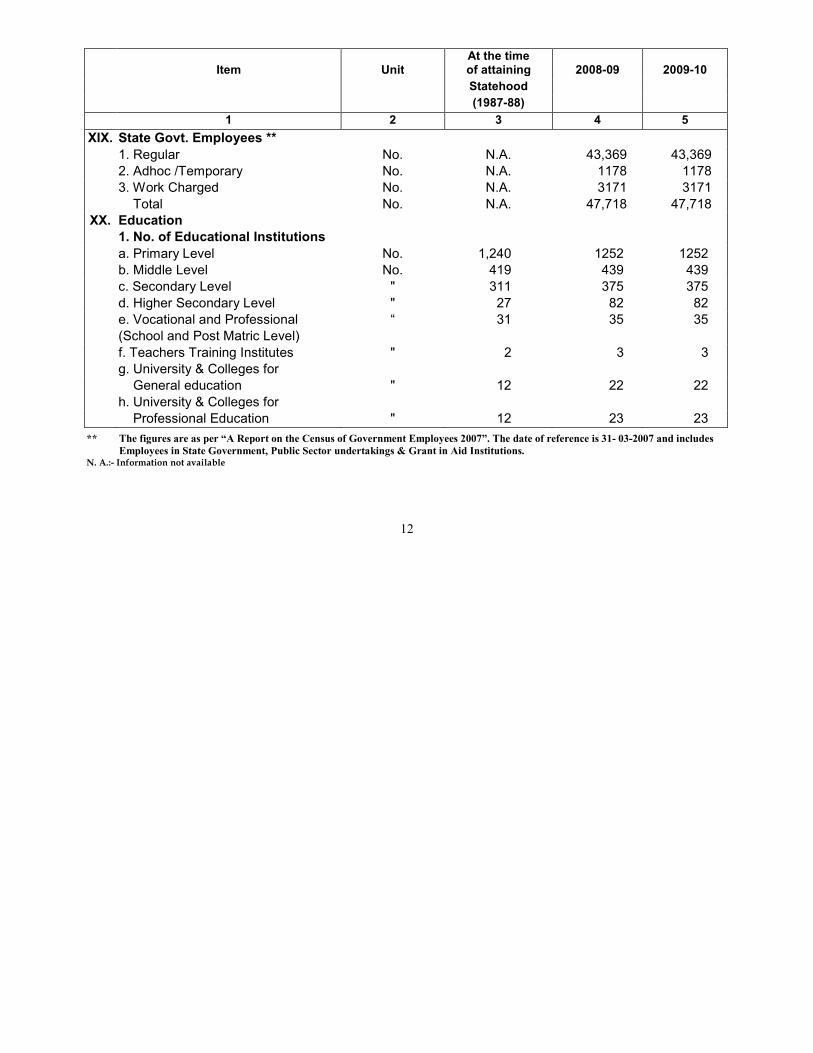
XIX. State Govt. Employees **
1. Regular No. N.A. 43,369 43,369
2. Adhoc /Temporary No. N.A. 1178 1178
3. Work Charged No. N.A. 3171 3171
Total No. N.A. 47,718 47,718
XX. Education
1. No. of Educational Institutions
a. Primary Level No. 1,240 1252 1252
b. Middle Level No. 419 439 439
c. Secondary Level " 311 375 375
d. Higher Secondary Level " 27 82 82
e. Vocational and Professional “ 31 35 35
(School and Post Matric Level)
f. Teachers Training Institutes " 2 3 3
g. University & Colleges for
General education " 12 22 22
h. University & Colleges for
Professional Education " 12 23 23
** The figures are as per “A Report on the Census of Government Employees 2007”. The date of reference is 31- 03-2007 and includes
Employees in State Government, Public Sector undertakings & Grant in Aid Institutions. N. A.:- Information not available
13
At the time
Item Unit of attaining 2008-09 2009-10
Statehood
(1987-88)
1 2 3 4 5
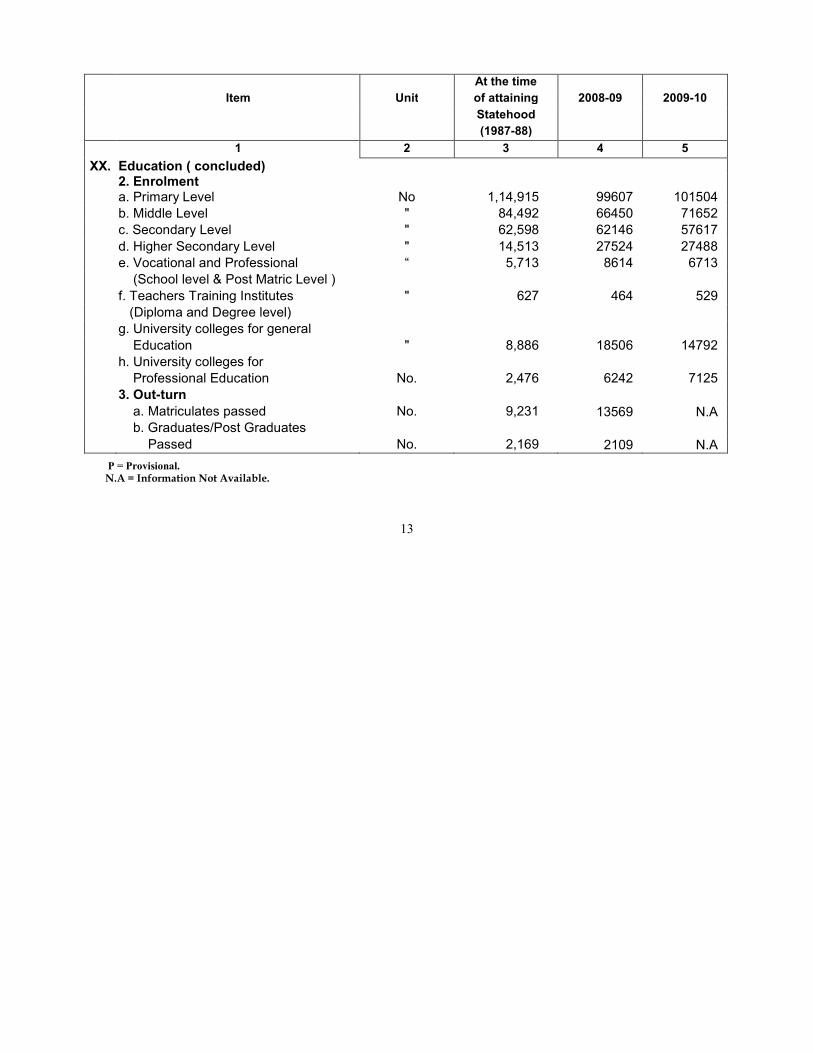
XX. Education ( concluded) 2. Enrolment a. Primary Level No 1,14,915 99607 101504
b. Middle Level " 84,492 66450 71652
c. Secondary Level " 62,598 62146 57617
d. Higher Secondary Level " 14,513 27524 27488
e. Vocational and Professional “ 5,713 8614 6713
(School level & Post Matric Level )
f. Teachers Training Institutes " 627 464 529
(Diploma and Degree level)
g. University colleges for general
Education " 8,886 18506 14792
h. University colleges for
Professional Education No. 2,476 6242 7125
3. Out-turn
a. Matriculates passed No. 9,231 13569 N.A
b. Graduates/Post Graduates
Passed No. 2,169 2109 N.A
P = Provisional.
N.A = Information Not Available.

14
At the time Item Unit of attaining 2008-09 2009-10 Statehood (1987-88)
1 2 3 4 5
XXI. Medical and Health Services 1. Government Hospitals No 31 31 31 2. Private Hospitals " 82 127 127 3. Beds in Govt.Hospitals " 2,371 2841 2872 4. Beds in Private Hospitals " 1,312 2360 2716 5. Health Centers: a. Community Health Centres No 3 5 5 b. Primary Health Centres " 14 19 19 c. Urban Health Centres* " 5 5 5 d. Rural Medical Dispensaries " 29 29 29 e. Sub Centres " 166 172 172 f. Dental Clinics " 17 18 18 g. Medical Dispensary " - 1 1 6. Sterilisations performed No 4,457 5286 4140 7. Intra Uterine device inserted " 3,162 2615 2139 8. Contraceptive users
(C.C.U. + O.P Users) " 11,033 13756 13690
9. Doctor population ratio " 1:882 1:586** 1:399 10.Bed population ratio " 1:316 1:279** 1:272
*: Including 1 UHC of GMC Bambolim.
**: Information pertains to 2006.
P = Provisional.
15
At the time
Item Unit of attaining 2008-09* 2009-10*
Statehood
(1987-88)
1 2 3 4 5
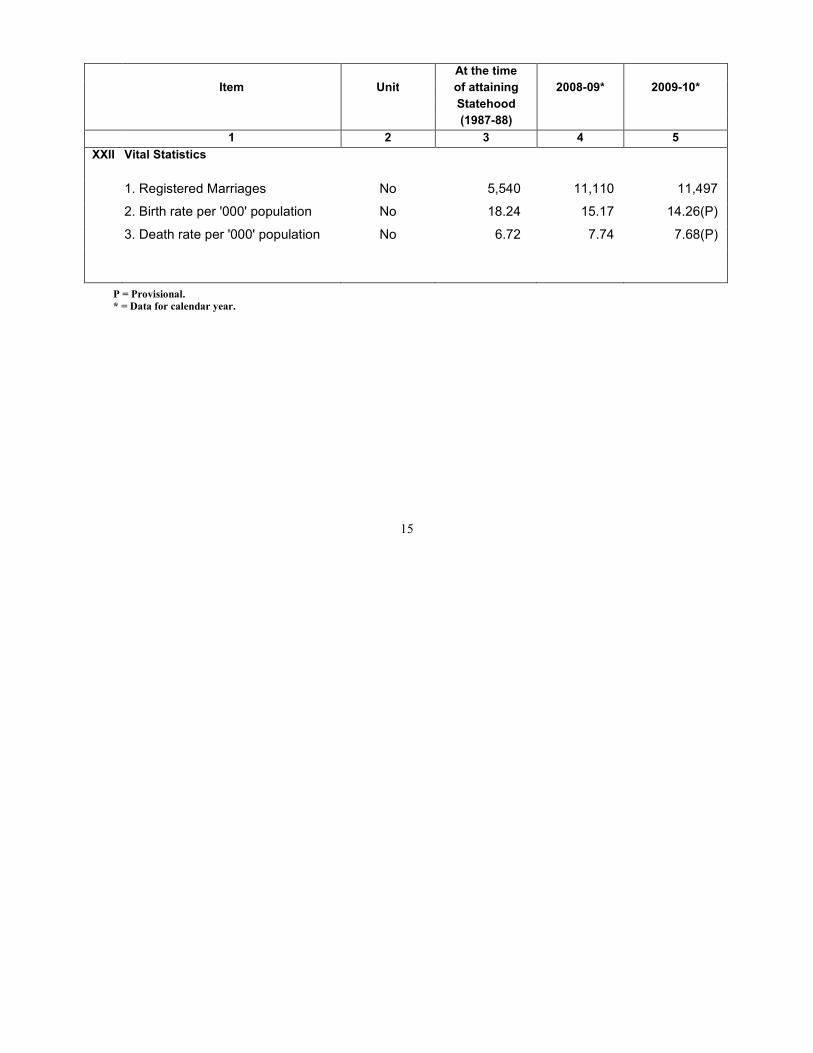
XXII Vital Statistics
1. Registered Marriages No 5,540 11,110 11,497
2. Birth rate per '000' population No 18.24 15.17 14.26(P)
3. Death rate per '000' population No 6.72 7.74 7.68(P)
P = Provisional. * = Data for calendar year.
16
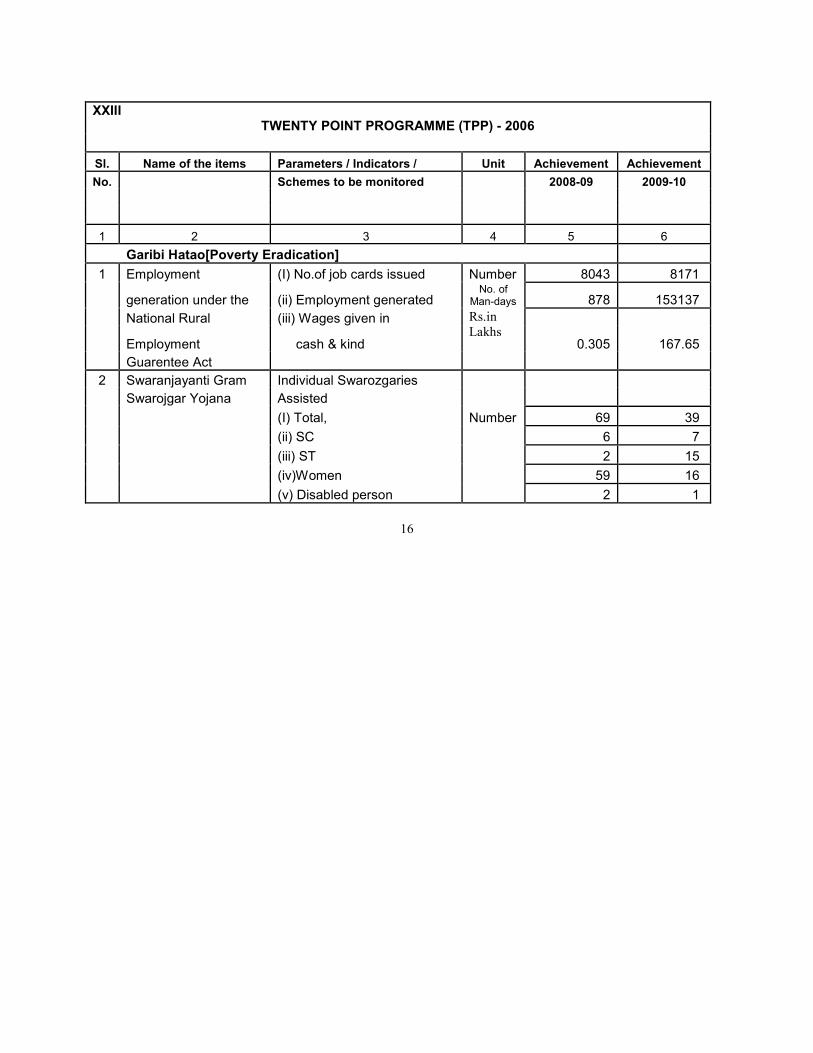
XXIII TWENTY POINT PROGRAMME (TPP) - 2006
Sl. Name of the items Parameters / Indicators / Unit Achievement Achievement
No. Schemes to be monitored 2008-09 2009-10
1 2 3 4 5 6
Garibi Hatao[Poverty Eradication]
1 Employment (I) No.of job cards issued Number 8043 8171
generation under the (ii) Employment generated No. of
Man-days 878 153137
National Rural (iii) Wages given in Rs.in
Lakhs
Employment cash & kind 0.305 167.65
Guarentee Act
2 Swaranjayanti Gram Individual Swarozgaries
Number
Swarojgar Yojana Assisted
(I) Total, 69 39
(ii) SC 6 7
(iii) ST 2 15
(iv)Women 59 16
(v) Disabled person 2 1
17
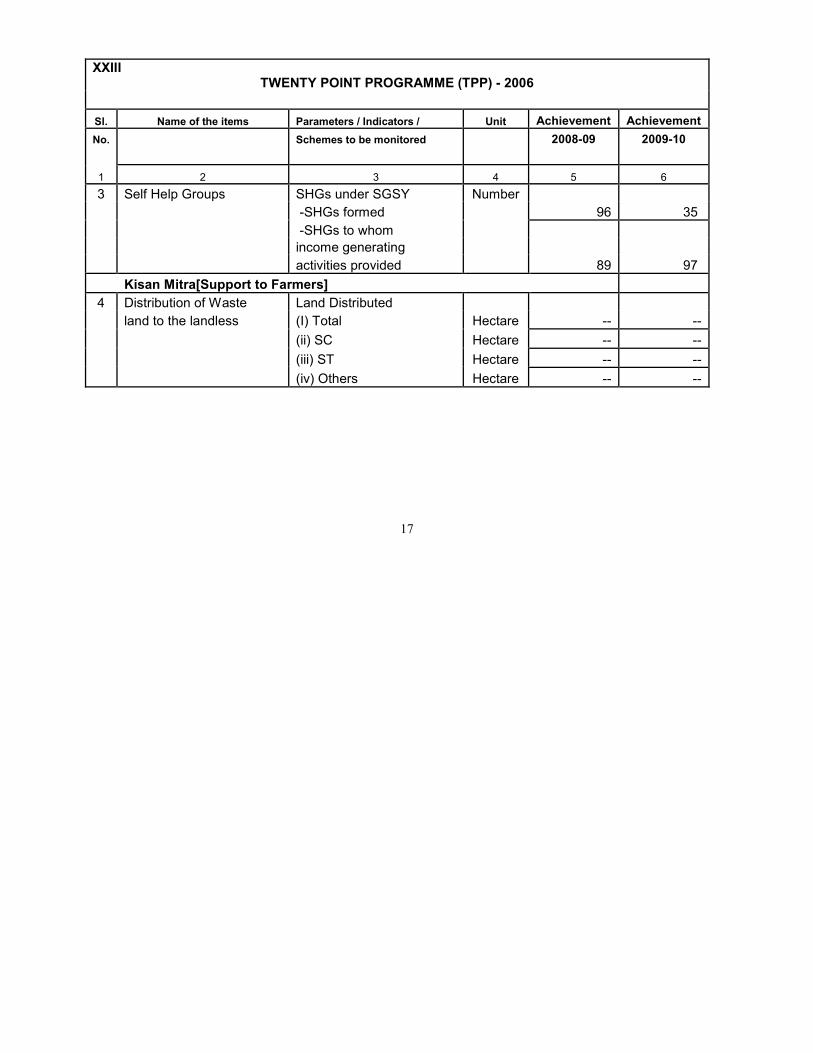
XXIII TWENTY POINT PROGRAMME (TPP) - 2006
Sl. Name of the items Parameters / Indicators / Unit Achievement Achievement
No. Schemes to be monitored 2008-09 2009-10
1 2 3 4 5 6
3 Self Help Groups SHGs under SGSY Number
-SHGs formed 96 35
-SHGs to whom
income generating
activities provided 89 97
Kisan Mitra[Support to Farmers]
4 Distribution of Waste Land Distributed
land to the landless (I) Total Hectare -- --
(ii) SC Hectare -- --
(iii) ST Hectare -- --
(iv) Others Hectare -- --
18
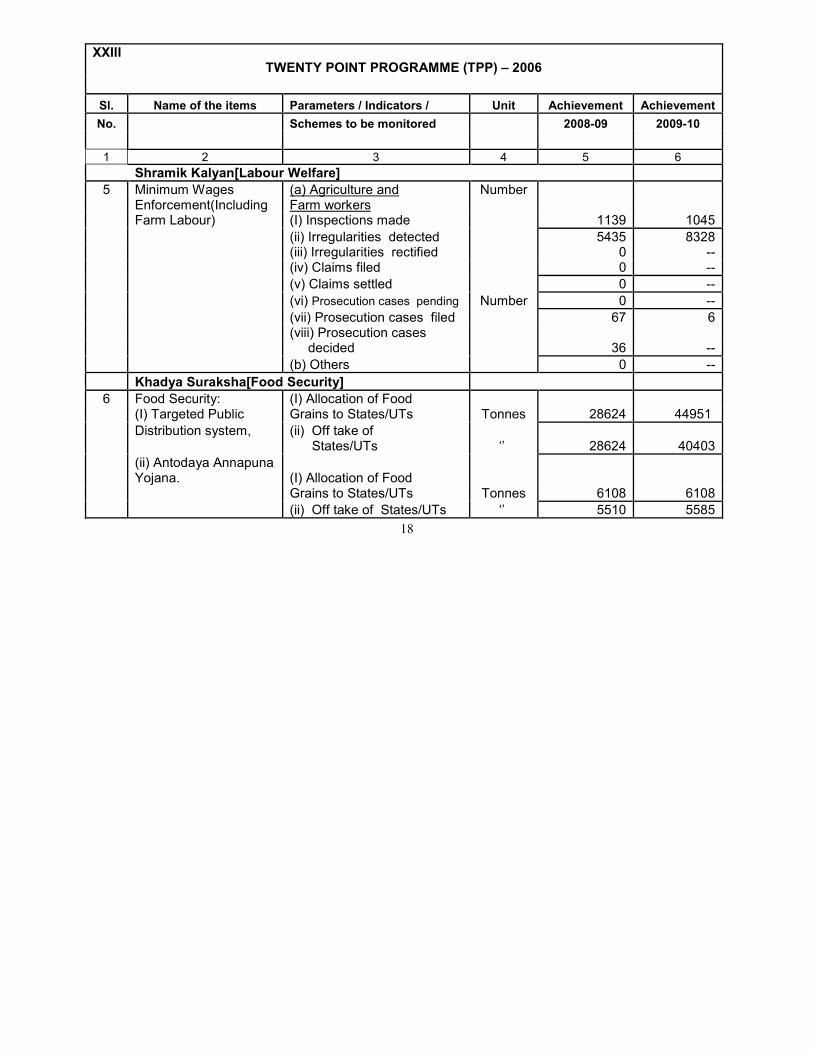
XXIII TWENTY POINT PROGRAMME (TPP) – 2006
Sl. Name of the items Parameters / Indicators / Unit Achievement Achievement
No. Schemes to be monitored 2008-09 2009-10
1 2 3 4 5 6
Shramik Kalyan[Labour Welfare]
5 Minimum Wages (a) Agriculture and Number Enforcement(Including Farm workers Farm Labour) (I) Inspections made 1139 1045
(ii) Irregularities detected 5435 8328 (iii) Irregularities rectified 0 -- (iv) Claims filed 0 --
(v) Claims settled 0 --
(vi) Prosecution cases pending Number 0 --
(vii) Prosecution cases filed 67 6 (viii) Prosecution cases decided 36 --
(b) Others 0 --
Khadya Suraksha[Food Security]
6 Food Security: (I) Allocation of Food (I) Targeted Public Grains to States/UTs Tonnes 28624 44951
Distribution system, (ii) Off take of States/UTs ‘’ 28624 40403
(ii) Antodaya Annapuna Yojana. (I) Allocation of Food
Grains to States/UTs Tonnes 6108 6108
(ii) Off take of States/UTs ‘’ 5510 5585
19
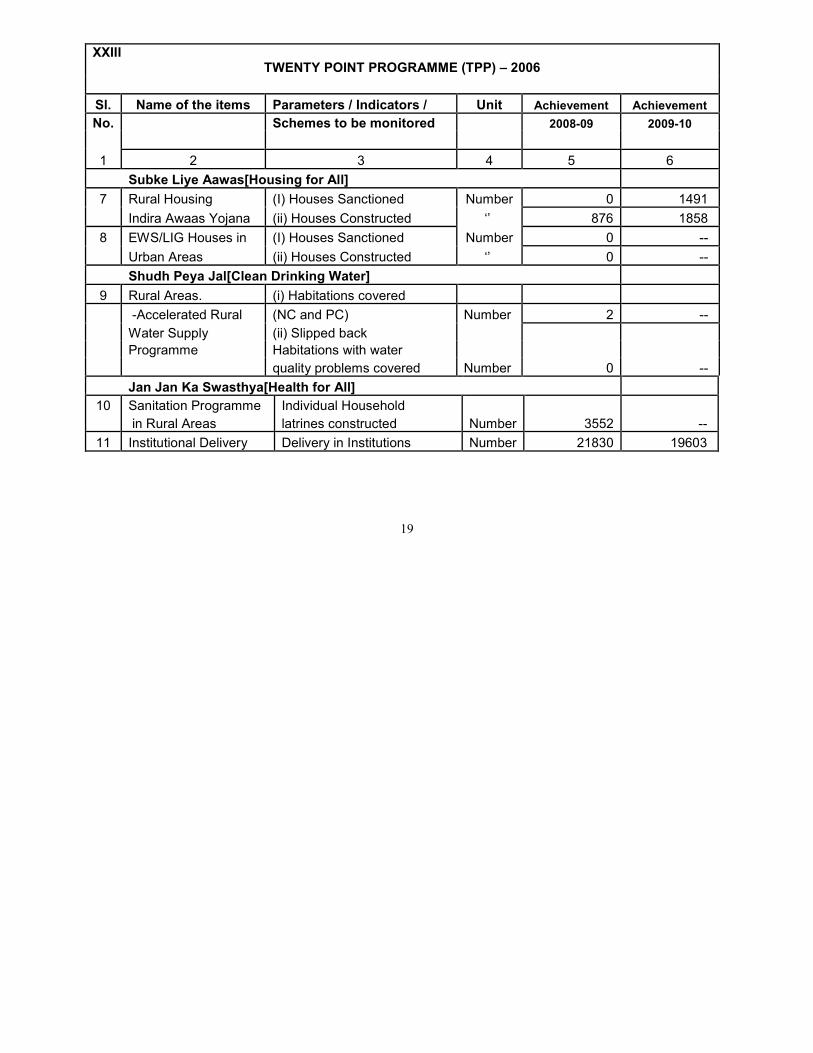
XXIII TWENTY POINT PROGRAMME (TPP) – 2006
Sl. Name of the items Parameters / Indicators / Unit Achievement Achievement
No. Schemes to be monitored 2008-09 2009-10
1 2 3 4 5 6
Subke Liye Aawas[Housing for All]
7 Rural Housing (I) Houses Sanctioned Number 0 1491
Indira Awaas Yojana (ii) Houses Constructed ‘’ 876 1858
8 EWS/LIG Houses in (I) Houses Sanctioned Number 0 --
Urban Areas (ii) Houses Constructed ‘’ 0 --
Shudh Peya Jal[Clean Drinking Water]
9 Rural Areas. (i) Habitations covered
-Accelerated Rural (NC and PC) Number 2 --
Water Supply (ii) Slipped back
Programme Habitations with water
quality problems covered Number 0 --
Jan Jan Ka Swasthya[Health for All]
10 Sanitation Programme Individual Household
in Rural Areas latrines constructed Number 3552 --
11 Institutional Delivery Delivery in Institutions Number 21830 19603
20
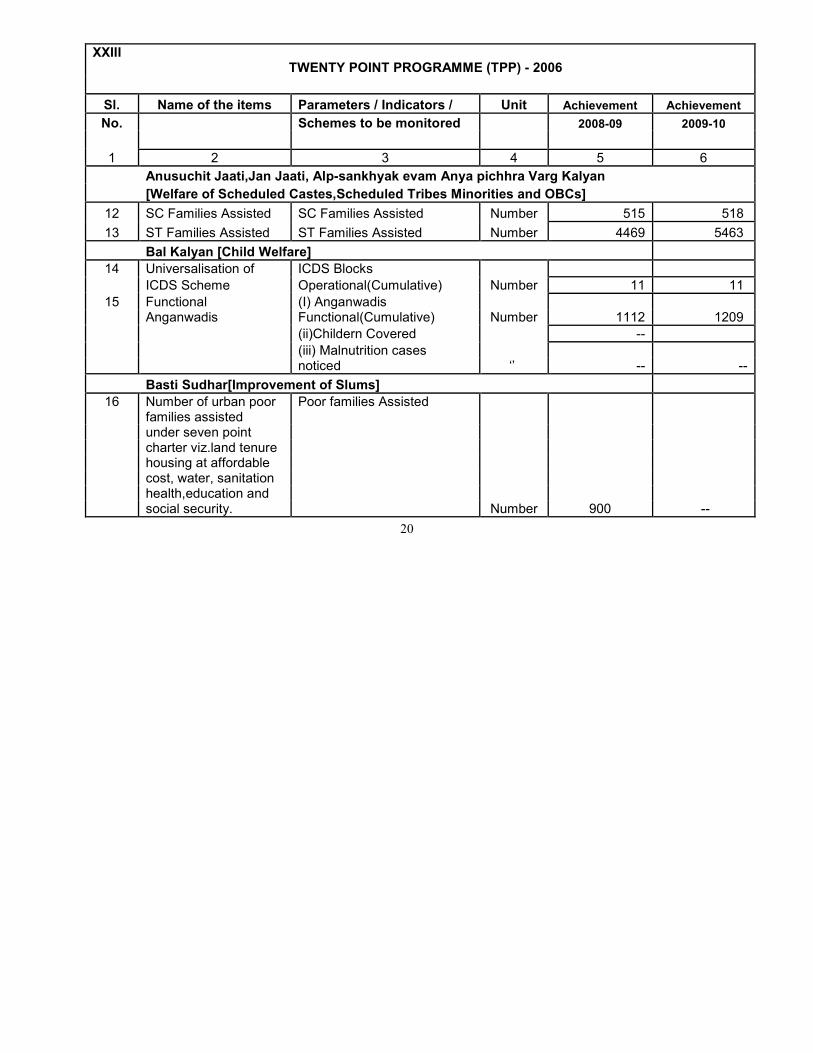
XXIII TWENTY POINT PROGRAMME (TPP) - 2006
Sl. Name of the items Parameters / Indicators / Unit Achievement Achievement
No. Schemes to be monitored 2008-09 2009-10
1 2 3 4 5 6
Anusuchit Jaati,Jan Jaati, Alp-sankhyak evam Anya pichhra Varg Kalyan
[Welfare of Scheduled Castes,Scheduled Tribes Minorities and OBCs]
12 SC Families Assisted SC Families Assisted Number 515 518
13 ST Families Assisted ST Families Assisted Number 4469 5463
Bal Kalyan [Child Welfare]
14 Universalisation of ICDS Blocks
ICDS Scheme Operational(Cumulative) Number 11 11
15 Functional (I) Anganwadis Anganwadis Functional(Cumulative) Number 1112 1209
(ii)Childern Covered --
(iii) Malnutrition cases noticed ‘’ -- --
Basti Sudhar[Improvement of Slums]
16 Number of urban poor Poor families Assisted families assisted under seven point charter viz.land tenure housing at affordable cost, water, sanitation health,education and social security. Number 900 --
21
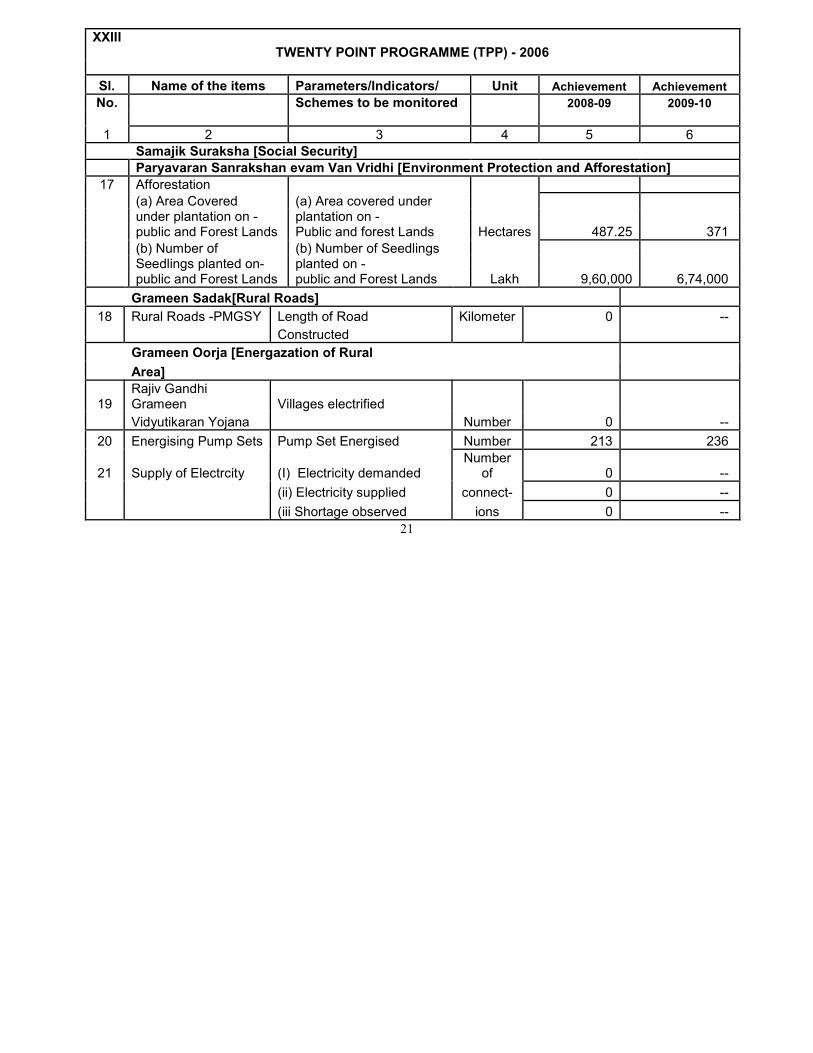
XXIII TWENTY POINT PROGRAMME (TPP) - 2006
Sl. Name of the items Parameters/Indicators/ Unit Achievement Achievement
No. Schemes to be monitored 2008-09 2009-10
1 2 3 4 5 6
Samajik Suraksha [Social Security]
Paryavaran Sanrakshan evam Van Vridhi [Environment Protection and Afforestation]
17 Afforestation
(a) Area Covered (a) Area covered under under plantation on - plantation on - public and Forest Lands Public and forest Lands Hectares 487.25 371
(b) Number of (b) Number of Seedlings Seedlings planted on- planted on - public and Forest Lands public and Forest Lands Lakh 9,60,000 6,74,000
Grameen Sadak[Rural Roads]
18 Rural Roads -PMGSY Length of Road Kilometer 0 --
Constructed
Grameen Oorja [Energazation of Rural
Area]
19 Rajiv Gandhi Grameen Villages electrified
Vidyutikaran Yojana Number 0 --
20 Energising Pump Sets Pump Set Energised Number 213 236
21 Supply of Electrcity (I) Electricity demanded Number
of 0 --
(ii) Electricity supplied connect- 0 --
(iii Shortage observed ions 0 --

22