gmlc drc framework template sag meeting 3
TRANSCRIPT

P R E S E N T E D B Y
Sandia National Laboratories is a multimission laboratory managed and operated by National Technology & Engineering
Solutions of Sandia, LLC, a wholly owned subsidiary of Honeywell International Inc., for the U.S. Department of Energy’s National Nuclear Security Administration under contract DE-NA0003525.
Resilient Community Design:From Framework to ProcessGMLC DRC SAG Meeting 4
Bobby Jeffers, Rober t Broderick, Kat Jones, Mercy DeMenno

Goals and objectives recap
Overarching Goal:• Demonstrate an actionable path toward more resilient communities through consequence-based approaches to grid
planning and investment
Objectives:• Solidify – through demonstration, outreach, verification, and gap analysis – a framework for community resilience planning
focused on grid modernization and investment involving the key stakeholders in the community including electric utilities• Set a clear, actionable path toward widespread adoption of community-focused resilience planning within the grid
community
Why the SAG?• Inform the technical and regulatory solution space for the project, and advise an actionable path forward to implement
community-focused resilience planning for utilities nationwide• Project partners will educate stakeholders emerging technologies that can provide grid resilience, and address how these
technologies can provide community resilience• Stakeholders will provide feedback on unique aspects of their regions that enable or discourage alignment of community-
focused resilience planning with electric utility investment
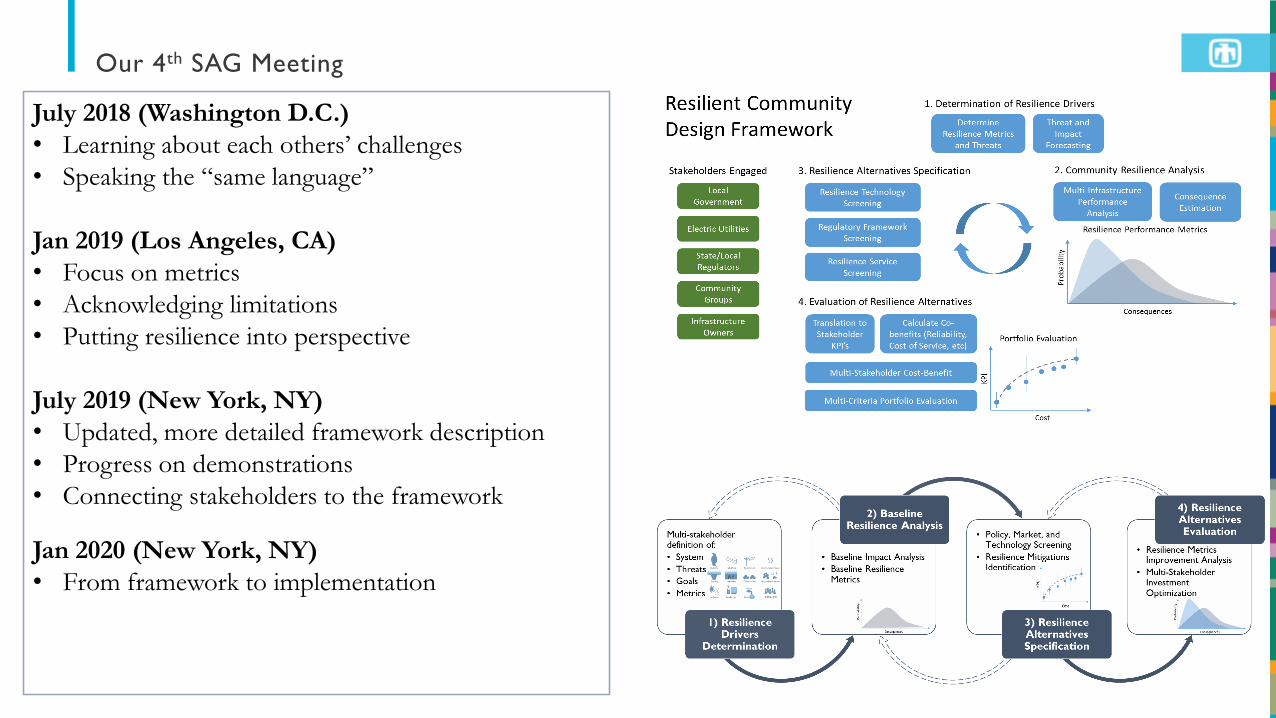
Our 4th SAG Meeting
July 2018 (Washington D.C.)• Learning about each others’ challenges• Speaking the “same language”
Jan 2019 (Los Angeles, CA)• Focus on metrics• Acknowledging limitations• Putting resilience into perspective
July 2019 (New York, NY)• Updated, more detailed framework description• Progress on demonstrations• Connecting stakeholders to the framework
Jan 2020 (New York, NY)• From framework to implementation

Goals and objectives for this meeting
From Framework to Implementation• What do you need that you don’t have today?
• Better science, data, tools, processes• Partners, stakeholder connections• More funding for resilience projects• Resilience-focused policy
Demonstration Partners• San Antonio
• Clearest City-Utility connection• El Cano Martin Pena Communities in San Juan, PR
• Highly autonomous partner with strong resilience drivers• National Grid
• Several grid modernization and resilience investments• Resilience-inclusive cost-benefit framework
Project Partners• SUNY Buffalo
• What do people lose when they lose power?• Synapse Energy Economics
• How do we organize our thinking toward aligning cities and utilities?
• Clemson University and NMSU• What is feasible today that recently wasn’t?
• NARUC and DOE• What are the regulatory challenges and
opportunities?
SAG Updates• Working group progress• New investments or funding avenues• Benefits of bringing in unique stakeholders• Progress working with PUC’s, SEO’s, legislatures

Perspectives on metrics
What is the difference between an attribute-based and performance-based metric?• Attribute based:
• Things you can count today• Features or characteristics that we think will improve performance
• What makes my system more resilient?• Performance-based:
• Things you can only measure following disruptions (or model)• Measures what you care about
• How resilient is my system?
Efficiency Sustainability Resilience
Number of efficient gens Renewable capacity kW on microgrids
Efficient water heaters deployed PV / battery recycling capacity miles of hardened conductor
Attribute-based
Energy affordability Greenhouse gas emissions kWh not served to critical customers
Total cost of service Average global temperature Social burden due to lack of services
Performance-based

Performance-based process
If I want a performance-based resilience metric, can I calculate it today?• Pure grid-performance:
• kWh not served to critical customers• Consequence-focused:
• Social burden• Gross production losses• Performance of missions ensuring national security
0
200,000
400,000
600,000
800,000
1,000,000
0 2 4 6 8 10 12 14 16 18 20 22 24 26 28 30 32 34 36 38 40 42
Cust
omer
s w
itho
ut p
ower
Days after landfall
Entergy Louisiana and New Orleans Restoration of Customer Outages vs. Time for Major Hurricanes
Katrina (LA, 2005)
Rita (LA, 2005)
Gustav (LA, 2008)
Ike (LA, 2008)
Threat characterization
Impact analysis
Infrastructure performance analysis
Consequence analysis

Data and tools for performance-based process
Threat Impact Performance Consequence
Flood:• FEMA FIRMs• Hydrological ModelingEarthquake:• USGS PGA estimatesLandslide:• USGS susceptibilityWildfire:• Data
Cyber Attack:• Event-based
characterizationPhysical Attack:• Criticality and
vulnerability estimatesEMP/GMD:• Atmospheric modeling• Electromagnetic
coupling modeling
Grid components:• Fragility models• Physics-based models
Grid system:• Static and dynamic
power flow models• Discrete event models
(e.g. MDT)• Statistical models• Simplified/surrogate
models
Additional Infrastructures:• Natural gas• Water• Communications• Wastewater• Transportation• Fuel delivery• Food system
Economy:• Input-output modeling• Computable general
equilibrium models• Econometrics
Society:• Needs-based travel cost
modeling• Quality-adjusted life
years
Security:• Mission dependency
modeling

Connecting stakeholders to the process
Cities • Define Consequence
• Define Threats
• Define interdependent infrastructures
• Set goals
Utilities
Regulators
• Map system performance to consequence
• Threat to system performance
• Balance technical rigor with analysis burden
• Connect initiatives• Open new
opportunities
• Design for triple-bottom-line
• Ensure designs address goals
• Re-evaluate consequence given alternatives
• Evaluate system performance under alternatives
• Ensure final portfolios meet goals, are feasible, and equitable

Next steps
We are seeing value from integrating cities in the resilience discussion. How can we better integrate this viewpoint?• Many loosely connected offices within city gov’t• Cities can be one financing opportunity• Smaller communities also have a role (See: Puerto Rico and NY examples)
What are the strengths and challenges of the resilience node concept?• Does it necessitate inverter-dominated or DC microgrids?• Protection remains a challenge – what are some other challenges?
We are seeing aggressive fossil-free goals. How can we achieve these goals and maintain resilience?• Great can be enemy of the good: cities “skipping” district thermal systems• Better balance between sustainability, efficiency, and resilience?
How far should we go “beyond grid?”• Transportation systems• Emergency response• Buildings• Communications• Other...

P R E S E N T E D B Y
Sandia National Laboratories is a multimission laboratory managed and operated by National Technology & Engineering
Solutions of Sandia, LLC, a wholly owned subsidiary of Honeywell International Inc., for the U.S. Department of Energy’s National Nuclear Security Administration under contract DE-NA0003525.
Caño Martín Peña Communities, San Juan, PRGMLC DRC SAG Meeting 4
Bobby Jeffers, Efrain O’Neil l Car r i l lo, Holly Eagleston

Applying the DRC Framework in Puerto Rico
Institutions in crisis:• Government and government-owned utility (PREPA) in bankruptcy• Perceived lack of transparency and accountability• Mistrust among key energy stakeholders• Lack of clear leadership on energy matters
Frustrated citizens:• Bad experiences and perceptions regarding public-private-partnerships• Communities are getting tired of interviews, visits, questions about their experiences during and after Maria.
Must provide a value-proposition.
Proposed path forward:• Apply the DRC framework, but customize the stakeholders and processes involved for the constraints of the
communities• Ensure energy initiatives endure government changes, can be sustained, and are inclusive• In general, there is broad support for community-based and community-led initiatives
References: E. O'Neill-Carrillo, E. Mercado, O. Luhring, I. Jordan and A. Irizarry-Rivera, "Community Energy Projects in the Caribbean: Advancing Socio-Economic Development and Energy Transitions," IEEE Technology and Society Magazine, vol. 38, no. 3, pp. 44-55, Sept. 2019.E. O’Neill-Carrillo, J. McCalley, A. Kimber. “Stakeholder Perspectives on Increasing Electric Power Infrastructure Integrity.” ASEE Annual Conference, June 2019, Tampa.A. Kwasinski, F. Andrade, M. Castro-Sitiriche and E. O’Neill-Carrillo, "Hurricane Maria Effects on Puerto Rico Electric Power Infrastructure," IEEE Power and Energy Technology Systems Journal, 2019. E. O’Neill-Carrillo, I. Jordán, A. Irizarry-Rivera, R. A. Cintrón. Invited paper: “The Long Road to Community Microgrids,” IEEE Electrification Magazine, vol. 6, no. 4, December 2018, pp. 6 – 17.E. O’Neill-Carrillo, Miguel A. Rivera-Quiñones. Invited paper: “Energy Policies in Puerto Rico and their Impact on the Likelihood of a Resilient and Sustainable Electric Power Infrastructure,” CENTRO, Journal of the Center for Puerto Rican Studies, Hunter College, no. 3, vol. 30, 2018.E. O’Neill-Carrillo, A.A. Irizarry-Rivera, Cecilio Ortiz, Marla Pérez-Lugo. “The Role of Engineers as Policy Entrepreneurs toward Energy Transformations,” Proceedings of the ASEE123rd Annual Conference, June 2016, New Orleans, LA.

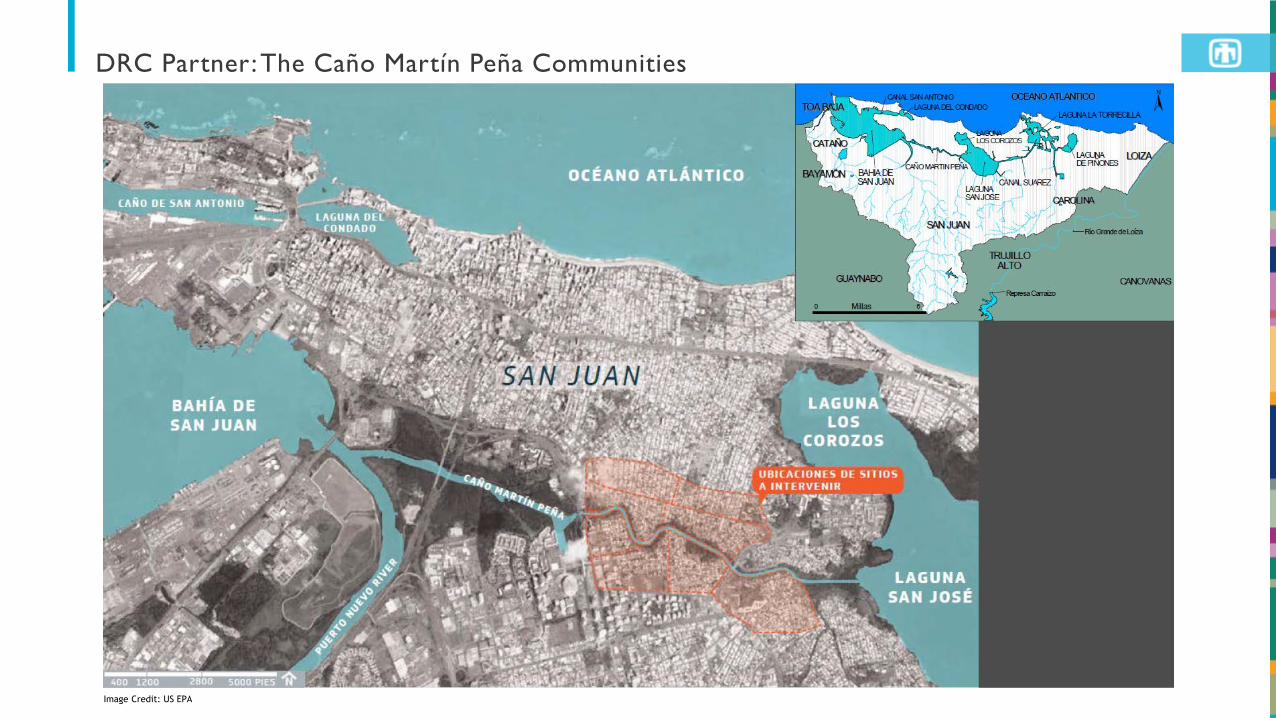
DRC Partner: The Caño Martín Peña Communities
• Caño Martín Peña (CMP) is a 3.75 mile long tidal channel is in the San Juan Bay Estuary (part of EPA’s National Estuary Program).
• The CMP is now an obstructed, contaminated body of water creating a constant flood danger.• Eight economically-challenged communities remain today in the vicinity of CMP (around 25,000 people). • The ENLACE Project Corporation was created by Law 489 in 2004 to help seven of the eight communities improve
their quality of life (the other community, Cantera, got a separate law). • The seven communities occupy an area of around 1.82 km2 (High population density area).• The law made the seven CMP communities a special planning district with autonomy with regards to planning
decisions (it has been described as similar to a “county”).
Image Credit: Wikimedia commons user Moebiusuibeom-en
Source: Lyvia N. Rodriguez Del Valle. “ENLACE Caño Martín Peña: A Restoration and Resiliency Project,” Written testimony during a Subcommittee on Environment hearing on Response and Recovery to Environmental Concerns from the 2017 Hurricane Season, U.S. Congress, November 14, 2017.
Image Credit: labgov.city Image Credit: US EPA
DRC Partner: The Caño Martín Peña Communities
Image Credit: US EPA

Step 1: Determining Resilience Drivers
Goals:• Constant community engagement: Planning-Action-
Reflection• Implement Comprehensive Development and Land Use
Plan• Implement sewage system (currently, 33% of households
have none)• Environmental restoration• Design stormwater management facilities• Housing and redevelopment• Prevent displacement
Example strategies/actions:• Relocate homes in high risk flood zones• Green infrastructure (including microgrids)• Environmental restoration projects• Equitable development• Participatory democracy
Source: J. Bernagros, W. Michaels, S. Mossop, C. Muñiz Pérez. “Developing Green Infrastructure Typologies,” Water Environment Federation Technical Exhibition & Conference, Oct. 2, 2018

Step 1: Determining Resilience Drivers
Known threats:• Flooding
• Obstructed, contaminated channel• High water table• Poor soil conditions• Collapsed stormwater system
• Hurricanes• Cause flooding + high wind (local damages)
• Earthquakes• Remotely-driven power outages
Other resilience challenges/opportunities:• Access to funding• History of environmental and social injustices• High electric energy costs• PREPA’s IRP process
Sources: J. Bernagros, W. Michaels, S. Mossop, C. Muñiz Pérez. “Developing Green Infrastructure Typologies,” Water Environment Federation Technical Exhibition & Conference, Oct. 2, 2018. Lyvia N. Rodriguez Del Valle. “ENLACE Caño Martín Peña: A Restoration and Resiliency Project,” Written testimony during a Subcommittee on Environment hearing on Response and Recovery to Environmental Concerns from the 2017 Hurricane Season, U.S. Congress, November 14, 2017. Image Credit: USGS
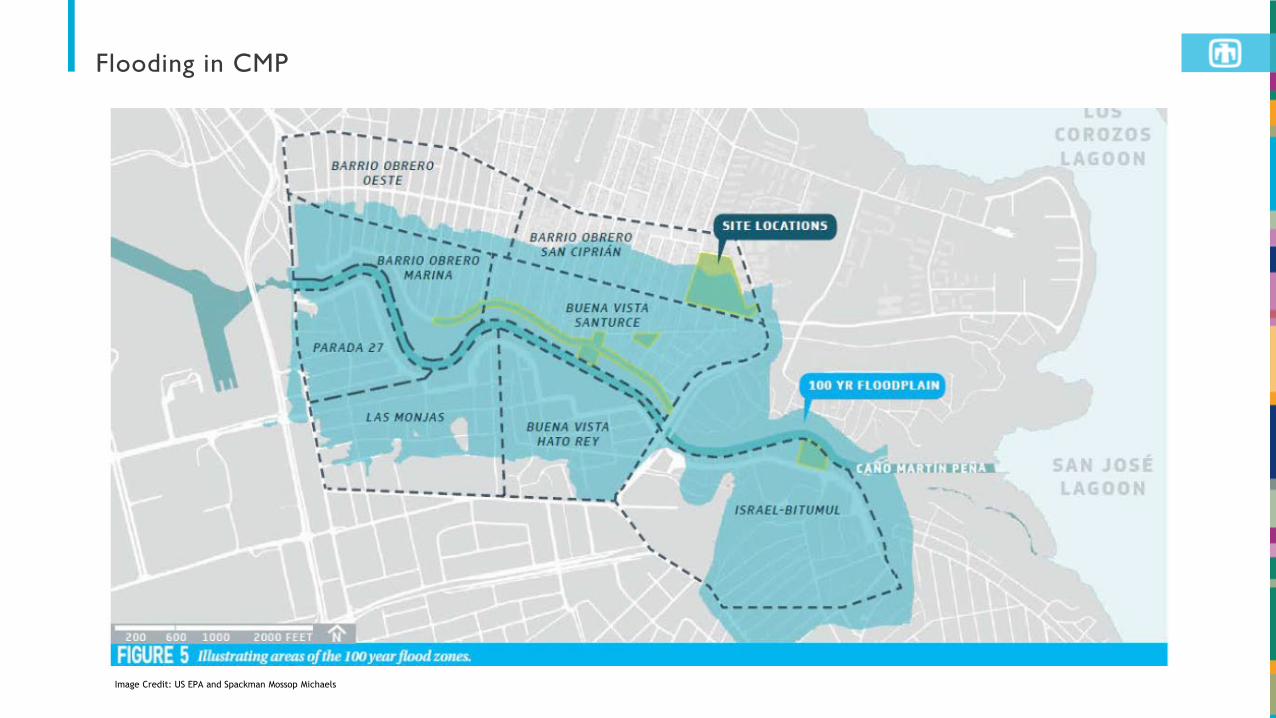
Flooding in CMP
Image Credit: US EPA and Spackman Mossop Michaels

Step 2: Baseline Resilience Analysis (we are here today)
Baseline metrics:
• Efficiency/Affordability• Average bills for residential and commercial customers
• No tiered rates• Yes to net metering• Flat rate for public housing
• Sustainability• GHG Emissions
• Estimated average 1.25 lbs CO2e per kWh for 2018• Fraction of power from renewable sources
• Estimate amount of local PV installed + capacity factor• Lifecycle impacts
• End of life challenges – no current plan for PV/battery recycling
• Resilience• Social Burden to acquire services
• Sandia modeling methodology + U-Buffalo validation
Year Residential Commercial Industrial
2016 17.93 19.57 15.83
2017 (María) 22.26 22.72 19.70
2018 20.73 23.08 19.04
Average in cents/kWh for the three main class rates (source: EIA, Electric Power Monthly, December 2019)

Infrastructure in CMP
Image Credit: ENLACE project corporation
B
B
B
B
BB B
B
B
B B
B
B B B B
B
B
B
P - Power substation
G - Gas station
Ph - Pharmacy
C - Community center
I - Ice plant
E - ENLACE Corp.
H - Hospital
B - Bus stops
Some infrastructure available:• Three gas stations• One electric power distribution
substation (38kV/4.16kV, 11MVA)• One hospital• Two pharmacies• One ice plant in the community• Eleven grocery stores (most of them are
small convenient stores)• Five community centers• Bus stops around the perimeter of the
seven communities• Train station nearby (not usable in a
power outage)

Step 3: Alternatives Specification
Two-step specification:
• 10 to 20 alternative “resilience node” locations across CMP, with:
• Microgrid/resilient power service territory
• Services that can be provided to citizens
• Within each resilience node, several alternative technologies:
• Technology type, size, capacity, etc.• Description of how technologies will
improve metrics (hypothesis)
Component/Task Cost ($/W)
PV panels 0.71
Inverter 0.18
Charge controller 0.07
Balance of system 0.45
Sub-total (do-it-yourself) $1.41
Installation (estimate) 0.40 to 1.50
Design, permitting (estimate) 1.00 to 2.20
Total $2.81 to $5.11
Solar cost figures from: E. O’Neill-Carrillo, I. Jordán, A. Irizarry-Rivera, R. A. Cintrón. “The Long Road to Community Microgrids,” IEEE Electrification Magazine, vol. 6, no. 4, December 2018, pp. 6 – 17.
West End
Treme
St. Bernard and Gentilly
St Claude
St Charles and Louisiana
Pauger
Notre Dame
N Claiborne and Elysian Fields
Mid City
Michoud Bayou
Magazine Uptown
Lower Garden
Lakefront Arena
Hayne Blvd
Gentilly Woods
Chef Menteur and Read Blvd
Carrollton Dublin
Canal
Bywater
Bolivar and Jackson
Algiers General Meyer

Step 4: Alternatives Evaluation
Final analysis process:
• Evaluate improvement in metrics
• Determine a small set of near-optimal portfolios
• Use multi-criteria decision analysis to incorporate one or more portfolios into community plan
Resi
lienc
e Pe
rfor
man
ce(e
.g.
Soci
al B
urde
n)
Target Portfolios(good resilience benefit, good blue sky benefit)
“Do nothing” scenario
Efficiency and Sustainability Performance(e.g. life-cycle cost of ownership)
Social Burden by Census Block Group (baseline)

Additional Considerations and Resources
Considerations:• Mature PV Market in Puerto Rico (many local installers, trade organization – ACONER)• Aggressive local, renewable energy goals (100% by 2050)• Comprehensive Development Plan for the Special Planning District (ENLACE)• PREB’s microgrid regulation
Resources:• CMP communities’ support resources • ENLACE’s Feasibility Report & Environmental Impact Statement for Local Ecosystem Restoration Project
(submitted to U.S. Army Corps of Engineers)• SNL (2018), “Analysis of Microgrid Locations Benefitting Community Resilience for Puerto Rico”• Results from UPRM Solar Colloquia (2017), DOE GEARED project GridEd• UPRM Sunshot project report (2013), “Rooftop Solar Challenge to Induce Market Transformation in Puerto
Rico”

Backup Content

Connecting processes and stakeholders
Threat Impact Performance Consequence
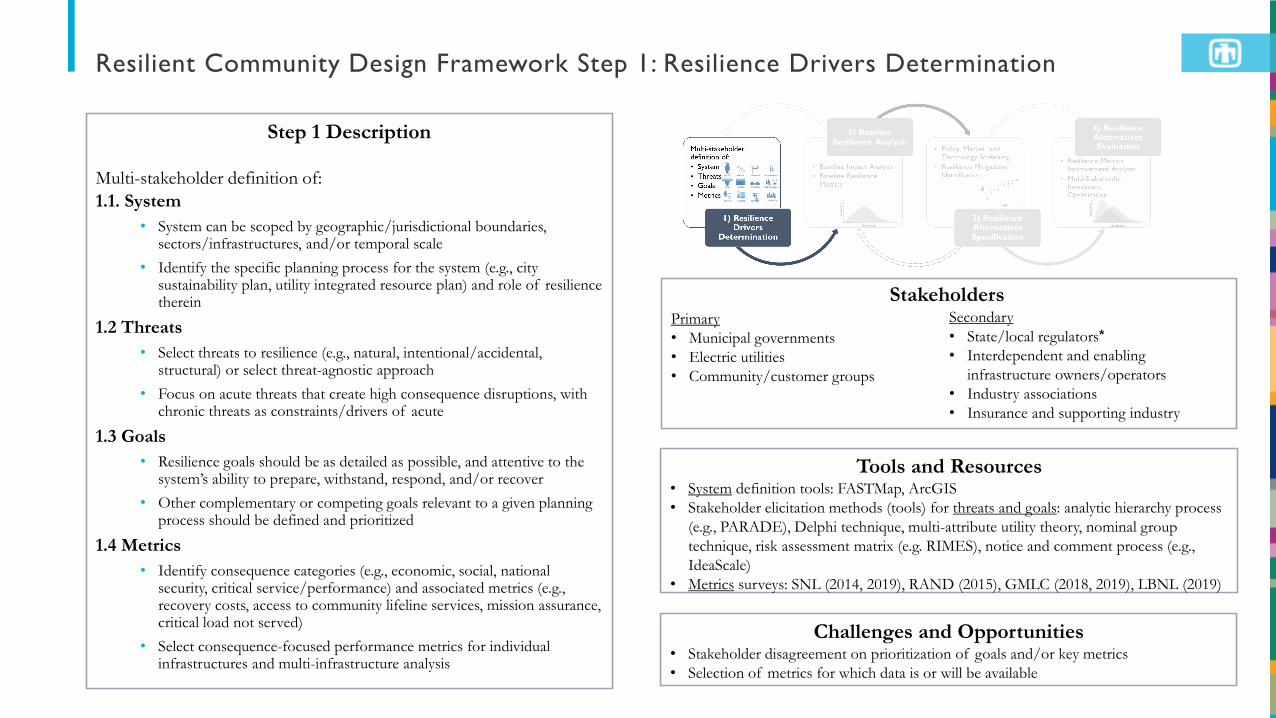
Resilient Community Design Framework Step 1: Resilience Drivers Determination
Step 1 Description
Multi-stakeholder definition of: 1.1. System
• System can be scoped by geographic/jurisdictional boundaries, sectors/infrastructures, and/or temporal scale
• Identify the specific planning process for the system (e.g., city sustainability plan, utility integrated resource plan) and role of resilience therein
1.2 Threats• Select threats to resilience (e.g., natural, intentional/accidental,
structural) or select threat-agnostic approach • Focus on acute threats that create high consequence disruptions, with
chronic threats as constraints/drivers of acute
1.3 Goals• Resilience goals should be as detailed as possible, and attentive to the
system’s ability to prepare, withstand, respond, and/or recover• Other complementary or competing goals relevant to a given planning
process should be defined and prioritized
1.4 Metrics • Identify consequence categories (e.g., economic, social, national
security, critical service/performance) and associated metrics (e.g., recovery costs, access to community lifeline services, mission assurance, critical load not served)
• Select consequence-focused performance metrics for individual infrastructures and multi-infrastructure analysis
Tools and Resources• System definition tools: FASTMap, ArcGIS• Stakeholder elicitation methods (tools) for threats and goals: analytic hierarchy process
(e.g., PARADE), Delphi technique, multi-attribute utility theory, nominal group technique, risk assessment matrix (e.g. RIMES), notice and comment process (e.g., IdeaScale)
• Metrics surveys: SNL (2014, 2019), RAND (2015), GMLC (2018, 2019), LBNL (2019)
Challenges and Opportunities• Stakeholder disagreement on prioritization of goals and/or key metrics• Selection of metrics for which data is or will be available
Primary• Municipal governments• Electric utilities• Community/customer groups
Secondary• State/local regulators*• Interdependent and enabling
infrastructure owners/operators• Industry associations• Insurance and supporting industry
Stakeholders

Resilient Community Design Framework Step 2: Baseline Resilience Analysis
Step 2 Description
2.1 Baseline Impact Analysis• Using historical/observational data and/or simulation, probabilistically
forecast (over the planning horizon):• Threats/disruptions• Component impacts and aggregation to infrastructure system impacts• Multi-infrastructure impacts
2.2 Baseline Resilience Metrics• Calculate consequence-focused performance metrics (without mitigations
under consideration)
Challenges and Opportunities• For some threats, component impact is hard to predict• Performance-based metrics add difficulty to the process – a new paradigm,
which may increase friction• Relatively few models available for cross-infrastructure impact analysis• Human behavior element is not internalized in most tools
Tools and ResourcesThreats/disruptions: • Tools: FEMA Hazus, ArcGIS• Data: FEMA Flood, NREL Wind Exceedance, FEMA/USFS Fire, USGS
Seismic and Landslide, NOAA National Surge HazardComponent, infrastructure, multi-infrastructure impacts:• Tools: GIS Fragility Models, LANL Outage and Restoration tool, WNTR• Data: Eagle-I, utility OMSBaseline resilience metrics:• Methods (tools): economic value of service interruption (e.g., ICE Calculator,
REAcct), production cost models (e.g., Prescient), travel cost methods, energy assurance for critical mission functions (e.g., TMO, WSTAT)
Primary• Municipal governments• Electric utilities• Interdependent and enabling
infrastructure owners/operators
Secondary• State/local regulators• Community/customer groups• Industry associations• Insurance and supporting industry
Stakeholders

Resilient Community Design Framework Step 3: Resilience Alternatives Specification
Step 3 Description
3.1 Technology, Policy, and Market Screening• Begin with screening of alternative technologies to meet goals (e.g.,
resilience, sustainability, reliability) of planning process identified in step 1.1 (e.g., city sustainability plan, utility integrated resource plan)
• Consider system constraints (e.g., regulatory frameworks, utility business models) and potential evolution of constraints
• These may be alternatives in subsequent phases
3.2 Resilience Mitigations Identification• Specify technology investment portfolios (i.e., potential planning,
operational, and policy actions/designs that enhance the system’s ability to prepare, withstand, respond, and/or recover)
Challenges and Opportunities• Tendency to oversimplify w.r.t. regulatory approaches• Imprecise alignment between policy design and technology investment
planning
Tools and ResourcesTechnology Screening• Capacity expansion modeling tools
• Distribution: ReNCAT, LPNORM (OD&O)• Transmission: REEDS
Resilience Mitigations Identification• High level initial design tools: MDT, QSTS, DER-CAM, REOpt, HOMER,
QUEST• Down-select for feasibility tools
• Component: Matlab/Simulink/SimPowerSystems, LabView, Xyce, Grid PV
• Distribution: CYME, OpenDSS, GridLab-D• Transmission: PSS/E, PSLF, PowerWorld, Matlab Power System
Toolbox
Primary• Municipal governments• Electric utilities• Community/customer groups• Interdependent and enabling
infrastructure owners/operators
Secondary• State/local regulators*• Industry associations• Insurance and supporting industry
Stakeholders

Resilient Community Design Framework Step 4: Resilience Alternatives Evaluation
Step 4 Description
4.1 Resilience Metrics Improvement Analysis• Evaluate resilience mitigations by calculating consequence-focused
performance metrics (repeating steps 2.1 and 2.2 with mitigations identified in step 3.2)
4.2 Multi-Stakeholder Investment Optimization • Engage relevant stakeholders to negotiate weights for multiple
resilience metrics• Prioritize investment portfolio through multi-metric optimization
Challenges and Opportunities• Resilience benefit streams not often internalized in current policy• Process of final investment selection can appear opaque to communities• Currently technically difficult to incorporate consequence-based resilience
metrics within investment optimization
Tools and ResourcesMetrics improvement analysis • Methods (tools): economic value of service interruption (e.g., ICE Calculator,
REAcct), production cost models (e.g., Prescient), travel cost methods, energy assurance for critical mission functions (e.g., TMO, WSTAT)
Multi-metric optimization• Tools: PARADE, Prescient, ReNCAT, LPNORM (OD&O)
Primary• Municipal governments• Electric utilities• State/local regulators• Community/customer groups• Interdependent and enabling
infrastructure owners/operators
Secondary• Industry associations• Insurance and supporting industry
Stakeholders

Technology, Policy, and Market Evolution
Phase 1: Technology Investments
Phase 2: Regulatory Frameworks
Phase 3: Utility Business Models
Resilient Community Design Framework
Iterative Application