glucose determination in fish plasma by two different ... · glucose determination in fish plasma...
TRANSCRIPT
Glucose determination in fish plasma by two different moderate methods
Jana Bartoňková, Pavel Hyršl, Libor Vojtek
Masaryk University, Faculty of Science, Institute of Experimental Biology, Brno, Czech Republic
Received May 25, 2016Accepted October 12, 2016
Abstract
Teleost fish include many different species, having a large economic and environmental impact. Glucose is a key source of energy for most vertebrate organisms. Fish as well as mammals maintain a specific level of blood sugar – glycaemia, which is influenced by multiple factors such as hormone production, diet, and temperature. Therefore, it is a useful indicator for scientists who need to check the immediate state of an organism. The most frequently used method of measuring glycaemia in farmed fish is spectrophotometry; however, this method is often inconvenient for field experiments. Here we report that basic spectrophotometry using oxidation of blood beta D-glucose by glucose oxidase (used in laboratory conditions) can be easily substituted with portable glucometer measurements, primarily designed for human samples. The possibility of use outside the laboratory and its small sample volume demands make this method very useful. Field studies often require fast sample processing and conditions of measurement are limited. Using the glucometer is a simple and elegant option. We tested 74 blood plasma samples (29 males, 45 females) of tench (Tinca tinca) both spectrophotometrically and using the human glucometer. Our results show a significant linear correlation (P < 0.001) between both methods. The main contribution of this study consists in comparability and interchangeability of results obtained from both presented methods.
Glucometer, spectrophotometry, tench, Tinca tinca
Teleost fish are very important from the economical, societal and environmental points of view, therefore, their physiological and immunological properties have been studied intensively. One of the key physiological indicators measured in most scientific experiments is the blood glucose concentration expressing the general health condition of fish. Glucose is a monosaccharide of the aldohexose group. It is a necessary source of energy and carbon for most vertebrates including fish. Glucose is obtained from food but since fish are unable to use dietary carbohydrates as efficiently as e.g. mammals, they utilize glucose produced by the processes of gluconeogenesis and glycogenolysis (Polakof et al. 2012; Kamalam et al. 2016). Fish as well as mammals possess mechanisms to maintain a certain level of blood sugar, which are based on mechanisms of backloops and hormones (e.g. cortisol and insulin) (Martínez-Porchas et al. 2006; Soengas 2014). Glycaemia values vary between species (1–10 mmol/l) which is probably due to different utilizations of glucose which are mainly: (1) the concentration gradient from the extracellular to the intracellular space (set mostly by extracellular levels), (2) permeation through the cell membrane (enhanced by glucose transporters), and (3) hexokinase activity (Driedzic et al. 2013). The standard method for determination of blood glucose concentration is spectrophotometry using glucose oxidase to catalyse the oxidation of beta D-glucose present in blood. Such reaction produces hydrogen peroxide which in presence of peroxidase oxidises 4-aminoantipyrine to coloured quinoneimine (Weibel and Bright 1971). Colour change is then measured spectrophotometrically using microplate spectrophotometer in laboratory. Such setup is convenient for experiments done on farmed fish where the number of samples is usually
ACTA VET. BRNO 2016, 85: 349-353; doi:10.2754/avb201685040349
Address for correspondence:Mgr. Libor Vojtek, Ph.D.Univerzitní kampus BohuniceÚstav experimentální biologie – FIŽBudova A36625 00 Brno – Bohunice
Phone: +420 549 498 589E-mail: [email protected]://actavet.vfu.cz/

350
nearly unlimited (due to the larger size of fish) and there is enough time for evaluation of results. On the other hand, wild fish experiments are often held under conditions where quick evaluation of samples is needed and the number of samples is very limited (fish are small). Therefore, portable glucometer with testing stripes using pyrroloquinoline quinone – glucose dehydrogenase system was used in this comparative study. Pyrroloquinoline quinone is in presence of beta D-glucose reduced by glucose dehydrogenase and turns its colour to red which is recognised by the glucometer (Newman and Turner 2005).
Materials and Methods
Two moderate methods were used for plasma glucose concentration determination in tench. Both methods were tested on 74 samples of 5–6 years old tench, 45 females and 29 males. Fish samples were collected from the breeding pond in Vodňany (Czech Republic); the average fish length was 271.2 ± 29.9 mm, and the average fish weight was 477.9 ± 190.7 g. Blood samples were obtained by caudal vein punction with heparinized syringes according to Pravda and Svobodová (2003) and transferred to tubes containing heparin (50 IU/ml of blood, Zentiva, Czech Republic). Blood plasma was collected after centrifugation (800 g, 10 min, 4 °C) and stored at -80 °C. Consequently, the glucose concentration was measured using the same tube at the same time using both methods.
Glucose determination using a kitTench plasma glucose concentration was analysed using a commercial enzyme kit (Glu L 1000, PLIVA-Lachema,
Czech Republic). Samples were added to a solution of glucose oxidase, peroxidase and 4-aminoantipyrine; then after 10 min incubation samples were moved to 96-well microtiter plate (200 µl) and their absorbance (500 nm) was measured by the plate reader (Tecan Sunrise, USA). The glucose concentration was consequently determined using the absorbance of glucose standard (10 mmol/l). The quantification limit of this method was 0.021 mmol/l; the working range was 0.065–45 mmol/l, repeatability was 1.05%, and the working volume was 10 µl.
GlucometerSimilar fish samples were analysed using the glucometer Accu-Chek Glucotrend 2 (Roche Diagnostics,
Germany) with the original Accu-Check Active test stripes (Roche Diagnostics, Germany). The stripes were first inserted in the glucometer, then 2 µl of plasma were used for each test stripe/sample, and the measured values were recorded. Measurement of each sample was done in monoplicate due to the small sample volume. The quantification limit of this method was 0.6 mmol/l, the working range was 0.6–33.3 mmol/l, repeatability was 2.1%, and the working volume was 1–2 µl.
Statistical analysisStatistical evaluation was performed by Statistica 12 software (StatSoft Inc., USA). Pearson correlation
coefficient was used to assess the relation between the two different methods.
Results
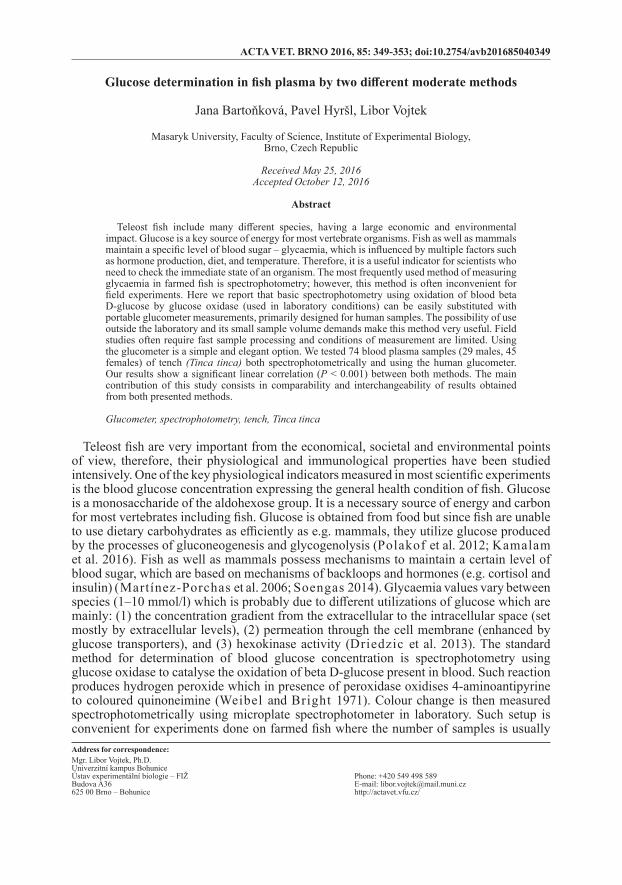
Our results show little difference in plasma glucose concentration between males and females using both methods of measurement. Results obtained using the glucometer are slightly elevated compared to the results determined by the kit (Table 1) but the regression graph depicting the dependence of one method on the other shows a linear distribution of all data, suggesting no significant differences between the achieved results (Fig. 1, r = 0.995; P < 0.001). Both methods provide comparable results, therefore, their use under different conditions (laboratory or field studies) is possible.
Table 1. Table shows average values of blood plasma glucose concentrations in mmol/l ± SD measured by two different methods.
Method Kit BioLA GlucometerSex Male (n = 29) Female (n = 45) Male (n = 29) Female (n = 45)
Glucose (mmol/l) 6.3 ± 2.3 5.6 ± 1.8 7.1 ± 3.1 6.1 ± 2.3
Discussion
Glycaemia is influenced by multiple factors. The specific content of blood sugar differs among species. It is necessary to consider the season, water temperature (fish are poikilothermic), food availability or whether the fish are carnivorous or omnivorous (Suárez et al. 2002). Atanasova et al. (2006) used a spectrophotometrical method to compare blood glucose concentrations in tench before and after the wintering period. They found significant differences while measuring two year old tench in spring and fall. The values in fall were around 73 mg/100 ml and in spring around 24 mg/100 ml. Higher values in the fall period were attributed to a higher food intake as a preparation for the winter season. Reproduction is another important factor influencing biochemical and haematological indices. Svoboda et al. (2001) measured blood glucose concentration in tench two months before spawning (induced by hormones) and immediately after. They found no sex-dependent differences in blood glucose concentration in the pre- and post-spawning periods. However, differences were found between females spawned and not spawned in the reproduction period. The mean concentration of blood glucose in the pre-spawning period was around 6 mmol/l and around 9.5 mmol/l.
Unlike mammals, fish cannot utilize dietary glucose very efficiently (Polakof et al. 2012; Kamalam et al. 2016). Poor ability to utilize dietary glucose might be caused by low hexokinase activity and a lack of the inducible enzyme glucokinase, the possible inhibition of insulin release by somatostatins released due to high blood-glucose concentrations or the relatively low number of insulin receptors in fish compared to mammals (Kamalam et al. 2016). Besides, it would be very disadvantageous to rely mostly on diet since fish have to deal with seasonal food availability (De Pedro et al. 2003). Fish have adapted several strategies to survive food deprivation, including metabolic, hormonal, and behavioural responses. To maintain metabolic functions during food starvation, fish use liver glycogen as a source of energy or they metabolize protein and/or lipids. In the study of De Pedro et al. (2003), fish were starved for 7 days and then refed for 2 days. During starvation, decreased glycogen and blood glucose concentrations were noted. After refeeding, these values were partially reversed.
351
Fig. 1. Regression curve expressing comparison of two methods used for evaluation of plasma glucose concentration.

Studies have also revealed that there is a difference in utilizing dietary glucose between carnivorous fish living in cold waters and omnivorous fish living in warm waters (Suárez et al. 2002). Omnivorous fish are able to metabolize glucose faster than carnivorous fish (Eames et al. 2010). Thus, when using dried food in aquaculture, the content of carbohydrates should be considered as one of the main factors for choosing a suitable diet. A study on the European eel (warm-water carnivorous fish) and rainbow trout (cold-water carnivorous fish) showed different utilizations of carbohydrates from the diet (Suárez et al. 2002). Blood glucose concentrations remained stable in the eel, regardless of the carbohydrate content in the diet; however, in trout a direct relationship was determined between plasma glucose concentration and dietary carbohydrates.
Together with cortisol, blood glucose content in blood serum or plasma can be used as a stress indicator (Yin et al. 1995). Under stressful conditions, an organism uses energy reserves, mostly glycogen in the muscles and liver which in turn increases glucose concentration in plasma (Barton et al. 1987). Higher concentration of plasma glucose due to stress conditions appears minutes or hours after acute stress (Mart ínez-Porchas et al. 2009). Stress exposure affects many different physiological and immunological indices in fish, thus the stress level needs to be recorded and considered in every experiment. Jentof t et al. (2005) measured the glucose and cortisol concentrations in Eurasian perch (Perca fluviatilis) and domesticated rainbow trout exposed to the standard handling stressor. They registered changes in cortisol and glucose contents one hour after stress exposure. Increased concentrations of both factors lasted for several hours after exposure. However, it is necessary to consider that stress has a multifactorial impact on an organism and changes in blood glucose concentrations can be influenced by many different ways. As mentioned above, utilization of glucose in fish varies between species so using it as an indicator of stress should be only supplementary (Mart ínez-Porchas et al. 2009).
Determination of glucose concentration in fish plasma is routinely done using spectrophotometric methods/kits which are fast, cheap, and easy to use but inappropriate for outdoor use. Two different glucometers primarily designed for human samples were used to measure the blood glucose concentration in Zebra fish (Danio rerio) (Eames at al. 2010). It was found that both the glucometer using the glucose oxidase method and the glucometer which uses pyrroloquinoline quinone glucose dehydrogenase, were consistent with the results of a glucose oxidase assay performed in a laboratory. In our study we used the glucometer based on pyrroloquinoline quinone glucose dehydrogenase. We can confirm that human glucometer can be reliably used on fish samples as reported in the study of Eames et al. (2010). Since it was tested on different fish species, we can conclude that this method can easily substitute laboratory methods in field conditions. So far, no study (except for one comparing primarily two different glucometers by Eames at al. 2010) has been published dealing with the comparison of different glycaemia measurement approaches; one proposed for laboratory measurements and the other set for field studies. The main contribution of this study consists in the comparability and interchangeability of results obtained from both presented methods.
References
Atanasova R, Hadjinikolova L, Hubenova T 2006: Some biochemical parameters of tench (Tinca tinca L.). Arch Pol Fish 14: 123-130
Barton BA, Schreck CB, Barton LD 1987: Effects of chronic cortisol administration and daily acute stress on growth, physiological conditions, and stress responses in juvenile rainbow trout. Dis Aquat Org 2: 173-185
352
De Pedro N, Delgado MJ, Gancedo B, Alonso-Bedate M 2003: Changes in glucose, glycogen, thyroid activity and hypothalamic catecholamines in tench by starvation and refeeding. J Comp Physiol B 173: 475-481
Driedzic WR, Clow KA, Short CE 2013: Glucose uptake and metabolism by red blood cells from fish with different extracellular glucose levels. J Exp Biol 216: 437-446
Eames SC, Philipson LH, Prince VE, Kinkel MD 2010: Blood sugar measurement in zebrafish reveals dynamics of glucose homeostasis. Zebrafish 7: 205-213
Jentoft S, Aastveit AH, Torjesen PA, Andersen O 2005: Effects of stress on growth, cortisol and glucose levels in non-domesticated Eurasian perch (Perca fluviatilis) and domesticated rainbow trout (Oncorhynchus mykiss). Comp Biochem Physiol A Mol Integr Physiol 3: 353-358
Kamalam BS, Medale F, Panserat S 2016: Utilisation of dietary carbohydrates in farmed fishes: New insights on influencing factors, biological limitations and future strategies. Aquaculture (in press, available online; doi:10.1016/j.aquaculture.2016.02.007)
Martínez-Porchas M, Martínez-Cordova LR, Ramos-Enriques R 2009: Cortisol and glucose: Reliable indicators of fish stress? PANAMJAS 4: 158-178
Newman JD, Turner AP 2005: Home blood glucose biosensors: a commercial perspective. Biosens Bioelectron 20: 2435-2453
Polakof S, Panserat S, Soengas JL, Moon TW 2012: Glucose metabolism in fish: a review. J Comp Physiol B 182: 1015-1045
Pravda D, Svobodová Z 2003: Hematologie ryb (Fish haematology, in Czech). In: Doubek J (Ed.): Veterinární hematologie NOVIKO a.s., Brno, pp. 381-405
Soengas JL 2014: Contribution of glucose- and fatty acid sensing systems to the regulation of food intake in fish. A review. Gen Comp Endocrinol 205: 36-48
Suárez MD, A. Sanz A, Bazoco J, Garcia-Gallego M 2002: Metabolic effects of changes in the dietary protein: carbohydrate ratio in eel (Anguilla anguilla) and trout (Oncorhynchus mykiss). Aquac Int 10: 143-156
Svoboda M, Kouřil J, Hamáčková J, Kaláb P, Savina L, Svobodová Z, Vykusová B 2001: Biochemical profile of blood plasma of tench (Tinca tinca L.) during pre- and postspawning period. Acta Vet Brno 70: 259-268
Weibel MK, Bright HJ 1971: The glucose oxidase mechanism. Interpretation of the pH dependence. J Biol Chem 246: 2734-2744
Yin Z, Lam TJ, Sin YM 1995: The effects of crowding stress on the non-specific immune response in fancy carp (Cyprinus carpio L.). Fish Shellfish Immunol 7: 519-529
353