globalriskofdeadlyheat - university of hawaii 059.pdf · globalriskofdeadlyheat camilomora 1...
TRANSCRIPT
LETTERSPUBLISHED ONLINE: XXMONTH XXXX | DOI: 10.1038/NCLIMATE3322
Global risk of deadly heatCamilo Mora1*, Bénédicte Dousset2, Iain R. Caldwell3, Farrah E. Powell1, Rollan C. Geronimo1,Coral R. Bielecki4, Chelsie W.W. Counsell3, Bonnie S. Dietrich5, Emily T. Johnston4, Leo V. Louis4,Matthew P. Lucas6, Marie M. McKenzie1, Alessandra G. Shea1, Han Tseng1, ThomasW. Giambelluca1,Lisa R. Leon7, Ed Hawkins8 and Clay Trauernicht6
Climate change can increase the risk of conditions that exceedhumanthermoregulatory capacity1–6.Althoughnumerousstud-ies report increased mortality associated with extreme heatevents1–7, quantifying the global risk of heat-related mortalityremains challenging due to a lack of comparable data onheat-related deaths2–5. Here we conducted a global analysisof documented lethal heat events to identify the climaticconditions associated with human death and then quantifiedthe current and projected occurrence of such deadly climaticconditions worldwide.We reviewed papers published between1980 and 2014, and found 783 cases of excess humanmortality associated with heat from 164 cities in 36 countries.Based on the climatic conditions of those lethal heat events,we identified a global threshold beyond which daily meansurface air temperature and relative humidity become deadly.Around 30% of the world’s population is currently exposedto climatic conditions exceeding this deadly threshold for atleast 20 days a year. By 2100, this percentage is projectedto increase to ∼48% under a scenario with drastic reductionsof greenhouse gas emissions and ∼74% under a scenario ofgrowing emissions. An increasing threat to human life fromexcess heat now seems almost inevitable, but will be greatlyaggravated if greenhouse gases are not considerably reduced.
Sporadic heat events, lasting days to weeks, are often related toincreased human mortality1,2, raising serious concerns for humanhealth given ongoing climate change1–3,8–16. Unfortunately, a numberof challenges have hampered global assessments of the risk ofheat-related death. First, heat illness (that is, severe exceedanceof the optimum body core temperature) is often underdiagnosedbecause exposure to extreme heat often results in the dysfunctionof multiple organs, which can lead to misdiagnosis2,3,5,17. Second,mortality data from heat exposure are sparse and have not beenanalysed in a consistent manner. Here we conducted a globalsurvey of peer-reviewed studies on heat-relatedmortality to identifythe location and timing of past events that caused heat-relateddeaths. We used climatic data during those events to identify theconditions most likely to result in human death and then quantifiedthe current and projected occurrence of such deadly climaticconditions. Hereafter, we use ‘lethal’ when referring to climaticconditions during documented cases of excessmortality and ‘deadly’when referring to climatic conditions that are projected to causedeath. We make this distinction to acknowledge that climatic
conditionswhich have killed people in the past are obviously capableof causing death, but whether or not they result in human mortalityin the future could be affected by adaptation. We do not quantifyhuman deaths per se because the extent of human mortality willbe considerably modified by social adaptation (for example, use ofair conditioning, early warning systems, and so on18–20). Althoughsocial adaptation could reduce the exposure to deadly heat18–20, itwill not affect the occurrence of such conditions. Given the speedof climatic changes and numerous physiological constraints, it isunlikely that human physiology will evolve the necessary higherheat tolerance21,22, highlighting that outdoor conditions will remaindeadly even if social adaptation is broadly implemented. Our aim isto quantify where and when deadly heat conditions occur, which inturn can provide important information on where social adaptationwill likely be needed.
We searched available online databases for peer-reviewedpublications on heat-related mortality published between 1980 and2014 (see Methods). From over 30,000 relevant references, weidentified 911 papers that included data on 1,949 case studiesof cities or regions where excess mortality was associated withhigh temperatures. Case studies were broadly grouped into thosefocusing on temperature–mortality relationships in a specific city,region, or country (1,166 cases from 273 cities across 49 countries)and those focusing on heat-related mortality during specificepisodes (783 cases from 164 cities across 36 countries). Caseswere predominantly reported for cities at mid-latitudes, with thehighest concentration in North America and Europe (Fig. 1a), andincluded well-documented heatwaves like those in Chicago in 1995(∼740 deaths23), Paris in 2003 (∼4,870 deaths24), Moscow in 2010(∼10,860 deaths25) and many other, less publicized events (listof cases provided at https://maps.esri.com/globalriskofdeadlyheat).While data on the number of deaths was inconsistently reported, allstudies provided information on the place and dates when climaticconditions were lethal, which we used to identify the specificclimatic conditions resulting in heat-related mortality.
To identify the climatic conditions related to lethal heat events,we assessed daily climatic data (that is, surface air temperature,relative humidity, solar radiation, wind speed, and several othermetrics, Supplementary Fig. 1) for the duration of lethal heatepisodes reported in the literature and an equal number of non-lethal episodes (that is, periods of equal duration from the samecities but from randomly selected dates); then we used Support
1Department of Geography, University of Hawai’i at Manoa, Honolulu, Hawai’i 96822, USA. 2Hawai‘i Institute of Geophysics and Planetology, University ofHawai‘i at Manoa, Honolulu, Hawai’i 96822, USA. 3Hawai‘i Institute of Marine Biology, University of Hawai‘i at Manoa, Kane‘ohe, Hawai’i 96744, USA.4Department of Botany, University of Hawai‘i at Manoa, Honolulu, Hawai’i 96822, USA. 5Department of Plant and Environmental Protection Sciences,University of Hawai‘i at Manoa, Honolulu, Hawai’i 96822, USA. 6Department of Natural Resources and Environmental Management, University of Hawai‘iat Manoa, Honolulu, Hawai’i 96822, USA. 7Thermal and Mountain Medicine Division, U.S. Army Research Institute of Environmental Medicine, Natick,Massachusetts 01760, USA. 8National Centre for Atmospheric Science, Department of Meteorology, University of Reading, Reading, Berkshire RG6 6BB,UK. *e-mail: [email protected]
NATURE CLIMATE CHANGE | ADVANCE ONLINE PUBLICATION | www.nature.com/natureclimatechange 1

LETTERS NATURE CLIMATE CHANGE DOI: 10.1038/NCLIMATE3322
Deadly
0 10 20 30 40 50
0
20
40
60
80
100
Average daily temperature (°C)
Ave
rage
dai
ly re
lativ
e hu
mid
ity (%
)
a b
Figure 1 | Geographical distribution of recent lethal heat events and their climatic conditions. a, Places where relationships between heat and mortalityhave been documented (red squares) and where specific heat episodes have been studied (black squares). b, Mean daily surface air temperature andrelative humidity during lethal heat events (black crosses) and during periods of equal duration from the same cities but from randomly selected dates(that is, non-lethal heat events; red to yellow gradient indicates the density of such non-lethal events). Blue line is the SVM threshold that best separateslethal and non-lethal heat events and the red line is the 95% probability SVM threshold; areas to the right of the thresholds are classified as deadly andthose to the left as non-deadly. Support vectors for other variables are shown in Supplementary Fig. 2.
1950 2000 2050 2100
0
10
20
30
40
50
60
Glo
bal l
and
area
(%)
1950 2000 2050 2100
0
20
40
60
80
100
Glo
bal h
uman
pop
ulat
ion
(%)
HistoricalRCP 8.5RCP 4.5RCP 2.6
a
YearYear
Reanalysis datab
Figure 2 | Current and projected changes in deadly climatic conditions. Area of the planet (a) and percentage of human population (b) exposed to climaticconditions beyond the 95% SVM deadly threshold (red line in Fig. 1b) for at least 20 days in a year under alternative emission scenarios. Bolded lines arethe multimodel medians, black lines are the results from reanalysis data and faded lines indicate the projections for each Earth System Model. Time serieswere smoothed with a 10-year-average moving window. Area of the planet and human population exposed to di�erent lengths of time are shown inSupplementary Fig. 4. Results correcting for climatological mean biases between the reanalysis data and each Earth System Model are shown inSupplementary Figs 8 and 10.
Vector Machines (SVMs) to identify the climatic conditions thatbest differentiated lethal and non-lethal episodes. SVMs generatea threshold that maximizes the difference in the attributes of twoor more groups, allowing for classification of objects in eithergroup based on where their given attributes fall with respect tothe threshold. In our case, SVM was used to generate a decisionthreshold that maximizes the difference in climatic conditions oflethal and non-lethal episodes, with the conditions on one side of thethreshold being lethal and those to the other side being non-lethal(for example, Fig. 1b). Among all possible pair combinations of thevariables analysed here (Supplementary Figs 1 and 2), the SVMusingmean daily surface air temperature and relative humiditymostaccurately distinguished between past lethal and non-lethal heatepisodes (that is, 82%, blue line in Fig. 1b); accuracy was measuredas the ratio of the number of correctly classified lethal and non-lethal cases to the total number of cases. Adding other variablesto the temperature–humidity SVM resulted in less parsimoniousSVMs with minimal increases in accuracy (for example, the SVM
model including all 16 variables analysed here was only 3% moreaccurate, Supplementary Fig. 3). SVM also allows for estimationof a classification probability that increases with the distance of anobservation to the decision threshold; the use of a 95% probabilityfor the temperature–humidity SVM (red line in Fig. 1b) resultedin 100% accurate predictions of true positives (that is, only priorlethal heat episodes were on the deadly side of the 95% probabilitySVM decision boundary). While our analysis used data on localclimatic conditions, the resulting pattern between temperatureand relative humidity allowed us to accurately classify lethal heatevents of different cities worldwide using a single common SVMthreshold (Fig. 1b).
The fact that temperature and relative humidity best predicttimes when climatic conditions become deadly is consistent withhuman thermal physiology, as they are both directly related tobody heat exchange2–4. First, the combination of an optimum bodycore temperature (that is, ∼37 ◦C), the fact that our metabolismgenerates heat (∼100W at rest) and that an object cannot dissipate
2 NATURE CLIMATE CHANGE | ADVANCE ONLINE PUBLICATION | www.nature.com/natureclimatechange

NATURE CLIMATE CHANGE DOI: 10.1038/NCLIMATE3322 LETTERS
0 50 100 150 200 250 300 350Number of days per year above deadly threshold
Historicala
RCP 2.6
RCP 4.5
RCP 8.5
b
c
d
Figure 3 | Geographical distribution of deadly climatic conditions underdi�erent emission scenarios. Number of days per year exceeding thethreshold of temperature and humidity beyond which climatic conditionsbecome deadly (Fig. 1b), averaged between 1995 and 2005 (a, historicalexperiment) and between 2090 and 2100 under RCP 2.6 (b), RCP 4.5 (c),and RCP 8.5 (d). Results are based on multimodel medians. Grey areasindicate locations with high uncertainty (that is, the multimodel standarddeviation was larger than the projected mean; coe�cient of variance >1).The expected lower number of deadly days at higher latitudes (Fig. 4) mayhelp explain the large variability among Earth System Models in theprojected number of deadly days at higher latitudes31 (for example, in thecase for New York (illustrated in Fig. 4j) the one model projects nine deadlydays by 2100; yet any other model projecting 18 days will double thevariability). The uncertainty presented in this figure should be interpretedwith that caution in mind.
heat to an environment with equal or higher temperature (that is,the second law of thermodynamics22), dictates that any ambienttemperature above 37 ◦C should result in body heat accumulationand a dangerous exceedance of the optimum body core temperature(hyperthermia5). Second, sweating, the main process by which thebody dissipates heat, becomes ineffective at high relative humidity(that is, air saturated with water vapour prevents evaporation ofsweat); therefore, body heat accumulation can occur at temperatureslower than the optimum body core temperature in environmentsof high relative humidity. These properties help to explain whythe boundary at which temperature becomes deadly decreaseswith increasing relative humidity (Fig. 1b) and why in our resultssome heat mortality events occurred at relatively low temperatures(Fig. 1b). These consequences of temperature and humidity are whyboth of these variables are included in traditional thermal indicessuch as humidex26 and wet-bulb globe temperature22,27.
To quantify the global extent of current deadly climaticconditions, we applied the 95% probability SVM decision boundarybetween mean daily surface air temperature and relative humidity(red line in Fig. 1b, hereafter referred to as deadly threshold)to current global climate data (see Methods). Using data froma climate reanalysis (see Methods), we found that in 2000,∼13.2% of the planet’s land area, where ∼30.6% of the world’shuman population resides, was exposed to 20 or more dayswhen temperature and humidity surpassed the threshold beyondwhich such conditions become deadly (Fig. 2, extended results inSupplementary Fig. 4). Comparatively, using climate simulationsfor the year 2000 (that is, historical experiment) developed forthe Coupled Model Intercomparison Project phase 5 (CMIP5), wefound that ∼16.2% (±8.3% standard deviation, s.d.) of the planet’sland area, where ∼37.0% (±9.7% s.d.) of the world’s populationresides, was exposed to 20 or more days of potentially deadlyconditions of temperature and humidity (results are multimodelmedians and standard deviations among Earth System Models;Fig. 2). Both the reanalysis and historical CMIP5 data revealedincreasing trends in the area and population exposed to deadlyclimates during the time period for which such datasets can becompared, although the trends in the reanalysis data are slightlyweaker than in the Earth System Models (Fig. 2). Overall, therewas ∼3% mismatch in the area of the planet exposed to deadlyclimates (∼6.4% in global population) between the reanalysisand the multimodel median, and thus, results based on CMIP5simulations should be interpreted with that error inmind. However,the effects of this mismatch and the uncertainty among EarthSystem Models were smaller than the predicted changes in deadlydays (Supplementary Fig. 10). It is worth noting that most scientificpublications on deadly heat events have focused in developed mid-latitude countries (Fig. 1a); yet, deadly heat conditions also occur indeveloping tropical countries (Fig. 3). This suggests that the risk ofdeadly heat could be currently underestimated in tropical regions,which has been noted in prior studies28.
To predict the global extent of future deadly climates, we appliedthe deadly SVM threshold tomean daily surface air temperature andrelative humidity projections from the CMIP5 Earth SystemModelsunder low, moderate, and high emissions scenarios (RepresentativeConcentration Pathways, RCPs, 2.6, 4.5, and 8.5, respectively). Wefound that by 2100, even under the most aggressive mitigationscenario (that is, RCP 2.6), ∼26.9% (±8.7% s.d.) of the world’sland area will be exposed to temperature and humidity conditionsexceeding the deadly threshold by more than 20 days per year,exposing ∼47.6% (±9.6% s.d.) of the world’s human population todeadly climates (using Shared Socioeconomic Pathways projectionsof future human population29 relevant to each of the CMIP5 RCPs,see Methods). Scenarios with higher emissions will affect an evengreater percentage of the global land area and human population.By 2100, ∼34.1% (±7.6% s.d.) and ∼47.1% (±8.9% s.d.) of the
NATURE CLIMATE CHANGE | ADVANCE ONLINE PUBLICATION | www.nature.com/natureclimatechange 3

LETTERS NATURE CLIMATE CHANGE DOI: 10.1038/NCLIMATE3322
Deadly
2 d 9 d 27 d 50 d
Deadly
Distance fromthe deadly threshold
Distance fromthe deadly threshold
Distance fromthe deadly threshold
Distance fromthe deadly threshold
0 10 20 30 40 50
0
20
40
60
80
100
0 10 20 30 40 50
0
20
40
60
80
100
0 10 20 30 40 50
0
20
40
60
80
100
0 10 20 30 40 50
0
20
40
60
80
100
Ave
rage
dai
lyre
lativ
e hu
mid
ity (%
)
0 10 20 30 40 50
0
20
40
60
80
100
0 10 20 30 40 50
0
20
40
60
80
100
0 10 20 30 40 50
0
20
40
60
80
100
0 10 20 30 40 50
0
20
40
60
80
100
Ave
rage
dai
lyre
lativ
e hu
mid
ity (%
)
Jakarta
−40 −30 −20 −10 0 10 −40 −30 −20 −10 0 10 −40 −30 −20 −10 0 10 −40 −30 −20 −10 0 10
−40
−20
0
20
40
60
5 25 25 550
a Historical RCP 2.6 RCP 4.5 RCP 8.5
Days in a year (%)
Latit
ude
−40
−20
0
20
40
60
−40
−20
0
20
40
60
−40
−20
0
20
40
60
New York
+1.6 °C +2.7 °C +5.5 °C
11 d 117 d 274 d 365 d+0.9 °C +1.7 °C +3.8 °C
Deadly
Average daily temperature (°C) Average daily temperature (°C) Average daily temperature (°C) Average daily temperature (°C)
Average daily temperature (°C) Average daily temperature (°C) Average daily temperature (°C) Average daily temperature (°C)
b c d
e f g h
i j k l
Figure 4 | Latitudinal risk of deadly climates. a–d, Distribution of the percentage of days in a given year (that is, colour gradients), at each latitude, as afunction of their distance to the deadly threshold (red line in Fig. 1b). Displayed here are the last year in the historical experiment (that is, 2005; a) and theyear 2100 under RCP 2.6 (b), RCP 4.5 (c) and RCP 8.5 (d). These plots illustrate that higher latitudes have fewer days near the deadly threshold comparedto the tropics. e–l, As examples, we show mean temperature and relative humidity for each day in the year 2005 in the historical experiments and the year2100 for all the RCPs in Jakarta (e–h) and New York (i–l), with consecutive days connected by lines. The 95% SVM threshold is shown as a red line withnumbers on the upper right hand corner indicating the number of days that cross the threshold and the di�erence in temperature between 2100 and 2005.Examples are based on a single simulation of a randomly chosen model (that is, CSIRO-Mk3-6-0).
global land area will be exposed to temperature and humidityconditions that exceed the deadly threshold for more than 20 daysper year under RCP 4.5 and RCP 8.5, respectively; this will expose∼53.7% (±8.7% s.d.) and∼73.9% (±6.6% s.d.) of theworld’s humanpopulation to deadly climates by the end of the century (Fig. 2,extended results in Supplementary Fig. 4).
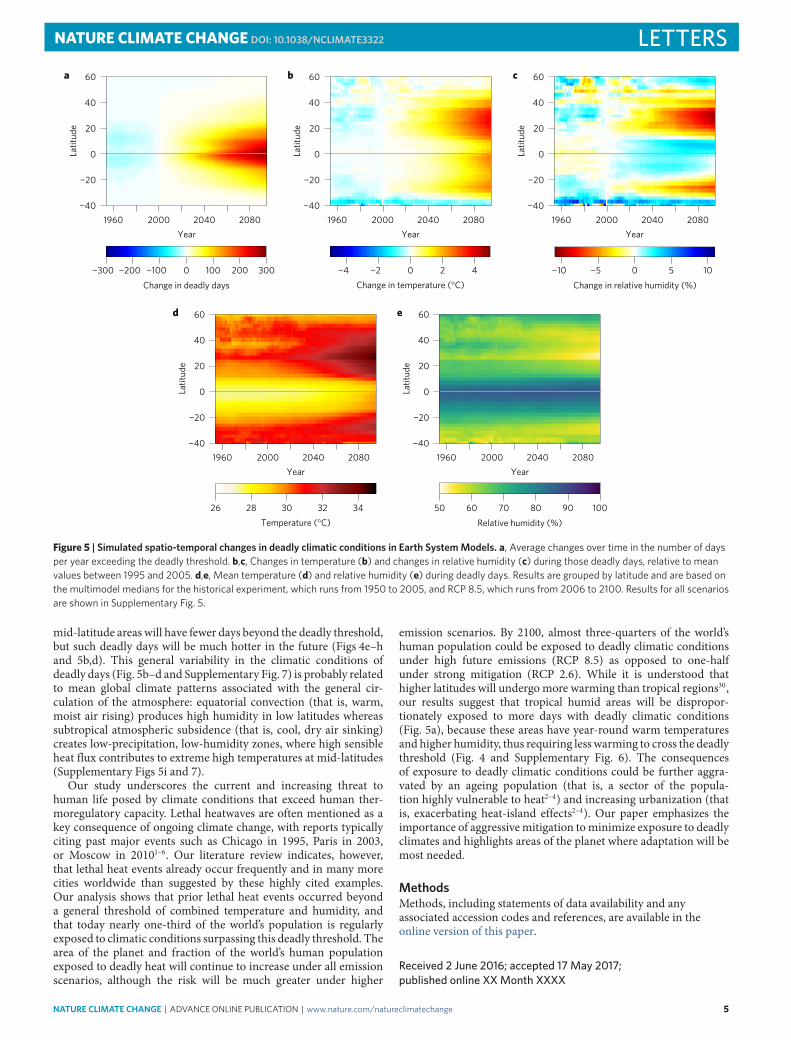
The projected number of days per year surpassing the deadlythreshold increases from mid-latitudes to the equator (Fig. 5a andSupplementary Fig. 5a,d,g). By 2100, mid-latitudes (for example,40◦ N or S) will be exposed to ∼60 deadly days per year comparedto almost the entire year in humid tropical areas under RCP 8.5(Figs 3b–d, 4b–d and 5a). This latitudinal pattern was consistentamong all scenarios (Supplementary Fig. 5a,d,g) and is largelydetermined by the fact that the number of days with temperatures
close to the deadly threshold declines with increasing latitude (thatis, due to greater seasonality; Supplementary Fig. 6b–d28). At mid-latitudes (for example, New York, Fig. 4i–l) temperatures approachthe deadly threshold only during the summer, which representsa smaller proportion of the year; compared to tropical locations(for example, Jakarta, Fig. 4e–h), which have consistently warmtemperatures near the deadly threshold year-round (SupplementaryFig. 6). Although tropical humid areas will experience less warmingthan higher latitudes (Fig. 5b, see also ref. 30), they will be exposedto the greatest increase in the number of deadly days over time,because higher relative humidity in tropical areas requires lowertemperatures to cross the deadly threshold (Figs 4e–h and 5e); acondition that could be further aggravated by projected increasesin relative humidity of tropical areas (Fig. 5a). Subtropical and
4 NATURE CLIMATE CHANGE | ADVANCE ONLINE PUBLICATION | www.nature.com/natureclimatechange
NATURE CLIMATE CHANGE DOI: 10.1038/NCLIMATE3322 LETTERSLa
titud
ea
1960 2000 2040 2080−40
−20
0
20
40
60
Change in deadly days
−300 −200 −100 0 100 200 300Change in temperature (°C)
−4 4−2 20
Change in relative humidity (%)
−10 10−5 50
Temperature (°C)26 28 30 32 34
Relative humidity (%)
50 60 70 80 90 100
Year
Latit
ude
1960 2000 2040 2080−40
−20
0
20
40
60
Year
Latit
ude
1960 2000 2040 2080−40
−20
0
20
40
60
Year
Latit
ude
1960 2000 2040 2080−40
−20
0
20
40
60
Year
Latit
ude
1960 2000 2040 2080−40
−20
0
20
40
60
Year
d e
b c
Figure 5 | Simulated spatio-temporal changes in deadly climatic conditions in Earth SystemModels. a, Average changes over time in the number of daysper year exceeding the deadly threshold. b,c, Changes in temperature (b) and changes in relative humidity (c) during those deadly days, relative to meanvalues between 1995 and 2005. d,e, Mean temperature (d) and relative humidity (e) during deadly days. Results are grouped by latitude and are based onthe multimodel medians for the historical experiment, which runs from 1950 to 2005, and RCP 8.5, which runs from 2006 to 2100. Results for all scenariosare shown in Supplementary Fig. 5.
mid-latitude areas will have fewer days beyond the deadly threshold,but such deadly days will be much hotter in the future (Figs 4e–hand 5b,d). This general variability in the climatic conditions ofdeadly days (Fig. 5b–d and Supplementary Fig. 7) is probably relatedto mean global climate patterns associated with the general cir-culation of the atmosphere: equatorial convection (that is, warm,moist air rising) produces high humidity in low latitudes whereassubtropical atmospheric subsidence (that is, cool, dry air sinking)creates low-precipitation, low-humidity zones, where high sensibleheat flux contributes to extreme high temperatures at mid-latitudes(Supplementary Figs 5i and 7).
Our study underscores the current and increasing threat tohuman life posed by climate conditions that exceed human ther-moregulatory capacity. Lethal heatwaves are often mentioned as akey consequence of ongoing climate change, with reports typicallyciting past major events such as Chicago in 1995, Paris in 2003,or Moscow in 20101–6. Our literature review indicates, however,that lethal heat events already occur frequently and in many morecities worldwide than suggested by these highly cited examples.Our analysis shows that prior lethal heat events occurred beyonda general threshold of combined temperature and humidity, andthat today nearly one-third of the world’s population is regularlyexposed to climatic conditions surpassing this deadly threshold. Thearea of the planet and fraction of the world’s human populationexposed to deadly heat will continue to increase under all emissionscenarios, although the risk will be much greater under higher
emission scenarios. By 2100, almost three-quarters of the world’shuman population could be exposed to deadly climatic conditionsunder high future emissions (RCP 8.5) as opposed to one-halfunder strong mitigation (RCP 2.6). While it is understood thathigher latitudes will undergo more warming than tropical regions30,our results suggest that tropical humid areas will be dispropor-tionately exposed to more days with deadly climatic conditions(Fig. 5a), because these areas have year-round warm temperaturesand higher humidity, thus requiring less warming to cross the deadlythreshold (Fig. 4 and Supplementary Fig. 6). The consequencesof exposure to deadly climatic conditions could be further aggra-vated by an ageing population (that is, a sector of the popula-tion highly vulnerable to heat2–4) and increasing urbanization (thatis, exacerbating heat-island effects2–4). Our paper emphasizes theimportance of aggressivemitigation tominimize exposure to deadlyclimates and highlights areas of the planet where adaptation will bemost needed.
MethodsMethods, including statements of data availability and anyassociated accession codes and references, are available in theonline version of this paper.
Received 2 June 2016; accepted 17 May 2017;published online XXMonth XXXX
NATURE CLIMATE CHANGE | ADVANCE ONLINE PUBLICATION | www.nature.com/natureclimatechange 5

LETTERS NATURE CLIMATE CHANGE DOI: 10.1038/NCLIMATE3322
References1. Patz, J. A., Campbell-Lendrum, D., Holloway, T. & Foley, J. A. Impact of
regional climate change on human health. Nature 438, 310–317 (2005).2. Basu, R. & Samet, J. M. Relation between elevated ambient temperature and
mortality: a review of the epidemiologic evidence. Epidemiol. Rev. 24,190–202 (2002).
3. Kovats, R. S. & Hajat, S. Heat stress and public health: a critical review.Annu. Rev. Publ. Health 29, 41–55 (2008).
4. Leon, L. R. Pathophysiology of heat stroke. Colloquium Series on IntegratedSystems Physiology: From Molecule to Function to Disease Vol. 7, 1–101(Morgan Claypool Life Sciences, 2015).
5. Ostro, B. D., Roth, L. A., Green, R. S. & Basu, R. Estimating the mortality effectof the July 2006 California heat wave. Environ. Res. 109, 614–619 (2009).
6. Glaser, J. et al . Climate change and the emergent epidemic of chronic kidneydisease from heat stress in rural communities: the case for heat stressnephropathy. Clin. J. Am. Soc. Nephrol. (2016).
7. Robine, J.-M. et al . Death toll exceeded 70,000 in Europe during the summer of2003. C. R. Biol. 331, 171–178 (2008).
8. Sillmann, J. & Roeckner, E. Indices for extreme events in projections ofanthropogenic climate change. Climatic Change 86, 83–104 (2008).
9. Meehl, G. A. & Tebaldi, C. More intense, more frequent, and longer lasting heatwaves in the 21st century. Science 305, 994–997 (2004).
10. Orlowsky, B. & Seneviratne, S. Global changes in extreme events: regional andseasonal dimension. Climatic Change 110, 669–696 (2012).
11. Tebaldi, C., Hayhoe, K., Arblaster, J. M. & Meehl, G. A. Going to the extremes.Climatic Change 79, 185–211 (2006).
12. Tebaldi, C. & Wehner, M. F. Benefits of mitigation for future heatextremes under RCP4.5 compared to RCP8.5. Climatic Changehttp://dx.doi.org/10.1007/s10584-016-1605-5 (2016).
13. Sterl, A. et al . When can we expect extremely high surface temperatures?Geophys. Res. Lett. 35, L14703 (2008).
14. Huang, C. et al . Projecting future heat-related mortality under climate changescenarios: a systematic review. Environ. Health Persp. 119, 1681–1690 (2011).
15. Guo, Y. et al . Global variation in the effects of ambient temperature onmortality: a systematic evaluation. J. Epidemiol. 25, 781–789 (2014).
16. Luber, G. & McGeehin, M. Climate change and extreme heat events. Am. J.Prev. Med. 35, 429–435 (2008).
17. Bouchama, A. & Knochel, J. P. Heat stroke. New. Engl. J. Med. 346,1978–1988 (2002).
18. Bobb, J. F., Peng, R. D., Bell, M. L. & Dominici, F. Heat-related mortality andadaptation to heat in the United States. Environ. Health Persp. 122,811–816 (2014).
19. Gasparrini, A. et al . Temporal variation in heat–mortality associations: amulticountry study. Environ. Health Persp. 123, 1200–1207 (2015).
20. Lowe, D., Ebi, K. L. & Forsberg, B. Heatwave early warning systems andadaptation advice to reduce human health consequences of heatwaves. Int. J.Environ. Res. Public Health 8, 4623–4648 (2011).
21. Hanna, E. G. & Tait, P. W. Limitations to thermoregulation and acclimatizationchallenge human adaptation to global warming. Int. J. Environ. Res. Publ.Health. 12, 8034–8074 (2015).
22. Sherwood, S. C. & Huber, M. An adaptability limit to climate change due toheat stress. Proc. Natl Acad. Sci. USA 107, 9552–9555 (2010).
23. Whitman, S. et al . Mortality in Chicago attributed to the July 1995 heat wave.Am. J. Public Health 87, 1515–1518 (1997).
24. Dousset, B. et al . Satellite monitoring of summer heat waves in the Parismetropolitan area. Int. J. Climatol. 31, 313–323 (2011).
25. Shaposhnikov, D. et al . Mortality related to air pollution with the Moscow heatwave and wildfire of 2010. Epidemiol. 25, 359–364 (2014).
26. Barnett, A. G., Tong, S. & Clements, A. What measure of temperature is thebest predictor of mortality? Environ. Res. 110, 604–611 (2010).
27. Willett, K. M. & Sherwood, S. Exceedance of heat index thresholds for 15regions under a warming climate using the wet-bulb globe temperature. Int. J.Climatol. 32, 161–177 (2012).
28. Argüeso, D., Di Luca, A., Perkins-Kirkpatrick, S. & Evans, J. P. Seasonalmean temperature changes control future heatwaves. Geophys. Res. Lett. 43,7653–7660 (2016).
29. Jones, B. & O’Neill, B. Spatially explicit global population scenarios consistentwith the Shared Socioeconomic Pathways. Environ. Res. Lett. 11, 084003 (2016).
30. Diffenbaugh, N. S. & Field, C. B. Changes in ecologically critical terrestrialclimate conditions. Science 341, 486–492 (2013).
31. Mitchell, D. et al . Attributing human mortality during extreme heat waves toanthropogenic climate change. Environ. Res. Lett. 11, 074006 (2016).
AcknowledgementsWe thank the Gridded Human Population of the World Database and the NationalCenter for Environmental Prediction and Department of Defense reanalysis database formaking their data openly available and B. Jones for sharing human populationprojections. We acknowledge the World Climate Research Programme’s Working Groupon Coupled Modelling, which is responsible for CMIP5, and thank the climate modellinggroups (listed in Supplementary Table 1) for producing and making available their modeloutputs. We also thank D. Schanzenbach, S. Cleveland and R. Merrill from the Universityof Hawaii Super Computer Facility for allowing access to computing facilities and HawaiiSeaGrant for providing funds to acquire some of the computers used in these analyses.Q. Chen, A. Smith, C. Dau, R. Fang and S. Seneviratne provided valuable contributions tothe paper. The opinions or assertions contained herein are the private views of theauthors and are not to be construed as official or as reflecting the views of the Army orthe Department of Defense. We thank R. Carmichael, M. Deaton, D. Johnson andM. Smith in Esris Applications Prototype Lab for the creation of the online mappingapplication. This paper was developed as part of the graduate course on ‘Methods forLarge-Scale Analyses’ in the Department of Geography, University of Hawaii at Manoa.
Author contributionsAll authors contributed to the design of the paper. C.M., B.D., I.R.C., F.E.P., R.C.G.,C.R.B., C.W.W.C., B.S.D., E.T.J., L.V.L., M.P.L., M.M.M., A.G.S., H.T. and C.T. collecteddata. C.M. and I.R.C. performed analysis. All authors contributed to the writing ofthe paper.
Additional informationSupplementary information is available in the online version of the paper. Reprints andpermissions information is available online at www.nature.com/reprints. Publisher’s note:Springer Nature remains neutral with regard to jurisdictional claims in published mapsand institutional affiliations. Correspondence and requests for materials should beaddressed to C.M.
Competing financial interestsThe authors declare no competing financial interests.
6 NATURE CLIMATE CHANGE | ADVANCE ONLINE PUBLICATION | www.nature.com/natureclimatechange

NATURE CLIMATE CHANGE DOI: 10.1038/NCLIMATE3322 LETTERSMethodsSurvey of published cases of heat-related mortality.We searched forpeer-reviewed studies published between 1980 and 2014 on heat-related mortalityin Google Scholar, PubMed, and the Web of Science using the following keywords:(human OR people) AND (mortality OR death OR lethal) AND (heat ORtemperature). We searched for papers primarily in English, but also includedpapers in Spanish, French, Japanese and Chinese when found. We reviewed thetitles and abstracts of the first 30,000 citations in Google Scholar and all citationsfrom other databases and selected any peer-reviewed publications on heat-relatedhuman mortality (we also searched for additional sources in the references). Theseefforts resulted in 911 peer-reviewed papers from which we collected informationon the place and dates of lethal heat events. Several papers noted that humanmortality may have occurred beyond the dates in which the extreme climaticconditions occurred (‘mortality displacement’); in those cases, we extracted thedates for which the extreme climatic conditions were reported in the given studies.Our goal was to identify the dates in which climatic conditions triggered humanmortality regardless of whether mortality was displaced or not.
Climatic conditions related to prior cases of heat-related mortality. For the casesin the literature review that reported the place and time of lethal heat events, weassessed information for 16 climatic metrics based on mean daily surface airtemperature, relative humidity, solar radiation, and wind speed (SupplementaryFig. 1). For each of the lethal heat events, we also assessed the same climaticvariables for a paired ‘non-lethal’ event of the same duration and from the samecity but from a randomly chosen date. Climatic conditions were characterizedusing daily data from an atmospheric reanalysis of past climate (NCEP-DOEReanalysis 2). We used the NCEP-DOE Reanalysis database because it is among themost studied and is well characterized relative to newer databases. We usedSupport Vector Machine (SVM) modelling to separate the climatic conditionsassociated with prior lethal heat events from those associated with non-lethalevents. Using SVM, we generated a decision vector/threshold that maximized thedistance between lethal and non-lethal episodes, with the conditions on one side ofthe threshold being lethal and those to the other side being non-lethal (for example,Fig. 1b). We developed such SVMmodels for all combinations of the variablescollected and then compared the accuracy of models to choose the mostparsimonious and best performing one.
Projected occurrence of deadly climatic conditions. To quantify the number ofdays in a year that surpass the threshold beyond which conditions become deadlyunder alternative emission scenarios, we applied the 95% SVM probabilitythreshold between mean daily surface air temperature and relative humidity ofprior lethal heat events to daily climate projections of the same variables. We usedthe 95% SVM probability threshold because it resulted in a much more accurateclassification of prior lethal heat events, and because it restricts projected lethalheat events to much more extreme conditions, hence yielding more conservativeresults. We used daily climate projections of mean surface air temperature andrelative humidity from 20 Earth System Models under four alternative emissionsscenarios developed for the recent Coupled Model Intercomparison Project Phase 5(Supplementary Table 1). We used the ‘historical’ experiment, which includes theperiod from 1950 to 2005 and the Representative Concentration Pathways 2.6, 4.5
and 8.5 (RCP 2.6, 4.5 and 8.5, respectively), which include the period from 2006 to2100. The historical experiment was designed to model recent climate (reflectingchanges due to both anthropogenic and natural causes) and allows the validation ofmodel outputs against available climate observations (Supplementary Figs 8 and 9).RCP pathways represent contrasting mitigation efforts between rapid greenhousegas reductions (RCP 2.6) and a business-as-usual scenario (RCP 8.5). All analyseswere run at the original resolution of each climate database and the results wereinterpolated to a common 1.5◦ grid cell size using a bilinear function.
Projections of global land coverage and risk to human populations from deadlyclimatic conditions. To calculate the amount of land area and fraction of thehuman population that are likely to be exposed to deadly climates each year, wesummed the land area and human population for all cells experiencing varyingnumbers of days in a year beyond the deadly threshold (Fig. 2 and SupplementaryFig. 4). We used the Gridded Population of the World from the SocioeconomicData and Applications Center (http://sedac.ciesin.columbia.edu/data/set/gpw-v3-population-count-future-estimates/data-download#) to estimate human exposureup to the year 2005 and human population projections consistent with the differentemission scenarios used in the CMIP5 to estimate exposure between 2006 and2100. For the population projections, we specifically used the spatially explicitglobal population scenarios consistent with the Shared Socioeconomic Pathways(SSP) developed by Jones et al.29, pairing RCP 2.6 with SSP1, RCP 4.5 with SSP3,and RCP 8.5 with SSP5.
Limitations. There are several potential limitations to our study. First, the lethalityof deadly climatic conditions can be mediated by various demographic (forexample, age structure), socio-economic (for example, air conditioning, earlywarning systems) and urban planning (for example, vegetation, high albedosurface) factors that were not considered in our study. Consideration of thesefactors would improve the understanding of global human vulnerability to heatexposure and may reduce the number of human deaths, but they are unlikely toaffect the occurrence of deadly climatic conditions, which is what we estimated.Second, our survey of cases of heat-related mortality was restricted to the periodbetween 1980 and 2014, and any bias or temporal heterogeneity in the monitoringof lethal heatwaves and epidemiological studies in this period may influence thecases we studied and the resulting SVMmodel. Third, while general agreementamong models was found in the predictions of deadly climatic conditions intropical areas, greater variability among models was seen in such projections athigher latitudes (grey areas in Fig. 3). Because deadly conditions are more rare athigher latitudes (Fig. 4), a larger number of model ensembles might allow for moredefinitive statements about the risk of deadly climates in such regions, as has beensuggested for similar cases of rare events31. Finally, it is possible that some lethalheat events were not documented in peer-reviewed publications and, if the dates ofthose undocumented events happened to be selected as part of the non-lethalevents in our analysis, this could affect the resulting SVMmodel. However, thiserror is likely minimal because there is a low probability of randomly selecting suchrare and brief events from a 30-year period in the given cities.
Data availability. The data that support the findings of this study are availablefrom the corresponding author upon request.
NATURE CLIMATE CHANGE | www.nature.com/natureclimatechange