globally optimized fiber tracking and hierarchical clustering — a unified framework
TRANSCRIPT

Available online at www.sciencedirect.com
ng 30 (2012) 485–495
Magnetic Resonance ImagiGlobally optimized fiber tracking and hierarchicalclustering — a unified framework
Xi Wua, b, c, Mingyuan Xieb, Jiliu Zhoua, Adam W. Andersonc, d,John C. Gorec, d, Zhaohua Dingc, d, e,⁎
aCollege of Electronics and Information Engineering, Sichuan University, 610065, P.R. ChinabDepartment of Electronic Engineering, Chengdu University of Information Technology, 610225, P.R. China
cVanderbilt University Institute of Imaging Science, Vanderbilt University, Nashville, TN 37232, USAdDepartment of Biomedical Engineering, Vanderbilt University, Nashville, TN 37232, USA
eDepartment of Electrical Engineering and Computer Science, Vanderbilt University, Nashville, TN 37232, USA
Received 13 October 2011; accepted 4 December 2011
Abstract
Structural connectivity between cortical regions of the human brain can be characterized noninvasively with diffusion tensor imaging(DTI)-based fiber tractography. In this paper, a novel fiber tractography technique, globally optimized fiber tracking and hierarchical fiberclustering, is presented. The proposed technique uses k-means clustering in conjunction with modified Hubert statistic to partition fiberpathways, which are evaluated with simultaneous consideration of consistency with underlying DTI data and smoothness of fiber courses inthe sense of global optimality, into individual anatomically coherent fiber bundles. In each resulting bundle, fibers are sampled, perturbed andclustered iteratively to approach the optimal solution. The global optimality allows the proposed technique to resist local image artifacts andto possess inherent capabilities of handling complex fiber structures and tracking fibers between gray matter regions. The embeddedhierarchical clustering allows multiple fiber bundles between a pair of seed regions to be naturally reconstructed and partitioned. Theintegration of globally optimized tracking and hierarchical clustering greatly benefits applications of DTI-based fiber tractography to clinicalstudies, particularly to studies of structure–function relations of the complex neural network of the human. Experiments with synthetic and invivo human DTI data have demonstrated the effectiveness of the proposed technique in tracking complex fiber structures, thus proving itssignificant advantages over traditionally used streamline fiber tractography.© 2012 Elsevier Inc. All rights reserved.
Keywords: Diffusion tensor imaging; Fiber tracking; Fiber clustering; Global optimization
1. Introduction
Diffusion tensor magnetic resonance imaging (DT-MRIor DTI) is a unique technique that measures diffusive motionof water molecules in living tissue [1]. Since water moleculesin the human brain diffuse faster along the major axis offiber tracts than across their membranes, characterizing waterdiffusion in each voxel provides a certain indication ofthe local orientation of the neural fibers in that voxel. Thedirectional dependence of water diffusion and hence the
⁎ Corresponding author. Vanderbilt University Institute of ImagingScience, MCN AA-1105, Nashville, TN 37232-2310, USA. Tel.: +1 615322 7889; fax: +1 615 322 0734.
E-mail address: [email protected] (Z. Ding).
0730-725X/$ – see front matter © 2012 Elsevier Inc. All rights reserved.doi:10.1016/j.mri.2011.12.017
local tissue orientation in each voxel can be represented by amatrix, called a diffusion tensor, diagonalization of whichyields three pairs of eigenvalues–eigenvectors that give thediffusivity along three principle directions.
The notion that diffusion tensors contain the informationof local tissue orientation can be exploited to infer neuronalfiber structures in vivo with DTI. In fact, this idea has beenextensively pursued during the past decade, leading to abun-dant fiber tractography algorithms in the literature thatreconstruct neuronal fiber pathways based on integratinglocal orientation information [2–9]. Nevertheless, reliablereconstruction of neural fibers with DTI, particularly withthe goal of routine laboratory use, remains an open prob-lem. The commonly used streamline methods, which “grow”fibers from predefined seed points sequentially to generate
486 X. Wu et al. / Magnetic Resonance Imaging 30 (2012) 485–495
entire fiber pathways, suffer from several major limita-tions, most notably cumulative errors along the trackingpathways and ambiguities in defining the fiber orientationat fiber crossings with the tensor model. Although pro-babilistic streamline tracking may potentially be able toaddress these problems, in essence, it still tracks fibers step-wise without considerations of global optimality of the fiberpathways reconstructed.
To ameliorate the problems associated with streamline-like methods, efforts have been made to develop trackingtechniques based on the concept of global optimization, sothat the effects of local imaging artifacts can be minimized.For instance, Tuch et al. proposed a simulated annealingmethod to find most probable pathways between corticalregions [10]. Jbabdi et al. developed a global Bayesianframework for simultaneous inference of structural andfunctional connectivity, with model parameters optimized byusing a Markov chain Monte Carlo algorithm [11]. Thereare also a variety of other globally optimized tracking tech-niques that have been proposed more recently, which includegraph search [12], shortest path finding [13], Gibbs andBayesian tracking [14], spin glass modeling [15] and sto-chastic optimization of structural connectivity and micro-structural properties with differential evolution [16].
It should also be noted that, although instrumental tovisualization, most of the fiber tractography techniques aloneoffer little anatomical interpretations or quantitative charac-terizations of connectivity. Thus, reconstructed fiber path-ways are typically further bundled to allow for meaningfulanatomical interpretations and/or quantifications of structuralconnectivity. Toward this end, a plethora of manual [17,18],automated [19–21] and knowledge-guided [22–24] bundlingtechniques have been proposed during the past decade tofurther classify fiber pathways reconstructed by tractography.
Motivated by the need for fiber tracking that is robust toimaging artifacts and fiber bundling that divides fibers intodistinct anatomical bundles, we have proposed a noveltechnique that integrates globally optimized fiber trackingwith hierarchical fiber clustering. Specific features of theproposed framework include:
- Given a pair of regions of interests (ROIs), fiber tractsthat connect them are reconstructed and clustered intoanatomically distinct bundles simultaneously.
- Reconstructed fiber pathways are globally optimal inthe sense that fiber tracts are consistent with thedirection map provided by DTI and the fiber tracts arereasonably smooth.
- A hierarchical clustering process successively dividesfiber pathways between a pair of ROIs into multiplenatural anatomical bundles.
Except for the ROIs that are designated a priori, theproposed framework works in a fully automated fashion. Ityields globally optimal fiber pathways that are immune to theeffects of local imaging artifacts and simultaneously
organizes the fibers into distinct anatomical bundles tofacilitate further interpretations and characterizations. To thebest of our knowledge, this is the first technique that solvesthe problems of fiber tracking and bundling with a single“one-shot” approach.
The remainder of the paper is organized as follows. First,the framework of the proposed technique is described indetail in Section 2. Then, tracking experiments using syn-thetic and in vivo human DTI data are presented in Section 3,with experimental results demonstrating the capabilities andadvantages of the technique proposed. Finally, main con-tributions of this work are summarized and relevant technicalissues are discussed in Section 4.
2. Methods
Typical practice of fiber tracking involves finding con-nection pathways that connect certain designated ROIs. Veryoften, we are given a pair (or more) of ROIs and are expectedto find plausible fiber pathways connecting them. Thisscenario in fact bears particular relevance to studies of thecomplex neural network of the human brain, in which certainROIs are determined a priori from other sources such asanatomical or functional MRI.
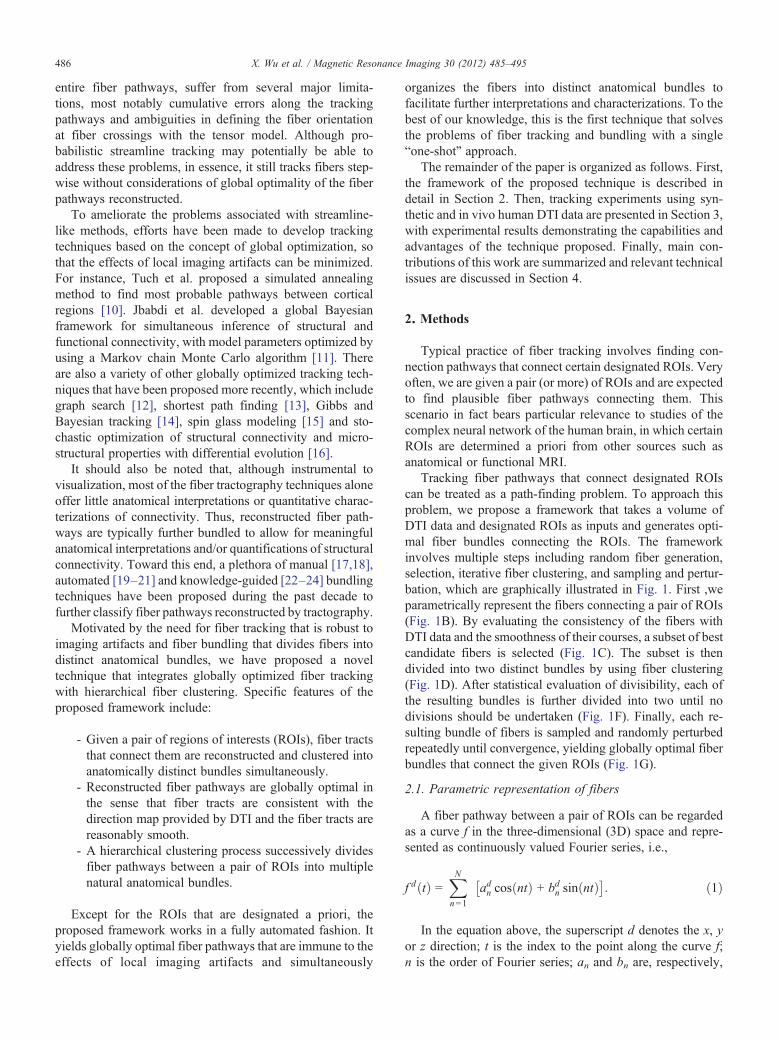
Tracking fiber pathways that connect designated ROIscan be treated as a path-finding problem. To approach thisproblem, we propose a framework that takes a volume ofDTI data and designated ROIs as inputs and generates opti-mal fiber bundles connecting the ROIs. The frameworkinvolves multiple steps including random fiber generation,selection, iterative fiber clustering, and sampling and pertur-bation, which are graphically illustrated in Fig. 1. First ,weparametrically represent the fibers connecting a pair of ROIs(Fig. 1B). By evaluating the consistency of the fibers withDTI data and the smoothness of their courses, a subset of bestcandidate fibers is selected (Fig. 1C). The subset is thendivided into two distinct bundles by using fiber clustering(Fig. 1D). After statistical evaluation of divisibility, each ofthe resulting bundles is further divided into two until nodivisions should be undertaken (Fig. 1F). Finally, each re-sulting bundle of fibers is sampled and randomly perturbedrepeatedly until convergence, yielding globally optimal fiberbundles that connect the given ROIs (Fig. 1G).
2.1. Parametric representation of fibers
A fiber pathway between a pair of ROIs can be regardedas a curve f in the three-dimensional (3D) space and repre-sented as continuously valued Fourier series, i.e.,
f d tð Þ =XNn=1
adn cos ntð Þ + bdn sin ntð Þ� �: ð1Þ
In the equation above, the superscript d denotes the x, yor z direction; t is the index to the point along the curve f;n is the order of Fourier series; an and bn are, respectively,
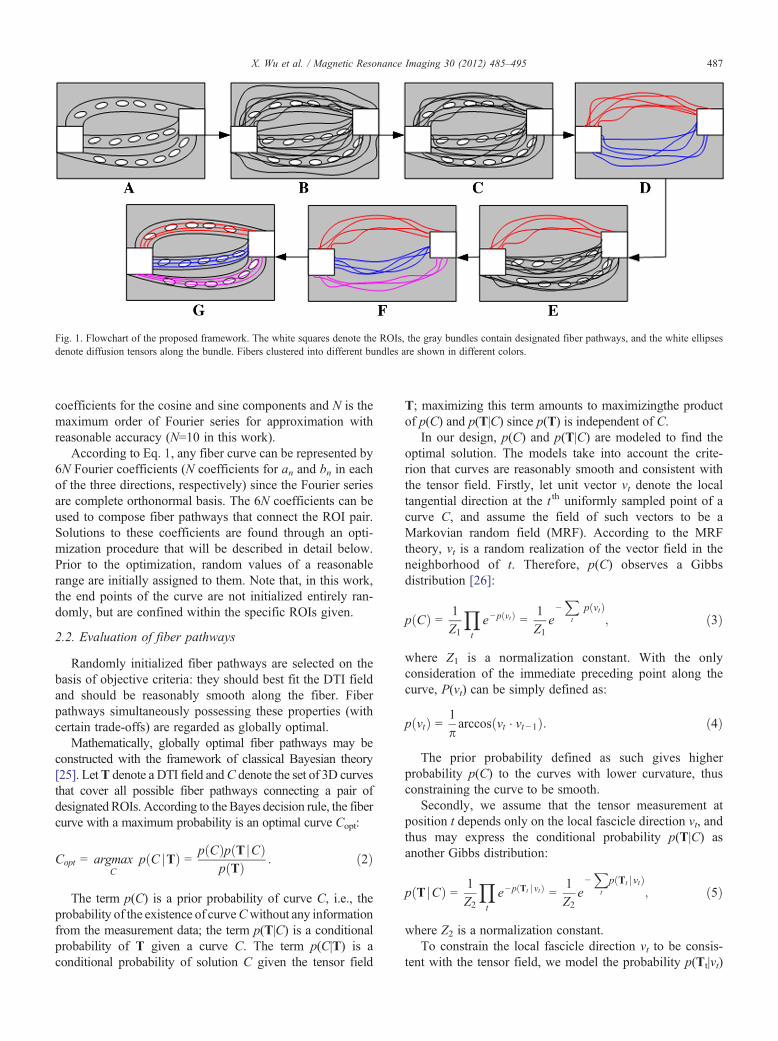
Fig. 1. Flowchart of the proposed framework. The white squares denote the ROIs, the gray bundles contain designated fiber pathways, and the white ellipsesdenote diffusion tensors along the bundle. Fibers clustered into different bundles are shown in different colors.
487X. Wu et al. / Magnetic Resonance Imaging 30 (2012) 485–495
coefficients for the cosine and sine components and N is themaximum order of Fourier series for approximation withreasonable accuracy (N=10 in this work).
According to Eq. 1, any fiber curve can be represented by6N Fourier coefficients (N coefficients for an and bn in eachof the three directions, respectively) since the Fourier seriesare complete orthonormal basis. The 6N coefficients can beused to compose fiber pathways that connect the ROI pair.Solutions to these coefficients are found through an opti-mization procedure that will be described in detail below.Prior to the optimization, random values of a reasonablerange are initially assigned to them. Note that, in this work,the end points of the curve are not initialized entirely ran-domly, but are confined within the specific ROIs given.
2.2. Evaluation of fiber pathways
Randomly initialized fiber pathways are selected on thebasis of objective criteria: they should best fit the DTI fieldand should be reasonably smooth along the fiber. Fiberpathways simultaneously possessing these properties (withcertain trade-offs) are regarded as globally optimal.
Mathematically, globally optimal fiber pathways may beconstructed with the framework of classical Bayesian theory[25]. LetT denote a DTI field andC denote the set of 3D curvesthat cover all possible fiber pathways connecting a pair ofdesignatedROIs. According to the Bayes decision rule, the fibercurve with a maximum probability is an optimal curve Copt:
Copt = argmaxC
p C jTð Þ = p Cð Þp T jCð Þp Tð Þ : ð2Þ
The term p(C) is a prior probability of curve C, i.e., theprobability of the existence of curveCwithout any informationfrom the measurement data; the term p(T|C) is a conditionalprobability of T given a curve C. The term p(C|T) is aconditional probability of solution C given the tensor field
T; maximizing this term amounts to maximizingthe productof p(C) and p(T|C) since p(T) is independent of C.
In our design, p(C) and p(T|C) are modeled to find theoptimal solution. The models take into account the crite-rion that curves are reasonably smooth and consistent withthe tensor field. Firstly, let unit vector vt denote the localtangential direction at the t th uniformly sampled point of acurve C, and assume the field of such vectors to be aMarkovian random field (MRF). According to the MRFtheory, vt is a random realization of the vector field in theneighborhood of t. Therefore, p(C) observes a Gibbsdistribution [26]:
p Cð Þ = 1Z1
Yt
e−p vtð Þ =1Z1
e−Xt
p vtð Þ; ð3Þ
where Z1 is a normalization constant. With the onlyconsideration of the immediate preceding point along thecurve, P(vt) can be simply defined as:
p vtð Þ = 1parccos vt � vt−1ð Þ: ð4Þ
The prior probability defined as such gives higherprobability p(C) to the curves with lower curvature, thusconstraining the curve to be smooth.
Secondly, we assume that the tensor measurement atposition t depends only on the local fascicle direction vt, andthus may express the conditional probability p(T|C) asanother Gibbs distribution:
p T jCð Þ = 1Z2
Yt
e− p Tt j vtð Þ =1Z2
e−Xt
p Tt jvtð Þ; ð5Þ
where Z2 is a normalization constant.To constrain the local fascicle direction vt to be consis-
tent with the tensor field, we model the probability p(Tt|vt)

488 X. Wu et al. / Magnetic Resonance Imaging 30 (2012) 485–495
such that it increases with the angular difference betweenthe local fiber direction vt and the major eigenvector ofthe local diffusion tensor et:
p Tt jvtð Þ = 1parccos vt � etð Þ: ð6Þ
Note that using the angular difference between vt and etto model the conditional probability is a common choice. Itis reasonable if the angular difference is solely caused byrandom noise. We recognize that, in degenerative cases suchas fiber crossing or branching, this model is inadequate. Thislimitation, however, may be overcome by using high angularresolution diffusion imaging (HARDi) [27–30] and extend-ing the above model to accommodate fiber orientationdensity distributions derived from HARDi.
Combining the prior probability model in Eq. 3 and theconditional probability model in Eq. 5 gives an expressionfor p(C|T), which turns out to be a new Gibbs distribution:
p C jTð Þ = 1Z3
e−Xt
p vtð Þ + ap Tt jvtð Þ; ð7Þ
where Z3=Z1·Z2. The parameter α will be explained shortlybelow.
With the Gibbs distribution above, we can reach anoptimal solution by minimizing the following cost function:
fcos t =Xt
p vtð Þ + aXt
p Tt jvtð Þ ð8Þ
The first term in the above cost function constrains thecurve to be smooth, and the second term maintains aconsistency between the local fiber direction and the tensordominant direction. The weighting parameterα (chosen to bebetween 0.1 and 10 in this work) regulates a trade-offbetween the smoothness of the fiber and consistency withthe data.
2.3. Fiber bundle clustering
From a set of candidate solutions to the fiber pathways,a subset of fibers is selected according to the cost functionin Eq. 8. This subset is successively clustered into anato-mically distinct fiber bundles using the classical k-meansclustering algorithm [31]. In each clustering process, thefibers are divided into maximally two bundles based on themodified Hubert (MH) statistic [32]. Each of the resultingbundles is then further divided into two until no divisionsshould be performed. Details of the k-means clustering andMH statistic are given below.
The k-means clustering is a method that aims to dividen observations into k clusters in which each observationbelongs to the cluster with the nearest mean. In this work,fibers are clustered into two distinct bundles in each iteration
using the mean Euclidean distance δ between a pair of fibersas follows:
d p; qð Þ=XMm
pmx −qmx
� �2+ pmy −q
my
� �2+ pmz −q
mz
� �2� 12
!=M ;
ð9Þwhere p and q denote a pair of fibers, m is the index to thepoint along the fiber and M is the number of sampled points(M=50 in this work).
The k-means clustering itself is also an iterative process.In our implementation, the mean Euclidean distancesbetween all fiber pairs in a given set are first computed,with the pair of fibers having the largest mean Euclideandistance chosen to be the prototypes (i.e., cluster centers). Allother fibers are then grouped into either of the two clusters onthe basis of the mean Euclidean distance to the prototypes.Finally, new prototypes are calculated by point-wise aver-aging the coordinates of all the fibers in each group. Thisprocess is repeated until clustering convergence (changes infiber grouping b5% in this work).
After the clustering process, the MH statistic, which is ameasure of correlation between the matrix of interclusterdistances and the distances recovered from the clusteringsolution, is used to evaluate the validity of fiber set division.Specifically, let L denote a label function established bythe k-means clustering process that maps a set of n fibers totwo clusters:
L ið Þ = k if ia cluster Ck ; ka 1; 2f g ð10Þ
Let x denote a fiber and m denote a cluster prototype; theMH statistic is computed as follows:
r = 1 = Nð ÞXX
d xi; xj� �
d mL ið Þ;mL jð Þ� � ð11Þ
Mp = 1 = Nð ÞXX
d xi; xj� � ð12Þ
Mc = 1= Nð ÞXX
d mL ið Þ;mL jð Þ� � ð13Þ
r2p = 1= Nð ÞXX
d2 xi; xj� �
− M 2p ð14Þ
r2c = 1= Nð ÞXX
d2 mL ið Þ;mL jð Þ� �
− M 2c ð15Þ
All the sums above are over the set:
i; jð Þ : 1ViVn − 1 and i + 1VjVnf g ð16Þ
And N=n(n−1)/2.

489X. Wu et al. / Magnetic Resonance Imaging 30 (2012) 485–495
The MH measure for the clustering {C1, C2} is:
MH Kð Þ = r − MpMc
rprcð17Þ
As pointed out by Dubes [32], if |1−MH(kmax)|≥0.3, thereexists only one cluster in the fiber set. In this situation, fiberswill not be divided into two bundles, and the clusteringprocess terminates for this set of fibers. Otherwise, the fibersare divided into two bundles, and each of them goes throughthe same clustering process successively, thus achievinghierarchical fiber bundling.
2.4. Sampling and perturbation of fibers
For each of the fiber bundles obtained from the clusteringprocedure, or the entire set of fibers if it is not dividableaccording to the MH statistic, a new set of fibers is generatedby using a sampling technique called importance sampling[33]. Specifically, we first compute the probability densityfunction (PDF) of the cost function of all fibers within abundle and then sample the fibers such that fibers with higherprobability densities are sampled at higher probabilities.
After the importance sampling, the fibers are randomlyperturbed by adding small variances to their Fourier co-efficients. In this work, the amount of perturbation foreach coefficient is at the order of one standard deviation ofthe coefficients of all the fibers in the bundle. This offersan opportunity to generate new fibers with better costfunction values and meanwhile maintains the stability ofthe solutions.
The importance sampling and random perturbation areiteratively performed. At the end of each iteration, a subsetof optimal fibers based on the cost function in Eq. 8 isselected for the next iteration. The iterative process will beterminated when change of the mean cost function value issmaller than 5%, in which circumstance we regard the pro-cess to have converged.
3. Tracking experiments and results
The algorithm proposed was evaluated with a series offiber tracking experiments on synthetic as well as in vivohuman DTI data sets. Section 3.1 presents tracking resultsfrom synthetic data sets. We first examine the results fromfive synthetic phantoms each with a different geometricconfiguration. Then the capability of the proposed algorithmto reconstruct globally optimal fiber pathways in the pres-ence of complex fiber configurations such as fiber crossingand kissing is demonstrated. Finally, one of the syntheticdata sets from above is used to statistically evaluate theoptimization process and demonstrate the validity of fibertracking results. Section 3.2 shows results of fiber trackingby the proposed technique from several real human braindata sets, followed by a comparison of the proposed tech-
nique with the “shortest paths” global fiber tracking [13] interms of in vivo performance. Finally, Section 3.3 presentscomputational efficiency of the proposed algorithm.
3.1. Fiber tracking with synthetic data sets
3.1.1. Assessment of performance on tracking curvesTo evaluate the performance of the proposed algorithm to
track curves, five tensor fields were synthesized, with eachcontaining a different geometric configuration. Synthetictensors in these curves were constructed to have a trace of2.1×10−5 cm2/s and a fractional anisotropy (FA) of 0.8, thusclosely mimicking physiological conditions in the humanbrain. The first one, shown in Fig. 2A, was a sinusoidal curvewith two extrema. Each tensor was represented by anellipsoid whose principal axes were parallel to the threeeigenvectors of the tensor, and the radii of the ellipsoid alongthe axes were proportional to their corresponding eigen-values. Diffusion-weighted imaging was simulated along32 noncollinear directions with a b value of 1000 s/mm2,and the resulting signals were further corrupted with zeromean Gaussian noise at a standard deviation of 0.05. Fig. 2Bto E contained the following geometrical configurations: twobundles connecting two ROIs, three bundles connecting twoROIs, two bundles connecting three ROIs and three bundlesconnecting four ROIs.
For each of the synthetic tensor fields, two or more ROIswere defined (denoted as a square in Fig. 2F to J), betweenwhich “fibers” were tracked using the proposed algorithm.First, a total of 1000 random curves connecting the desig-nated ROIs were generated. Among them, 100 curves withbest cost function values were selected, which were sub-sequently divided into different “fiber” bundles. If thereexisted only one bundle based on the MH statistic, thesecurves were sampled using importance sampling and thenperturbed to generated 1000 new curves. A subset of 100best curves was selected from these new curves to repeat thesampling and perturbation processes until the terminationcriterion was met. On the other hand, if the 100 selectedcurves could be divided into two bundles, each bundle wasthen processed individually as above.
The tracking results obtained are shown in Fig. 2F to J,respectively, in which 100 randomly selected “fibers” weredemonstrated in each figure. As can be seen, these “fibers”grossly follow the synthetic curves for all the combinationsof different bundles and ROI numbers. Close inspectionsreveal that the proposed algorithm produces “fibers” thatexhibit good convergence along the entire path.
3.1.2. Assessment of tracking performance in the presenceof complex fiber configurations
The capability to reconstruct globally optimal fibers inthe presence of complex fiber configurations, such as“kissing” and “crossing,” is an inherent feature of theproposed algorithm. This capability was examined withsynthetic phantoms containing “fibers” with each of the
Fig. 2. Tests of tracking curves with synthetic tensor data. Upper panel (A–E): synthetic phantoms with different geometric structures. Lower panel (F–J): tracking results. The ROIs for the tracking experiments aredenoted in white squares, and fibers clustered into different bundles are shown in different colors. Inset in the first column is an enlarged view of a part of the tensor field.
490X.Wuet
al./Magnetic
Resonance
Imaging
30(2012)
485–495

Fig. 3. Tests of tracking performance in the presence of complex fiber configurations with synthetic tensor data. The first column shows the synthetic structure of“fiber kissing” (A) and “fiber crossing” (C). The second column (B, D) shows the “fibers” tracked by proposed technique. The ROIs for the tracking experimentsare denoted in white squares.
491X. Wu et al. / Magnetic Resonance Imaging 30 (2012) 485–495
above structures, as shown in Fig. 3A (“kissing”) and C(“crossing”), respectively. The parameter settings used werethe same as before, and ROI pair was denoted by square inFig. 3B and D.
Tracking results are shown in the right column of Fig. 3.As expected, the proposed method had no problems tracking“fibers” in the presence of the “crossing” or “kissing.”
Fig. 4. Variations of mean value of cost function (A) and probability density of cost function (B) with the number of iterations.
Moreover, it can be observed that it produced “fibers” withgood convergence to the desired pathways.
3.1.3. Statistical analysis of reconstructed fiber tractsMean values of the cost function of the tracked “fibers” in
Fig. 2A and their variations with the number of iterations areshown in Fig. 4. It is shown that mean values of the cost

492 X. Wu et al. / Magnetic Resonance Imaging 30 (2012) 485–495
functions are high at the beginning, but decrease rapidlyduring the first few iterations. They tend to stabilize to lowvalues at around five iterations, beyond which furtherdeclines are quite small. This indicates that the algorithmsstart to converge around the fifth iteration, at which thetracked “fibers” are close to the final optimal pathways.Meanwhile, variations of the PDF of the cost function withthe number of iterations are demonstrated in Fig. 4B. It canbe seen that, at the first few iterations, the PDF spreadsover a wide range. As the number of iterations increases,the mean value of the cost function becomes small, and therange of PDF becomes narrower. Eventually, the PDF isstabilized, again indicating that convergent results havebeen reached.
The synthetic experiments in the preceding sections, andthe in vivo experiments to be presented next as well, dem-onstrate the capability of the proposed algorithm to trackknown fiber tracts. While these experiments provide certainintuitive validations of the algorithm proposed, an issue ofequal importance still remains, i.e., the validity of the fiberpathways tracked by the algorithm. In fact, this issue iscritical since the proposed algorithm always generates con-nection pathways for a given pair of ROIs; whether or notthere exist genuine underlying fiber tracts is unknown.
To address this issue, a principled validity test with thesame phantom as shown in Fig. 2A was undertaken. First,“fiber” pathways between the two ROIs were tracked withthe proposed algorithm as above. The mean of the 10%tracked “fibers” with lowest cost function values was thenderived and treated as a standard “fiber,” for which the valueof the cost function was calculated. The diffusion tensorsalong the mean “fiber tract” were subsequently perturbedrandomly, followed by recalculation of the value of the costfunction. The process of tensor perturbation was repeated10,000 times, each resulting in a new value of the costfunction. We found that the value of the cost function for thestandard “fiber” is 1.21. This is far smaller than the values ofthe cost function after tensor perturbations along the “fibertract,” which range from 7.67 to 8.41 (two-tailed t test, P=0).
Fig. 5. Fibers tracked between the Broca's area, the premotor region and the Wernicdifferent in vivo data sets. Note that the premotor region is denoted by dark greendenoted by gray dots. Pathways connecting the Broca's area and the premotor regiWernicke area are shown in red (dorsal route) and blue (ventral route).
This certainly proves that the tracked “fiber” has a genuinestructure rather than random patterns underlying it.
3.2. Fiber tracking with in vivo human DTI data
To assess in vivo performance of the algorithm pro-posed, diffusion-weighted images (DWIs) of nine healthyhuman volunteers were acquired. Prior to the imaging, in-formed consent was obtained from each subject accordingto a protocol approved by Vanderbilt University InstitutionalReview Board.
All imagingwas carried out on a 3-TPhilips InteraAchievaMR scanner (Best, the Netherlands) using an eight-elementsensitivity encoding (SENSE) coil and a single-shot, echo-planar pulsed gradient spin-echo imaging sequence.Diffusionweighting was performed along 32 noncollinear directionswith a b value of 1000 s/mm2 (matrix size=128×128, field ofview=256×256 mm2, echo time=60 ms, repetition time=10 s,thickness=2 mm, gap=0, SENSE factor=2). To improve thesignal-to-noise ratio of the images, three repeated scans wereobtained from each subject; after motion and distortioncorrection, the three sets of images were averaged usingPhilips diffusion registration PRIDE tool (Release 0.4).From the averaged DWI data, diffusion tensors and sub-sequently FA maps were computed [1]. To aid in definingROIs for fiber tracking, T1-weighted images were alsoacquired during the same imaging session, along withfunctionalMRI signals thatwere obtained byusingdesignatedtasks to activate the cortical language regions [34].
Three ROIs for the in vivo experiments were the leftBroca's area, the premotor region and the left Wernicke'sarea, defined using the method reported earlier [34]. Withthese ROIs, fiber tracking was performed using the pro-posed technique, and the parameter settings used were thesame as in the synthetic experiments. As it is not possible tomeasure quantitatively the accuracy of in vivo fiber trackingdue to a lack of “gold standard,” performance evaluation ofthe proposed technique was based on qualitative judgmentof consistency of the reconstructed fiber tracts with theirknown neuroanatomy.
ke area using the proposed technique. Tracts shown are the results from foudots, the Broca's area is denoted by brown dots and the Wernicke area is
on are shown in magenta, and pathways connecting the Broca's area and the
r

493X. Wu et al. / Magnetic Resonance Imaging 30 (2012) 485–495
Fig. 5 shows fibers tracked of the pathways between the leftBroca's area and the premotor region, and the left Broca'sandWernicke's area, from in vivo data sets, respectively. Foreach bundle, a set of randomly selected 30 fibers was drawnfor visualization. It is clearly demonstrated that thereconstructed fiber pathways exhibit good agreement withtheir known neuroanatomy for all the data sets studied.Although there are certain differences among the subjects,which are partly due to intersubject anatomical variations,the pathways reconstructed are largely consistent acrossthem. Of particular note, there can be two connecting routesbetween the Broca's area and Wernicke's area — the dorsalroute and the ventral route. Among the nine data sets studiedin this work, the algorithm reconstructed fiber pathways ofthe dorsal route (red curves) for all of them and trackedthe pathways of the ventral route (blue curves) for three ofthem (shown from left to right of Fig. 5 are one typical caseof only dorsal route and all three cases of both dorsal andventral routes, respectively). These findings are consistentwith the neuroanatomy of the language circuitry documentedfrom Frieerici [35] and agree well with the proportion ofthe ventral routes that can be tracked with DTI [36], in which4 out of 11 subjects showed the ventral route.
To compare the performance of our algorithm with otherglobal fiber tracking, we tracked fibers on the same in vivodata sets with the “shortest paths” global tractography [13].This global tractography was selected because, in essence,all global tracking algorithms are finding some “shortestpaths” as the optimal solution. In this comparison, the ROIsfor both algorithms are the left Broca's area and the premotorregion. For our method, the parameter settings used were thesame as in the synthetic experiments, and for the “shortestpaths”method, the parameter settings were the same as in theliterature [13].
An example comparison is given in Fig. 6, which showsrandomly selected 30 trajectories of each bundle recon-structed using our method (6a) and using the “shortest paths”method (6b). As can be seen clearly, while the proposedmethod found both dorsal (red curves) and ventral routes(blue curves), the “shortest paths” method was only able to
Fig. 6. Fibers tracked between the Broca's area and the premotor regionusing the proposed technique (A) and the “shortest paths” globatractography (B).
l
reconstruct the dorsal one (red curves). This is due to the factthat the shortest paths method does not possess the func-tionality of fiber clustering, so that only one bundle couldbe found if there are large disparities in the cost functionbetween two bundles. By contrast, our method explicitlyclusters fibers to different bundles and then reconstructsoptimal fibers for each bundle hierarchically. This featureensures the capability of constructing all possible bundlesconnecting a given ROI pair. It should be noted that thedorsal routes reconstructed by both methods are grosslysimilar, which in fact serves as a mutual validation of thetwo methods.
3.3. Computational efficiency
Computational efficiency of the proposed algorithmdepends heavily on the number of fiber bundles to be recon-structed. For a single fiber bundle, it takes about 2 min tocomplete 30 iterations of tracking and bundling on anotebook computer with an Intel Core i7 CPU and 4 GBRAM.Actual computational time can be several times shortersince the algorithm often converges within first 10 iterations.
4. Discussion and conclusion
In this work, a novel DTI-based technique for fiber trac-tography — unified tracking and bundling — has beenproposed. Given a pair of ROIs, the fibers connecting themare clustered into anatomically distinct bundles on the basisof MH statistic, each of which further goes throughimportance sampling and random perturbation to reconstructthe globally optimal fibers using the Bayes decision rule.One of the most salient features of the technique is thereconstruction of anatomically consistent fiber bundles in asingle framework, which is certainly beneficial to clinicalapplications of DTI-based fiber tractography. The techniqueproposed has been examined and validated with a seriesof fiber tracking experiments on synthetic DTI data, whichhave been demonstrated to be effective in fiber trackingand bundling. Experiments with in vivo human brain DTIdata have also indicated that the fiber bundles reconstructedare consistent with neuroanatomy.
DTI-based fiber tracking as a new technique for non-invasive mapping of brain structural connectivity has beenthe research interest of many studies. To date, a wholevariety of fiber tracking algorithms have been proposed [37],the vast majority of which are streamline-based methods. Asrecognized by many investigators, deterministic streamlinetracking suffers from the problems of cumulative noise andlimited capability of handling complex fiber structures suchas fiber crossing, kissing or branching. While probabilisticstreamline methods were proposed later to address theseissues, they tend to have the problem of low efficiency anddifficulty in further interpretation of tracking results.Technically, instead of step-wise integration of local fiberdirections as with streamline methods, our method seeks
494 X. Wu et al. / Magnetic Resonance Imaging 30 (2012) 485–495
optimal solutions at the scale of entire fiber pathways con-necting a designated ROI pair. This brings the proposedtechnique a number of intrinsic advantages over streamline-based fiber tracking. First, as mentioned earlier, it obviouslyhas a great immunity to random image noise and otherlocal image artifacts. Second, the outcome of fiber trackingis independent of tracking directions. In contrast to thestreamline-based methods which may produce differentresults when launched from different ROIs, the directionindependency of the proposed technique allows a moreobjective and thus more reliable characterization of struc-tural connectivity between two regions. Third, the bundlingprocedure embedded in the unified framework greatlyfacilitates interpretation and further processing of fibertracking results.
More importantly, the hierarchical bundling procedureembedded in the proposed technique has a significantadvantage of reconstructing multiple connecting routesbetween a pair of ROIs. This is important to exploratorystudies since, very often, the number of connecting routes isnot known a priori. Reconstructing multiple fiber bundlesparticularly when both major and minor connecting routesexist is quite problematic for streamline-based methods andmany of the global optimization methods. Although pro-babilistic streamline methods may be able to track minorpathways, it certainly comes at the cost of computationalcomplexity — they typically require a substantially largernumber of trials, especially when the ROIs are distant to eachother, which lead to a drastic increase of the computationalburden. Meanwhile, in most globally optimized fibertracking, the state of optimum tends to have large disparitiesbetween different bundles and thus cannot be simultaneouslyachieved by using a single optimization procedure which istypically implemented. In contrast, by explicitly groupingfibers to distinct bundles, our technique reconstructs notonly major fiber bundles but also all possible fiber bundlesor even those significantly affected by pathology. Thiscapability renders the proposed technique to have a muchwider domain of applications. For instance, in many clinicalscenarios, alterations in fiber connectivity may take the formof impaired structural integrity or disruption of connectingroute [38,39]. Depending on the nature and severity of thesealterations, it may be difficult for the streamline-basedmethods to reconstruct the impaired fiber pathways success-fully. These alterations, however, do not hinder our methodfrom finding optimal fiber pathways since it is insensitive tothe local changes of fiber structures.
Finally, it should be pointed out that, in spite of the greatpotential, the proposed technique does not come withoutlimitations. Most notably, the technique needs an ROI pair asthe prior to generate optimal fiber pathways between them,but it provides no information about distribution patterns offibers emanating from any of the ROIs. The informationhowever is readily available from probabilistic fibertracking. This limits the proposed technique to applicationsin which both ROIs are predetermined. Second, since in
principle the technique proposed always yields some fiberpathways between a given ROI pair, the validity of thesepathways needs to be assessed statistically or in referencewith neuroanatomical knowledge prior to making inferencesabout the structural connectivity.
In summary, we have proposed a novel fiber trackingtechnique that integrates globally optimized fiber trackingand hierarchical fiber clustering. Given designated ROIs, theproposed technique generates globally optimal fiber path-ways in the form of distinct anatomical bundles. Notwith-standing the existence of some limitations, experiments withsynthetic and in vivo human DTI data have demonstratedthe effectiveness and advantages of the technique, thusoffering the potential of using it as a useful tool in clinicalstudies of DTI-based fiber connectivity.
Acknowledgments
This study was supported by National Institutes of Healthgrants R01NS058639 (A.W. Anderson) and S10RR023047(J.C. Gore) and by the Scientific Research Fund of SiChuanProvincial Education Department (09ZZ004, 10ZA130).
References
[1] Basser PJ, Matiello J, Le Bihan D. Estimation of the effective self-diffusion tensor from the NMR spin echo. J Magn Reson 1994;103:247–54.
[2] Mori S, Crain BJ, Chacko VP, van Zijl PCM. Three dimensionaltracking of axonal projections in the brain by magnetic resonanceimaging. Ann Neurol 1999;45:265–9.
[3] Basser PJ, Pajevic S, Pierpaoli C, Duda J, Aldroubi A. In vivo fibertractography using DT-MRI data. Magn Reson Med 2000;44:625–32.
[4] Poupon C, Clark CA, Frouin V, Regis J, Bloch I, Le Bihan D, et al.Regularization of diffusion-based direction maps for the tracking ofbrain white matter fascicles. NeuroImage 2000;12:184–95.
[5] Lazar M, Alexander AL. Bootstrap white matter tractography(BOOTTRAC). NeuroImage 2005;24:524–32.
[6] Friman O, Farneback G, Westin C. A Bayesian approach for stochasticwhite matter tractography. IEEE Trans Med Image 2006;25(8):965–78.
[7] Lu Y, Aldroubi A, Gore JC, Anderson AW, Ding Z. Improved fibertractography with Bayesion tensor regularization. NeuroImage 2006;31:1061–74.
[8] Behrens T, Berg HJ, Jbabdi S, Rushworth M, Woolrich M.Probabilistic diffusion tractography with multiple fibre orientations:what can we gain? NeuroImage 2007;34:144–55.
[9] Mishra A, Anderson AW, Wu X, Gore JC, Ding Z. An improvedBayesian tensor regularization and sampling algorithm to trackneuronal fiber pathways in the language circuit. Med Phys 2010;37(8):4274–87.
[10] Tuch DS, Wiegell MR, Reesel TG, Belliveau LW, Wedeen VJ.Measuring cortico-cortical connectivity matrices with diffusion spec-trum imaging. Proc Int Soc Mag Reson Med 2001:502 Glasgow,Scotland, UK.
[11] Jbabdi S, Woolrich MW, Andersson JL, Behrens TE. A Bayesianframework for global tractography. Neuroimage 2007;37:116–29.
[12] Iturria-Medina Y, Canales-Rodríguez EJ, Melie-García L, Valdés-Hernández PA, Martínez-Montes E, Alemán-Gómez Y, et al. Char-acterizing brain anatomical connections using diffusion weighted MRIand graph theory. Neuroimage 2007;36:645–60.

495X. Wu et al. / Magnetic Resonance Imaging 30 (2012) 485–495
[13] Zalesky A. DT-MRI fiber tracking: a shortest paths approach. IEEETrans Med Image 2008;27(10):1458–71.
[14] Reisert M, Mader I, Anastosoulus C, Weigel M, Schnell S, Kiselev V.Global fiber reconstruction becomes practical. Neuroimage 2011;54(2):955–62.
[15] Fillard P, Poupon C, Mangin J. A novel global tractography algorithmbased on an adaptive spin glass model. Lect Notes Comput Sci2009;5761:927–34.
[16] Sherbondy A, RoweMC, Alexander DC. MicroTrack: an algorithm forconcurrent projectome and microstructure estimation. Med ImageComput Comput Assist Interv. Lect Notes Comput Sci 2010;6361:189–90.
[17] Wakana H, Jiang LM, Nagae-Poetscher PC, van Zijl PCM, Mori S.Fiber tract-based atlas of human white matter anatomy. Radiology2004;230(1):77–87.
[18] Concha L, Gross DW, Beaulieu C. Diffusion tensor tractography of thelimbic system. AJNR Am J Neuroradiol 2005;26:2267–74.
[19] Ding Z, Gore JC, Anderson AW. Classification and quantification ofneuronal fiber pathways using diffusion tensor MRI. Magn Reson Med2003;49(4):716–21.
[20] Maddah M, Grimson WEL, Warfield SK, Wells WM. A unifiedframework for clustering and quantitative analysis of white matter fibertracts. Med Image Anal 2008;12(2):191–202.
[21] Ziyan U, Sabuncu MR, Grimson WE, Westin CF. Consistency clus-tering: a robust algorithm for group-wise registration, segmentationand automatic atlas construction in diffusion MRI. Int J Comput Vis2009;85(3):279–90.
[22] Park HJ, Kubicki M, Westin CF, Talos IF, Brun A, Peiper S, et al.Method for combining information from white matter fiber trackingand gray matter parcellation. AJNR Am J Neuroradiol 2004;25(8):1318–24.
[23] Xia Y, Turken U, Whitfield-Gabrieli SL, Gabrieli JD. Knowledge-based classification of neuronal fibers in entire brain. Med ImageComput Comput Assist Interv 2005:205–12.
[24] Xu Q, Anderson AW, Gore JC, Ding Z. Unified bundling and regis-tration of brain white matter fibers. IEEE Trans Med Imaging 2009;28(9):1399–411.
[25] Duda RO, Hart PE. Pattern classification and scene analysis.New York: John Wiley & Sons, Inc.; 1973.
[26] Geman S, Geman D. Stochastic relaxation, Gibbs distributions, and theBayesian restoration of images. IEEE Trans Pattern Anal MachineIntell 1984;6(6):721–41.
[27] Tuch DS. Q-ball imaging. Magn Reson Med 2004;52(6):1358–72.[28] Wedeen VJ, Hagmann P, Tseng WY, Reese TG, Weisskoff RM.
Mapping complex tissue architecture with diffusion spectrummagneticresonance imaging. Magn Reson Med 2005;54(6):1377–86.
[29] Tournier JD, Calamante F, Connelly A. Robust determination of thefibre orientation distribution in diffusion MRI: non-negativityconstrained super-resolved spherical deconvolution. Neuroimage2007;35(4):1459–72.
[30] Anderson AW. Measurement of fiber orientation distributions usinghigh angular resolution diffusion imaging. Magn Reson Med 2005;54(5):1194–206.
[31] Mahajan M, Nimbhorkar P, Varadarajan K. The planar k-meansproblem is NP-hard. Lect Notes Comput Sci 2009;5431:274–85.
[32] Dubes RC. How many clusters are best? An experiment. PatternRecogn 1987;20(6):645–63.
[33] Smith PJ, Shafi M, Gao H. Quick simulation: a review of impor-tance sampling techniques in communication systems. IEEE J SelectAreas Commun 1997;15:597–613.
[34] Morgan VL, Mishra A, Newton AT, Gore JC, Ding Z. Integratingfunctional and diffusion magnetic resonance imaging for analysis ofstructure-function relationship in the human language network.PlosOne 2009;4(8):e6660.
[35] Frieerici AD. Pathways to language: fiber tracts in the human brain.Trends Cogn Sci 2009;13(4):175–81.
[36] Parker GJ, Luzzi S, Alexander DC,Wheeler-Kingshott CA, Ciccarelli O,Lambon Ralph MA. Lateralization of ventral and dorsal auditory-language pathways in the human brain. Neuroimage 2005;24(3):656–66.
[37] Lazar M. Mapping brain anatomical connectivity using white mattertractography. NMR Biomed 2010;23:821–35.
[38] Roosendaal SD, Geurts JJ, Vrenken H, Hulst HE, Cover KS, CastelijnsJA, et al. Regional DTI differences in multiple sclerosis patients.NeuroImage 2009;44(4):1397–403.
[39] Caeyenberghs K, Leemans A, Geurts M, Taymans T, Linden CV,Smits-Engelsman BC, et al. Brain-behavior relationships in youngtraumatic brain injury patients: DTI metrics are highly correlated withpostural control. Hum Brain Mapp 2010;31(7):992–1002.