globalization policies and israel’s brain drain … · 2017-03-16 · globalization policies and...
TRANSCRIPT

NBER WORKING PAPER SERIES
GLOBALIZATION POLICIES AND ISRAELrsquoS BRAIN DRAIN
Assaf Razin
Working Paper 23251httpwwwnberorgpapersw23251
NATIONAL BUREAU OF ECONOMIC RESEARCH1050 Massachusetts Avenue
Cambridge MA 02138March 2017
The views expressed herein are those of the author and do not necessarily reflect the views of the National Bureau of Economic Research
NBER working papers are circulated for discussion and comment purposes They have not been peer-reviewed or been subject to the review by the NBER Board of Directors that accompanies official NBER publications
copy 2017 by Assaf Razin All rights reserved Short sections of text not to exceed two paragraphs may be quoted without explicit permission provided that full credit including copy notice is given to the source
Globalization Policies and Israelrsquos Brain DrainAssaf RazinNBER Working Paper No 23251March 2017JEL No F22H1J11
ABSTRACT
The paper links Israelrsquos brain drain to skill-based immigration policies prevailing in the advanced economies
Assaf RazinEitan Berglas School of EconomicsTel Aviv UniversityTel Aviv 69978ISRAELand Cornell University and CEPRand also NBERar256cornelledu
Globalization Policies and Israelrsquos Brain Drain
by
Assaf Razin
March 2017
Abstract
The paper links Israelrsquos brain drain to skill-based immigration policies prevailing in the
advanced economies
Economic basic principles imply that both low-skill and high-skill immigration enrich the
workforce thereby allow for a more finely graded specialization that raises average productivity
and living standards Diverse workforces are likely to be more productive especially in
industries where success depends on specific knowledge such as computing health care and
finance By easing labor bottlenecks migrants help to keep down prices of goods and services
However in the confines of the generous welfare state low skill immigrants impose fiscal
burden on the native born In contrast high-skill immigrants help in relieving the burden This is
the economic rationale behind skill-based immigration policies The other side of the skill bias in
immigration policy is that the international migration of skilled workers (the so-called brain
drain) deprives the origin country from its scarce resourcemdashhuman capital In setting up a
migration policy one is certainly concerned by the skill composition of immigrants is a crucial
factor Naturally highly- skilled immigrants are more attractive to the destination countries than
low-skilled immigrants for a variety of reasons are For instance highly- skilled immigrants are
expected to pay more in taxes to the Fisc in excess of what the Fisc provides them with In
addition these immigrants are also expected to boost the technological edge of their destination
countries In contrast low-skilled immigrants tend to depress the low-skill wages of the native-
born and they are deemed to impose a burden on the fiscal system
The skill composition of immigrants to OECD countries other than the US Australia Canada
and Ireland is skewed towards the low education group thanks to the less rigorous screening of
immigration policies Australia Canada and US high-skill biased policy is shown in Table 11
1 Razin and Sadka (2014) argue that the differences between the US and the EU relate to the
degree of fiscal and migration coordination among the member states of the economic unions (
EU vs US) and the difference in the aging of the population between them
Table 1 Skill composition of immigration
Country of
Immigration
Low Education as
of total
Immigration
in 20001
High Education as
of total
Immigration in
20001
Austria 475 127
Belgium 657 183
Denmark 448 173
Finland 487 238
France 746 164
Germany 659 218
Greece 445 15
Ireland 136 411
Italy 529 154
Netherlands 502 22
Norway 22 287
Portugal 597 186
Spain 287 185
Sweden 341 257
Switzerland 549 186
UK 341 349
Average
EUROPE 4637 218
Australia 353 403
Canada 296 588
USA 379 427
Average AUS
CAN amp US 3427 4727
Sources Docquier and Marfouk (2006)
As Table 1 indicates US attracts more high skill immigrants than Europe One key factors is
US research centers US universities and research centers funded directly and indirectly by the
US federal and state governments attract talented researchers from all over the world Many
2 Universities and colleges are the other important gatekeepers through their selection of
The paper is organized as follows Section 1 provides some theoretical underpinnings of high-
skill based immigration policy Section 2 apply the model to analyze empirically key
determinants of the skill composition of immigration to the advanced economies Section 3
describes brain drain in selected group of countries Section 4 concludes with the discussion of
Israelrsquos top-talent drain
1 Understanding the Essence of Skill-Based Immigration Policy
How does the size of the welfare state affect the skill composition of immigration A more
generous welfare state is more attractive to low-skilled immigrants known as the magnet effect
(Borjas 1999) This is a supply-side explanation for the different composition of immigrants in
the US and Europe Europe with its generous welfare states is an attractive destination for low-
skilled immigrants but far less so for high-skilled immigrants who are likely to be net fiscal
contributors Indeed the demand for immigrants however goes in the opposite direction A
more generous welfare state (particularly with an aging population) has financing needs that
individuals for the F1 (student) or J1 (exchange visitor) visas (see Kerr et al (2016)) While these
visas do not offer long-term employment US firms often recruit graduates of US schools using
visas like the H-1B An advantage of employment-based immigration- policy regime compared
to a points-based approach is that the job-market search process is more efficient in the former
case The employer-employee match is guaranteed to connect the immigrant talent with a
productive and adequate job
immigrants could fill With high-skilled immigrants more likely to pay in rather than draw on the
welfare state more generous welfare states are more inclined to try to attract high skilled3
To highlight skill-migration demand side forces I present a minimalist model that features two
migration regimes free-migration and policy-controlled migration regimes In summary the
policy-controlled migration regime leads to a positive effect of the welfare benefits on the skill
composition of migration rates because voters will internalize the fact that skilled migrants will
be net contributors to the system (ie the fiscal burden effect) whereas unskilled migrants will
be net beneficiaries (ie the social magnet effect) Under the free-migration regime unskilled
migrants will gravitate to a generous welfare state while skilled migrants will be deterred
I assume a CobbndashDouglas production function with two labor inputs skilled and
unskilled
(1)
Here Y is the GDP A denotes a Hicks-neutral productivity parameter and denotes the input of
labor of skill level i where e u for skilled and unskilled respectively Wages are
competitive and equal to the marginal productivity of
Aggregate labor supply for skilled and unskilled workers respectively is given by
3 Why have European countries been unsuccessful in either encouraging high-skill immigration
or in limiting the size of their welfare state Razin and Sadka (2014) take a page out of the vast
work on tax competition to provide insights They argue that fiscal independence in a migration
union like Schengen leads to policy distortions Schengen members do not fully internalize the
degree to which their generous welfare states attract immigrants as the costs of immigration are
borne by the union as a whole This the need for fiscal unity in a common immigration zone is
novel See Ilzetzki (2016)
(2)
(3)
Here denotes the individual labor supply e denotes the share of native-born skilled workers in
the total native-born labor supply σ denotes the share of skilled migrants in the total number of
migrants μ denotes the total number of migrants and is the labor supply of an individual with
skill level i The total population (N) is comprised of native-born workers (which is normalized
to 1) and migrants (μ)
We specify a simple welfare-state system which levies a proportional labor income tax at the
rate τ with the revenues redistributed equally to all residents N as social benefit per capita b
The social benefit captures not only a cash transfer but also outlays on public services such as
education health and other provisions which benefit all workers regardless of their
contribution to the tax revenues
The government budget constraint is therefore
(4)
Assume that the utility function for skill type i is
(5)
Where denotes consumption of an individual with skill level i denotes the individual labor
supply and The budget constraint of an individual with skill level i is
(6)
Individual utility-maximization yields the following labor supply equation
(7)
The general equilibrium wages for skilled and unskilled workers are
(8)
(9)
Where
and
The host-country migration policy is to be determined by the median voter in the host country
Let us assume that the policy decisions on the tax rate τ and the total volume of migration μ are
exogenous We do this in order to focus the analysis on a single endogenous policy variable
which is the skill composition of migrants (ie σ) Note that once σ μ and τ are determined
then the social benefit per capita b is given by the government budget constraint Thus we
denote the social benefit per capita b as where the exogenous variable μ is suppressed
The indirect utility of an individual with skill level i is given by
(10)
Differentiating the equation with respect to σ and employing the envelope theorem yields
(11)
Thus a policy-induced change in the share of skilled migrants in the total number of migrants σ
affects the utility level through two channels First an increase in σ raises average labor
productivity and thereby tax revenues This in turn raises the social benefit per capita b
Second an increase in σ which raises the supply of skilled labor relative to the supply of
unskilled labor depresses the skill premium in the labor market If the decisive voter is unskilled
both of the above effects increase his utility Thus an unskilled voter would like to set the skill
composition of migrants at the maximal limit This means that the share of skilled
migrants preferred by the decisive skilled voter is typically lower than that preferred by the
decisive unskilled voter The decisive skilled voter would like to set σ below 1 (which is
equivalent to assuming that the first-order condition is met before σ reaches 1)
Let superscript i denote the choice of the skill mix of immigrants by a decisive voter i i = u e
Define as the share of skilled immigrants most preferred by an individual with skill level
in the host country we obtain
Recall that the purpose is to find the effect of the change in the generosity of the welfare state on
the migration policy concerning σ The generosity of the welfare state captured by the
magnitude of the social benefit per capita b depends positively on the tax rate τ (we assume
that the economy is on the ldquocorrect siderdquo of the Laffer curve) Thus we examine the effect of an
increase in τ on the change in the skill composition of the migrants σ It can be shown that
(12)
0 dA
dsign
dA
d eu
This means that if the decisive voter were an unskilled worker an increase in the tax rate τ
would leave the skill migration policy unchanged because it is always set at the maximum
possible limit However if the decisive voter is a skilled worker an increase in the tax rate τ will
change the policy concerning the skill composition of migrants in the direction towards a larger
share of skilled migrants The reason for this is that when the tax rate is higher the redistribution
burden upon a skilled decisive voter increases Allowing an additional skilled migrant can ease
this rise in the fiscal burden Note also that the result applies to the skill mix of migration rates
Under skill native-born control the effect of domestic productivity increase on the skill mix of
immigration is to improve the mix ( dA
dsign
e) On one hand the increase in the wage
premium also raises tax revenues and eases the fiscal burden This force makes unskilled
migrants less burdensome to the Fisc At the same time the increase in productivity also raises
the efficiency gains and mitigate the of the skill-labor wage which makes the influx of skilled
migrants desirable
2 Skill Composition of Immigration Empirical Analysis
While immigration from poor countries often invokes images of large masses of unskilled
laborers in reality it has been quite skill-intensive The composition of immigrants into high-
income countries even if they originate from countries with lower income per person tends to
be more concentrated among highly educated than among less educated relative to the
population of the country of destination (see Peri (2016))
The explanation for the concentration of rich-country immigrants among the highly educated is
the screening and selection migration policies by the destination countries
In this context Razin and Wahba (2015) researched two hypotheses associated with migration
skill mix The fiscal burden hypothesis and the magnet hypothesis The former asserts that under
host-country migration policy the rise in the generosity of the welfare state will skew the skill
mix towards skilled migrants because they can ease fiscal burden The second hypothesis asserts
that under free migration would be low skilled migrants will be more attracted to the welfare
state so that a more generous welfare state will have its skill mix skewed towards the low skilled
migrants Accordingly they investigate the effect of welfare state generosity on the difference
between skilled and unskilled migration rates and the role of mobility restriction in shaping this
effect They utilize the free labor movement within the European Union plus Norway and
Switzerland (EUROPE) and the restricted movement from outside the EUROPE in order to
compare the free-migration regime to the controlled-migration regime Using bilateral migration
movements and splitting the sample among flows within EUROPE and flows from outside
EUROPE they identify the migration regime effect In Table 2 the dependent variable is the
share of skilled migrants in the migrant population and the main explanatory variable is
benefits per capita ndasha measure of the generosity of the welfare state The hypothesis is that
under free migration the coefficient of this variable is negative whereas under controlled
migration coefficient of benefits per capita multiplied by R is positive The indicator X is a
dummy variable R=1 if migration is controlled whereas R=0 if migration is free Recall the bi
lateral migration flows within EUROPE are referred to as free migration whereas bi lateral
migration flows where the SOURCE is outside and the DESTINATION is inside EUROPE are
referred to as controlled migration Appendix 10A includes some robustness tests of the model
Table 2 Skill Composition of Immigration OLS Estimates
Dependent Variable Skill Difference in Migration Rates in 2000
Welfare generosity
EUR amp DC
to EUR
EUR amp LDC
to EUR
benefits per capita (logs) -0110 -0112 -0116 -0115 -0136 -0131
1974-90 (host) (0057) (0056) (0047) (0056) (0053) (0047)
benefits per capita (logs) 0113 0137 0132 0102 0101 0110
1974-90 (host) X R (0053) (0064) (0055) (0065) (0079) (0066)
Lagged migration
rates
low-skilled migration
rate -0719 -0719 -0710 -0612 -0611 -0609
1990 (0133) (0129) (0140) (0128) (0129) (0137)
low-skilled migration
rate 1723 1751 1723 0278 0560 0552
1990 x R (0173) (0169) (0171) (0196) (0234) (0226)
high-skilled migration
rate 1062 1061 1049 0963 0959 0957
1990 (0150) (0147) (0155) (0145) (0146) (0153)
high-skilled migration
rate -0725 -0726 -0712 -0481 -0627 -0623
1990 x R (0149) (0144) (0151) (0157) (0170) (0173)
Returns to skills
high-low labor ratio in -0484 0309
1990 - (host) (0237) (0326)
high-low labor ratio in 0309 0019
1990 (host) X F (0500) (0656)
high-low wage diff in 0003 0001
1995 (host) (0002) (0003)
high-low wage diff in -0007 -0005
1995 - (host) X F (0003) (0003)
Gini in 1990 (source) 0012 0013 0011 0011
(0004) (0004) (0004) (0005)
Gini in 1990 (source)
X R -0012 -0014 -0010 -0010
(0005) (0005) (0005) (0005)
High-low unemp rate
diff
0002 0001 0003 0006
in 1990 (host) (0002) (0002) (0002) (0002)
High-low unemp rate
diff -0002 -0004 -0005 -0008
in 1990 - (host) X F (0004) (0004) (0005) (0005)
Immigration policies
Total migrant stock -0001 -0001 -0001 -0002 -0002 -0002
in 1990 (0001) (0001) (0001) (0001) (0001) (0001)
Share of refugees in
1990 -2079 -1023 -3904 -0238 -1945 -1297
(2803) (3237) (3403) (2145) (2477) (3007)
Observations 384 384 360 601 570 534
R-squared 0864 0870 0874 0832 0809 0814
Notes F=Free migration R=Restricted migration Regressions include log distance dummy
for same language in host and source strong dummy between host and source amp real GDP per
capita in host and in source countries Robust standard errors in parentheses significant at
10 significant at 5 significant at 1
In the regression analysis (see also the Appendix) Razin and Wahba (2015) control for
differences in educational quality and returns to skills in source and host countries and for
endogeneity bias (by using instrumental variables) Overall the fiscal burden and the magnet
hypotheses tested with the coefficient of social benefit in the regressions are statistically
significant4 Therefore regression findings yield support for the magnet hypothesis under the
free-migration regime and to the fiscal burden hypothesis under the restricted-migration regime
4 See Appendix A for robustness tests
3 Brain Drain international comparison
Kerr et al (2016) observe that the number of migrants with a tertiary degree rose by nearly 130
percent from 1990 to 2010 while low-skill (primary educated) migrants increased by only 40
percent during that time High-skilled migrants are departing from a broader range of countries
and heading to a narrower range of countriesmdashin particular to the United States the United
Kingdom Canada and Australia5 At the policy level they compare the points-based skilled
migration regimes as historically implemented by Canada and Australia with the employment-
based policies used in the United States through visa-control mechanisms like the H-1B visa
program Because of the links of global migration flows to employment and higher education
opportunities firms and universities also act as important conduits making employment and
admission decisions that deeply affect the patterns of high-skilled mobility
Gould and Moav (2007) focus on 28 countries which represent the largest exporters of
immigrants to the United States The sample includes mostly advanced economies Table 2
shows that the average index of emigration (ie the number of emigres per 10000 residents) is
3336 with the index for Israel being nearly three times as high 9551 Only two countries have
a higher indexndashndashIreland (1439) and Portugal (9921) When examining the index for educated
eacutemigreacutes ie those with a college degree the average index is 1241 and Israels index is more
than three times higher 4145 Using this index Israel is now higher than Portugal and the gap
between Israel and Ireland (4909) narrows considerably (See Table 82)
5 Kerr et al (2015) give suggestive examples showing how global migration may be most pronounced for those at the
very outer tail of the talent distribution
Table 3 presents international indicators selective indicators of Emigration to the US by
Education Attainment Israel is ranked at the very top for college graduate emigres per 10000
residents to the US with number of about 41 only Ireland with a number 49 is ranked above
Israel South Korea suffering also from brain drain has only about 25 college graduate emigres
per 10000 of its residents
Table 3 Indicators of Emigration to the US by Education Attainment
College
graduate
emigres
per
10000
residents
Emigres
for
10000
residents
Population of
country of
origin
Number
of college
graduates
Percentage
college
graduates
Number
of 30-50
years
old
emigres
Country of
origin
99 9991 693631 69 10275 Denmark
393 9931 696199 1613 8170 Finland
91 991 693961 1619 9030 Norway
91931 999 363611 631 9691 Sweden
999 991 63611 93611 1 9161 Great Britain
191 91991 9633969 9619 91 63 Ireland
99 9999 91616 69 9 96191 Belgium
913 9199 6639 1699 1 3699 France
9199 999 96161 969 1 916993 Netherlands
91999 99 691961 916911 1 96 Switzerland
9399 99 91616919 969 163 Greece
93 99 696 969 9163 Italy
9 99 91613161 611 91 9116111 Portugal
191 9999 11616911 93611 9 161 Spain
391 999 3696 63 19 969 Austria
391 991 91661 3691 19 961 Czechoslovakia
9919 99 3969639 916991 91 1693 Germany
99 199 91616191 6 9 1613 Hungary
999 19 936613 163 969 Poland
99 991 699691 163 19 1361 Romania
933 939 9116369 91961 9 9691 USSRRussia
991 9 9631691961 93611 1619 China
393 99 96163 913639 13 6131 Japan
191 999 161369 99693 1 933639 South Korea
999 9 691611 963 9 699 Thailand
1999 993 96116316 19619 6191 India
1991 99 616 161 19 63 IsraelPalestine
9 93 691363 961 1 961 Turkey
England Scotland and Wales
Source Gould and Moav (2007)
4 Israelrsquos Brain Drain
US serves as a magnet for top scientific immigrants US immigrants hold a disproportionate
share of jobs in science technology engineering and math (STEM) occupations in the United
States (see Hanson and Slaughter (2016)) Top talent drain from Israel is disproportionately high
among the high-end immigrants
In general the ratio of foreign scholars in America to scholars in the home country ranged from
13 in Spain to 43 in the Netherlands (Figure 1) At 122 Canada was an outlier though
this is much more of a two-way street than in any of the other cases While Canada is an outlier
Israeli scholars in America are in a class by themselves The Israeli academics residing in the
States in 2003-2004 represented 249 of the entire senior staff in Israelrsquos academic institutions
that year ndash twice the Canadian ratio and over five times the ratio in the other developed
countries
Figure 1 describes the percentage of home country academic scholars who have academic
position in US universities Figure 2 similarly describes Israel scholars in percentage of Israel
Universitiesrsquo senior faculty) in in the top US universities
Figure 1 Foreign Scholars in US Universities as percent of academic scholars in home country
2003-2004
Source Ben-David Dan (2008)
Israel supply of high skill workers is unique Today Israel ranks third in the world in the number
of university graduates per capita after the United States and the Netherlands It possesses the
highest per capita number of scientists in the world with 135 for every 10000 citizens
(compared to 85 per 10000 in the United States) and publishes the highest number of scientific
papers per capita However brain drain in academia is exceptionally high Ban David (2008)
demonstrates how differences between universities are inducing a massive academic migration
from Israel to the United States The magnitude of this scholarly brain drain is unparalleled in the
western world (See Figures 1 and 2) European Commission (2003) reported that 73 of the
15000 Europeans who studied for their PhD in the States between 1991 and 2000 plan to remain
13 18 19 21 22 29 29
42 43
122
249
in America If Europeans are concerned about the migration of their academics to the States then
Israelis should be nothing less than alarmed
Figure 2 Israelis in Top American Departments 2007 as percent senior faculty in Israel by field
Source Ban David (2007)
Figure 2 demonstrate that Israel stands out internationally in terms of the size and quality of the
brain drain
4 Conclusion
Even though the overall education attainment level of Israel (native born) labor force is highly
ranked currently schooling gaps develop Israel currently has below average school gap among
advanced economies A test score of 4686 compared to the group average 4939 See Table 91
96 120
146
287
328
Physics Chemistry Philosophy Economics Computer Science
Table 4 Test Scores
EUR DC LDC
Country EQ Country EQ Country EQ
Austria 5089 Australia 5094 Argentina 3920
Belgium 5041 Canada 5038 Brazil 3638
Switzerland 5142 Hong Kong 5195 Chile 4049
Denmark 4962 Israel 4686 China 4939
Spain 4829 Japan 5310 Colombia 4152
Finland 5126 Korea Rep 5338 Egypt 4030
France 5040 New Zealand 4978 Indonesia 3880
United
Kingdom 4950 Singapore 5330 India 4281
Germany 4956 Taiwan (Chinese
Taipei) 5452 Iran 4219
Greece 4608 United States 4903 Jordan 4264
Ireland 4995 Lebanon 3950
Italy 4758 Morocco 3327
Netherlands 5115 Mexico 3998
Norway 4830 Malaysia 4838
Portugal 4564 Nigeria 4154
Sweden 5013 Peru 3125
Philippines 3647
Thailand 4565
Tunisia 3795
Turkey 4128
South Africa 3089
Group
Averages 4939 5132 3999
Notes EQ = average test score in mathematics and science primary through end of secondary school all
years (scaled to PISA scale divided by 100)
Source OECD Library
Notwithstanding Israelrsquos current technological and scientific prowess top-talent drain has been
trending upward
Appendix A Immigrant Skill Composition Robustness Tests
Razin and Wahba (2015) utilize the free labor movement within the European Union plus
Norway and Switzerland (EUROPE) and the restricted movement from outside the EUROPE in
order to compare the free-migration regime to the controlled-migration regime Using bilateral
migration movements and splitting the sample among flows within EUROPE and flows from
outside EUROPE they identify in Table 1 the migration regime effect Robustness tests are
shown in Tables A2-A4 The dependent variable is the share of skilled migrants in the migrant
population and the main explanatory variable is benefits per capita ndasha measure of the
generosity of the welfare state The hypothesis is that under free migration the coefficient of this
variable is negative whereas under controlled migration coefficient of benefits per capita
multiplied by R is positive The indicator X is a dummy variable R=1 if migration is
controlled whereas R=0 if migration is free Recall the bi lateral migration flows within
EUROPE are referred to as free migration whereas bilateral migration flows where the
SOURCE is outside and the DESTINATION is inside EUROPE are referred to as controlled
migration
Table A2 OLS Estimates Using Migration Rates Adjusted by Relative Educational Quality
Dependent Variable Skill Difference in Migration (REQ) Rates in 2000
EUR amp DC
to EUR
EUR amp LDC
to EUR
Welfare generosity
benefits per capita -0105 -0115 -0109 -0111 -0116 -0138
(logs) 1974-90
(host)
(0052) (0049)
(0042)
(0051)
(0054)
(0054)
benefits per capita
(logs)
0115 0139 0135 0104 0111 0132
1974-90 (host) X R
(0053) (0062)
(0054)
(0059) (0070) (0062)
Lagged migration
rates
low-skilled
migration
-0697 -0695 -0686 -0681 -0595 -0578
rate (REQ) 1990
(0151)
(0149)
(0160)
(0156)
(0143)
(0150)
low-skilled
migration
1711 1738 1713 0715 0576 0314
rate (REQ) 1990 x R
(0175)
(0172)
(0174)
(0295)
(0217)
(0208)
high-skilled
migration
1037 1033 1022 1011 0937 0920
rate (REQ) 1990
(0169)
(0168)
(0176)
(0175)
(0162)
(0167)
high-skilled
migration
-0702 -0702 -0688 -0584 -0637 -0468
rate (REQ) 1990 x R (0167) (0164) (0171) (0194) (0175) (0178)
Returns to skills
high-low labor ratio
in
-0482 0205
1990 - (host)
(0234)
(0302)
high-low labor ratio
in
0325 0043
1990 (host) X R (0482) (0571)
high-low wage diff
in
0002 0003
1995 - (host) (0002) (0003)
high-low wage diff
in
-0007 -0006
1995 (host) X R
(0003)
(0003)
Gini in 1990
(source)
0013 0014 0011 0013
(0004)
(0004)
(0004)
(0005)
Gini in 1990
(source)
-0013 -0014 -0011 -0011
X R (0005)
(0005)
(0005)
(0005)
High-low unemp
rate
0001 0001 0006
diff in 1990 - (host) (0002) (0002) (0004)
High-low unemp
rate
-0004 -0005 -0009
diff in 1990 (host)
X R
(0004) (0004) (0005)
Immigration
policies
Total migrant stock -0001 -0001 -0001 -0001 -0002 -0002
in 1990 (0001) (0001) (0001) (0001) (0001)
(0001)
Share of refugees in -1907 -1168 -3680 -0672 -2954 -1497
1990 (2547) (3230) (3298) (1983) (2509) (3081)
Observations 384 384 360 569 569 533
R-squared 0861 0867 0871 0842 0816 0835
Notes All the migration rates are adjusted for the quality of education by the relative education
quality in source to host country ie REQ = (EQsEQh ) F=Free migration R=Restricted
migration Regressions include log distance dummy for same language in host and source
strong dummy between host and source and real GDP per capita in host and in source countries
Robust standard errors in parentheses significant at 10 significant at 5 significant
at 1
Table 8A3 IV Estimates with Lagged Dependent Variable
Dependent Variable Skill Difference in Migration Rates in 2000
EUR amp DC
to EUR
EUR amp LDC
to EUR
Welfare
generosity
Fitted
benefits per
capita
-0157 -0217 -0118 -0181 -0180 -0154
(logs) 1974-
90 (host)
(0081) (0097) (0063) (0080) (0089) (0070)
Fitted
benefits per
capita
0270 0261 0207 0198 0209 0161
(logs) 1974-
90 (host) X
R
(0089) (0099) (0078) (0088) (0103) (0083)
Lagged
migration
rates
low-skilled
migration
-0711 -0711 -0706 -0592 -0581 -0581
rate 1990 (0130) (0125) (0135) (0131) (0131) (0137)
low-skilled
migration
1774 1775 1752 0563 0556 0562
rate 1990 x
R
(0171) (0166) (0169) (0229) (0229) (0221)
high-skilled
migration
1055 1052 1046 0944 0931 0933
rate 1990 (0147) (0142) (0150) (0148) (0148) (0152)
high-skilled
migration
-0726 -0722 -0713 -0627 -0611 -0618
rate 1990 x
R
(0147) (0141) (0148) (0166) (0168) (0168)
Returns to
skills
high-low
labor ratio in
-1455 0060
1990 - (host) (0541) (0458)
high-low
labor ratio in
0794 0522
1990 (host )
X F
(0548) (0690)
high-low
wage diff in
0003 0003
1995 (host) (0002) (0003)
high-low
wage diff in
-0008 -0006
1995 - (host)
X F
(0003) (0003)
Gini in 1990
(source)
0012 0012 0011 0011
(0004) (0004) (0004) (0004)
Gini in 1990
(source) X R
-0013 -0015 -0010 -0010
(0005) (0005) (0005) (0005)
High-low
unemp rate
0011 -0000 0005 0005
diff 1990
(host)
(0005) (0002) (0003) (0004)
High-low
unemp rate
-0005 -0005 -0008 -0008
diff 1990 -
(host) X F
(0005) (0004) (0006) (0005)
Immigration
policies
Total
migrant
stock
-0001 -0001 -0001 -0002 -0003 -0003
in 1990 (0001) (0001) (0001) (0001) (0001) (0001)
Share of
refugees in
1990
-2470 0827 -4835 -1590 -2990 -2261
(3174) (3803) (3670) (2603) (2827) (3266)
Cragg-
Donald F-
statistics
4946
5434
10301
8623
9844
15912
Observations 384 384 360 538 538 504
R-squared 0865 0871 0875 0811 0815 0821
Notes F=Free migration R=Restricted migration Instrumented using legal origin dummies and
the interaction of legal origin dummies and R Regressions include real GDP per capita growth
rate in host log distance dummy for same language in host and source strong dummy between
host and source and real GDP per capita in host and in source countries
Robust standard errors in parentheses significant at 10 significant at 5 significant
at 1
Table A4 IV Estimates with Lagged Dependent Variable and Adjusted by Relative
Educational Quality (REQ)
Dependent Variable Skill Difference in Migration Rates (REQ) in 2000
EUR amp DC
to EUR
EUR amp LDC
to EUR
Welfare generosity
Fitted benefits per
capita
-0159 -0207 -0170 -0175 -0179 -0178
(logs) 1974-90 (host)
(0075)
(0087)
(0070)
(0076)
(0079)
(0064)
Fitted benefits per
capita
0269 0268 0207 0207 0218 0194
(logs) 1974-90 (host) X
R
(0089)
(0098)
(0077)
(0083)
(0102)
(0080)
Lagged migration
rates
low-skilled migration -0686 -0685 -0678 -0602 -0665 -0666
rate (REQ) 1990
(0148)
(0145)
(0155)
(0144)
(0154)
(0164)
low-skilled migration 1753 1765 1732 0553 0694 0686
rate (REQ) 1990 x R
(0172)
(0170)
(0174)
(0212)
(0290)
(0292)
high-skilled migration 1026 1022 1014 0941 0991 0989
rate (REQ) 1990
(0166)
(0163)
(0171)
(0163)
(0173)
(0180)
high-skilled migration -0698 -0693 -0684 -0632 -0566 -0564
rate (REQ) 1990 x R
(0164)
(0162)
(0168)
(0173)
(0193)
(0198)
Returns to skills
high-low labor ratio in -1192 0075
1990 - (host)
(0358)
(0386)
high-low labor ratio in 0833 0027
1990 (host) X R (0534) (0574)
high-low wage diff in 0004 0003
1995 (host) (0002) (0002)
high-low wage diff in -0007 -0007
1995 - (host) X R
(0003)
(0005)
Gini in 1990 (source) 0012 0013 0012 0013
(0004)
(0004)
(0004)
(0005)
Gini in 1990 (source) X
R
-0013 -0015 -0012 -0012
(0005)
(0005)
(0004)
(0004)
High-low unemp rate
diff
0008 0002 0003 0006
in 1990 (host)
(0003)
(0003) (0003) (0004)
High-low unemp rate
diff
-0005 -0005 -0008 -0012
in 1990 - (host) X R
(0005) (0004) (0005) (0004)
Immigration policies
Total migrant stock in
1990
-0001 -0001 -0001 -0002 -0001 -0001
(0001) (0001) (0001) (0001) (0001) (0001)
Share of refugees in
1990
-2592 0106 -2809 -1768 -1694 -1315
(3245) (3535) (3548) (2476) (2571) (2919)
Cragg-Donald F-
statistics
5169
5898
6265
8645
9277
16949
Observations 384 384 360 538 569 533
R-squared 0863 0867 0871 0805 0830 0835
Notes All the migration rates are adjusted for the quality of education by relative quality in
source to host ie REQ = (EQsEQh) F=Free migration R=Restricted migration Instrumented
using legal origin dummies and the interaction of legal origin dummies and R Regressions
include real GDP per capita growth rate in host log distance dummy for same language in host
and source strong dummy between host and source and real GDP per capita in host and in
source countries Robust standard errors in parentheses significant at 10 significant at
5 significant at 1
Table A2-A4 describe the skill mix-benefit correlations under various econometric
specifications Overall the fiscal burden and the magnet hypotheses tested with the coefficient
of social benefit in the regressions are statistically significant Therefore regression findings
yield support for the magnet hypothesis under the free-migration regime and to the fiscal burden
hypothesis under the restricted-migration regime In the regression analysis Razin and Wahba
(2015) control for differences in educational quality and returns to skills in source and host
countries and for endogeneity bias (by using instrumental variables)
References
Ben-David Dan (2007) ldquoSoaring Minds The Flight of Israelrsquos Economistsrdquo CEPR Discussion
Paper No 6338
Ben-David Dan (2008) ldquoBrain Drained Soaring Mindsrdquo CEPR VOX(March)
httpvoxeuorgarticleacademic-exodus
Ben-David Dan (2008) ldquoBrain Drained A Tale of Two Countriesrdquo CEPR Discussion Paper
No 6717
Docquier F O Lohest and A Marfouk (2005) ldquoBrain drain in developing countriesrdquo
Deacutepartement des Sciences Eacuteconomiques de lUniversiteacute catholique de Louvain Discussion Paper
2007-4 httpwwwabdeslammarfoukcomuploads163416347570bddcpdf
European Commission (2003) ldquoThe Brain Drain to the US Challenges and Answersrdquo
Gould Eric and Omer Moav (2007) ldquoIsraels Brain Drainrdquo Israel Economic Review Vol 5 No
1 pp 1-22 2007
Hanson Gordon H And Matthew J Slaughter (2016) ldquoHigh-Skilled Immigration and the Rise
of STEM Occupations in US Employmentrdquo NBER Working Paper No 22623
Kerr Sari Pekkala William Kerr Ccedilaglar Oumlzden and Christopher Parsons (2016) ldquoGlobal Talent
Flowsrdquo Journal of Economic Perspectives Volume 30 Number 4Fall 2016 Pages 3ndash30
httpkrugmanblogsnytimescom
Messina Anthony M (2007) The logics and politics of post-WWII migration to Western
Europe Cambridge Cambridge University Press
Peri Giovanni (2005) ldquoDeterminants of Knowledge Flows and Their Effect on Innovationrdquo
Review of economics and Statistics May 2005 Vol 87 No 2 Pages 308-322
Peri Giovanni (2016) ldquoImmigrants Productivity and Labor Marketsrdquo Journal of Economic
Perspectives Volume 30 Number 4 Fall 2016 Pages 3ndash30
Peri Giovanni Kevin Y Shih and Chad Sparber (2014) ldquoForeign STEM Workers and Native
Wages and Employment in US Citiesrdquo NBER Working Paper No 20093
Razin Assaf and Efraim Sadka (2014) Migration States and Welfare States Why Is America
Different from Europe Palgrave Pivot Series Palgrave macmillan
Razin Assaf Efraim Sadka and Phillip Swagel (2002) ldquoTax Burden and Migration A Political
Economy Theory and Evidencerdquo Journal of Public Economics 76 (September)
Razin Assaf and Jackline Wahba (2015) Vol ldquoWelfare Magnet Hypothesis Fiscal Burden and
Immigration Skill Selectivityrdquo Scandinavian Journal of Economics Volume 117 Issue 2 April
Pages 369ndash402

High-low unemp rate
diff
0002 0001 0003 0006
in 1990 (host) (0002) (0002) (0002) (0002)
High-low unemp rate
diff -0002 -0004 -0005 -0008
in 1990 - (host) X F (0004) (0004) (0005) (0005)
Immigration policies
Total migrant stock -0001 -0001 -0001 -0002 -0002 -0002
in 1990 (0001) (0001) (0001) (0001) (0001) (0001)
Share of refugees in
1990 -2079 -1023 -3904 -0238 -1945 -1297
(2803) (3237) (3403) (2145) (2477) (3007)
Observations 384 384 360 601 570 534
R-squared 0864 0870 0874 0832 0809 0814
Notes F=Free migration R=Restricted migration Regressions include log distance dummy
for same language in host and source strong dummy between host and source amp real GDP per
capita in host and in source countries Robust standard errors in parentheses significant at
10 significant at 5 significant at 1
In the regression analysis (see also the Appendix) Razin and Wahba (2015) control for
differences in educational quality and returns to skills in source and host countries and for
endogeneity bias (by using instrumental variables) Overall the fiscal burden and the magnet
hypotheses tested with the coefficient of social benefit in the regressions are statistically
significant4 Therefore regression findings yield support for the magnet hypothesis under the
free-migration regime and to the fiscal burden hypothesis under the restricted-migration regime
4 See Appendix A for robustness tests
3 Brain Drain international comparison
Kerr et al (2016) observe that the number of migrants with a tertiary degree rose by nearly 130
percent from 1990 to 2010 while low-skill (primary educated) migrants increased by only 40
percent during that time High-skilled migrants are departing from a broader range of countries
and heading to a narrower range of countriesmdashin particular to the United States the United
Kingdom Canada and Australia5 At the policy level they compare the points-based skilled
migration regimes as historically implemented by Canada and Australia with the employment-
based policies used in the United States through visa-control mechanisms like the H-1B visa
program Because of the links of global migration flows to employment and higher education
opportunities firms and universities also act as important conduits making employment and
admission decisions that deeply affect the patterns of high-skilled mobility
Gould and Moav (2007) focus on 28 countries which represent the largest exporters of
immigrants to the United States The sample includes mostly advanced economies Table 2
shows that the average index of emigration (ie the number of emigres per 10000 residents) is
3336 with the index for Israel being nearly three times as high 9551 Only two countries have
a higher indexndashndashIreland (1439) and Portugal (9921) When examining the index for educated
eacutemigreacutes ie those with a college degree the average index is 1241 and Israels index is more
than three times higher 4145 Using this index Israel is now higher than Portugal and the gap
between Israel and Ireland (4909) narrows considerably (See Table 82)
5 Kerr et al (2015) give suggestive examples showing how global migration may be most pronounced for those at the
very outer tail of the talent distribution
Table 3 presents international indicators selective indicators of Emigration to the US by
Education Attainment Israel is ranked at the very top for college graduate emigres per 10000
residents to the US with number of about 41 only Ireland with a number 49 is ranked above
Israel South Korea suffering also from brain drain has only about 25 college graduate emigres
per 10000 of its residents
Table 3 Indicators of Emigration to the US by Education Attainment
College
graduate
emigres
per
10000
residents
Emigres
for
10000
residents
Population of
country of
origin
Number
of college
graduates
Percentage
college
graduates
Number
of 30-50
years
old
emigres
Country of
origin
99 9991 693631 69 10275 Denmark
393 9931 696199 1613 8170 Finland
91 991 693961 1619 9030 Norway
91931 999 363611 631 9691 Sweden
999 991 63611 93611 1 9161 Great Britain
191 91991 9633969 9619 91 63 Ireland
99 9999 91616 69 9 96191 Belgium
913 9199 6639 1699 1 3699 France
9199 999 96161 969 1 916993 Netherlands
91999 99 691961 916911 1 96 Switzerland
9399 99 91616919 969 163 Greece
93 99 696 969 9163 Italy
9 99 91613161 611 91 9116111 Portugal
191 9999 11616911 93611 9 161 Spain
391 999 3696 63 19 969 Austria
391 991 91661 3691 19 961 Czechoslovakia
9919 99 3969639 916991 91 1693 Germany
99 199 91616191 6 9 1613 Hungary
999 19 936613 163 969 Poland
99 991 699691 163 19 1361 Romania
933 939 9116369 91961 9 9691 USSRRussia
991 9 9631691961 93611 1619 China
393 99 96163 913639 13 6131 Japan
191 999 161369 99693 1 933639 South Korea
999 9 691611 963 9 699 Thailand
1999 993 96116316 19619 6191 India
1991 99 616 161 19 63 IsraelPalestine
9 93 691363 961 1 961 Turkey
England Scotland and Wales
Source Gould and Moav (2007)
4 Israelrsquos Brain Drain
US serves as a magnet for top scientific immigrants US immigrants hold a disproportionate
share of jobs in science technology engineering and math (STEM) occupations in the United
States (see Hanson and Slaughter (2016)) Top talent drain from Israel is disproportionately high
among the high-end immigrants
In general the ratio of foreign scholars in America to scholars in the home country ranged from
13 in Spain to 43 in the Netherlands (Figure 1) At 122 Canada was an outlier though
this is much more of a two-way street than in any of the other cases While Canada is an outlier
Israeli scholars in America are in a class by themselves The Israeli academics residing in the
States in 2003-2004 represented 249 of the entire senior staff in Israelrsquos academic institutions
that year ndash twice the Canadian ratio and over five times the ratio in the other developed
countries
Figure 1 describes the percentage of home country academic scholars who have academic
position in US universities Figure 2 similarly describes Israel scholars in percentage of Israel
Universitiesrsquo senior faculty) in in the top US universities
Figure 1 Foreign Scholars in US Universities as percent of academic scholars in home country
2003-2004
Source Ben-David Dan (2008)
Israel supply of high skill workers is unique Today Israel ranks third in the world in the number
of university graduates per capita after the United States and the Netherlands It possesses the
highest per capita number of scientists in the world with 135 for every 10000 citizens
(compared to 85 per 10000 in the United States) and publishes the highest number of scientific
papers per capita However brain drain in academia is exceptionally high Ban David (2008)
demonstrates how differences between universities are inducing a massive academic migration
from Israel to the United States The magnitude of this scholarly brain drain is unparalleled in the
western world (See Figures 1 and 2) European Commission (2003) reported that 73 of the
15000 Europeans who studied for their PhD in the States between 1991 and 2000 plan to remain
13 18 19 21 22 29 29
42 43
122
249
in America If Europeans are concerned about the migration of their academics to the States then
Israelis should be nothing less than alarmed
Figure 2 Israelis in Top American Departments 2007 as percent senior faculty in Israel by field
Source Ban David (2007)
Figure 2 demonstrate that Israel stands out internationally in terms of the size and quality of the
brain drain
4 Conclusion
Even though the overall education attainment level of Israel (native born) labor force is highly
ranked currently schooling gaps develop Israel currently has below average school gap among
advanced economies A test score of 4686 compared to the group average 4939 See Table 91
96 120
146
287
328
Physics Chemistry Philosophy Economics Computer Science
Table 4 Test Scores
EUR DC LDC
Country EQ Country EQ Country EQ
Austria 5089 Australia 5094 Argentina 3920
Belgium 5041 Canada 5038 Brazil 3638
Switzerland 5142 Hong Kong 5195 Chile 4049
Denmark 4962 Israel 4686 China 4939
Spain 4829 Japan 5310 Colombia 4152
Finland 5126 Korea Rep 5338 Egypt 4030
France 5040 New Zealand 4978 Indonesia 3880
United
Kingdom 4950 Singapore 5330 India 4281
Germany 4956 Taiwan (Chinese
Taipei) 5452 Iran 4219
Greece 4608 United States 4903 Jordan 4264
Ireland 4995 Lebanon 3950
Italy 4758 Morocco 3327
Netherlands 5115 Mexico 3998
Norway 4830 Malaysia 4838
Portugal 4564 Nigeria 4154
Sweden 5013 Peru 3125
Philippines 3647
Thailand 4565
Tunisia 3795
Turkey 4128
South Africa 3089
Group
Averages 4939 5132 3999
Notes EQ = average test score in mathematics and science primary through end of secondary school all
years (scaled to PISA scale divided by 100)
Source OECD Library
Notwithstanding Israelrsquos current technological and scientific prowess top-talent drain has been
trending upward
Appendix A Immigrant Skill Composition Robustness Tests
Razin and Wahba (2015) utilize the free labor movement within the European Union plus
Norway and Switzerland (EUROPE) and the restricted movement from outside the EUROPE in
order to compare the free-migration regime to the controlled-migration regime Using bilateral
migration movements and splitting the sample among flows within EUROPE and flows from
outside EUROPE they identify in Table 1 the migration regime effect Robustness tests are
shown in Tables A2-A4 The dependent variable is the share of skilled migrants in the migrant
population and the main explanatory variable is benefits per capita ndasha measure of the
generosity of the welfare state The hypothesis is that under free migration the coefficient of this
variable is negative whereas under controlled migration coefficient of benefits per capita
multiplied by R is positive The indicator X is a dummy variable R=1 if migration is
controlled whereas R=0 if migration is free Recall the bi lateral migration flows within
EUROPE are referred to as free migration whereas bilateral migration flows where the
SOURCE is outside and the DESTINATION is inside EUROPE are referred to as controlled
migration
Table A2 OLS Estimates Using Migration Rates Adjusted by Relative Educational Quality
Dependent Variable Skill Difference in Migration (REQ) Rates in 2000
EUR amp DC
to EUR
EUR amp LDC
to EUR
Welfare generosity
benefits per capita -0105 -0115 -0109 -0111 -0116 -0138
(logs) 1974-90
(host)
(0052) (0049)
(0042)
(0051)
(0054)
(0054)
benefits per capita
(logs)
0115 0139 0135 0104 0111 0132
1974-90 (host) X R
(0053) (0062)
(0054)
(0059) (0070) (0062)
Lagged migration
rates
low-skilled
migration
-0697 -0695 -0686 -0681 -0595 -0578
rate (REQ) 1990
(0151)
(0149)
(0160)
(0156)
(0143)
(0150)
low-skilled
migration
1711 1738 1713 0715 0576 0314
rate (REQ) 1990 x R
(0175)
(0172)
(0174)
(0295)
(0217)
(0208)
high-skilled
migration
1037 1033 1022 1011 0937 0920
rate (REQ) 1990
(0169)
(0168)
(0176)
(0175)
(0162)
(0167)
high-skilled
migration
-0702 -0702 -0688 -0584 -0637 -0468
rate (REQ) 1990 x R (0167) (0164) (0171) (0194) (0175) (0178)
Returns to skills
high-low labor ratio
in
-0482 0205
1990 - (host)
(0234)
(0302)
high-low labor ratio
in
0325 0043
1990 (host) X R (0482) (0571)
high-low wage diff
in
0002 0003
1995 - (host) (0002) (0003)
high-low wage diff
in
-0007 -0006
1995 (host) X R
(0003)
(0003)
Gini in 1990
(source)
0013 0014 0011 0013
(0004)
(0004)
(0004)
(0005)
Gini in 1990
(source)
-0013 -0014 -0011 -0011
X R (0005)
(0005)
(0005)
(0005)
High-low unemp
rate
0001 0001 0006
diff in 1990 - (host) (0002) (0002) (0004)
High-low unemp
rate
-0004 -0005 -0009
diff in 1990 (host)
X R
(0004) (0004) (0005)
Immigration
policies
Total migrant stock -0001 -0001 -0001 -0001 -0002 -0002
in 1990 (0001) (0001) (0001) (0001) (0001)
(0001)
Share of refugees in -1907 -1168 -3680 -0672 -2954 -1497
1990 (2547) (3230) (3298) (1983) (2509) (3081)
Observations 384 384 360 569 569 533
R-squared 0861 0867 0871 0842 0816 0835
Notes All the migration rates are adjusted for the quality of education by the relative education
quality in source to host country ie REQ = (EQsEQh ) F=Free migration R=Restricted
migration Regressions include log distance dummy for same language in host and source
strong dummy between host and source and real GDP per capita in host and in source countries
Robust standard errors in parentheses significant at 10 significant at 5 significant
at 1
Table 8A3 IV Estimates with Lagged Dependent Variable
Dependent Variable Skill Difference in Migration Rates in 2000
EUR amp DC
to EUR
EUR amp LDC
to EUR
Welfare
generosity
Fitted
benefits per
capita
-0157 -0217 -0118 -0181 -0180 -0154
(logs) 1974-
90 (host)
(0081) (0097) (0063) (0080) (0089) (0070)
Fitted
benefits per
capita
0270 0261 0207 0198 0209 0161
(logs) 1974-
90 (host) X
R
(0089) (0099) (0078) (0088) (0103) (0083)
Lagged
migration
rates
low-skilled
migration
-0711 -0711 -0706 -0592 -0581 -0581
rate 1990 (0130) (0125) (0135) (0131) (0131) (0137)
low-skilled
migration
1774 1775 1752 0563 0556 0562
rate 1990 x
R
(0171) (0166) (0169) (0229) (0229) (0221)
high-skilled
migration
1055 1052 1046 0944 0931 0933
rate 1990 (0147) (0142) (0150) (0148) (0148) (0152)
high-skilled
migration
-0726 -0722 -0713 -0627 -0611 -0618
rate 1990 x
R
(0147) (0141) (0148) (0166) (0168) (0168)
Returns to
skills
high-low
labor ratio in
-1455 0060
1990 - (host) (0541) (0458)
high-low
labor ratio in
0794 0522
1990 (host )
X F
(0548) (0690)
high-low
wage diff in
0003 0003
1995 (host) (0002) (0003)
high-low
wage diff in
-0008 -0006
1995 - (host)
X F
(0003) (0003)
Gini in 1990
(source)
0012 0012 0011 0011
(0004) (0004) (0004) (0004)
Gini in 1990
(source) X R
-0013 -0015 -0010 -0010
(0005) (0005) (0005) (0005)
High-low
unemp rate
0011 -0000 0005 0005
diff 1990
(host)
(0005) (0002) (0003) (0004)
High-low
unemp rate
-0005 -0005 -0008 -0008
diff 1990 -
(host) X F
(0005) (0004) (0006) (0005)
Immigration
policies
Total
migrant
stock
-0001 -0001 -0001 -0002 -0003 -0003
in 1990 (0001) (0001) (0001) (0001) (0001) (0001)
Share of
refugees in
1990
-2470 0827 -4835 -1590 -2990 -2261
(3174) (3803) (3670) (2603) (2827) (3266)
Cragg-
Donald F-
statistics
4946
5434
10301
8623
9844
15912
Observations 384 384 360 538 538 504
R-squared 0865 0871 0875 0811 0815 0821
Notes F=Free migration R=Restricted migration Instrumented using legal origin dummies and
the interaction of legal origin dummies and R Regressions include real GDP per capita growth
rate in host log distance dummy for same language in host and source strong dummy between
host and source and real GDP per capita in host and in source countries
Robust standard errors in parentheses significant at 10 significant at 5 significant
at 1
Table A4 IV Estimates with Lagged Dependent Variable and Adjusted by Relative
Educational Quality (REQ)
Dependent Variable Skill Difference in Migration Rates (REQ) in 2000
EUR amp DC
to EUR
EUR amp LDC
to EUR
Welfare generosity
Fitted benefits per
capita
-0159 -0207 -0170 -0175 -0179 -0178
(logs) 1974-90 (host)
(0075)
(0087)
(0070)
(0076)
(0079)
(0064)
Fitted benefits per
capita
0269 0268 0207 0207 0218 0194
(logs) 1974-90 (host) X
R
(0089)
(0098)
(0077)
(0083)
(0102)
(0080)
Lagged migration
rates
low-skilled migration -0686 -0685 -0678 -0602 -0665 -0666
rate (REQ) 1990
(0148)
(0145)
(0155)
(0144)
(0154)
(0164)
low-skilled migration 1753 1765 1732 0553 0694 0686
rate (REQ) 1990 x R
(0172)
(0170)
(0174)
(0212)
(0290)
(0292)
high-skilled migration 1026 1022 1014 0941 0991 0989
rate (REQ) 1990
(0166)
(0163)
(0171)
(0163)
(0173)
(0180)
high-skilled migration -0698 -0693 -0684 -0632 -0566 -0564
rate (REQ) 1990 x R
(0164)
(0162)
(0168)
(0173)
(0193)
(0198)
Returns to skills
high-low labor ratio in -1192 0075
1990 - (host)
(0358)
(0386)
high-low labor ratio in 0833 0027
1990 (host) X R (0534) (0574)
high-low wage diff in 0004 0003
1995 (host) (0002) (0002)
high-low wage diff in -0007 -0007
1995 - (host) X R
(0003)
(0005)
Gini in 1990 (source) 0012 0013 0012 0013
(0004)
(0004)
(0004)
(0005)
Gini in 1990 (source) X
R
-0013 -0015 -0012 -0012
(0005)
(0005)
(0004)
(0004)
High-low unemp rate
diff
0008 0002 0003 0006
in 1990 (host)
(0003)
(0003) (0003) (0004)
High-low unemp rate
diff
-0005 -0005 -0008 -0012
in 1990 - (host) X R
(0005) (0004) (0005) (0004)
Immigration policies
Total migrant stock in
1990
-0001 -0001 -0001 -0002 -0001 -0001
(0001) (0001) (0001) (0001) (0001) (0001)
Share of refugees in
1990
-2592 0106 -2809 -1768 -1694 -1315
(3245) (3535) (3548) (2476) (2571) (2919)
Cragg-Donald F-
statistics
5169
5898
6265
8645
9277
16949
Observations 384 384 360 538 569 533
R-squared 0863 0867 0871 0805 0830 0835
Notes All the migration rates are adjusted for the quality of education by relative quality in
source to host ie REQ = (EQsEQh) F=Free migration R=Restricted migration Instrumented
using legal origin dummies and the interaction of legal origin dummies and R Regressions
include real GDP per capita growth rate in host log distance dummy for same language in host
and source strong dummy between host and source and real GDP per capita in host and in
source countries Robust standard errors in parentheses significant at 10 significant at
5 significant at 1
Table A2-A4 describe the skill mix-benefit correlations under various econometric
specifications Overall the fiscal burden and the magnet hypotheses tested with the coefficient
of social benefit in the regressions are statistically significant Therefore regression findings
yield support for the magnet hypothesis under the free-migration regime and to the fiscal burden
hypothesis under the restricted-migration regime In the regression analysis Razin and Wahba
(2015) control for differences in educational quality and returns to skills in source and host
countries and for endogeneity bias (by using instrumental variables)
References
Ben-David Dan (2007) ldquoSoaring Minds The Flight of Israelrsquos Economistsrdquo CEPR Discussion
Paper No 6338
Ben-David Dan (2008) ldquoBrain Drained Soaring Mindsrdquo CEPR VOX(March)
httpvoxeuorgarticleacademic-exodus
Ben-David Dan (2008) ldquoBrain Drained A Tale of Two Countriesrdquo CEPR Discussion Paper
No 6717
Docquier F O Lohest and A Marfouk (2005) ldquoBrain drain in developing countriesrdquo
Deacutepartement des Sciences Eacuteconomiques de lUniversiteacute catholique de Louvain Discussion Paper
2007-4 httpwwwabdeslammarfoukcomuploads163416347570bddcpdf
European Commission (2003) ldquoThe Brain Drain to the US Challenges and Answersrdquo
Gould Eric and Omer Moav (2007) ldquoIsraels Brain Drainrdquo Israel Economic Review Vol 5 No
1 pp 1-22 2007
Hanson Gordon H And Matthew J Slaughter (2016) ldquoHigh-Skilled Immigration and the Rise
of STEM Occupations in US Employmentrdquo NBER Working Paper No 22623
Kerr Sari Pekkala William Kerr Ccedilaglar Oumlzden and Christopher Parsons (2016) ldquoGlobal Talent
Flowsrdquo Journal of Economic Perspectives Volume 30 Number 4Fall 2016 Pages 3ndash30
httpkrugmanblogsnytimescom
Messina Anthony M (2007) The logics and politics of post-WWII migration to Western
Europe Cambridge Cambridge University Press
Peri Giovanni (2005) ldquoDeterminants of Knowledge Flows and Their Effect on Innovationrdquo
Review of economics and Statistics May 2005 Vol 87 No 2 Pages 308-322
Peri Giovanni (2016) ldquoImmigrants Productivity and Labor Marketsrdquo Journal of Economic
Perspectives Volume 30 Number 4 Fall 2016 Pages 3ndash30
Peri Giovanni Kevin Y Shih and Chad Sparber (2014) ldquoForeign STEM Workers and Native
Wages and Employment in US Citiesrdquo NBER Working Paper No 20093
Razin Assaf and Efraim Sadka (2014) Migration States and Welfare States Why Is America
Different from Europe Palgrave Pivot Series Palgrave macmillan
Razin Assaf Efraim Sadka and Phillip Swagel (2002) ldquoTax Burden and Migration A Political
Economy Theory and Evidencerdquo Journal of Public Economics 76 (September)
Razin Assaf and Jackline Wahba (2015) Vol ldquoWelfare Magnet Hypothesis Fiscal Burden and
Immigration Skill Selectivityrdquo Scandinavian Journal of Economics Volume 117 Issue 2 April
Pages 369ndash402
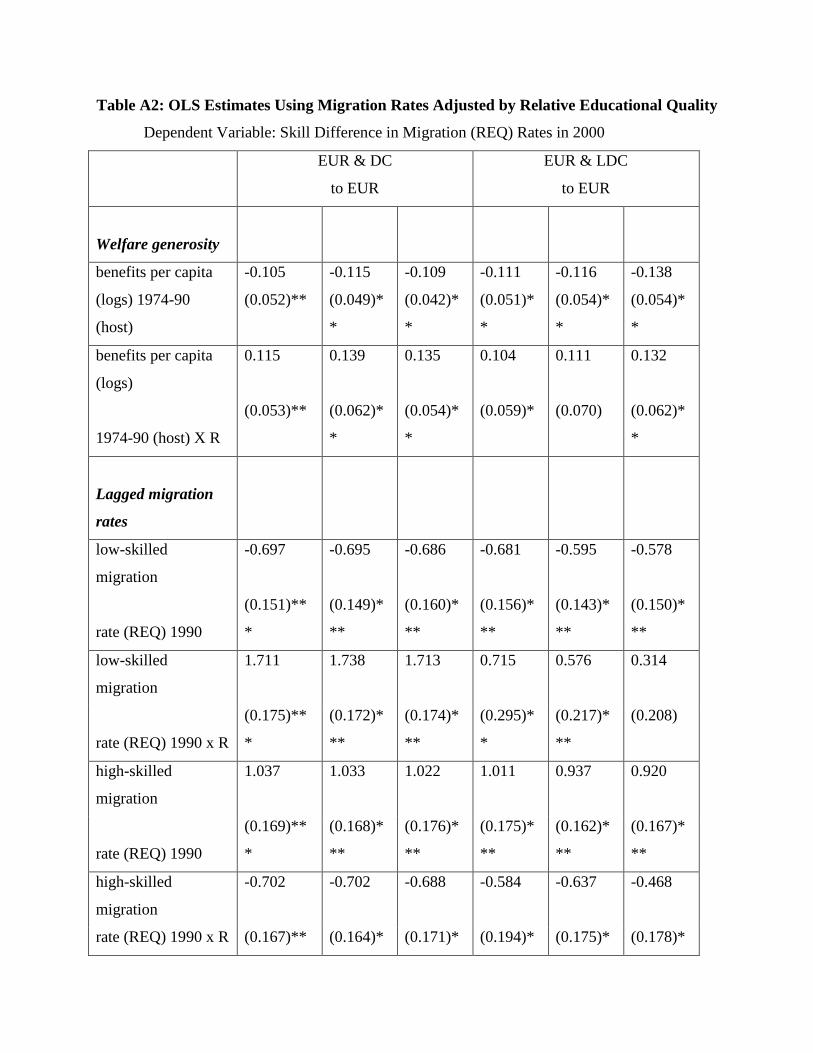
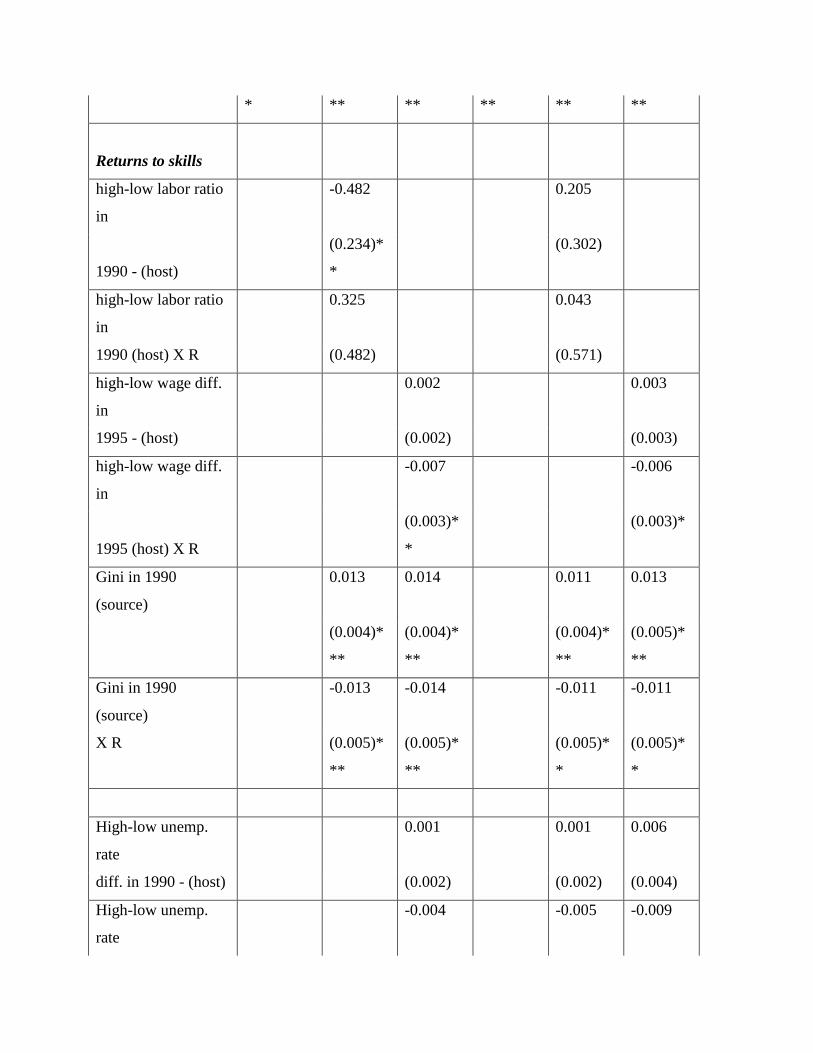
Returns to skills
high-low labor ratio
in
-0482 0205
1990 - (host)
(0234)
(0302)
high-low labor ratio
in
0325 0043
1990 (host) X R (0482) (0571)
high-low wage diff
in
0002 0003
1995 - (host) (0002) (0003)
high-low wage diff
in
-0007 -0006
1995 (host) X R
(0003)
(0003)
Gini in 1990
(source)
0013 0014 0011 0013
(0004)
(0004)
(0004)
(0005)
Gini in 1990
(source)
-0013 -0014 -0011 -0011
X R (0005)
(0005)
(0005)
(0005)
High-low unemp
rate
0001 0001 0006
diff in 1990 - (host) (0002) (0002) (0004)
High-low unemp
rate
-0004 -0005 -0009
diff in 1990 (host)
X R
(0004) (0004) (0005)
Immigration
policies
Total migrant stock -0001 -0001 -0001 -0001 -0002 -0002
in 1990 (0001) (0001) (0001) (0001) (0001)
(0001)
Share of refugees in -1907 -1168 -3680 -0672 -2954 -1497
1990 (2547) (3230) (3298) (1983) (2509) (3081)
Observations 384 384 360 569 569 533
R-squared 0861 0867 0871 0842 0816 0835
Notes All the migration rates are adjusted for the quality of education by the relative education
quality in source to host country ie REQ = (EQsEQh ) F=Free migration R=Restricted
migration Regressions include log distance dummy for same language in host and source
strong dummy between host and source and real GDP per capita in host and in source countries
Robust standard errors in parentheses significant at 10 significant at 5 significant
at 1
Table 8A3 IV Estimates with Lagged Dependent Variable
Dependent Variable Skill Difference in Migration Rates in 2000
EUR amp DC
to EUR
EUR amp LDC
to EUR
Welfare
generosity
Fitted
benefits per
capita
-0157 -0217 -0118 -0181 -0180 -0154
(logs) 1974-
90 (host)
(0081) (0097) (0063) (0080) (0089) (0070)
Fitted
benefits per
capita
0270 0261 0207 0198 0209 0161
(logs) 1974-
90 (host) X
R
(0089) (0099) (0078) (0088) (0103) (0083)
Lagged
migration
rates
low-skilled
migration
-0711 -0711 -0706 -0592 -0581 -0581
rate 1990 (0130) (0125) (0135) (0131) (0131) (0137)
low-skilled
migration
1774 1775 1752 0563 0556 0562
rate 1990 x
R
(0171) (0166) (0169) (0229) (0229) (0221)
high-skilled
migration
1055 1052 1046 0944 0931 0933
rate 1990 (0147) (0142) (0150) (0148) (0148) (0152)
high-skilled
migration
-0726 -0722 -0713 -0627 -0611 -0618
rate 1990 x
R
(0147) (0141) (0148) (0166) (0168) (0168)
Returns to
skills
high-low
labor ratio in
-1455 0060
1990 - (host) (0541) (0458)
high-low
labor ratio in
0794 0522
1990 (host )
X F
(0548) (0690)
high-low
wage diff in
0003 0003
1995 (host) (0002) (0003)
high-low
wage diff in
-0008 -0006
1995 - (host)
X F
(0003) (0003)
Gini in 1990
(source)
0012 0012 0011 0011
(0004) (0004) (0004) (0004)
Gini in 1990
(source) X R
-0013 -0015 -0010 -0010
(0005) (0005) (0005) (0005)
High-low
unemp rate
0011 -0000 0005 0005
diff 1990
(host)
(0005) (0002) (0003) (0004)
High-low
unemp rate
-0005 -0005 -0008 -0008
diff 1990 -
(host) X F
(0005) (0004) (0006) (0005)
Immigration
policies
Total
migrant
stock
-0001 -0001 -0001 -0002 -0003 -0003
in 1990 (0001) (0001) (0001) (0001) (0001) (0001)
Share of
refugees in
1990
-2470 0827 -4835 -1590 -2990 -2261
(3174) (3803) (3670) (2603) (2827) (3266)
Cragg-
Donald F-
statistics
4946
5434
10301
8623
9844
15912
Observations 384 384 360 538 538 504
R-squared 0865 0871 0875 0811 0815 0821
Notes F=Free migration R=Restricted migration Instrumented using legal origin dummies and
the interaction of legal origin dummies and R Regressions include real GDP per capita growth
rate in host log distance dummy for same language in host and source strong dummy between
host and source and real GDP per capita in host and in source countries
Robust standard errors in parentheses significant at 10 significant at 5 significant
at 1
Table A4 IV Estimates with Lagged Dependent Variable and Adjusted by Relative
Educational Quality (REQ)
Dependent Variable Skill Difference in Migration Rates (REQ) in 2000
EUR amp DC
to EUR
EUR amp LDC
to EUR
Welfare generosity
Fitted benefits per
capita
-0159 -0207 -0170 -0175 -0179 -0178
(logs) 1974-90 (host)
(0075)
(0087)
(0070)
(0076)
(0079)
(0064)
Fitted benefits per
capita
0269 0268 0207 0207 0218 0194
(logs) 1974-90 (host) X
R
(0089)
(0098)
(0077)
(0083)
(0102)
(0080)
Lagged migration
rates
low-skilled migration -0686 -0685 -0678 -0602 -0665 -0666
rate (REQ) 1990
(0148)
(0145)
(0155)
(0144)
(0154)
(0164)
low-skilled migration 1753 1765 1732 0553 0694 0686
rate (REQ) 1990 x R
(0172)
(0170)
(0174)
(0212)
(0290)
(0292)
high-skilled migration 1026 1022 1014 0941 0991 0989
rate (REQ) 1990
(0166)
(0163)
(0171)
(0163)
(0173)
(0180)
high-skilled migration -0698 -0693 -0684 -0632 -0566 -0564
rate (REQ) 1990 x R
(0164)
(0162)
(0168)
(0173)
(0193)
(0198)
Returns to skills
high-low labor ratio in -1192 0075
1990 - (host)
(0358)
(0386)
high-low labor ratio in 0833 0027
1990 (host) X R (0534) (0574)
high-low wage diff in 0004 0003
1995 (host) (0002) (0002)
high-low wage diff in -0007 -0007
1995 - (host) X R
(0003)
(0005)
Gini in 1990 (source) 0012 0013 0012 0013
(0004)
(0004)
(0004)
(0005)
Gini in 1990 (source) X
R
-0013 -0015 -0012 -0012
(0005)
(0005)
(0004)
(0004)
High-low unemp rate
diff
0008 0002 0003 0006
in 1990 (host)
(0003)
(0003) (0003) (0004)
High-low unemp rate
diff
-0005 -0005 -0008 -0012
in 1990 - (host) X R
(0005) (0004) (0005) (0004)
Immigration policies
Total migrant stock in
1990
-0001 -0001 -0001 -0002 -0001 -0001
(0001) (0001) (0001) (0001) (0001) (0001)
Share of refugees in
1990
-2592 0106 -2809 -1768 -1694 -1315
(3245) (3535) (3548) (2476) (2571) (2919)
Cragg-Donald F-
statistics
5169
5898
6265
8645
9277
16949
Observations 384 384 360 538 569 533
R-squared 0863 0867 0871 0805 0830 0835
Notes All the migration rates are adjusted for the quality of education by relative quality in
source to host ie REQ = (EQsEQh) F=Free migration R=Restricted migration Instrumented
using legal origin dummies and the interaction of legal origin dummies and R Regressions
include real GDP per capita growth rate in host log distance dummy for same language in host
and source strong dummy between host and source and real GDP per capita in host and in
source countries Robust standard errors in parentheses significant at 10 significant at
5 significant at 1
Table A2-A4 describe the skill mix-benefit correlations under various econometric
specifications Overall the fiscal burden and the magnet hypotheses tested with the coefficient
of social benefit in the regressions are statistically significant Therefore regression findings
yield support for the magnet hypothesis under the free-migration regime and to the fiscal burden
hypothesis under the restricted-migration regime In the regression analysis Razin and Wahba
(2015) control for differences in educational quality and returns to skills in source and host
countries and for endogeneity bias (by using instrumental variables)
References
Ben-David Dan (2007) ldquoSoaring Minds The Flight of Israelrsquos Economistsrdquo CEPR Discussion
Paper No 6338
Ben-David Dan (2008) ldquoBrain Drained Soaring Mindsrdquo CEPR VOX(March)
httpvoxeuorgarticleacademic-exodus
Ben-David Dan (2008) ldquoBrain Drained A Tale of Two Countriesrdquo CEPR Discussion Paper
No 6717
Docquier F O Lohest and A Marfouk (2005) ldquoBrain drain in developing countriesrdquo
Deacutepartement des Sciences Eacuteconomiques de lUniversiteacute catholique de Louvain Discussion Paper
2007-4 httpwwwabdeslammarfoukcomuploads163416347570bddcpdf
European Commission (2003) ldquoThe Brain Drain to the US Challenges and Answersrdquo
Gould Eric and Omer Moav (2007) ldquoIsraels Brain Drainrdquo Israel Economic Review Vol 5 No
1 pp 1-22 2007
Hanson Gordon H And Matthew J Slaughter (2016) ldquoHigh-Skilled Immigration and the Rise
of STEM Occupations in US Employmentrdquo NBER Working Paper No 22623
Kerr Sari Pekkala William Kerr Ccedilaglar Oumlzden and Christopher Parsons (2016) ldquoGlobal Talent
Flowsrdquo Journal of Economic Perspectives Volume 30 Number 4Fall 2016 Pages 3ndash30
httpkrugmanblogsnytimescom
Messina Anthony M (2007) The logics and politics of post-WWII migration to Western
Europe Cambridge Cambridge University Press
Peri Giovanni (2005) ldquoDeterminants of Knowledge Flows and Their Effect on Innovationrdquo
Review of economics and Statistics May 2005 Vol 87 No 2 Pages 308-322
Peri Giovanni (2016) ldquoImmigrants Productivity and Labor Marketsrdquo Journal of Economic
Perspectives Volume 30 Number 4 Fall 2016 Pages 3ndash30
Peri Giovanni Kevin Y Shih and Chad Sparber (2014) ldquoForeign STEM Workers and Native
Wages and Employment in US Citiesrdquo NBER Working Paper No 20093
Razin Assaf and Efraim Sadka (2014) Migration States and Welfare States Why Is America
Different from Europe Palgrave Pivot Series Palgrave macmillan
Razin Assaf Efraim Sadka and Phillip Swagel (2002) ldquoTax Burden and Migration A Political
Economy Theory and Evidencerdquo Journal of Public Economics 76 (September)
Razin Assaf and Jackline Wahba (2015) Vol ldquoWelfare Magnet Hypothesis Fiscal Burden and
Immigration Skill Selectivityrdquo Scandinavian Journal of Economics Volume 117 Issue 2 April
Pages 369ndash402