globalization, distribution and social policy: turkey
TRANSCRIPT

CEPA Center for Economic Policy Analysis
Globalization, Distribution and Social Policy: Turkey, 1980-1998
Korkut Boratav (Ankara University), A. Erinc Yeldan (Bilkent University), and
Ahmet H. Köse (Ankara University)
CEPA Working Paper Series I
Globalization, Labor Markets, and Social Policy A Project Funded by the John D. and Catherine T. MacArthur Foundation
Working Paper No. 20
February 2000
Center for Economic Policy Analysis New School University
80 Fifth Avenue, Fifth Floor, New York, NY 10011-8002 Tel. 212.229.5901 � Fax 212.229.5903
www.newschool.edu/cepa

GLOBALIZATION, DISTRIBUTION AND SOCIAL POLICY: TURKEY, 1980-1998*
Korkut Boratav Ankara University, Faculty of Political Science
A. Erinc Yeldan
Bilkent University
and
Ahmet H. Köse Ankara University, Faculty of Political Science
March 1999
* A Previous version of this paper was presented at the CEPA Conference on Globalization and Social Policy, New York, January, 1999. We are indebted to Lance Taylor, Ute Pieper, Gülay Günlük Şenesen, Ahmet Ertuğrul, and the conference participants for their comments and suggestions; and to Ebru Voyvoda for her indispensable research assistance.

1
CONTENTS
Introduction 2 I. Phases and Analytics of Macroeconomic Adjustment: 1980-1998 3 I-A. Structural Adjustment, Export-Oriented Growth and Exhaustion 1981-1988 4 I-B. Return to Populism, Capital Account Opening, and Crises, 1989-1998 5 II. Impact of Liberalization on Industrial and Employment Structures 8 II-A. Structural Changes in Employment and Informalization 8 II-B. Persistence of Oligopolistic Structures under Trade Liberalization 10 II-C. Sources of Productivity Growth in Manufacturing Industry 11 III. Patterns of Adjustment: Competitiveness and Distribution 14 III-A. Competitiveness Indicators of the Manufacturing Exporters 14 III-B. Relations and Patterns of Income Distribution 16 IV. Poverty, Size Distribution of Income and Social Classes 18 IV-A. Why Size Distribution? 18 IV-B. Income Types, Size Distribution and Poverty: Empirical Linkages 19 IV-C. Poverty Impact of Relative Price Movements 19 IV-D. Wage Inequalities and Poverty 20 V. The Public Sector and Social Safety Nets 24 V-A. Deterioration of Fiscal Balances 24 V-B. Implications of the Rising Debt Burden: Adjustment Patterns 25 VI. Conclusions on Social Policies: Conflicts, Contradictions and Options 27 VI-A. The Turkish Pendulum Between Orthodoxy and Populism 27 VI-B. Concluding Reflections on the Societal Implications of Globalization 31 References 33

2
Introduction
In this paper we aim to analyze the impact of globalization on income distribution and social policies in post-1980 Turkey. Broadly defined, globalization is the process of the complete integration of the constituent parts of the world economy with each other and with international markets. In the terminal stage of globalization, nation-states as distinct economic identities pursuing national objectives are expected to disappear. What remains will be an integrated transnational economy where goods, factors of production and financial assets will be perfect substitutes wherever they are located (UNCTAD, 1997).
The world economy and its constituent parts are, currently, far from this
ultimate stage. However, the past quarter of a century has witnessed decisive and apparently irreversible transformations in this direction. Successive steps of liberalization of trade and capital movements have resulted in integrating national economies with world markets for goods and financial assets. Consequently autonomous decision-making powers of nation-states in regulating domestic economies drastically weakened.
There are, however, missing links. International mobility of labor is strikingly
less than it has been during the past century or even during the "golden age" of post-1950 capitalism. Hence, whereas the capacity of governments to effectively control capital at the level of the national/domestic economy has been undermined, nation-states are faced with a situation where they can only regulate labor and socio-economic variables, i.e. social policies. The search for competitiveness and the freedom of movement of capital generates strong pressures for minimizing the individual and social cost of labor at the national level. The resulting conflicts and contradictions are resolved at the level of the nation-state, sometimes obstructing the overwhelming forces of globalization. This is the analytical conceptualization within which the Turkish context is to be covered in the paper.
Turkey initiated its long-process of integration with the world commodity and
financial markets in 1980. The successive stages of liberalization have been surveyed elsewhere [Yeldan (1995) and Boratav, Türel & Yeldan (1996; 1995)] and will be briefly overviewed in the next section. Since its early inception, Turkish adjustment program was hailed as a �model� by the orthodox international community and supported by generous structural adjustment loans, debt relief, and technical aid. Currently the Turkish economy can be said to be operating under conditions of a truly �open economy� a macroeconomic environment where both current and capital accounts are completely liberalized. In this setting, many of the instruments of macro and fiscal control have been transformed, and the constraints of macro equilibrium have undergone major structural change.
The analytics of the two distinct (i.e. 1980-88 and 1989-98) phases of
liberalization is the theme of Section I. We address the modes of accumulation and surplus creation under both sub-periods separately, and investigate the culminating inherent tensions of disequilibria under each episode. Section II, in turn, carries this

3
analysis to micro aspects of adjustment and reports on the evolving patterns of employment, labor productivity, and overall informalization of the labor force. Responses to pressures of international competitiveness and the emerging patterns of income distribution are studied in Section III. In Section IV, the preceding analysis is applied to size distribution of income and the incidence of post-liberalization adjustments on poverty. The incidence of globalization on public sector accounts and the state�s changing role in the provision of public goods are narrated in Section V. Section VI concludes with an overview of the social policy implications of globalization. I. Phases and Analytics of Macroeconomic Adjustment: 1980-1998
The post-1980 Turkish adjustment path can be partitioned into two broad phases: �1981-1988� and �1989-1998�. The main characteristic of the first phase is structural adjustment with export promotion, albeit under a regulated foreign exchange system and controls on capital inflows. Over this period, integration to the global markets was achieved mainly through commodity trade liberalization. More importantly, both the exchange rate and direct export subsidies acted as main instruments for the promotion of exports and pursuit of macroeconomic stability. The period was also characterized by a severe suppression of wage incomes via hostile measures against organized labor. This �classic� mode of surplus creation reached its economic and political limits by 1988. Coupled with a new wave of populist pressures under approaching elections, organized labor succeeded in attaining significant increases in wages. Furthermore, beginning 1989, there was a major shift in the public expenditure accounts towards more socially desirable ventures. An overall increase in both the share and level of public salaries, and investments on social infrastructure enabled the working masses to attain improved living standards.
The post- 1988 populism could evidently be financed by taxing the
bourgeoisie and moving towards a more �fair� tax system. Yet, the strategic preference of the state was the maintenance of its present stance towards evasion of taxable capital incomes and its lax attitude towards the so-called unrecorded private transactions. Consequently, the state apparatus turned into a bastion of privilege as it assumed a regulatory role in the creation and absorption of the economic surplus, while the fiscal balances have taken the major brunt of adjustment. The main macroeconomic policy response to the increased wage costs and the culminating fiscal deficits was complete deregulation of financial markets. With the advent of elimination of controls on foreign capital transactions and the declaration of convertibility of the Turkish Lira in 1989, Turkey opened up its domestic asset markets to global financial competition. In this setting, the Central Bank lost its control over the exchange rate and the interest rate as policy instruments independent of each other, as these practically turned into exogenous parameters set by the chaotic conditions of financial arbitrage in the global markets. Thus, we regard 1989 as a crucial year in our analysis, segmenting the post-1980 economic development patterns of Turkey. Given this broad division, we further characterize each phase by three sub-periods, each roughly encompassing mini business cycles of growth, crisis and post-crisis adjustment. We base our detailed analysis of the macro aggregates utilizing data tabulated in Table I-1.

4
<Table I-1 here>
I-A. Structural Adjustment, Export-Oriented Growth and Exhaustion 1981-1988 Turkey attempted to overcome the 1977-79 foreign exchange crisis with a
series of reforms destined to integrate it with the world markets. The currency was left to a downward slide, and price controls were lifted. Substantial support for export manufacturing was granted, involving tax rebates, duty free import allowances and subsidized credit.
Probably the most significant economic policy characteristic of the 1983-87
period was the suppression of wage incomes. This had the dual effect of both reducing domestic demand in favor of creating an �exportable� surplus and also cutting labor costs. The share of wage-labor in private manufacturing value added receded from 27.5% to 17.1%; and in public manufacturing from 25% to 13%. In this process, the average mark-up rate in private manufacturing has increased from 31% to 38%.
During this period, exports rose by 19.7% per annum in dollar terms and the
real gross domestic product, following the low-point of the 1978-80 depression, rose by 5.4% per annum. However, the performance of fixed investments did not follow this pattern. In the private sector, gross fixed investments initially contracted by 5.3% in 1981-82, and increased by 12.3% during 1983-87. Decomposition of this path reveals that only a small portion of this amount was directed to manufacturing. The rate of growth of private manufacturing investments has been on the order of only 2.1% per annum. This resulted in a significant anomaly as far as the official stance towards industrialization was concerned: in a period where outward orientation was supposedly directed to increased manufacturing exports through significant price incentives and subsidies, the share of manufacturing investments declined substantially.
Given this background, we characterize schematically the main mechanisms of
macroeconomic equilibrium with the aid of Figure I-1. This figure portrays the dynamics of the Turkish economy under the export promotion and commodity trade liberalization episode, 1980-1988.
<Insert Figure I-1> Low savings along with stagnant investments, high fiscal costs and tax
evasion, and an oligopolistic structure set the stage portrayed in Figure I-1. Low savings generation and meager investment demand resulted directly in disequilibrium in macroeconomic conditions along channels (1) and (2).1 Along the fiscal operations, costs of export subsidization together with revaluation of foreign debt in
1 Yeldan (1995) and Akyüz (1990) argue that the faltering investment performance of the economy under the 1980s is the end result of a marked re-distribution of national income towards rentiers exhibiting strong preferences towards conspicuous consumption patterns with low propensities to save and invest.

5
domestic currency due to continued real depreciation led to excessive pressures on public expenditures. Given the extent of the informalization of the economy and consequent tax evasion, the fiscal gap widened (along channels (9) and (14a)), and necessitated increased demands for deficit financing through foreign borrowing (14).
Export subsidization (3), together with the decline in wage costs (7) and the
discretionary devaluation policy (8) were the characteristic policy responses of the period which enabled the surge in export revenues. It has to be noted in this context that one of the components of wage suppression in this period was continued price inflation, enabling both the wage squeeze to generate an exportable surplus (channel (10)), and also inflation tax revenues for the state (channel (16)). Implemented under a regime of vigorous currency depreciation supplemented by direct export incentives, inflation policy did not seem to lead to any loss of competitiveness of Turkish exportables.
Rising export earnings and foreign debt accumulation constituted the main
mechanisms for financing trade liberalization and the import demand along channel (13). This mechanism entailed, however, significant inner conflicts since foreign exchange was �earned� by the private sector, and foreign debt servicing was carried by the public sector. This duality necessitated implementation of specific mechanisms for the transfer of foreign exchange from the private to the public sector, and as Ekinci (1998) attests, constituted the main conflict in the accumulation patterns of the period. Ekinci interprets the export subsidization policy as one of the means of resolving this conflict. No doubt, the same tension was observed to be a continued component of the trade and fiscal gaps faced in the post-1989 period as well, and would reveal itself in the resolution of the increased public deficit financing through short-term foreign capital inflows at the cost of excessive real rates of interest and increased volatility of investments and production.
Increased foreign debt, in turn, called for increased costs of debt financing
(15), and constituted an important source of macroeconomic disequilibria (19). This process, complemented by channels (1), (2), (17), and (18)2 signaled that the underlying modes of macroeconomic adjustment would reach its limits both economically and politically. We highlight 1988 as the limiting point of this episode, and interpret it as the year of �exhaustion�.
I-B. Return to Populism, Capital Account Opening, and Crises, 1989-1998
All economic indicators of 1988 signal a stagflationary macro environment.
The rate of growth of GDP was only 2.1%, and the inflation rate accelerated to 75%. Real wage earnings hit their lowest point, but then recover quickly beginning in 1989 the starting point of the new populist phase. Real wages in manufacturing increased by 90% from 1988 to 1991. Thus, the classical accumulation episode based on wage suppression had come to a halt by 1989.
Various counteracting mechanisms were invigorated to rationalize the increase in wage costs from the point of view of private industrial capital. The first policy 2 On the extent of oligopolistic production structure of the domestic industry see Section II.B below.

6
response to the new macroeconomic environment was the advent of complete deregulation of the foreign capital transactions and declaration of the Turkish Lira as fully convertible in foreign exchange markets in 1989. This paved the way for injection of liquidity to the domestic economy in terms of �hot money� inflows. Such inflows enabled, on the one hand, the financing of rising public sector expenditures, and also provided relief on inflationary pressures by cheapening import costs. The second mechanism was based on the imperfectly competitive market structures prevalent in the economy, and the consequent �costs-plus-mark-up pricing rules� on industrial output. We document the behavior of mark-ups against real wage costs and real wage earnings in private manufacturing industry3 in Figure I-2. Figure I-2 portrays three sub-periods regarding the behavior of private mark-ups. Between 1980-84, the private sector industrial mark-ups follow the deflationary trend in prices with a downward adjustment. Following the first expansionary phase of 1984-1988, we observe a jump in this rate. We label this period as the classical export-led growth phase of the Turkish economy, which reached its limits in 1988. Starting in 1989, real wage costs increase abruptly. However, this does not cause a squeeze of profit margins in private manufacturing; on the contrary, they successfully trail the upward trend in real wage costs and reach a plateau of 47% during the financial crisis of 1994. Hence, during the 1990s, profits displayed significant upward flexibility via mark-up rates in response to increased wage costs. <Insert Figure I-2> The third mechanism that enabled the private industrial capital to absorb the wage increases of the aforementioned period, was the pricing policy of the public sector. We calculate that the ratio of intermediate costs to wage costs declined from 11.8 in 1988 to 7.8 in 1990 and to 6.5 in 1991. This was mostly achieved with delayed restructuring of the public prices against an inflationary background, maintaining a surplus for the private sector.
A fourth defensive mechanism of private capital was labor-shedding. One of
the major characteristics of the labor market adjustments throughout the 1990s has been widespread layoffs and an overall intensification of marginalized labor employment. Quarterly data on private manufacturing reveals that formal employment in medium to large enterprises employing 10+ workers fell by twenty five percentage points between the first quarter of 1988 and the last quarter of 1992. The outbreak of the 1994 crisis has taken an additional toll on formal employment in the sector bringing the index of private manufacturing employment to thirty points lower than its 1988 level (SPO, 1998). We document the extent of marginalization of the industrial labor force in further detail in Section II-1 below.
Erratic movements in the current account, a rising trade deficit (from 3.5% of
GNP in 1985-88 to 6% in 1990-93) and a drastic deterioration of fiscal balances (See Section V) showed the unsustainability of the post-1989 model. This prolonged
3 Wage earnings are pre-tax and include overtime, fringe benefits and social security contributions by the employees, but excludes such payments by the employers. The latter are, however, included in compiling wage costs. (See SIS, Annual Surveys of Manufacturing Industry).

7
instability reached its climax during the fourth quarter of 1993, when currency appreciation and the consequent current account deficits rose to unprecedented levels. With the sudden drainage of short-term funds in the beginning of January 1994, production capacity contracted, followed by continued fall in industrial output throughout that year. Together with this contraction, the post-1994 crisis management gave rise to significant shifts in income distribution, and to an intensification of the ongoing processes of transfer of the economic surplus from the industrial/real sectors and wage-labor, in particular, towards the financial sectors. Likewise, dollar-denominated wage costs decreased substantially and enabled export earnings to rise. In this manner, Turkey has, once again, switched back to a mode of surplus extraction whereby export performance of industrial sectors depended on savings on wage costs. In fact, the disequilibrium could have only been accommodated by the massive (downward) flexibility displayed by real remuneration of wage-labor. The index of the real wage rate in private manufacturing fell by an aggregate of 29 percentage points between 1993.IV and 1996.II.
We can summarize the dynamics of the post-1989 macroeconomic equilibrium
of the Turkish economy with the aid of Figure (I-3). The figure identifies the same sources of structural imbalances as in Figure (I-1), namely low savings capacity, large fiscal gap, and structural deficiencies in the production process along with an imperfectly competitive market structure. The resolution of these imbalances, however, disclosed quite different modes of adjustment following the 1989 opening of the economy to global financial competition. An important addition to the characteristics of the period was the wage explosion and the re-emergence of a populist stance against the background of intensified political struggle. In response to these structural features, we observe the state assuming an active role in the economic sphere, regulating the distribution of national output. The state carried out this task first through its enterprise system by a mandated policy of delayed price adjustments on the intermediates and the final wage and capital goods produced by the SEE�s (Figure I-3 box (3)).
Following the full deregulation of the capital account, the state actively
participated in the domestic asset markets through its issues of debt instruments (channels (6) and (7)). This, together with the threat of currency substitution in the context of a convertible currency regime, necessitated high interest rates (channel (8a) and (8b)) the first vicious circle, and real appreciation (channel (9b)). The second vicious circle surrounding channels (9a), (9b), and (9c) is highlighted by double-sided implications among the three variables involved: short-term capital inflows (hot money), real appreciation, and high real interest rates. Real appreciation had been the prime cause of the rise of the import volume and the current account deficits. On the other hand, real appreciation had a direct positive effect on investment demand by reducing costs of imported capital goods and intermediates (channel (13b)). This positive effect was countervailed by the pressures of real interest rates (channel (13a)), the end result being increased volatility of investment demand. High interest rates gave way to inflationary pressures through increased costs of credit (channels (8b) and (13)); and fed speculative rentier type of accumulation (channel (12)) with consequent worsening of income distribution. The limits of this bonanza of �short term foreign capital-led growth pattern� was the eruption of the financial crisis in 1994 and the continued fragility and severe disequilibria that the domestic markets had to face in

8
the late 1990s. <Insert Figure I-3> The relationship between the external accounts, production and the labor
market can be understood by the analytical portrayal given in Figure I-4. Demand for formal labor is given in the north-east quadrant. Labor market duality is depicted in the south-east quadrant by introducing marginalized labor as an indispensable complementary component. In the north-west quadrant we have two processes between output (accumulation) and the current account balance. The dependence of growth and accumulation of imports gives rise to the standard upward-sloping DD schedule. The aforementioned post-liberalization vicious circle generates an equilibrium of increased current account deficits and high real interest rates, with a consequent negative effect on accumulation. The end result is a negative relationship between accumulation and the current account deficit along the rr-schedule higher CA deficits necessitate higher real rates of interest to attract foreign capital, which results in a contraction of investment. The equilibrium is given by the intersection of these processes, summarized by the DD and rr schedules.
<Figure I-4 here> The deregulation of the capital account leads to an appreciation of the real
exchange rate, and leads to a structural increase of the real interest rate. We follow the post capital-account liberalization (1989-93) by shifting the rr-schedule out. Stimulated by inflows of short-term capital, the domestic economy experiences an expansionary swing together with a rise of the current account deficit. The delicate balance upon which this fragile growth path rests is broken by the build up of a confidence crisis and the sudden reversal of �hot money� flows beginning at the end of 1993. We portray the 1994 crisis as an abrupt shift of the capital-account schedule back to r″ r″ . Furthermore, the aggregate demand schedule shifts downward indicating a decline in the absorption capacity of the domestic economy.
The 1994 crisis is a constrained equilibrium with lower investment demand,
higher real interest rates, and a severe contraction of productive capacity. In the labor market, the post-liberalization response of private capital is revealed through shedding formal labor and increased marginalization. As also conceptualized in Amadeo (1996), this has the effect of tilting the formal labor employment schedule inwards to LF′ . Increased marginalization of the labor market, higher real rates of interest, and increased volatility of acumulation patterns become characteristic of the domestic economy under financial deregulation.
Clearly, the �reform fatigue and exhaustion� of the 1988 crisis, and the
unsustainability of the post-1989 growth path which culminated into the 1994 crisis have had quite different macro dynamics in operation. Under both episodes, however, in spite of the official stance towards a policy of �reducing the economic role of the state�, we observe continued use of the state�s frontiers as a regulatory agent, overseeing the distributional conflict over the national product. In the next section, we study these adjustment dynamics and report on the distributional processes in more

9
detail.
II. Impact of Liberalization on Industrial and Employment Structures II-A. Structural Changes in Employment and Informalization
In this section we first provide a more detailed study of the impact of
adjustment on employment, factor incomes, market structures, and technical productivity. Here our main focus will be on the manufacturing industry, as most reliable data are available mostly for this sector. We will, however, extend our analysis to the aggregate economy whenever data permit. The annual Manufacturing Industry Statistics of SIS is the most elaborate statistical database in that respect. However, it covers only public enterprises and the �formal/organized� category of labor in private establishments that employ more than 10 persons. Previous studies have in general argued that there is an extensive and accelerated usage of �marginal/unregistered� labor in the Turkish labor market (Yentürk 1997; Yeldan and Köse; 1998, Bulutay 1995, Senses 1994, 1996). In this study, our operational definition of the �informal/marginal labor� category will be that part of the employed labor force which is not officially registered under any social security coverage and also is not entitled under the �self-employed or employer� status in the labor force statistics.
The SIS Household Labor Surveys document that as of 1996 the economically
active population above 12 years of age is about 23 million and 23 % of that amount consists of �employer and self employed� (6,308,000 persons). As an operational hypothesis, we will regard this group as outside the wage-labor market, and conclude that the potential supply of wage labor in Turkish economy in 1996 was 16,611,000 persons. With this classification, we find that 58% of the total employed labor force is engaged under different wage relations (regular or informal). When employment is classified with respect to its �social security system� coverage, one observes that about 43% of total labor force is employed under the �formal/registered� category (6,553,000 persons). The rest (8,676,000 persons) is what we will refer as marginal labor.
A closer examination of labor employment in the manufacturing industry reveals similar trends of informalization during the 1980�s. Our calculations reveal that the ratio of marginal labor to total employment in the manufacturing industry increased to 49 % (1,170,000) in 1994, and stabilized around 44 % (1,035,000) in 1995, from 41 % (700,000) in 1980 (Table II-1). This phenomenon is observed to be even more acute in the private manufacturing industry. The number in informally employed labor exceeded the amount of formally employed labor in 1994, and was equal to 49% of total employment in private manufacturing in 1995. This form of employment is very extensive in traditional sectors like food processing, textiles, wood and furniture, and metal products, where small-scale enterprises have greater importance.
<Insert Table II-1>

10
Even though the extent of informal, marginalized employment is admitted to be a perennial feature of Turkish labor markets, we observe an intensification of this process especially after 1989 the era of post-financial liberalization. One important observation is the continued presence of small-scale production units in manufacturing. Across 1980-1995, one witnesses little change in the overall characteristics of the small-scale enterprises. As of 1995, 95% of enterprises in manufacturing employ less than 9 workers, and produce 7% of aggregate manufacturing value added. They employ, on the average, 24% of the formal industrial labor force, with an average wage of about one-fourth of the wages paid in �large� enterprises (i.e. those employing more than 10 workers). Average productivity in small manufacturing, likewise, reach only about a fourth of that of large enterprises. Furthermore, the real level of average labor product is observed to be almost stagnant throughout. In general, average wages fall as the share of small-scale production units increase across a given sub-sector. In fact, Köse and Öncü (1998) provide evidence, for instance, that the annual average costs of labor in the small-sized private manufacturing enterprises (employing less than 9 workers) were held below the legal minimum wage floor throughout most of the 1980s and 90s.
In Figure II-1 we document data on real wage costs of various labor categories
employed in the manufacturing industries. The figure provides a close-up picture of the aggregate dynamics of the wage cycle in private manufacturing. Data disclosed in Figure II-1 reveal that the post-1988 wage cycle experienced in small-medium private manufacturing followed quite a different path than the one observed in the public sector and the large manufacturing enterprises. The so-called wage expansion of the post-1988 period has actually been an episode shared mostly by the formal, organized ranks of the industrial labor force. Yet, the overall marginalization of wage-labor in the informalized sectors had been a prolonged pervasive characteristic of the industrial relations over the whole post-liberalization period. These processes led to a widening of the gap between earnings of different labor categories, and in turn led to an intensification of duality of the labor market.
<Figure II-1 here>
II-B. Persistence of Oligopolistic Structures under Trade Liberalization An important structural trait of the manufacturing industry of the post-
liberalization era is continued intensification of the oligopolistic �costs plus mark-up pricing� behavior coupled with the maintenance of the level of concentration in the industrial commodity markets. Indeed, various studies on the market structure of the Turkish economy (Tekeli et al. 1982; Katõrcõoğlu 1990; Güneş 1991, 1998; Kaytaz et al. 1993; Güneş, Köse and Yeldan, 1996) indicate that there is a considerable tendency for monopolization in Turkish manufacturing industries. To document the extent of the oligopolistic structure of the sector, we tabulate in Table II-2 the rate of concentration in the manufacturing industries that employ �10 or more persons", as calculated by the shares of the four largest enterprises in the total revenues of the sector (CR4). Accordingly, we classify those sectors with CR4 ratios above 50% to be "oligopolistic"; and those with CR4 ratios between 30% and 49% as "monopolistically competitive". Finally, those sectors with CR4 ratios below 30% are

11
classified to be "competitive". Furthermore, on a different spectrum we categorize the industrial sectors given their degree of tradability. We classify the sectors as trade or domestic-oriented on the basis of the ratio of the total trade volume (import and export) to the total production of the sector. Accordingly, the sectors are classified as traded if the ratio of total trade (export + import) to the total domestic production is higher than 50%.
<Table II-2 here> On the basis of these data, one can make two direct observations on the market
structures of the manufacturing industries: First, changes observed in the shares of production by the public and the private sectors do not have a decisive effect on the rate of concentration. As a result, it could be observed that there are both public (petroleum refineries 353, tobacco 314) and private (glass and glass product 362, rubber products 355, printing and publishing 342) dominated sectors with high rates of concentration.
In the same manner, it could also be deduced that reduction in the share of the public companies in the sector does not lead directly to an increase in the degree of competitiveness of the sector. In this respect, comparing the data for 1980 and 1985, one can see that there are sectors in which concentration rates (CR4) have declined parallel to a decrease in the share of the public sector (iron and steel 371; beverages 313; paper and paper products 341), whereas there have also been sectors (chemicals 351, tobacco 314) in which monopolization increased as a result of the same process.
The second observation is that the process of export promotion and overall
trade liberalization since 1980 do not seem to have affected the structural characteristics of the manufacturing industry. This hypothesis is more visible when changes in the rates of concentration in the sector that is considered to be �open� by 1995 are examined. It is observed that over the post-trade liberalization episode, the rate of concentration has decreased only in iron and steel 371, and it was either kept constant or increased in the other sectors.
These observations reveal that, contrary to the expectations of orthodox
theory, the process of trade liberalization has, in general, been insufficient to introduce the expected increase in competition in the industrial commodity markets. Effects of these developments on distribution and sectoral resource allocation can be better understood upon examination of pricing behavior. Given that prices in a monopolistic economy are to be set through a mark-up which maintains the rate of profitability, we find that the rate of mark-up rate which stood at 32% in the 1980's, increased to 47% in 1994, and stabilized at 41% by 1996. In the presence of this type of pricing, the relative position of wage-labor in aggregate value added will directly depend on the changes in real wages and/or changes in the mark-up rate. II-C. Sources of Productivity Growth in Manufacturing Industry
We now turn to a disaggregated analysis of the technological processes of
productivity surrounding the manufacturing industries in the post-liberalization era. Data limitations preclude such an analysis for the other sectors. However, we believe

12
that many of the attributes of the industrial market are shared by the other sectors, and that much of the characteristics of industrial employment and technology provide illuminating lessons for the economy as a whole.
We follow a methodology developed in Syrquin (1986) and Pieper (1998) in
their analysis of growth decomposition. We will try to decompose the sources of labor productivity growth in the Turkish manufacturing industry and categorize its sub-sectors into �leaders� and �secondary� activities.
We first make use of the definition of average product of labor as total value
added, X, per labor employed, L. An increase in average labor product is subject to two processes: (i) due to advancements in total factor productivity, given total labor employed; and (ii) due to a fall in labor employment and intensification of remaining labor employed labor shedding. Our calculations reveal that between 1981 and 1996 the average productivity of labor (value-added deflated by WPI) in large-scale Turkish manufacturing has increased by 87.4%. In order to study the sources of this increase we will search for the patterns of employment and production in the sub-sectors of aggregate manufacturing industry.
Defining average labor productivity as LXQ = , and denoting level of
production in the sub-sector i as xi and labor employment, as li we get the following identity:
(1) { }industry ingmanufactur of subsectorsi , and , ====∑∑
i
ii
ii
ii
lx
ql
x
LXQ
taking the first differences of the above identity with respect to time we get:
(2) ∑
−−
−=
−=∆
i 0
0
0
01
0
1
0
0
0
01
0
01 Ll
lll
Xx
xxx
QQQ
QQ i
i
iii
i
ii
Here, if we make use of the following notation,
ii
ii gx
xx=
−
0
01 (rate of growth in sector i's production)
ii
ii nl
ll=
−
0
01 (rate of growth in sector i's employment)
ii
Xx θ=
0
0 (share of output of sector i)

13
00
0i
i
Ll λ= (share of employment of sector i)
we transform the equation (1) into:
(3) ∑
−=∆
iiiii n
QQg
00
1 λθ
Accordingly, equation (3) allows us to decompose the change in average
productivity into weighted changes in output production and labor employment at the subsectoral level. A further manipulation of equation (3) enables us to write:
(4) ( )∑
−+−=∆
iiiiiii n
QQng
00
100 λθθ
Here the first term in brackets signifies the weighted rate of growth in output
in sector i in excess of its labor employment. The second term reflects the gains in aggregate productivity originating from re-allocation of labor across sectors. Equation (4) decomposes the changes in overall productivity into a weighted average of sectoral productivity shifts and �reallocation of labor employment� across sub-sectors of the manufacturing industry. Accordingly, the �reallocation weight� is made up of the
difference between the output and labor share of sector-i,
− 0
0
10 ii Q
Q λθ , and reflects
the differences in productivity levels across the manufacturing sector. Following Pieper, we will identify those sectors which have a high value of this term as �leading sectors�, and those which have lower scores as the �secondary� sectors within manufacturing. Thus, a �leading� sector is characterized by a relatively high value of its reallocation weight due to a relatively small labor share.
We report our findings in Table II-3. Here we decompose the sources of
growth within nine subsectors of Turkish manufacturing between 1981-1996. The first column of Table II-3 gives the productivity gains of the individual sub-sectors in this period. We decompose these gains into two sources: (i) contributions from pure productivity gains (first term in brackets of equation (4)); and (ii) contributions to aggregate productivity gains by reallocation of labor (second term in equation (4)). Data reflect that the first five sectors with the highest productivity rate are the following:
1. Forestry products (335.0%) 2. Paper products (214.3%) 3. Machinery (161.9%) 4. Food processing (126.3%) 5. Pottery and soil products (104.2%)

14
It is very interesting to observe, however, that the net contribution of Forestry Products to total industrial average productivity through labor re-allocation is negative (-1.0%). The reason originates from the low share of the sector in industry (low value of 0iθ ). It is surprising to find that the same result is obtained for four of the most productive five sectors identified above. This finding suggests that the sectors that have had high labor productivity increases have failed to act as the �leading� sectors in industry mostly due to their small shares within the industry itself. Thus they could not have given significant impetus to the rest of the manufacturing.
<Table II-3 here> Our analysis identifies the following sectors with positive contributions to
aggregate labor productivity via labor reallocation (and thus can be termed as a �leader�):
1. Chemicals (%3.4) 2. Metals (%3.1) 3. Food Processing (%2.6) Here, it is interesting to observe that none of the fast exporters of the post-
1980 export boom reveal themselves in the leading category. Our analytical findings document clearly the fact that the leading exporters of this period could not have assumed a leading productivity role. In particular, the leading export sector, textiles, is observed to generate a negative rate of productivity contribution with �28.9% from labor re-allocation, and +20.3% from pure productivity gains. This brings the net contribution of textiles to aggregate productivity to �8.6%.
These findings reinforce our previous assessments regarding the
manufacturing sector at the macro level. With a meager investment performance in manufacturing, the so-called export-led growth episode seems to generate sizable cost savings and surplus transfer to the recipient sectors and did not necessarily generate gains in productivity. As such, the post-1980 export orientation could not carry over into productivity gains in the leading exporting sectors and could not be sustained as a viable strategy of �export-led industrialization�. Lacking the necessary productivity investments, the export gains based only on price incentives and subsidies had exhausted their impetus by the end of the decade. In the next section we turn into a detailed analysis of the distributional dynamics of this structure.
III. Patterns of Adjustment: Competitiveness and Distribution It was through its trade policy component, essentially via export orientation,
that globalization generated strong impacts on income distribution. For firms and even for entire industrial branches improving competitiveness became a matter of survival, let alone development. This had direct and systematic consequences on income distribution. It is these aspects of globalization that will be investigated in this section.

15
III-A. Competitiveness Indicators of the Manufacturing Exporters Promotion of manufacturing exports was the main policy objective of the structural adjustment reforms in 1980, and this priority lasted until the end of 1988. The export performance of the economy was impressive in the period 1980-88. Annual export growth rate (in terms of current US dollars) during this period reached 19%, and surpassed world export growth rate by a significant margin. The same rate declined to a modest 5.1% between 1989-1993; but picked up and attained 12.8% following the 1994 crisis. The contribution of the manufacturing sector to total exports of goods had approached to 90% by late 1990s a striking improvement compared with the 32% average of the second half of the 1970s. To study the microeconomic dynamics of this process we will first report on the productivity and competitiveness indicators of export manufacturing. If we denote labor productivity by LP, real exchange rate by RER4 and real wage costs by Wr, competitiveness indicator (CI) is defined by (LP*RER)/Wr. If we define RER and Wr by deflating nominal exchange rate (En) and nominal wages (Wn) by WPI, this definition can be written as: [(LP) *(En)/WPI)]/[(Wn/WPI)]. After appropriate manipulation this definition is transformed into LP* (En/Wn). The inverse of this expression is equal to the conventional "unit labor costs" (ULC) concept: (Wn/En)*(1/LP), i.e. wages in dollar terms deflated by labor productivity. Rather than the conventional ULC concept we find its transformation in a decomposed version into CI as more useful in the sense that its components, i.e. real exchange rate, labor productivity and real wages, reflect the three different strategic variables corresponding to exchange rate, industrial and incomes policies which determine the country's (industry's) capacity to compete with the external world. <Insert Table III-1 and Table III-2>
Table III-1 is organized on the basis of the foregoing three determinants of competitiveness for the manufacturing industry. Their analysis enables us to identify the specific policy patterns affecting competitiveness of the sector, while the X/GDP ratios, in return, represent the outcome in terms of export performance.
Table III-2 translates the findings in Table III-1 into a schematic form for sub-
periods. Declining real wage costs [negative g(wr)], rising real exchange rates and labor productivities [positive g(rer) and g(lp)] result in improved competitiveness [i.e. positive ∆∆∆∆(CI)], and vice versa. In terms of performance, improved CI would be expected to raise the share of exports in GNP [i.e positive ∆∆∆∆(X/GNP)]. A distinction between strong (i.e. in excess of 3.5% per annum denoted by ++) and moderate (i.e. positive, but below 3.5% denoted by +) productivity growth is also made. Table III-2, then serves to differentiate between adjustment patterns in terms of competitiveness.
First, it is significant to observe that there prevails almost complete
correspondence between changes in CI and export performance for all sub-periods. In 4 RER is defined as the real price of the foreign currency and, hence, rising RER represents real depreciation of the domestic currency, and vice versa.

16
terms of adjustment patterns, however, the "ideal" combination of changes in the Wr, LP and RER variables is [-, +, +] which is realized in none of the sub-periods. The most substantial improvement in CI takes place during the 1985-88 sub-period when the three relevant variables exhibit the [+, ++, +] pattern. Real wage growth was almost negligible and a high rate of growth of RER and LP contributed to the improvement in competitiveness. It should be recalled that the so-called "realistic" exchange rate policy, aiming at real depreciations was one of the pillars of the policy package of the 1980-88 years. The [-, -, +] pattern of the 1981-84 sub-period results in improved competitiveness when a mild decline in productivity is over-compensated by the erosion of real wages and substantial rates of real depreciations.
The most adverse combination (in terms of competitiveness) of the relevant
variables would be [+, -, -]. In the Turkish case this would correspond to the late 1970s; but no such phase is observed during the 1981-1997 period. The 1989-1993 years, however, exhibiting the [+, ++, -] pattern comes closest: the wage "explosion" was accompanied by substantial real appreciation (with nearly 30% decline in RER from 1988 to 1993). The strong productivity growth was not sufficient to arrest the substantial and almost continuous erosion of CI during the five years following 1988.
In order to assess the strong performance of 1985-88 and 1989-93 sub-periods,
one can further differentiate the two major factors beyond g(lp) into a dynamic pattern based on investments, and a static efficiency pattern based on labor shedding, downsizing and intra-industrial improvements. In both phases we observe that manufacturing investment ratios are lower than the earlier period and the following sub-periods. However, employment growth is positive during 1985-88, but turns negative in the following sub-period. Strong wage growth and stagnant investment performance during 1989-93 directly enabled the manufacturing industry to raise productivity via labor shedding, i.e. via gains of static efficiency.
III-B. Relations and Patterns of Income Distribution
It will be shown in the following section that the majority of the poverty-
stricken population is located within the ranks of wage-earners and peasants. Hence, changes in indicators of distribution on wage earners and terms of trade for agriculture (TOTA) are relevant both for an analysis of functional (class-based) income distribution; and for assessing whether the direction of change is equitable or not. It should be noted that the Turkish agrarian structure is based predominantly on a market-oriented peasant agriculture and, hence, TOTA corrected by labor productivity represents real income movements of farmers from their agricultural output and relative price movements per se. This is why we regard TOTA as the crucial indicator of distributional dynamics in the rural economy.
In Turkey, movements of TOTA since the late 1970s depict two phases: a
dramatic decline by 45% from 1977 up till the end of 1988 (for 1980-88, see Table III-3, Column 1) and an upward movement from 1988 through 1997, except for 1994. A comparison of TOTA with wage movements for the same years and for the main sub-periods (Table III-4) suggests that there is a striking similarity between the distributional "destinies" of workers and peasants in Turkey. Even the apparent divergence between TOTA and g(wr) indicators for the 1994-97 sub-period is

17
misleading. Once the average values of 1994-97 are divided into two equal segments, i.e. 1994-95 and 1996-97, divergence between TOTA and g(wr) disappears.
This phenomenon of "parallel wage and TOTA movements" is a reflection of
the underlying role played by policy factors affecting workers and peasant-farmers in a common fashion. Broadly speaking, "populist" policy phases result in upward wage and TOTA movements. The reverse is observed in those years when stabilization, structural adjustment, and interests of private capital dominate policy making; and adverse incomes policies affect both wage-earners and peasants in a parallel fashion. An earlier study on the relative magnitude of support purchases by marketing boards and other subsidies supported this explanation.5
(Insert Tables III-3 and III-4) Table III-3 further enables us to overview the distributional variables and to
propose typical patterns for the sub-periods. In addition to TOTA, the table brings together three indicators: Annual changes in wages g(wr) and employment, g(emp) are accompanied by the differential between productivity and real wage growth rates, i.e. g(lp)-g(wr). A positive value for g(lp)-g(wr) implies, first a rising gross profits/value added ratio within manufacturing industry and, secondly, intra-industrial surplus generation and vice versa. Here, we move into real wage earnings, instead of real wage costs as an indicator of relations of distribution and, hence, use CPI as deflator in defining real wages instead of WPI as has been done in the preceding tables.
The presence of a permanent and almost violent wage cycle influenced
strongly by the relative strength of social actors and by the political environment during the past twenty years is striking. In terms of real wage costs, a 44% "collapse" from the late 1970s up till 1985 is followed by a 158% "explosion" up till 1993 (most of which is realized in 1989-91) and another collapse of 62% in 1994-95. In terms of real wage earnings the same cycle (although trough and peak years are not identical) is represented by -42%, +95% and -37%. Wages/value added ratios are affected by the cycle despite the dominance of a downward trend thereof. Let us, once again, note that TOTA and wage movements are roughly parallel.
In the second part of Table III-3 we study a schematic translation of these
indicators. This enables us to move into patterns, this time of distributional changes and the characterization of the post-1980 sub-periods accordingly. We define an egalitarian pattern to incorporate simultaneous improvements in TOTA, real wages, wage shares and employment. In our notation, this would be represented by (+, +, -, ++) in the same order of the four variables covered in Table III-4. Positive TOTA, g(wr), g(emp) indicators may be accompanied by a non-negative value for g(lp)-g(wr) which would be represented by (+, +, +, ++) in terms of our table. Let us label this as an equitable pattern. It signifies that popular classes are experiencing
5 See K. Boratav, O. Türel and E. Yeldan (1996, Table 8). The correction of TOTA by labor productivity provides us data on agricultural income per employed person. Real farmer incomes in this sense have declined also declined by 45% from 1977 to 1989 and, thereafter improved by 47%. The 1996 level is still 18% below that of 1977.

18
improvements in terms of the on-farm prices, wages and employment; but productivity does not lag behind the growth of wages. As long as surplus generation within industry is not transmitted into higher rates of capitalist consumption; but rather transformed into accumulation, employment creation and (via higher taxes) into public goods, such a pattern is usually considered legitimate and equitable. There are no sub-periods which fall either into the egalitarian or equitable pattern during the post-1980 years. There are however, brief egalitarian (i.e. 1989-90, 1996-97) interludes.
Trade-offs between real wages and employment generate different patterns.
When positive TOTA movements are accompanied by positive g(wr) and negative (or weak) g(emp) we have a possibly egalitarian (or equitable6) pattern in favor of the employed workers, but against the unemployed urban groups. Findings in Section IV for the post-1989 years in Turkey suggest a slightly different pattern when wage progression in the formal sector has accompanied rising employment in the informal sector a combination which favors both groups of workers unless it also results in lower employment levels in the formal sector. Conversely, when positive TOTA movements are accompanied by negative g(wr) and positive g(emp) we have another possibly egalitarian pattern this time discriminating against the previously employed workers, but in favor of the unemployed urban groups. If the employed and unemployed (marginal etc.) groups belong sociologically to the same social groups (e.g. the same households), the net distributional result of the wage-employment trade-off would depend on the relative size of the total wage bill and on the changes in real incomes of the related urban groups. Conventional neo-classical analysis treats them as distinct social entities with limited inter-group mobility, and, hence considers any trade-off which favors employment against real wages as an equitable movement. In the post-1980 years, such trade-offs have prevailed during the wage-boom/capital account opening phase of 1989-93 (against the unemployed, but in favor of wage-earners in the formal sectors).
Since average peasant incomes are substantially below urban wages and it is in
the rural population that poverty is most widely spread, any combination of TOTA deterioration along with negative movements of either g(wr) or g(emp) must be considered a partially inegalitarian/inequitable pattern. Negative signs for the three indicators would represent a totally inegalitarian change. Such patterns have prevailed during the 1981-88 and 1994-95 years in Turkey. Both cases correspond to crisis (post-crisis) and orthodox stabilization phases.
IV. Poverty, Size Distribution of Income and Social Classes
IV-A. Why Size Distribution? The foregoing analysis of post-1980 distributional changes has been in terms of income types of specific social classes/strata. The distributional process per se consists of primary and secondary relations in which socio-economic groups, classes and the state are actively engaged. Functional income distribution or income 6 "Egalitarian" vs. "equitable" labels depend on the sign of g(lp)-g(wr) as explained in the text.

19
distribution between socio-economic groups provide appropriate conceptual frameworks for studying the linkages which shape the distributional dynamics including the impact of economic policies. Size distribution of income, on the other hand, is the statistical end result of these relations of distribution. However, once the analysis moves into the arena of poverty, information on size distribution of income becomes indispensable. This is because poverty is much more related to income levels, rather than income types. Hence, size (personal) distribution of income is the appropriate starting point in estimating the magnitude of the poverty issue. If poverty thresholds can be defined in terms of income levels for urban and rural households (or for other groups) and if we have frequency (i.e. "size") distributions of income or the same groups, the number of households living in poverty can directly be estimated. In Section III above we have studied the behavior of real wage costs and remunerations, and agricultural terms of trade (TOTA) in Turkey under post-1980 liberalization. Given these findings, the following questions should be addressed: (i) What are the linkages between the observed wage and TOTA movements and size distribution of income and, more specifically, their incidence on poverty? (ii) How far have liberalization patterns affected inequalities among labor incomes? And finally, (iii) Apart from changes in the distribution of nominal incomes, have changing relative prices for consumers and farmers alleviated or aggravated the incidence of poverty? The following sub-sections will discuss these questions. IV-B. Income Types, Size Distribution and Poverty: Empirical Linkages Empirical studies on poverty are scarce in Turkey.7 Recent data on size distribution of income are available for 1987 and 1994. Information on the share of different income types within the total income of the lowest income brackets for total, urban, and rural households is available only for 1987. Vulnerable income types in 1987 are thus defined and presented in Table IV-1 and can be used as a starting point of poverty investigations. The following observations are valid:
(Insert Table IV-1)
(1) Income sources of "the poor" differ from national averages. (See Columns
1 and 4) Wages, agricultural "entrepreneurial" income and pensions constitute significantly higher shares in incomes of "the poor" than that of the "average" household. The incidence of poverty among the recipients of interest, dividend, rental and non-agricultural entrepreneurial revenues (which also incorporates revenues accruing to informal business) is much more limited. Two implications follow: (i) Adverse changes in real wages/salaries, in pensions and in agricultural terms of trade should, ceteris paribus, be interpreted as aggravating the incidence of poverty and,
7 In the only recent study, Dumanlı (1997) on the basis of the 1987 size distribution data, the food basket corresponding to minimum calorie requirements and CPI index numbers, estimates the share of households living below the poverty line as 15%, 10% and 20% in Turkey, in urban and rural areas respectively. These percentages roughly correspond to our findings presented in Table IV-1.

20
hence, inequitable. (ii) However, intra-group size distribution also matters and average changes of specific income types may affect different sub-groups (and, hence, poverty) in non-uniform manner. Therefore, further information on intra-group distribution is required. (2) The old debate on whether higher agricultural, especially food crop, prices benefit or harm the rural poor seems to be settled in favor of the "beneficial impact thesis" in the Turkish case. Farming revenues of the agricultural poor exceeds their wage revenues (Column 3), and although poor farmers may also be buyers of food crops from the market, (i) as long as their agricultural revenues exceed their food expenditures, they benefit in net terms; and (ii) even if they are net "spenders", higher agricultural prices affect them less adversely than other non-rural social groups. This conclusion reiterates the earlier proposition on the equitable consequences of improvement in TOTA. IV-C. Poverty Impact of Relative Price Movements We now report on the impact of relative price changes on the magnitude of the families below the poverty line. Two dimensions are involved. First, if relative prices of those consumer goods which occupy a major portion of the consumption basket of poor households (i.e. of food) deteriorate with respect to the overall price level (e.g. CPI) which had been used in estimating real wages, the size of the population below the poverty line may rise even with unchanged income levels. Secondly, if relative prices of those agricultural commodities which occupy a major portion of the output of poor rural households (i.e. of cereals and tobacco for the Turkish farmers) deteriorate with respect to the overall price level (e.g. implicit deflator for agriculture) which is used in estimating TOTA movements, the size of the rural population below the poverty line may rise even with unchanged TOTA.
(Insert Table IV-2)
Table IV-2 provides hints on the poverty impact of relative price movements where food price component of CPI is used as the general numerator in assessing the impact. Values less than unity in the terminal year represent poverty augmenting relative price changes for consumers in general and for the relevant farming, since the end of the 1970s.
The last column compares movements of overall consumer prices with those of food prices. It turns out that relative price movements moved against consumers below the poverty line, i.e. households with a larger weight of food within their consumption baskets, by 13% between 1978/79 and 1995. Among farming households, poverty is more widespread among wheat and tobacco farmers than the cotton and sunflower farmers. Once again, farming households with the exception of sunflower growers have confronted lower prices received for their crops in terms of overall food prices. This last observation points at the inegalitarian impact of the widening of two sets of prices originating at the agricultural sector: (i) Poor consumers have been "taxed" by faster than average increases of food prices; but (ii) higher food prices have not been transmitted to (or have not been due to) higher

21
relative prices for cereal/wheat farmers- the most numerous and poorest segments of the rural population. The overall impact of relative price movements have, thus, been in the direction of rising inequalities and aggravating poverty.
IV-D. Wage Inequalities and Poverty
In which direction have wage patterns changed during the post-1980 years? What was the impact on poverty-stricken urban population? The discussion of these questions requires the prior clarification of a number of empirical issues.
A situation of constant average real wages is compatible with increased
polarization at both ends of the frequency distribution for wage earners. That is why data on average real wage movements do not always have implications for poverty. On the other hand, a situation of constant average real wages for each sub-group of workers may also correspond to a situation of increased polarization of wage earnings when internal changes of the work-force from relatively higher-paid positions and activities towards lower-paid ones take place. Increased polarization corresponds to the aggravation of poverty if suppression of real wages at the lower brackets is part of the process. Finally, it would be helpful if data are available on the magnitude of non-wage revenues of lowest-paid wage earners.
Frequency distribution of wage revenues for the wage earning population (or
for sub-groups thereof) is not available. Hence, questions on "which categories of wage earners are more vulnerable?" or "are vulnerable sub-groups growing larger?" can be tackled only indirectly. Two sets of appropriate data are available. The first set is from the Survey on Employment and Wage Structure of SIS and provides us with wage rates for specific sub-groups of total wage earners, yet only for 1994. We can infer some of the explanatory factors behind wage differentiation from this. We also have data from Household Labor Force Surveys of SIS on employment shares of the same sub-groups within total employment from 1988 onwards. Assuming that the ranking of different wage-earning groups has remained unchanged, the analysis of changes in the employment structure (e.g. whether the share of female workers has risen or not) provides information on changes in wage inequalities.
The second set of data consists of wage movements within manufacturing
industry (i.e. by branches, private/public, small/large enterprises). Additionally, we have wage data for some years on a few non-manufacturing industries based on Labor Statistics. We can, thus, directly generate some indicators on wage differentiation. These two lines of analysis will be undertaken in what follows.
1. Diverse Factors Affecting Wage Inequalities
SIS' Survey on Employment and Wage Structure presents data on wage differentials on the basis of different socio-economic attributes and produces no surprises. It is among female, young, uneducated, unexperienced, non-unionized categories that poorly paid workers are located. Private sector wages are about half of that of the public sector. Unionization makes a great deal of difference. Wage rates for non-unionized workers are 44% below those under collective agreements.

22
Female and young (i.e. below 20 years of age) workers earn 39 and 75 percent less than men and those at the prime of life (i.e. aged 35-54) respectively. University graduates earn 2.3 times more than workers with less than 5 years of education.
On the basis of these findings it can be inferred that higher employment of child and female labor, higher rates of turnover within the workforce (reducing seniority averages), declining unionization and educational levels, privatization and a declining public sector would be the channels aggravating the incidence of poverty within urban workers, and pushing average wages downwards.
During the past decade, public sector employment has declined, partly due to
privatization. Although reliable data are not available, there is consensus among labor economists that unionization rates have recently been declining. The move towards increased flexibility of the labor market is likely to have raised turnover rates of the workforce. SIS surveys show that female employment has risen by three percentage points between 1988 and 1997. These are factors pushing for increased wage inequalities and, probably aggravating poverty. On the other hand, there are positive trend factors, e.g. gradual improvement of the educational levels and the age structure of the labor force, which operate in the reverse direction.
2. Differential Inter and Intra-Industrial Wage Movements In Table IV-3 we present further data which enable us to compare wage
movements and levels of relatively unorganized and informal workers (i.e. those employed in private, small enterprises and in clothing) with those in more organized and formal sectors (i.e. public and large enterprises, in mining and gas production).
The findings strongly suggest distinctions between two phases. The first
phase, 1981-88, is distinguished by labor market controls imposed by extra-economic means. Reduced wage differentiation takes place by the erosion of wages of formal/organized workers much faster than other groups. Gaps between wages in private/ public; small/large; organized/unorganized (i.e. mining, gas and electricity vs. clothing and trade) are reduced significantly. The second phase covers the wage explosion years of 1989-1993 and constitutes the complete reversal of the preceding pattern. The strong improvement in average wages was almost completely due to what was happening at the organized/formal sectors. Wage gaps between large/small and public/private enterprises widen significantly and exceed the relative margins of the early 1980s.
Two interrelated questions can be addressed with respect to the comparisons
of inter-industrial wage and employment structures. Has labor demand responded to changing inter-industrial wage structures and have changes in inter-industrial wage differentiation been caused by changes in employment? The direction of causality is essentially a theoretical issue that will not be addressed here. Instead we shall merely overview the empirical wage/employment linkages for small-scale enterprises, for the �trade etc.� sub-sector and clothing.

23
The predominantly export-oriented traded clothing industry has continued to expand its employment share during phases when its relative wage levels have been rising (1981-88) or falling (1989 onwards). Relative wages of the essentially non-traded trade, hotels, restaurants and miscellaneous services sub-sector have declined, accompanied by rising employment shares. The employment share of small-scale manufacturing, on the other hand, has remained essentially stable throughout the period despite ups and downs in the wage dispersion between small/large enterprises. Overall, it can be proposed that trend factors based on the dynamics of external/internal demand to a large degree independently of wage movements may have been effective in shaping employment patterns. Furthermore, essentially autonomous wage movements, independent of each other in the formal and informal segments of the labor market, have shaped changing dispersions of inter-industrial wage structures.
On the basis of the foregoing findings, a number of conclusions on inter-
industrial and intra-industrial wage and employment movements can be proposed: (a) The post-1980 period when globalization and liberalization dominated the
Turkish economy has resulted in further opening the gap between the wages of high and low-paid segments of the urban working class.
(b) The dual character of Turkish labor markets shapes real wage movements
of organized/formal and unorganized/ informal segments. The cycle of average wages is shaped by what is happening in the organized segment. This is not only due to the size of the organized sector, but also because wages there are much more volatile in both directions than those in the unorganized segments. If we distinguish large and small-scale manufacturing establishments, average real wage earning between 1980 and the peak year (1993) rose by 29% in the former group, but by a mere 2% in the latter. Real wages collapsed for both groups in 1994-95; but by 29% in large establishments and 20% in small-scale enterprises. Hence, when gaps between higher and lower-paid segments of the urban workers are opening (narrowing), it is due to the faster growth (decline) of wages in organized/formal sectors. In other words, both groups of workers usually experience parallel wage movements and there is no trade-off between their real wage levels. This signifies that a lower degree of wage dispersion does not, per se, have a favorable impact on vulnerable (poverty-stricken) groups of wage earners. On the other hand, it is more likely that during those phases when wage dispersion is rising, the number of wage-earners below the poverty line may be declining because these phases usually correspond to (i) real wage progression for all groups and (ii) rising employment rates for workers in informal/unorganized sectors.
(c) The preceding section argued that a more open trade regime affected wage
movements through pressures on competitiveness. The linkage between inter- and intra-sectoral wage differentiation and globalization/liberalization is less direct. In Turkey it is, still, the dual character of labor markets and the relative bargaining power of social actors on wage settlements in the formal segments that shape trends in wage dispersion. Despite adverse developments, the formal, organized and medium-large sectors, particularly in manufacturing, mining and infrastructures still constitute the

24
dominant segments of labor markets. An increasing scope of flexible arrangements in labor markets usually corresponds to phases of real wage progression for organized segments. Hence, during two decades of liberalization, trends in wage differentiation and their impact on poverty take place in a much more complex setting than that envisaged by neoclassical models and, therefore, the outcomes have not corresponded to conventional predictions. We conclude this section with two final observations. The first is on the dichotomy between economic categories and social realities. The segmented character of labor markets in Turkey does not imply the segmentation of the urban working class into formal vs. marginal groups. It is members of the same households who shift from informal into organized activities as economic conditions change. Some sort of a gender or age-based division of labor also exists between formal/informal activities.8 Hence, distributional trade-offs between organized vs. marginal industries should not be interpreted as implying conflicts of interest between two distinct segments of the urban social matrix. The second observation is on micro (household)-level adjustment strategies. During periods when real wages or real prices for agricultural output are repressed, households, whether urban and rural, whether below or above the poverty line, undertake defensive adjustment strategies and attempt to preserve their real income levels. Urban households respond by strengthening their links with the agricultural and informal sectors. As for rural households, the typical defensive mechanism of poor peasants would be migration to the urban economy or moving into wage-labor (sometimes in non-agricultural activities) within the rural economy. The response of better-off farmers would be to shift investable resources outside of agriculture.
V. The Public Sector and Social Safety Nets V-A. Deterioration of Fiscal Balances
It is during the post-1988 era that a drastic deterioration of the fiscal balances took place in Turkey. Public sector borrowing requirement (PSBR) as a ratio of GDP averaged 4.5 percent during 1981-1988, but rose to 8.6 percent for the 1989-1997 period.
In this context, it is important to note a fundamental change in financing of the
PSBR. Data on the financing patterns of the PSBR suggest that, under the financially repressed conditions of the 1970�s and early 1980�s, deficit financing through central bank advances (monetization) was the predominant method. However, after removal of interest ceilings in a series of reforms throughout the 1980s,9 the Turkish private sector faced a new element: real interest rates rising to unprecedented levels. While borrowers struggled to adapt to exorbitant real rates on loans, financial institutions and rentiers adapted swiftly to the new conditions and the government found it much
8 For empirical support see e.g. Boratav (1995). 9 See Boratav, Türel and Yeldan (1996), Ekinci (1998), Köse and Yeldan (1998), and Balkan and Yeldan (1998) for a thorough investigation of the financial reforms over the 1980s and 90s.

25
easier to finance its borrowing requirements domestically through issues of the government debt instruments (GDIs). This also enabled successive governments to by-pass many of the formal constraints on their fiscal operations. Consequently, with the advent of full-fledged financial liberalization after 1988, the PSBR financing relied almost exclusively on issues of GDIs to the internal market especially to the banking sector. The stock of domestic debt was only about 6% of the GNP in 1989, just when the liberalization of the capital account was completed. It grew rapidly, and reached 20% by 1997.
The underlying characteristic of the domestic debt management was its extreme short-termism. Net domestic borrowings, as a ratio of the stock of the existing debt, hovered around 50% before the 1990�s. This ratio increased to 105% in 1993, indicating that each year the state had to resort to new borrowing exceeding the stock of debt already accumulated. In 1996, this ratio reached to 163.5%. Thus, the public sector has been trapped in a short-term rolling of debt, a phenomenon characterized as Ponzi-financing in the fiscal economics literature. For this scheme to work, however, domestic financial markets required the continued inflow of short-term capital inflows. Thus, the episode of hot money inflows should be interpreted, in the Turkish context, as the long arm of fiscal policy, overcoming credit restraints and monetary constraints of the monetary authority. Currently more than 90% of the newly securitized deficit is purchased by the banking sector. Thus, the so-called deepening of the financial system in the Turkish economy has turned into a process of self-feeding cycles, ready to burst. High real rates of interest on the GDI�s attract speculative short-term funds, and through the operations of the banking system, these are channeled to the treasury via bond auctions, which can thereby by-pass constraints imposed by the monetary authority. Except during financial crises, this is an extremely profitable process for the banking sector, and it is the capital account liberalization which makes it viable. The major brunt of the costs of this fragile environment, however, falls on the productive sphere of the economy, especially the traded sectors. High real interest rates and overvaluation of the domestic currency, as normal elements of the model, generate disincentives to exporters, productive entrepreneurs and contributes to a widening trade deficit. V-B. Implications of the Rising Debt Burden: Adjustment Patterns During the years when the Turkish economy was experiencing financial liberalization, inflation was accelerating. Average annual inflation (WPI) was 36.2% during 1981-84; but accelerated to 43.3, 62.3 and 90.6 percents during the 1985-88, 1989-93 and 1994-97 periods, respectively. With the diversification of investable assets under financial deepening, the most significant distributional outcome was an even faster acceleration of interest rates in nominal terms. While real returns on financial assets were registering an erratic, albeit rising pattern real interest rates on credits rose substantially. [See Önder, Türel, Ekinci and Somel (1993: Table V1.3)]. Regardless of the fluctuations in real interest rates, very high nominal interest rates generate trade-offs with other income categories. A rising share of interest

26
payments from value added (and gross profits) crowds out the share of either net profits or wages or both. This is what is observed from the consolidated balance sheets of the largest industrial firms during the post-1980 years. Starting from a negligible share, the interest payments/gross profits ratio exceeded the 50% threshold after 1982 and inevitably generated downward pressures on wages. On the other hand, a countervailing process of investing in short-term financial assets on the part of large holdings incorporating banks or of those with better liquid positions is being observed in recent years.10 However, this schizophrenic anomaly of firms acting partly as rentiers, partly as borrowers cum industrialists does not spread to middle and small producers. A second distributional incidence of financial liberalization is on the fiscal system via the crowding-out impact of the debt burden. The continuing expansion of the public debt under conditions of accelerating inflation and rising interest rates results in expanding the share of interest expenditures within public spending and within GDP. Adjustment processes involving crowding-out effects on specific expenditure categories are the outcome. When welfare-oriented public expenditures are involved in the crowding-out processes, directly adverse distributional impacts follow. Table V-1 provides the conceptual and empirical framework for an analysis of these adjustment processes. The table succinctly discloses the magnitude of the problem. Shares of interest payments on the public debt (Int) within GDP (Y) are presented in the first columns of the table. It is observed that the Int/Y ratio has grown by a coefficient of 9.2 between 1981 and 1996. The rising share of public expenditures within GDP is not translated into a relative expansion of real public services, i.e. non-interest expenditures, as reflected by the Gr/Y ratio which declines from 18.6 to 15.8 from 1981-82 to 1995-96 although there are ups and downs in-between.
If fiscal austerity to control public deficits will be exercised in response or as a reaction to higher interest burden, certain categories of real government expenditures will, necessarily, be crowded out. Three "crowding-out patterns" patterns (i.e on capital accumulation/infrastructure; on defense/ security/general services or on social spending) can be distinguished. After the return to the parliamentary regime, i.e. from 1984 onwards, it was to be expected that governments would be more willing to sacrifice the first two categories; rather than withdrawing from social spending.
(a) The first pattern involves letting higher interest payments to crowd-out
public investments (Ig) towards sustaining the economic infrastructure (EO). This is clearly documented by the continual erosion of �EO/Y� and �Ig/Y� ratios. Declines of nearly 4 percentage points within GDP of the two expenditure categories take place between 1981 and 1996.
10 Turkish car manufacturers suspended production and temporarily dismissed workers for a few months during the crisis period in mid-1994 and invested their working capital, i.e. wage funds on treasury bonds offering exorbitant interest rates. Their end-year balance sheets registered substantial losses on their productive activities, but even higher profits on their "auxiliary" (i.e. financial) activities. This is a typical case of interest-wage trade-off.

27
(b) The share of public spending on defense, security and general services (DSG) exhibits a definite declining trend between 1981-1990, but thereafter registers an upsurge, within GDP, essentially due to higher levels of security and military spending in response to the armed conflict in the South-East provinces. Allocational and (positive) welfare impacts directly follow, but there are also indirect distributional implications.
(c) Erosion of public spending on capital accumulation and maintenance of the
economic infrastructure did not offset rising debt servicing. This may require drifting further into lowering the relative magnitude of social public expenditures. Spending on education and health (EH) is a major component of what we have labeled as social public expenditures. There is no unique trend throughout the period. Three phases can be distinguished in terms of EH/G and EH/Y ratios: an erosion which starts in 1982 and lasts up till 1989; progression up till 1993, and further erosion up till the terminal year. However, rising (in non-uniform manner) G/Y ratios during the same period have prevented the emergence of lower EH/Y values by 1996 compared with 1981.
It is clear that the orthodox stabilization/adjustment phase of 1980-88 had led
to the erosion of real public expenditures and, in particular, social spending. Capital account liberalization has helped to stop and reverse this adverse trend. This signifies external savings in the form of short-term capital inflows crowding out public savings or, in other words, financing the expansion of public consumption during 1989-92. It is also significant to note that a stabilization of Int/Y ratios and falling Int/G ratios are observed up till 1992 essentially due to the fast expansion of real government spending.
Unfortunately this apparent "best of both worlds" (i.e. liberalization plus
higher real levels of public services) of the post-1988 years proved to be unsustainable by 1993 and the 1994 crisis reversed the pattern of the preceding years. The acceleration of the debt burden in terms of �Int/Y� ratio together with fiscal austerity, transformed the fiscal system, once again, into a regressive transfer mechanism in favor of the holders of the public debt, i.e. private banks, individual or wealthy rentiers, and against the public at large via both regressive taxation and the inflation tax. Paradoxically, it is the progression realized during the so-called "irresponsible populism" of the ultra-liberal post-1989 years that, despite orthodox stabilization following the 1994 crisis, the capacity of the fiscal system to generate socially oriented public services is still not below the early 1980s. VI. Conclusions on Social Policies: Conflicts, Contradictions and Options VI-A. The Turkish Pendulum Between Orthodoxy and Populism The foregoing sections depicted the distributional dynamics of the Turkish economy during a period, i.e. 1980-1998, shaped as elsewhere by globalization. A number of common features emerge. The first refers to the exogenous nature of distributional changes. Since the mid-1970s it is difficult to analyze distributional variables as endogenous changes responding to variations in externally determined or purely domestic macroeconomic variations. On the contrary, changes in income

28
distribution turn out to be exogenous shocks, either in favor of or against labor encompassing both urban wage-earners and peasant producers. Since the poverty-stricken population is predominantly located within the ranks of these two classes, the distributional pendulum can also be considered to involve changing relations between the poor and the rich. What are the factors behind these distributional shocks? We tend to see the state apparatus as the main explanatory factor in influencing the strategic policy decisions affecting income distribution. This portrays, in one sense, the distributional political cycle. However, it would be erroneous to characterize distributional dynamics as a purely political process. Of course changing macroeconomic conditions (e.g. domestic and international expansionary vs. contractionary phases; opening-up to trade and to financial flows) as well as market parameters (e.g. supply and demand elasticities of labor and of agricultural output) constrain and influence the distributional process. Nevertheless, during the past quarter of a century, the overall process of adjustment which determines the final outcome has almost always started with a distributional shock affecting both wage and TOTA movements either upwards or downwards. The favorable cycles in Turkey are populist phases. In understanding populism in Turkey, it may be useful to recall a well-known Turkish saying: "Only God Almighty can give without taking." The Turkish populism has historically been a continual attempt of government to find ways and means of violating this common wisdom during changing balance of forces in favor of popular classes, i.e. how to accommodate distributional demands by "giving to labor/the poor without taking from capital/from the rich." A typical case in point is the post-1989 years when the long (1981-88) phase of depressed wages and TOTA following the adverse 1980 shock inevitably had to come to an end. The "corrective" shock started when the Özal government was forced to concede a 141% wage rise to public sector workers when the rate of inflation was 75%. Substantial rises in civil servant salaries, in social spending from the budget, in farm subsidies followed suit. Private sector wages fell in line as well.
The "normal" (let us call it the "social democratic") adjustment in response to this distributional shock would have been by "taking from the rich", i.e. by a substantial increase of direct income and corporate taxation, a rescheduling of the domestic debt (i.e. some sort of a "wealth tax" on the holders of public debt instruments) and price controls (i.e. prevention of rising mark-ups in response to wage increases) on oligopolistic firms. However, the government opted for the "populist" adjustment, i.e. "giving without taking"� The "magic formula" for the implementation of the populist option in 1989 was the liberalization of the capital account. Capital inflows enabled the realization of rising rates of private consumption and public consumption (higher non-interest public spending) without any acceleration of the inflation rate. On the other hand high arbitrage gains for banks and higher mark-up rates for large-scale private manufacturing firms were also realized. This "marriage" of populism with capital account opening differs from orthodox stabilization and earlier experiences with structural adjustment when

29
regressive incomes policies was a necessary component of liberalization. Liberalization in this case does not meet the resistance on the part of organized labor and becomes compatible with democratic government. The experience may not be specific to Turkey. As elsewhere, the problem with this mode of "giving without taking", is its short-termism. Current account and/or public deficits sooner or later reach unsustainable levels. In the Turkish case it was the dramatic rise of PSBR to 12% of GDP in 1993, and the erratic reserve and current account movements which led to the sudden reversal of capital inflows in late 1993 culminating in the 1994 crisis. Orthodox crisis-management of 1994-95 as in 1980-81 represent the "other side of the coin", i.e. the antithesis of populism. Here, the costs of adjustment are shifted almost totally on urban wage earners and the peasantry. In 1994, the 6% decline in GDP plus the primary surplus of the current account attaining 5% of GDP (i.e. 11%) constituted the macroeconomic cost of crisis-management. It is interesting to note that both the decline in real wages of formal sector workers (27%) and in the real incomes per employed person from agriculture (16%) exceed the macroeconomic cost of adjustment by significant margins. This implies that certain groups within the bourgeoisie may, actually, have benefited from crisis conditions in absolute terms. Currently, relations of distribution appear to have stabilized following the adverse distributional shock. However, a "corrective" shock, this time favorable for labor is always on the agenda. All these involve a harsh and, for many households living in the thresholds of poverty, an inhuman response. There is, also, a longer-term solution which the Turkish bourgeoisie and international circles representing the Washington Consensus have been advocating consistently: de-politicization of the distributional process. This is part and parcel of the well-known structural adjustment program and, in the Turkish case, it involved moving towards flexibility in labor market arrangements and dismantling of pro-farmer interventions in agricultural markets. Taken as a whole, these so-called structural reforms aim at not only the elimination of populist deformations in the narrow sense of the term during the upward phase of the distributional cycle; but also of those institutional elements covering education, health and social security systems the totality of which is usually referred to as the welfare state. Efforts towards de-politicization of the distributional process and the gradual dismantling of the welfare state have never attained their full objective. One major reason was that they were too ambitious in the sense that their full implementation would signify a total reshaping of the Turkish society. Society or social forces have either delayed or rejected the permanent changes in the relations of distribution. However, in the welfare state aspects of the "reform" program, significant, albeit gradual, changes have been taking place. These changes can be referred to as increased scope in the market-based provision of public goods, i.e. education, health and social security. A brief overview will illuminate the issues at stake. The increasing scope of commercialization and/or private provision of education and health have been the dominant features of the period covered in this paper. Public spending on education and health services as a ratio of GDP has shown a downward trend up until 1989. On the other hand, between 1976 and 1983 the share of the private sector within total investment in education and health rarely exceeded

30
ten percent. Hence the early 1980s, years of orthodox stabilization, represent a phase when the rate of human capital formation in Turkey had declined significantly.
Two developments reversed this adverse trend. From 1994 onwards, thanks to
the generous incentives extended to private investors in education and health, entrepreneurs started to move into these sectors at a significant rate, and the private sector's share in total education and health investments reached the 50 percent benchmark by 1996-97. During the "populist" phase of the post-1988 years, public spending in the social sectors picked up and gradually approached the ratios of 1976-77.
These were, naturally, favorable developments. However, in terms of equity,
it has certain adverse implications as well. An expensive, modern and, in certain respects, luxurious system of private health care in part, supported by private health insurance schemes is servicing the upper classes whereas the population covered by social insurance schemes is using the resources of an over-extended public health system. Public hospitals have, to an increasing degree, started to commercialize their services as well by significantly extending the implementation of users' fees. Thus one witnesses an increasing and striking polarization in terms of the quality and quantity of health services extended to different segments of the population. A similar pattern has been emerging in the area of education. An elite system of higher education has, since the early 1980s, been emerging, essentially based on private universities and, to an increasing degree, on private high schools. At state universities and high schools, de facto users� fees have increased substantially; government scholarships no longer exist in practical terms; and credits extended to students are based on commercial interest rates. Apart from a few select ones, the majority of state universities are considered to be involved in mass production of degrees, albeit in areas with limited employment prospects.
In short, a market-based provision of education and health is generating a dual
system in human capital formation, contributing to further polarization between the children of the upper and lower echelons of Turkish society. Moreover, efforts to generate a primary surplus in the public budget has been a dominant feature of the new adverse cycle starting with the 1994 crisis resulting, once again, in the erosion of public spending in the social sectors.
Coming to social security, strong resistance on the part of the trade unions has, up until now, prevented the widespread implementation of privatization and commercialization of the component parts of the system. However, the sector faces very serious problems. Commensurate with the ongoing macroeconomic imbalances and the deterioration of public accounts, one witnesses a dramatic collapse of the fiscal accounts of the Turkish social security system. The system is characterized by a high level of evasion, low levels of pensions, and financial insolvency. 11 As of 1997, the combined cash deficits of the system reach 2.4% of GNP and it is expected to reach 10% by 2050 (ILO, 1995). Current actuarial balances of the system are in
11 On current problems of the Turkish social security system, see Lordoğlu (1999), Yeldan and Köse (1999), Teksöz (1998), Kenç and Sayan (1998), TÜSİAD (1997), Kenar, Teksöz and Coşkun (1996), and ILO (1995).

31
severe disequilibrium with 2.1 active registered employees per retired person. Estimates based on the 1985 census suggest, however, that the system can admit an actuarial rate of 9 to 1. Evidently, current problems of the Turkish social security system is independent of the so-called aging crisis faced by many OECD nations today; and instead, is directly related to the structural features, i.e. the scope of the marginalization/informalization of the labor market.
As narrated in more detail in section III, the responsibility rests with private
sector employment patterns and the ongoing process of privatization has aggravated the problem. Based on 1996 data, the average of actively insured persons to total employment barely exceeds one third within the private sector. Based on SIS data, our calculations reveal that, in the private sector, those under 19 years of age constitute 14% of total employment, and 83% of these workers have no social security coverage. (Yeldan and Köse 1999). The absence of an age-limit for retirement induces middle-aged pensioners to join the labor force again, this time in uninsured status. This generates significant inducement on employers to shift their labor demand towards younger employees and workers accepting employment outside social security coverage.
Clearly, the current social security system is unsustainable and is in need of
immediate reform. However, neither available private pension arrangements, nor the espoused securitization-based private financing schemes offer viable alternatives. Due to insufficient regulation and lack of formal supervision, the private health and life insurance sectors are characterized by cases of irregularities, high lapses, and unaccounted policy cancellations. Given the structural characteristics of the labor market, it is only fair to argue that a viable social security system reform cannot be meaningful without addressing the systematic evasion of employers due to the scope of the informalization of the labor market.
VI-B. Concluding Reflections on the Societal Implications of Globalization12
The societal impact of globalization has gone beyond quantifiable variables,
i.e. changes in income distribution and rising inequities in the social sectors, covered and analyzed in the foregoing sections. The dual processes of the liberalization of trade and of capital movements constitute globalization in its narrowly economic sense. On a broader perception, this economic duality necessitated �� a programme for destroying collective structures which may impede the pure market logic� (Bourdieu, 1998). In order to sanctify the power of the markets in the name of economic efficiency, this �infernal machine� requires the elimination of administrative or political barriers which limit the owners of capital in their quest for maximization of individual profit, which, in turn has been upheld as the supreme indicator of rationality (ibid). In the Turkish context, this economic duality appears to have also been accompanied by another duality the dissemination of Western consumption norms and cultural patterns plus the internationalization of the Turkish bourgeoisie. Consequently, life styles of the privileged minority of the Turkish society during the past two decades have increasingly resembled, and even become almost identical with the upper classes of Western societies. 12 This sub-section draws on Boratav, Türel and Yeldan (1996).

32
Finally, as elsewhere in the Third World, labor as the internationally
immobile factor is imprisoned within the national boundary during a period when pressure towards the de-politicization of the distributional process and the dismantling of the economic and social functions of the nation-state is exercised. Hence, urban and rural labor in Turkey is losing its capacity to influence the state in areas that affect the destinies of the underprivileged. If present trends continue, the state apparatus will gradually transform itself into an institution, merely endowed with repressive functions. Alienation, social exclusion, political indifference, withdrawal into individualized survival strategies is likely to be the outcome for the majority of the population. This is fertile ground for flowering of obscurantist, reactionary, ultra-nationalistic ideologies and violence. Since the early 1980s, the unstoppable progress of Islamic fundamentalism and fascistic political tendencies within the ranks of popular classes in Turkey can, in our view, be grasped only within this context.
While the destinies and even the interests of labor and the poor in the
developed and developing world are de-linked or even opposed to each other, life styles and interests between the bourgeoisie in the North and the South have been converging. At least in the Turkish case, we rarely observe conflicting views on socio-economic policy options between the Washington circles, international finance and the dominant, influential segments of the relatively wealthier classes. It would not be an exaggeration to suggest that "national" and increasingly nationalistic working classes are currently confronting the "International of Capital�. The class map of the nineteenth and early twentieth centuries is thus transformed into its opposite.
Let us therefore hope that the future, i.e. the twenty-first century, should not
resemble the immediate past, i.e. the last quarter of the twentieth century. And it is our task as social scientists to contribute towards the realization of this aspiration.

33
References Akyüz, Y (1990) �Financial System and Policies in Turkey in the 1980s� in T.
Arõcanlõ and D. Rodrik (eds) The Political Economy of Turkey New York: MacMillan.
Balkan, E. and E. Yeldan (1998) �Financial Liberalization in Developing Countries:
The Turkish Experience� in Medhora, R. and J. Fanelli (ed.s) Financial Liberalization in Developing Countries Macmillan Press.
Boratav, K (1995) Class Profiles from Istanbul and Anatolia (in Turkish), Istanbul,
Yurt Yayinlari-Tarih Vakfi, 1995. Boratav, K., O. Türel and E. Yeldan (1996) �Dilemmas of Structural Adjustment and
Environmental Policies under Instability: Post-1980 Turkey� World Development, 24(2): 373-393.
Boratav, K., O. Türel and E. Yeldan (1995) �The Turkish Economy in 1981-92: A
Balance Sheet, Problems and Prospects� METU Studies in Development 22(1): 1-36
Bourdieu, P. (1998) �The Essence of Neoliberalism� Le Monde Diplometique,
December. Bulutay, T (1995) Employment, Unemployment and Wages in Turkey, ILO/SIS,
Ankara. Dumanlõ, R (1997) Poverty and its Dimensions in Turkey (in Turkish). SPO, Ankara. Ekinci, N. (1998), �Growth and Crisis Dynamics in the Turkish Economy� (in
Turkish), Toplum ve Bilim No.77 (Summer), 7-27. Güneş, M (1991) �Concentration Criterias in Turkish Manufacturing Industry: 1985-
1989� (in Turkish), Research Symposium 91, State Institute of Statistics, Ankara.
Güneş, M; Köse, A. H. and E. Yeldan (1996) Concentration Trends in Turkish
Manufacturing Industry in Accordance with IO Table�s Sectoral Classification, (in Turkish), Ekonomik Yaklaşõm, 8(26): 33-47.
ILO (1995) Turkish Government Social Security and Health Insurance Project,
Undersecreteriat of Treasury, Ankara. Katõrcõoğlu, E (1990) Concentration in Turkish Manufacturing and The Factors
Determine Concentration: 1975-1988, (in Turkish) TÜSES, İstanbul.
34
Kaytaz, E; S, Altõn and M, Güneş (1993) �Concentration in Turkish Manufacturing Industry� (in Turkish), TMMOB Proceedings of the Congress on Industry Vol. 1, Chamber of Engineers, Ankara.
Kenar, N.; A.T. Teksöz and A.H. Coşkun (1996) �The Social Security System and
Reform Project� (in Turkish), Hazine Dergisi, August: 5-25. Kenç, T. and S. Sayan (1998) �Transmisson of Demographic Shock Effects from large
to Small Countries: An Overlapping Generations CGE Analysis� Bilkent University, Department of Economics Discussion Paper, No98-5.
Köse, A. H. and E. Yeldan (1998) �Turkish Economy in 1990s: An Assessment of
Fiscal Policies, Labor Markets and Foreign Trade� New Perspectives on Turkey, No: 18, Spring.
Köse, A. and A. Öncü (1998) �Anatolian Manufacturing Industry within the context
of world and Turkish economy: Are we at the threshold of getting rich or getting poor� (in Turkish), Toplum ve Bilim, No:77, No: 77 (Summer).
Lordoğlu, K. (1999) �Informal Employment and The Social Security Problem� (in
Turkish) İktisat, İşletme ve Finans, February, No 14(155): 68-82. Önder, I; Türel, O; Ekinci, N and C. Somel (1993) Public Finance, Financial System
and Policies in Turkey, Istanbul, Tarih Vakfi Yurt Yayinlari, Table V-1.3. Pieper, U. (1998) �De-Industrialization and Social and Economic Sustainability:
Cross-Country Evidence on Productivity and Employment� CEPA Working Paper, March.
Syrquin, M. (1986) �Productivity Growth and Factor Reallocation�, in Chenery, H.,
Robinson, S. ve Syrquin, M. (1986) (Ed) Industrialization and Growth: A Comparative Study� London: Oxford University Press
Şenses, F. (1994) �Labour market response to structural adjustment and institutional
pressures: The Turkish Case�, METU Studies in Development 21(3). Şenses, F. (1996) �Structural Adjustment Policies and Employment in Turkey�,
METU, Economic Research Center, Research Report No. 96/01. Tekeli, İ; S, İlkin; A, Aksoy ve Y, Kepenek (1982) Türkiye'de Sanayi Kesiminde
Yoğunlaşma, Ekonomist Yayõnevi. Teksöz, T. (1998) �Simulation of Benefits from Money Purchase Pension Scheme for
Turkey� Unpublished MS Thesis submitted to City University, London. TÜSİAD (1997) �Restructuring in Turkish Social Security System� (in Turkish),
October.

35
UNCTAD (1997) Trade and Development Report, United Nations, New York and Geneva.
Yeldan, E. and A. Köse (1999) �Problems of the Turkish Social Security System and
Their Impact on Growth and Accumulation� (in Turkish) Friedrich Ebert Stiftung, İstanbul.
Yeldan, E. and A. Köse (1998) �An Assessment of The Turkish Labor Market Against
its Macroeconomics Policies�, The Burdens Related with Turkish Labor Markets and Policies, Edited by T. Bulutay, forthcoming, State Institute of Statistics, Ankara.
Yeldan, E. (1995) �Surplus Creation and Extraction under Structural Adjustment:
Turkey, 1980-1992� Review of Radical Political Economics, 27(2): 38-72, June.
Yentürk, N. (1997) Wage, Employment and Accumulation in Turkish Manufacturing
Industry, (in Turkish), Friedrich Ebert Stiftung, İstanbul.

Post-Crisis Adjustment
Export-Led Growth Exhaustion
Unregulated Financial
LiberalizationFinancial
CrisisPost Crisis Adjustment
1981-82 1983-87 1988 1989-93 1994 1995-97
I. Production and Accumulation (Real Rate of Growth, %) GDP 4.2 6.5 2.1 4.8 -5.5 7.2 Agriculture 0.6 0.8 7.8 0.1 -0.7 1.3 Manufacturing 7.9 8.6 1.6 6.0 -7.6 9.8 Commerce 7.7 9.1 3.5 5.4 -7.6 8.7 Financial Services 2.5 2.6 4.4 0.5 -1.5 3.0Fixed Investment: Private -5.3 12.3 12.6 11.5 -9.1 13.6 Public 0.2 10.3 -20.2 4.3 -34.8 9.0 Manufacturing -5.1 2.1 -4.8 6.3 -4.7 6.7As % Share of GNP: Savings 17.7 19.5 27.2 21.9 23.0 20.7 Investment 18.3 20.9 26.1 23.7 24.4 24.8 Public S. Borrowing Req. 3.7 4.7 4.8 9.1 7.9 7.9
II. Distribution and Prices Inflation Rate (CPI) 33.2 39.5 75.4 66.4 106.3 83.2Depreciation of TL/US$ 45.0 39.7 66.0 50.4 170.0 68.9Real Interest Rate
on Government Bondsa -- -- -5.8 10.5 20.5 24.9Real Wages Growth Rate: Private Manufacturingb 0.4 -1.5 -5.7 10.0 -30.1 0.0 Public Manufacturing -0.4 -5.9 -7.8 20.3 -18.1 -6.8Average Mark-up Rate in
Private Manufacturing (%) 31.0 32.6 38.0 39.6 47.0 41.1
III. InternationalizationMan. Exports Growthc 19.7 12.5 14.0 5.1 18.0 6.3As % Share of GNP: Imports 14.0 15.9 15.8 14.6 17.8 22.7 Exports 8.5 10.8 12.8 9.1 13.8 13.0 Current Account -2.7 -1.9 -1.7 -1.3 -2.0 -2.6 Foreign Debt 27.1 37.8 44.8 35.1 50.1 42.7
b. Private manufacturing labor data pertain to the enterprises employing 10 and above workers.c. Annual growth rate in manufacturing exports (in millions US $).
Table I-1. Phases of Macroeconomic Adjustment in Turkey, 1980-1997
a. Annual average of Compounded Interest Rate on Government Debt Instruments deflated by the whole sale price index.
Sources: SPO Main Economic Indicators; Undersecretariat of Foreign Trade and Treasury Main Economic Indicators; SIS Manufacturing Industry Surveys.

Decline in wage costs
Costs of public sector Debt Financing
deficits

Figure I-2. Real Wage Earnings, Wage Costs and Profit Margins in Turkish Private Manufacturing
0.10
0.15
0.20
0.25
0.30
0.35
0.40
0.45
0.50
1980 1981 1982 1983 1984 1985 1986 1987 1988 1989 1990 1991 1992 1993 1994 1995
Mar
k-U
p R
ate
100.0
300.0
500.0
700.0
900.0
Rea
l Wag
e C
osts
(198
0 Pr
ices
, Tho
usan
ds T
L)
Mark-up Rate
Real Wage Costs
Real Wage Earnings
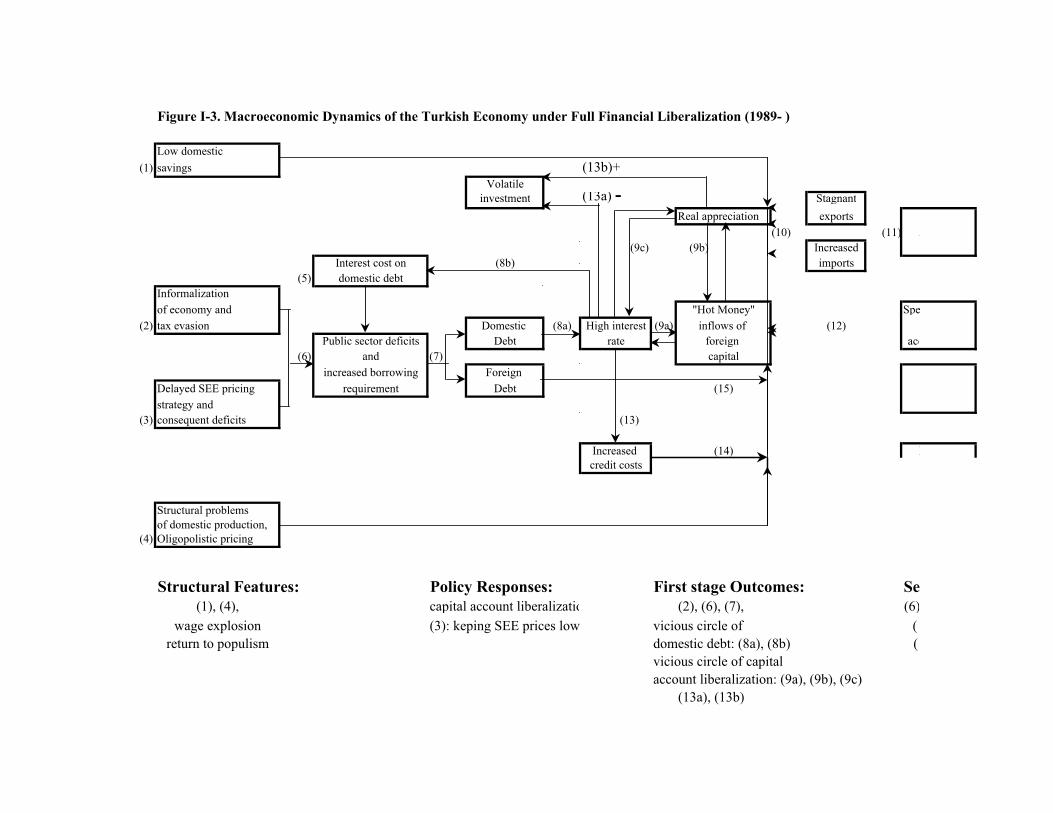

Figure I-4. Dynamics of Accumulation, Labor Market Equilibrium and Foreign Balances
output and accumulation
r'r
D r'' LF'
LF
D'
Dr' D'
CA deficit r r'' Lformal
LM
increased
LM'
Lmarginal
marginalization
1989-93

Table II-1: Employment Status and Average Real Labor Costs in Manufacturing Industry, 1980-1995.1980 1985 1990 1992 1993 1994 1995
Total Employment (in thousands)1 2150 2440 2741 3085 2766 3034 2942 1. Employer and Self Empoyed 2 445 505 556 686 547 652 584 2. Total Labor Employment 1705 1935 2185 2399 2219 2382 2358 Formal (Registered) Labor 3 1005 1186 1284 1254 1258 1212 1274 Public 287 276 250 228 214 197 170 Private, Employing 10+ workers 500 652 774 752 761 736 802 Private, Employing "1-9" workers 218 258 260 4 274 283 279 302 Marginal (Unregistered) Labor 5 700 749 901 1145 961 1170 1084Monthly Average Real Labor Cost, (1980, Thousand TL) 6
Public 39.000 26.727 45.328 79.738 72.501 57.150 55.349 Private, Employing 10+ workers 25.480 22.696 32.542 40.103 43.287 33.300 28.311 Private, Employing "1-9" workers 6.743 9.324 9.367 10.100 9.004 6.491 6.654 Weighted Average Formal Real Wage Rate (WAVG) 25.276 20.725 30.339 40.754 40.544 31.005 26.785Memo: Small Private Firms ("1-9 workers") Wages/WAVG 0.267 0.450 0.309 0.248 0.222 0.209 0.248 Marginal Labor Wages/WAVG 0.218 0.367 0.252 0.245 0.219 0.207 0.246
(1) SIS, Household Labor Force Survey (HLFS).(2) SIS, HLFS: The values of 1980 and 1985 were calculated by taking into account the share of this group in total employment during 1992-1995.(3) SIS, Annual Manufacturing Industry Statistics: Annual Average Number of Employed.(4) Figure for 1990 is based on average estimates.(5) Defined as the difference between total employment and formal employment.(6) Deflated by the CPI.

Table II-2: Structural Characteristics of Manufacturing Sectors, 1980-1995.1980 1985 1990 1995
Sectors CR4Mark-
up Rates
Share of Labor Cost at Value Added
Share of Foreign Trade at Domestic Productio
n
Share of Public
EnterprisesSectors CR4
Mark-up
Rates
Share of Labor Cost at Value Added
Share of Foreign Trade at Domestic Productio
n
Share of Public
EnterprisesSectors CR4
Mark-up
Rates
Share of Labor Cost at Value Added
Share of Foreign Trade at Domestic Productio
n
Share of Public
EnterprisesSectors CR4
Mark-up
Rates
Share of Labor Cost at Value Added
Share of Foreign Trade at Domestic
Production
Share of Public
Enterprises
Competitive Sectors Competitive Sectors Competitive Sectors Competitive SectorsDomestic Oriented Sectors Domestic Oriented Sectors Domestic Oriented Sectors Domestic Oriented Sectors
311 10.21 0.21 0.36 0.10 0.29 321 7.56 0.31 0.11 0.36 0.10 321 8.88 0.38 0.31 0.36 0.09 322 5.31 0.28 0.22 0.45 0.01321 12.71 0.31 0.47 0.13 0.13 311 12.17 0.21 0.07 0.25 0.19 311 12.65 0.26 0.31 0.18 0.22 311 14.11 0.36 0.22 0.36 0.15383 14.98 0.36 0.36 0.25 0.03 331 13.32 0.20 0.10 0.49 0.32 381 16.19 0.45 0.29 0.32 0.03 312 17.39 0.06 0.76 0.34 0.16381 16.25 0.40 0.33 0.31 0.06 323 14.68 0.26 0.06 0.24 0.00 312 18.87 0.17 0.37 0.20 0.33 381 17.64 0.48 0.19 0.43 0.03369 17.00 0.44 0.31 0.08 0.23 381 15.24 0.37 0.13 0.39 0.07 331 18.96 0.24 0.37 0.11 0.30 369 19.10 0.69 0.19 0.19 0.06331 19.89 0.29 0.42 0.03 0.31 369 17.59 0.41 0.12 0.16 0.24 352 20.10 0.50 0.23 0.23 0.02 352 20.63 0.61 0.17 0.38 0.01352 21.19 0.27 0.30 0.09 0.03 356 20.06 0.22 0.08 0.09 0.00 369 20.39 0.67 0.27 0.17 0.19 356 21.63 0.39 0.17 0.32 0.01323 21.64 0.14 0.52 0.01 0.00 312 22.87 0.16 0.06 0.09 0.45 356 22.15 0.32 0.28 0.08 0.01 341 24.61 0.41 0.21 0.44 0.22312 22.10 0.17 0.47 0.16 0.51 352 23.00 0.43 0.08 0.22 0.03 341 25.21 0.37 0.34 0.25 0.36 Trade Oriented Sectors356 25.44 0.28 0.29 0.01 0.02 383 27.75 0.37 0.09 0.53 0.05 Trade Oriented Sectors 371 7.27 0.37 0.23 0.64 0.24
Trade Oriented Sectors Trade Oriented Sectors 323 24.76 0.21 0.34 0.63 0.00 321 21.03 0.23 0.35 0.75 0.02322 21.33 0.21 0.42 0.66 0.01 322 14.71 0.25 0.08 1.69 0.00 322 5.74 0.29 0.28 0.80 0.01 323 21.32 0.54 0.20 0.71 0.06
Monopolistically Competitive Sectors 383 28.06 0.55 0.23 1.75 0.02Domestic Oriented Sectors Domestic Oriented Sectors Domestic Oriented Sectors 390 28.35 0.22 0.27 0.50 0.05
384 35.84 0.21 0.54 0.26 0.18 342 37.34 0.45 0.12 0.10 0.05 313 33.29 1.14 0.13 0.02 0.39342 36.47 0.19 0.55 0.02 0.10 341 37.92 0.34 0.09 0.18 0.52 324 37.60 0.18 0.52 0.15 0.26 Domestic Oriented Sectors332 37.56 0.31 0.36 0.05 0.00 324 43.02 0.17 0.17 0.17 0.35 371 38.77 0.15 0.47 0.46 0.36 331 32.65 0.37 0.23 0.23 0.10390 42.28 0.45 0.35 0.26 0.00 313 47.68 1.54 0.08 0.04 0.56 342 41.85 0.58 0.26 0.06 0.07 313 33.84 0.66 0.14 0.06 0.19314 46.43 0.28 0.54 0.00 0.90 372 49.52 0.19 0.09 0.38 0.34 384 46.26 0.32 0.34 0.38 0.04 324 38.62 0.42 0.24 0.44 0.09372 47.19 0.30 0.39 0.13 0.37 Trade Oriented Sectors 362 49.61 0.63 0.33 0.27 0.02 332 40.65 0.50 0.19 0.30 0.00341 47.37 0.19 0.55 0.12 0.54 384 34.37 0.28 0.11 0.52 0.08 332 49.83 0.45 0.24 0.16 0.00 Trade Oriented Sectors
Trade Oriented Sectors 371 39.01 0.21 0.07 0.57 0.40 Trade Oriented Sectors 384 40.78 0.36 0.26 0.68 0.02382 33.44 0.25 0.48 0.53 0.22 351 34.98 0.22 0.07 0.97 0.39 383 31.48 0.43 0.27 0.55 0.01 382 43.22 0.44 0.21 1.36 0.06351 49.20 0.47 0.23 0.74 0.50 382 39.22 0.24 0.13 1.14 0.20 390 32.43 0.57 0.29 0.77 0.03 372 43.99 0.36 0.26 0.67 0.23385 32.16 0.42 0.33 4.85 0.00 385 34.48 0.26 0.14 9.61 0.06 382 43.22 0.44 0.28 1.04 0.09 Oligopolistic Sectors
Oligopolistic Sectors Oligopolistic Sectors 385 41.25 0.48 0.35 3.81 0.16 Domestic Oriented SectorsDomestic Oriented Sectors Domestic Oriented Sectors Oligopolistic Sectors 362 57.54 0.72 0.26 0.35 0.00
354 54.70 0.53 0.12 0.01 0.14 361 57.93 0.50 0.23 0.22 0.11 Domestic Oriented Sectors 342 58.81 0.26 0.24 0.07 0.03371 54.76 0.22 0.49 0.17 0.53 332 58.96 0.80 0.07 0.24 0.42 372 53.02 0.35 0.30 0.41 0.24 361 61.04 1.00 0.18 0.12 0.06313 55.80 1.17 0.19 0.01 0.57 362 61.02 0.52 0.13 0.32 0.00 314 57.97 0.83 0.18 0.16 0.82 354 61.23 0.52 0.12 0.00 0.13324 63.18 0.19 0.53 0.00 0.39 314 70.16 1.41 0.09 0.04 0.84 361 64.23 1.10 0.21 0.08 0.05 351 61.29 0.54 0.16 1.14 0.44355 71.49 0.40 0.28 0.06 0.00 355 71.99 0.42 0.07 0.19 0.00 355 68.55 0.51 0.31 0.24 0.02 314 69.22 0.63 0.21 0.26 0.61362 72.11 0.68 0.33 0.16 0.00 354 73.50 0.15 0.02 0.06 0.08 354 84.32 0.17 0.15 0.03 0.04 355 76.22 0.70 0.21 0.41 0.02361 79.56 0.72 0.39 0.02 0.18 353 100.00 0.37 0.00 0.11 1.00 353 97.43 0.96 0.02 0.09 1.00 353 98.33 1.14 0.02 0.13 1.00353 100.00 0.37 0.05 0.20 1.00 Trade Oriented Sectors Trade Oriented Sectors Trade Oriented Sectors
390 51.14 0.64 0.10 0.63 0.00 351 53.53 0.40 0.26 0.89 0.41 385 55.92 0.63 0.15 1.69 0.04
Monopolistically Competitive SectorsMonopolistically Competitive Sectors
Monopolistically Competitive Sectors

Table II-3. Decomposition of Total Labor Productivity in Aggregate Manufacturing Industry, 1981-1996
Sectors
Increase in Labor
ProductivityIncrease in Real
OutputIncrease in
Employment
Share of Sectoral
Production in Aggregate
Manufacturing
Share of Sectoral Employment in
Aggregate Manufacturing
Pure Productivity
GainsReallocation of
LaborFood Processing 1.263 1.005 -0.114 0.175 0.215 0.196 0.026Textiles, Clothing 0.890 2.432 0.816 0.125 0.256 0.203 -0.289Forestry Products 3.350 4.828 0.340 0.009 0.021 0.040 -0.010Paper Products 2.143 2.209 0.021 0.024 0.035 0.053 -0.001Chemicals 0.523 0.765 0.159 0.372 0.085 0.226 0.034Soil Products 1.042 1.302 0.127 0.066 0.074 0.078 -0.009Metals 1.019 0.435 -0.289 0.075 0.097 0.055 0.031Machinery 1.619 2.129 0.194 0.151 0.211 0.291 -0.048Other Manufacturing 0.975 2.446 0.745 0.002 0.005 0.004 -0.005
Memo: Total increase in labor productivity in aggregate manufacturing between 1981-1996 = 0.874.
Contributions to Aggregate Productivity due to:

Figure II-1: Patterns of Real Wage Costs in the Manufacturing Industry, 1980-1995.
0
10
20
30
40
50
60
70
80
90
1980 1981 1982 1983 1984 1985 1986 1987 1988 1989 1990 1991 1992 1993 1994 1995
Public SectorPrivate Sector (10-49 persons)Private Sectors (500+)Minimum Legal WageMarjinal/Unregistered Labor Cost

TABLE III-1 COMPETITIVENESS DETERMINANTS IN MANUFACTURING INDUSTRY, AVERAGE ANNUAL GROWTH RATES FOR SUB-PERIODS
Wr,WPI LP RER CI X/GNP,%1981-84 -5.2 -3.1 6.8 117.9 9.31985-88 3.9 13.8 5.2 194.2 11.71989-93 15.2 10.3 -4.6 113.9 9.51994-97 -2.4 -7.7 4.4 152.4 13.3(1994-95) -19.4 -2.0 -13.0 162.8 13.4(1996-97) 5.3 -13.0 9.7 131.5 13.3
Notes: Calculations by the authors from SIS data (Manufacturing Industry Censuses for 1981-1994; Manufacturing Industry Surveys for 1995-97). Wr: Real wages: Annual wages per worker in manufacturing industry deflated by WPI. LP: Labor Productivity: Value-added (for 1995-97, gross output) per worker in 1981 prices. RER: Real exchange rate: 1 US dollar+1.5 DM deflated by WPI (hence, rising RER corresponds to real depreciation of TL). CI: Competitiveness index=(Labor productivity*RER)/Real wages, all in index numbers. X: Exports. The last six rows for the first three columns are annual growth rates between the terminal year of the specified sub-period and the terminal year of the preceding sub-period except for the 1981-84 in which 1981 is taken as the base year. The last six rows for the last two columns are average values for the covered sub-periods. 1994-97 and 1996-97 figures refer to 1994-96 and 1996 respectively when 1997 values are unavailable.

TABLE III-2: PATTERNS OF COMPETITIVENESS BY SUB-PERIODSg(wr),WPI g(lp) g(rer)
1981-84 - - + + +1985-88 + ++ + + +1989-93 + ++ - - -1994-97 - - + + +(1994-95) - - + + +(1996-97) + - + - -
NOTE: See Table II-1. g denotes growth rates and D differentials in index numbers or percentage points. Periods covered in calculating g and D values are as in NOTE to Table II-1. + and - represent positive and negative values. ++ in column two represent g(lp)>3.5%.
)(CI∆ )/( GNPX∆

TABLE III-3: DISTRIBUTIONAL VARIABLES BY SUB-PERIODSTOTA(1980=1.0) g(wr),CPI g(lp)-g(wr),WPI g(emp)
1981-84 0.892 -3.5 8.2 3.11985-88 0.841 -2.0 9.3 3.11989-93 0.849 13.2 -10.5 -0.71994-97 0.993 -7.8 2.1 1.9(1994-95) 0.893 -17.7 17.2 -0.3(1996-97) 1.094 3.2 -22.6 6.3
TABLE III-4: DISTRIBUTIONAL PATTERNS BY SUB-PERIODSD TOTA g(wr),CPI g(lp)-g(wr),WPI g(emp)
1981-84 - - + +1985-88 - - + +1989-93 + ++ - -1994-97 + - + +(1994-95) - -- ++ -(1996-97) + + -- ++
Note I: TOTA is terms of trade for agriculture calculated from the ratios of implicit deflators for agriculture and for industry. Source: SIS, National Accounts.Column 2 is nominal wages deflated by CPI. See Table III-1 for other columns
Note II: D TOTA represents the sign of the differential between the average of the specified sub-period and that of the terminal year of the preceding sub-period. For 1981-84 the comparison is between the sub-period averageand 1980.

TABLE IV-1: PERCENTAGE DISTRIBUTION OF INCOME TYPES OF HOUSEHOLDS: THE LOWEST TWO INCOME BRACKETS AND TURKISH AVERAGES, 1987
The Poor: Turkey
The Poor: Urban
The Poor: Rural
Average Turkey
Average Urban
Average Rural
Wages 35.6 50.4 25.1 23.3 28.8 15.2Farming 25.1 2.1 41.3 22.8 2.7 51.9Trade & Services 6.8 9.1 5.4 20.3 24 14.8Artisanal, Industry 2.1 2.7 1.8 8.2 11.3 3.7House Rents 2.1 1.9 2.2 3.5 4.3 2.4Interest & Dividends 0.7 0.8 0.6 1.8 2.8 0.4Transfers, Official 12.1 16.8 8.8 8.1 10.2 5Transfers, Abroad 0.5 1 0 1.5 1.8 1.2Transfers, Other 3.2 3.1 3.2 1 1.1 0.9Income in Kind 11.8 12.1 11.6 9.5 13 4.5TOTAL 100 100 100 100 100 100
NOTES: Sources: State Institute of Statistics (SIS), Income Distribution, 1987. The lowest two brackets cover 0-99999 TL monthly incomes. This group covers 14.3, 10.4 and 18.5 percents of overall (Turkish), urban and rural households respectively and the income share of the same groups are 3.2, 2.3 and 4.6 percent of the overall (Turkish), urban and rural incomes. Rows 2-4 are defined as "entrepreneurial income" and official transfers include pensions and social assistance payments.

TABLE IV-2: POVERTY IMPACT OF RELATIVE PRICE MOVEMENTSCotton/food Sunflower/fooTobacco/foodWheat/food CPI/food
1978/79 1.00 1.00 1.00 1.00 1.001983 1.25 1.44 0.77 1.17 1.011988 0.84 1.15 0.91 0.89 0.951993 0.65 1.42 0.41 0.92 0.911995 0.77 -- 0.92 0.87
Notes: Data from SIS. In the first four columns the coefficients are the ratios between index numbers of prices receive by farmers and the "food" item of CPI (1978-79=1.00). The fifth column is self-explanatory. Values below unity represent poverty-augmenting relative price changes after 1978/79.

TABLE IV-3: RELATIVE WAGE MOVEMENTS BY INDUSTRIES, 1983-93 (Annual Wages per Worker; Industrial Average/Manufacturing Average)
Priv/Public Small/Large Mining Gas Clothing Trade etc1981 0.63 0.26* 0.411982 0.67 0.471983 0.78 -- 1.27 0.53 --1984 0.84 1.1 1.31 0.54 --1985 0.91 0.41 0.95 1.67 0.49 --1986 0.91 0.97 1.53 0.58 0.891987 --- 0.92 1.35 --- 0.921988 0.91 0.87 1.23 0.59 0.791989 0.71 1.03 1.02 0.52 0.631990 0.73 0.29 1.18 1.9 0.47 0.651991 0.64 1.32 1.51 0.41 0.471992 0.59 0.25 1.4 1.35 0.39 --1993 0.55 0.21 1.78 2.14 0.39 --1994 0.47 0.19 -- -- 0.4 --1995 --- 0.24 --- --- --- --
Notes: SIS, Labour Statistics , 1996 except for Columns 1, 2 and 5 which is from SIS data. The first column equals average private wages divided by average wages in public enterprises in manufacturing industry. The second column equals average wages in large (10+ workers) enterprises divided by average wages in small (1-9 workers) enterprises in private manufacturing industry. The rest compares average wages of the relevant branch to those in manufacturing The last column covers trade, restaurants, hotels and miscellaneous services.

TABLE V-1: FISCAL ADJUSTMENT: INTEREST PAYMENTS, MAJOR EXPENDITURE CATEGORIES AND PUBLIC DEFICITS (% OF GDP)
Int/Y EH/Y DSG/Y EO/Y Ig/Y G/Y Gr/Y PSBR/Y1981 1.1 3.2 11.5 4.1 3.9 20.0 18.9 4.01982 0.8 3.3 11.6 4.4 3.2 19.1 18.3 3.51983 1.5 3.0 10.0 4.3 3.4 18.8 17.3 4.91984 2.0 2.6 8.8 4.0 3.1 17.2 15.2 5.41985 1.9 2.3 7.3 3.8 2.9 15.4 13.4 3.61986 2.6 2.3 7.2 4.1 3.2 16.3 13.7 3.71987 3.0 2.6 7.8 3.8 2.7 17.1 14.1 6.11988 3.9 2.5 7.1 3.1 2.1 16.6 12.7 4.81989 3.6 3.3 7.1 3.1 1.7 17.1 13.5 5.31990 3.6 4.1 6.5 3.2 1.7 17.4 13.9 7.41991 3.8 4.5 8.6 4.0 1.9 21.0 17.2 10.21992 3.7 5.0 8.0 3.9 1.7 20.6 16.9 10.61993 5.9 5.1 9.7 4.1 1.8 24.7 18.9 12.01994 7.7 3.9 8.8 2.8 1.3 23.3 15.6 7.91995 7.4 3.5 8.6 2.5 1.1 22.2 14.8 5.21996 9.0 3.7 10.1 2.8 1.6 26.8 16.7 9.0
Notes: Y: GDP, Gr: Non-interest public spending; PSBR: Public Sector Borrowing Requirement.