global warming: the science, the impacts and the politics
DESCRIPTION
Global Warming: the Science, the Impacts and the Politics. John Houghton University of California, Irvine 20 February 2003. The Science of Global Warming. Variations of the Earth’s surface temperature for the past 1,000 years. SPM 1b. The Greenhouse Effect. Long-wave radiation. - PowerPoint PPT PresentationTRANSCRIPT
Global Warming:
the Science, the Impacts
and the Politics
John Houghton
University of California, Irvine
20 February 2003

The Science of Global Warming
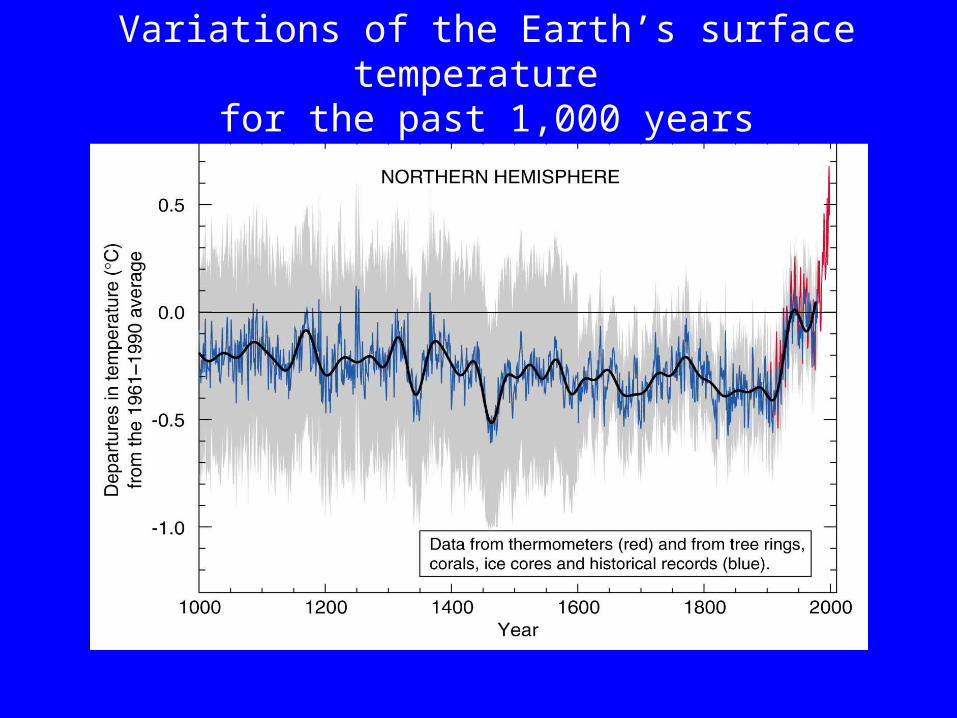
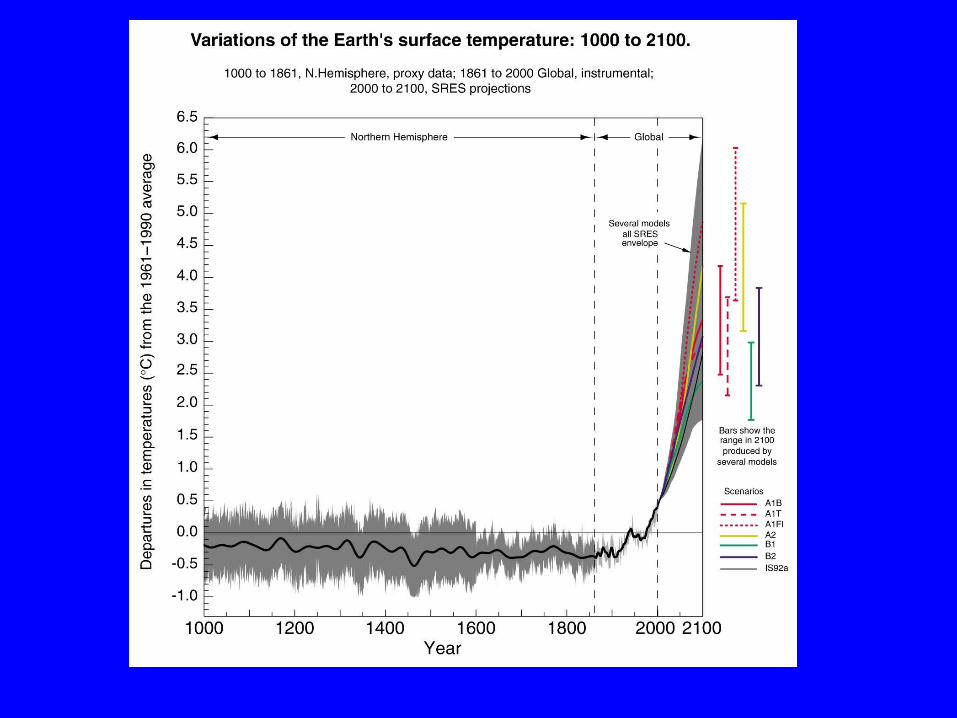
Variations of the Earth’s surface temperature
for the past 1,000 years
SPM 1b
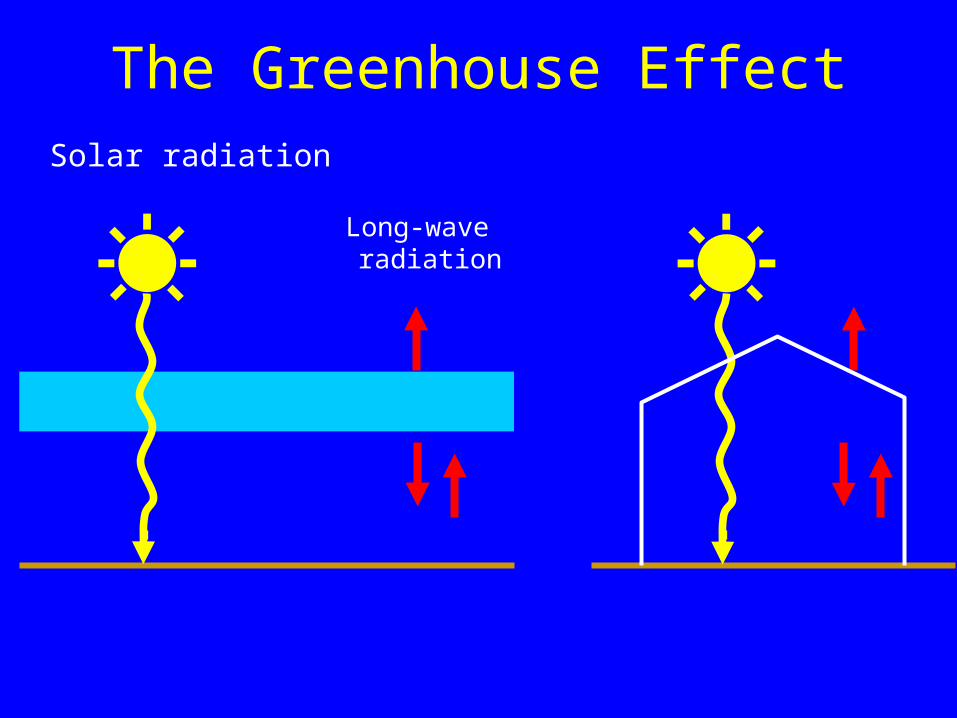
The Greenhouse EffectSolar radiation
Long-wave radiation
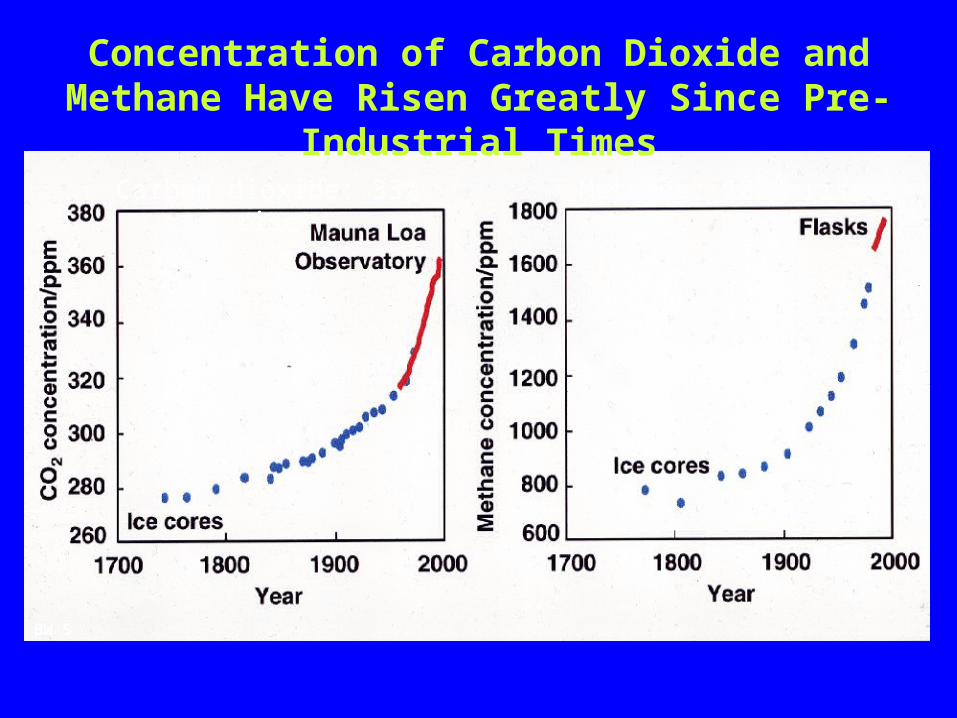
Concentration of Carbon Dioxide and Methane Have Risen Greatly Since Pre-
Industrial TimesCarbon dioxide: 33% rise Methane: 100% rise
The MetOffice. Hadley Center for Climate Prediction and Research.
BW 5
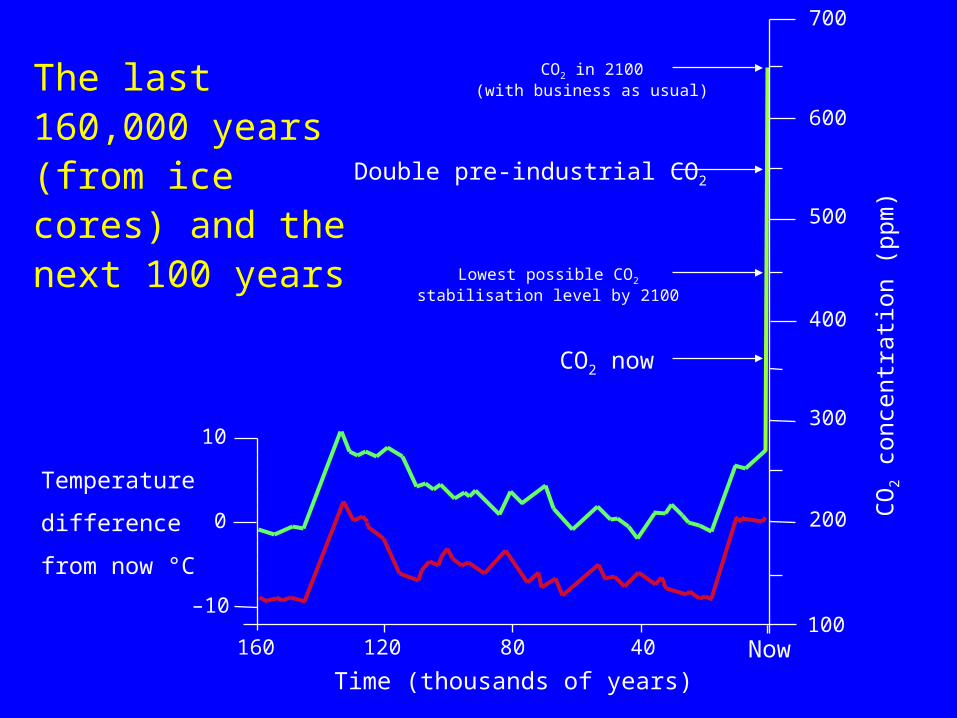
The last 160,000 years (from ice cores) and the next 100 years
Time (thousands of years)160 120 80 40 Now
–10
0
10
100
200
300
400
500
600
700
CO2 in 2100(with business as usual)
Double pre-industrial CO2
Lowest possible CO2
stabilisation level by 2100
CO2 now
Temperature
difference
from now °C
CO
2 c
once
ntr
ati
on
(ppm
)

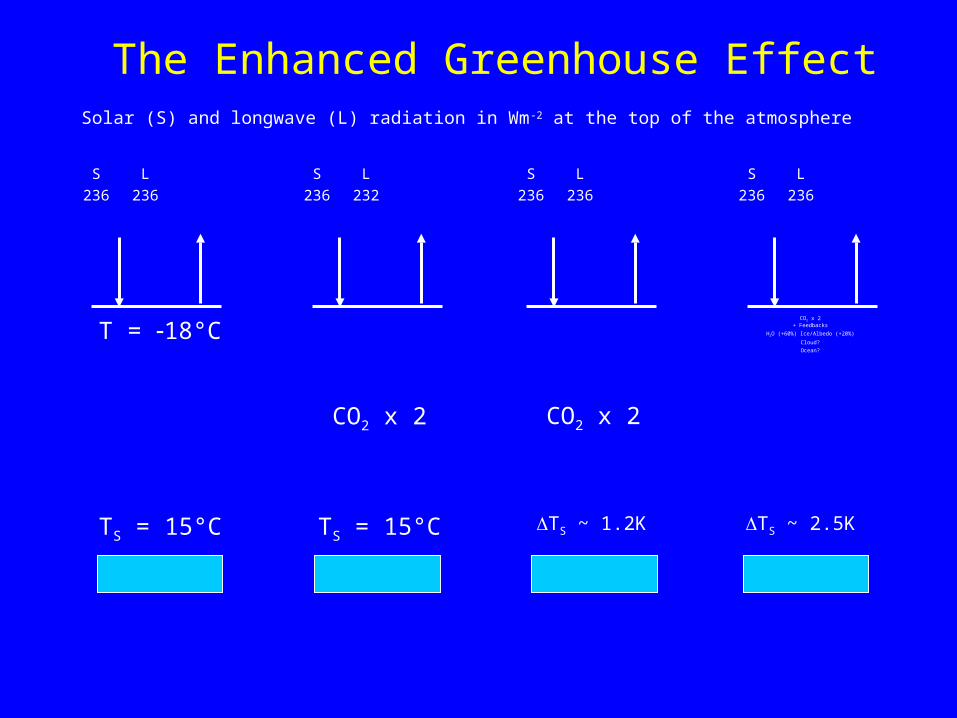
The Enhanced Greenhouse EffectSolar (S) and longwave (L) radiation in Wm-2 at the top of the atmosphere
S L
236 236
T = 18°C
S L
236 232
CO2 x 2
S L
236 236
CO2 x 2
S L
236 236
CO2 x 2+ Feedbacks
H2O (+60%) Ice/Albedo (+20%)
Cloud?Ocean?
TS = 15°C TS = 15°C TS ~ 1.2K TS ~ 2.5K
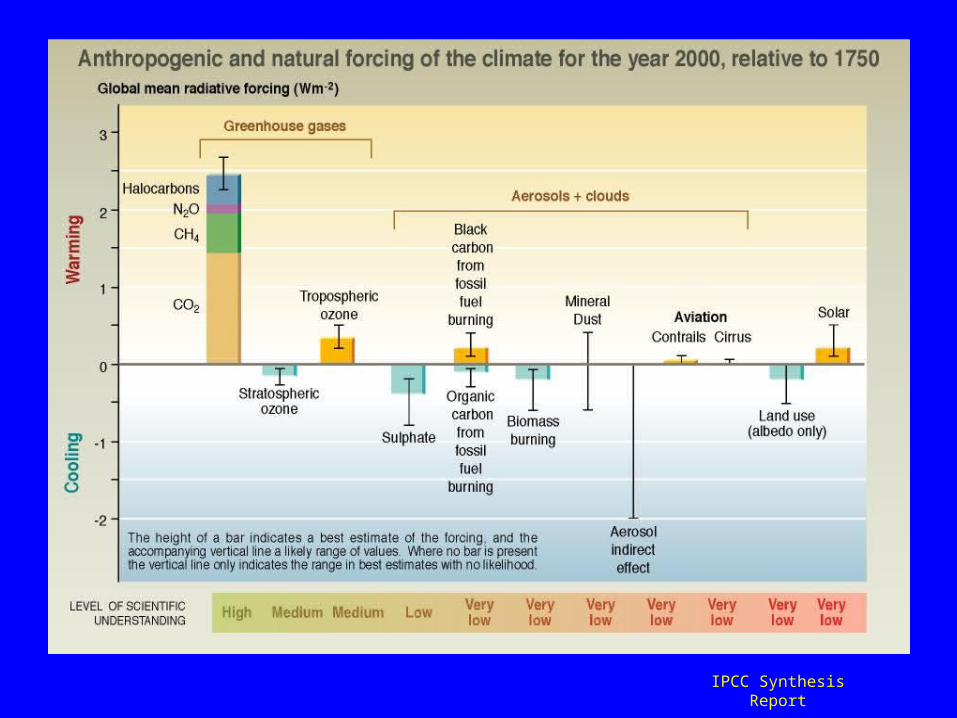
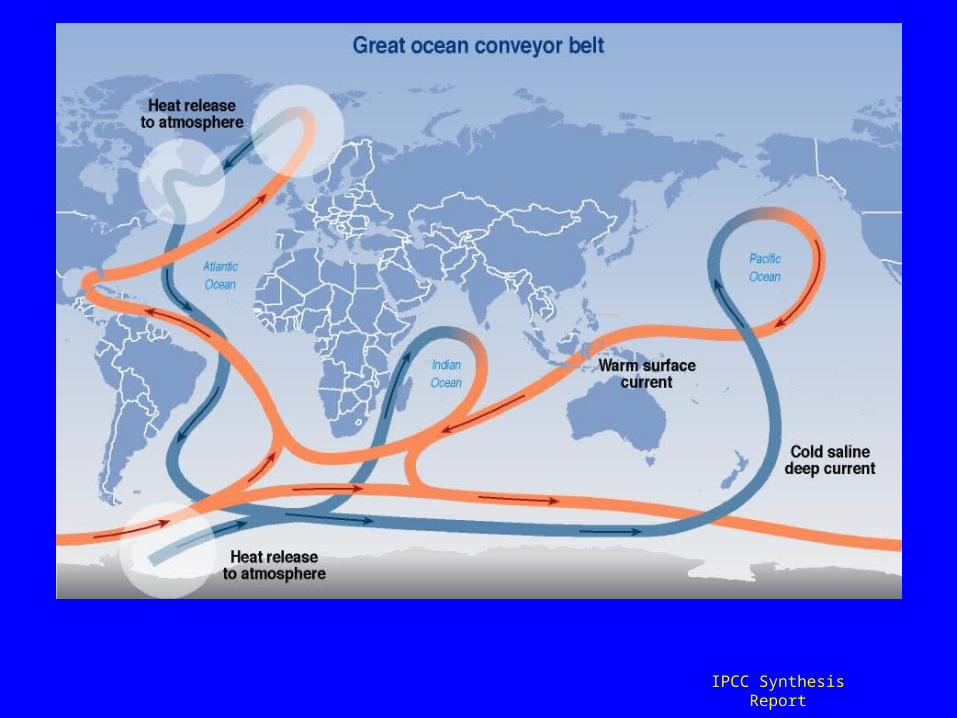
IPCC Synthesis Report

Estimated solar irradiance variations 1750-2000

Simulated annual global mean surface
temperatures
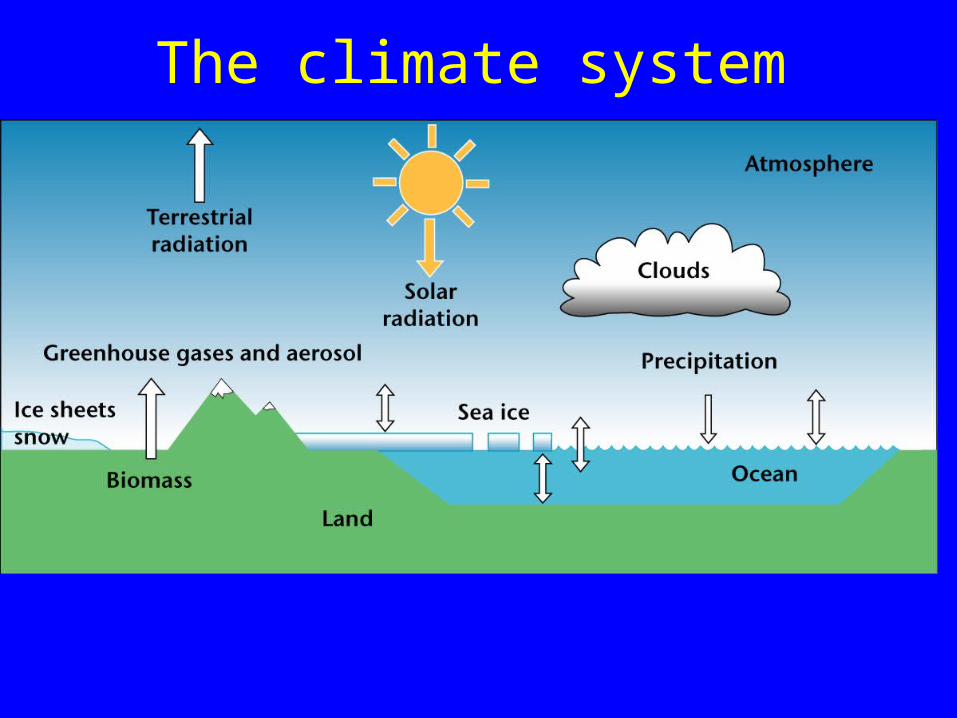
The climate system
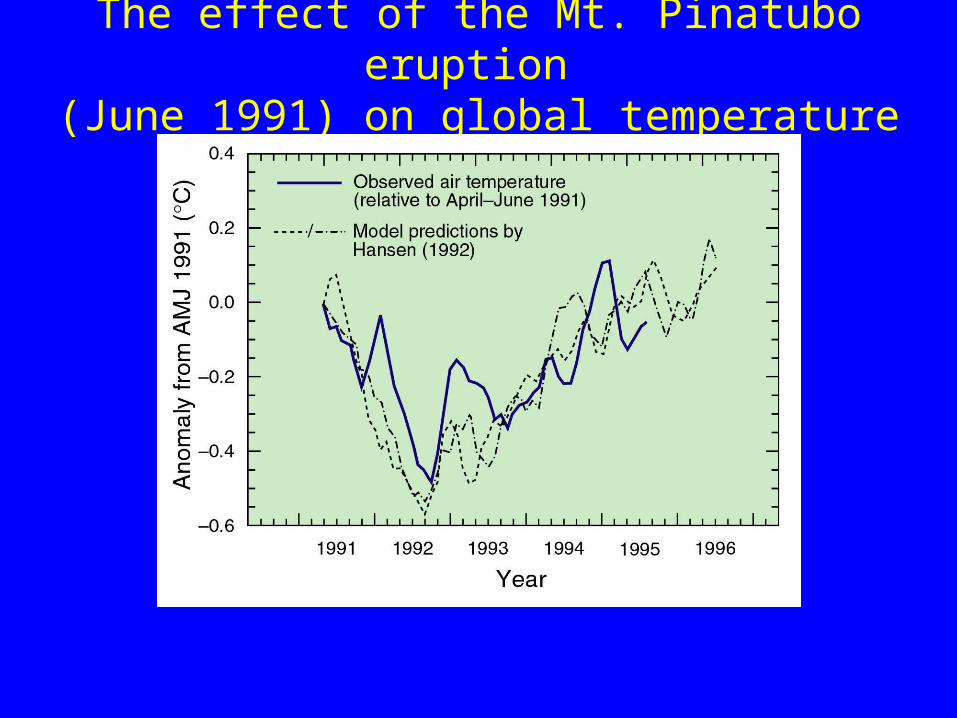
The effect of the Mt. Pinatubo eruption (June 1991) on global temperature

The Impacts ofGlobal Warming

Contributions to sea level rise (metres), 1990-2100
ESTIMATED FOR IS92a SCENARIO
Thermal Expansion 0.28Glaciers 0.16Greenland 0.06Antarctica –0.01 TOTAL 0.49

Sea-level transgression scenarios for Bangladesh
Adapted from Milliman et al. (1989).

People at Risk from a 44 cm sea-level rise by the 2080s
Assuming 1990s Level of Flood Protection

Projected changes in annual temperatures for the 2050s
The projected change in annual temperatures for the 2050s compared with the present day, when the climate model is driven with an increase in greenhouse gas concentrations equivalent to about 1% increase per year in CO2
The MetOffice. Hadley Center for Climate Prediction and Research.
BW 11
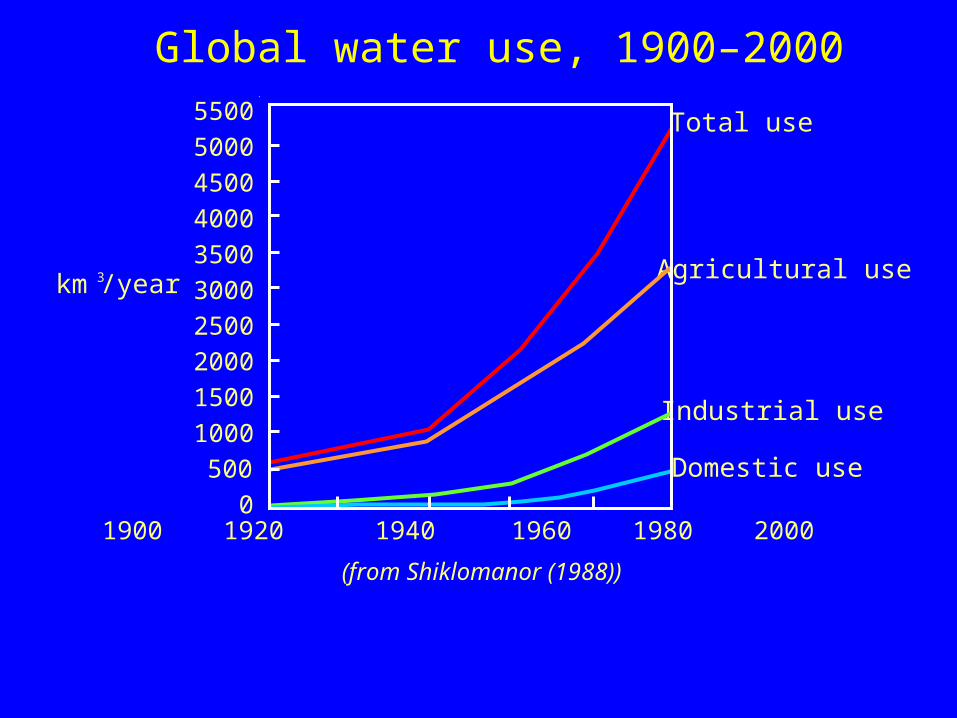
1900 1920 1940 1960 1980 2000
5500500045004000350030002500200015001000500
0
Total use
Agricultural use
Industrial use
Domestic use
km 3/year
(from Shiklomanor (1988))
Global water use, 1900–2000
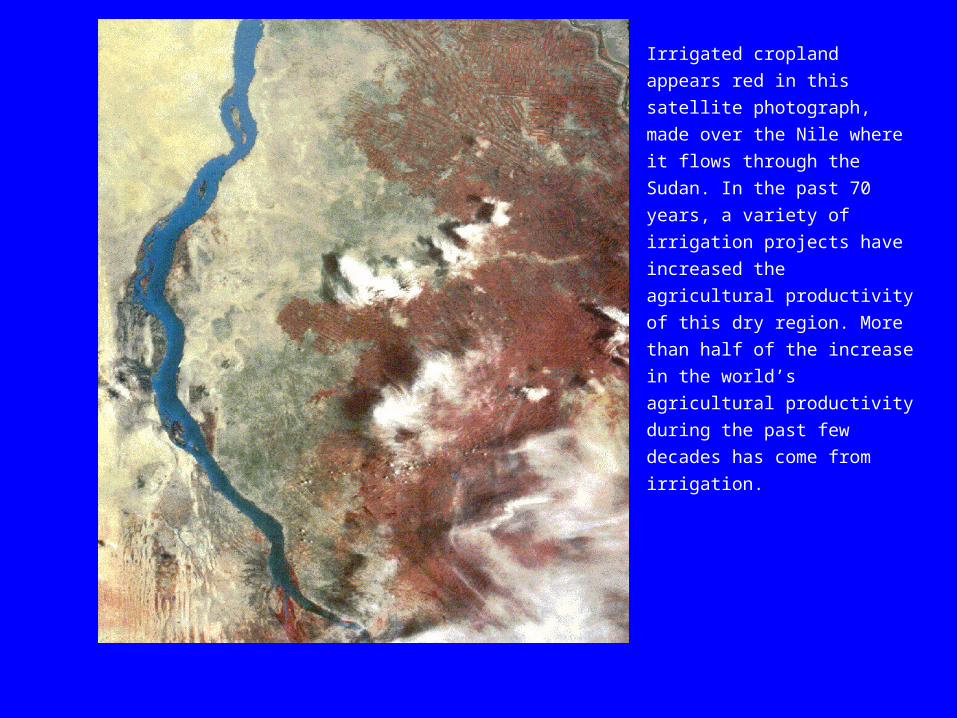
Irrigated cropland
appears red in this
satellite photograph,
made over the Nile where
it flows through the
Sudan. In the past 70
years, a variety of
irrigation projects have
increased the agricultural
productivity of this dry
region. More than half of
the increase in the
world’s agricultural
productivity during the
past few decades has
come from irrigation.
From PR Crosson and NJ Rosenberg, 1989

Changes in rainfall with doubled CO2 (CSIRO model)
>25.6
Daily rainfall class (mm day–1)
0.2-0.4 0.4-0.8 0.8-1.6 1.6-3.2 3.2-6.4 6.4-12.8 12.8-25.6
160
140
120
80
60
40
20
0
–20
100
Change infrequency
(%)
40°N 40°SAustralianlandpoints
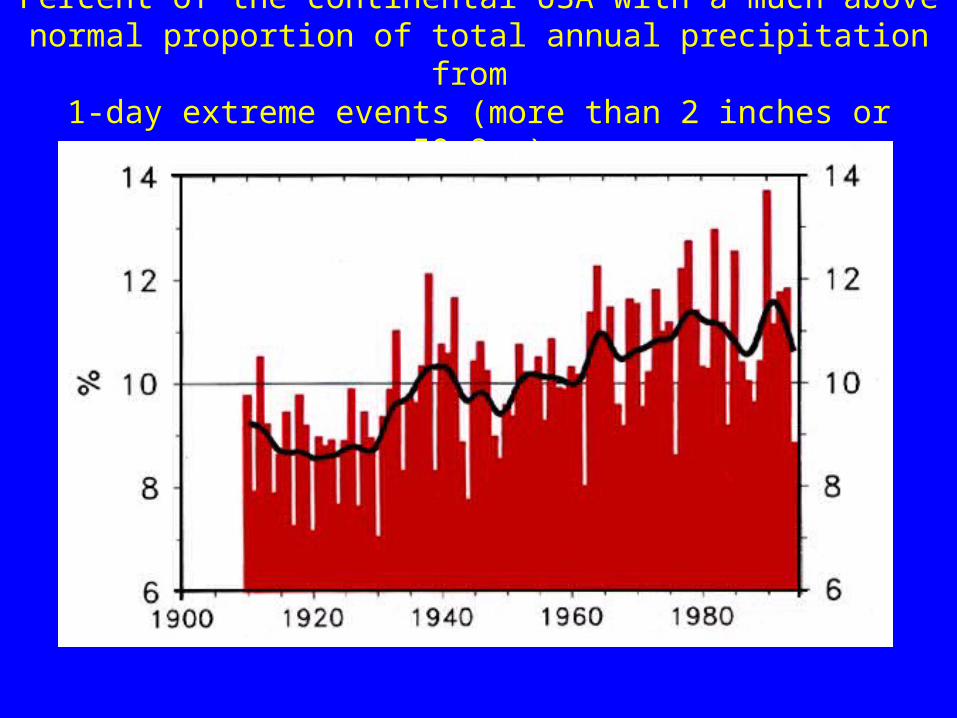
Percent of the continental USA with a much above normal proportion of total annual precipitation from
1-day extreme events (more than 2 inches or 50.8mm)
Karl et al. 1996
BW 7

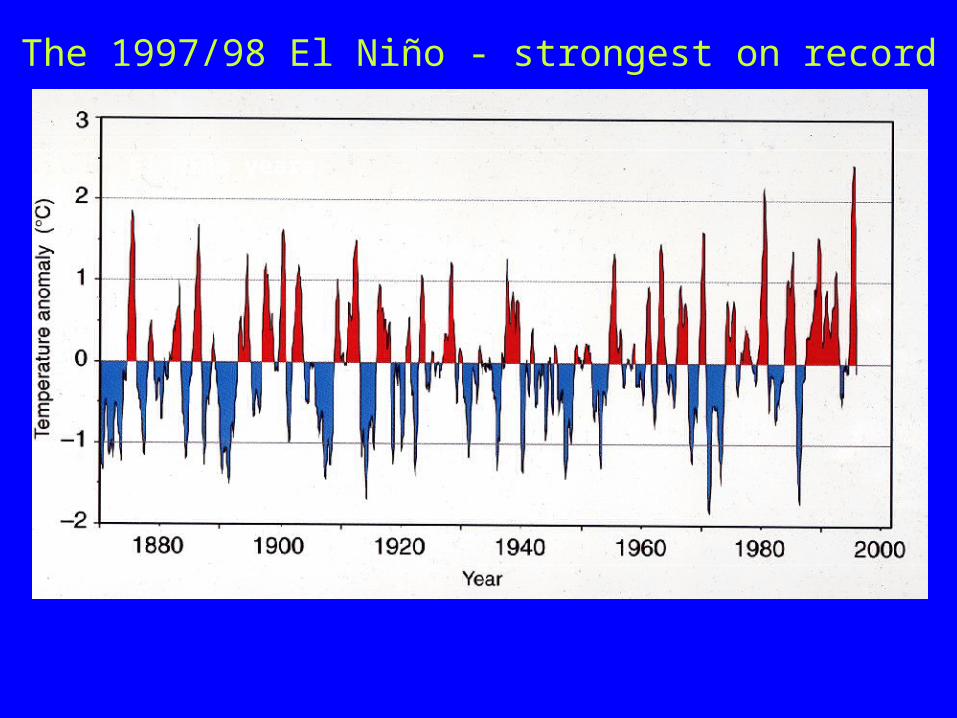
The 1997/98 El Niño - strongest on record
*As shown by changes in sea-surface temperature (relative to the 1961-1990 average) for the eastern tropical Pacific off Peru
El Niño years
La Niña years
BW 14
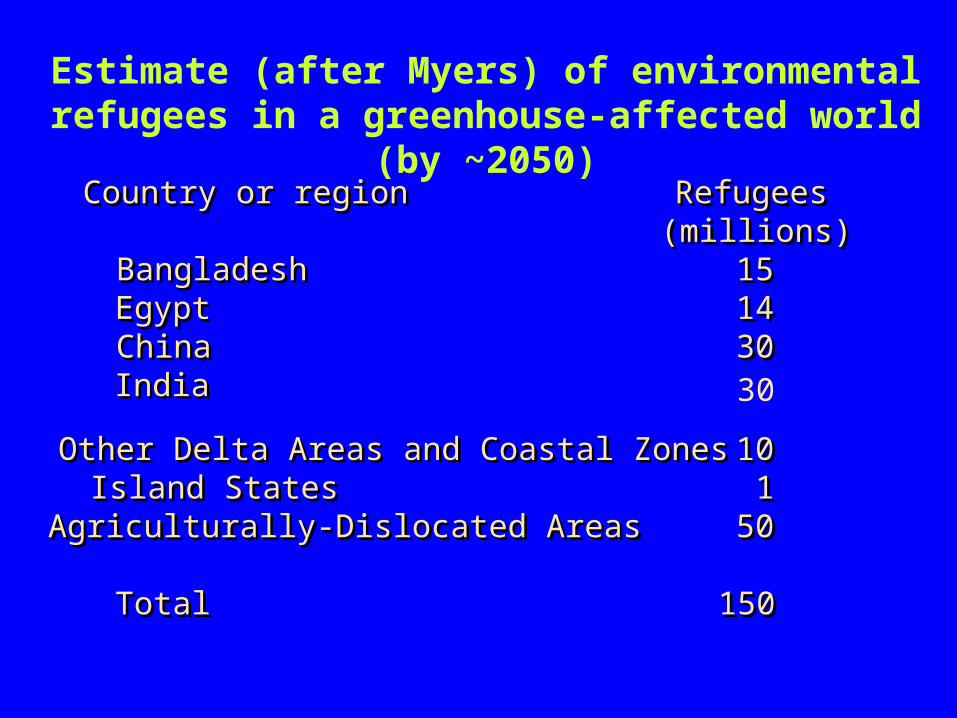
Country or region Refugees (millions)
Bangladesh 15Egypt 14China 30India
Other Delta Areas and Coastal Zones 10Island States 1Agriculturally-Dislocated Areas 50
Total 150
Country or region Refugees (millions)
Bangladesh 15Egypt 14China 30India
Other Delta Areas and Coastal Zones 10Island States 1Agriculturally-Dislocated Areas 50
Total 150
Estimate (after Myers) of environmental refugees in a greenhouse-affected world (by ~2050)
30
IPCC Synthesis Report
What can we do aboutGlobal Warming?
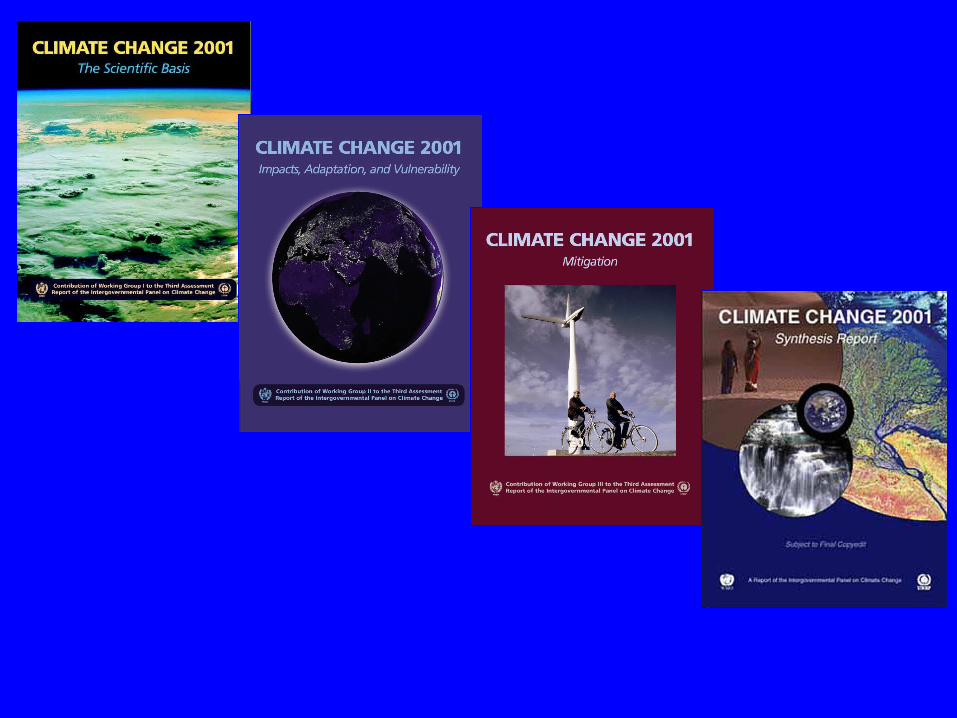

Intergovernmental Panel on Climate Change
Third Assessment Report 2001Scientific assessment includes:
Summary for Policymakers (SPM) 20 pages Technical Summary (TS) 60 pages 14 chapters 780 pages
prepared by 123 Co-ordinating Lead Authors & Lead Authors, 516 Contributing Authors, 21 Review Editors & 420 Expert Reviewers..
SPM agreed ‘line by line’ at Plenary Intergovernmental Meeting at Shanghai, January 2001, with delegates from 99 countries and 50 scientists representing the Lead Authors.

IPCC Website
•http://www.ipcc.ch
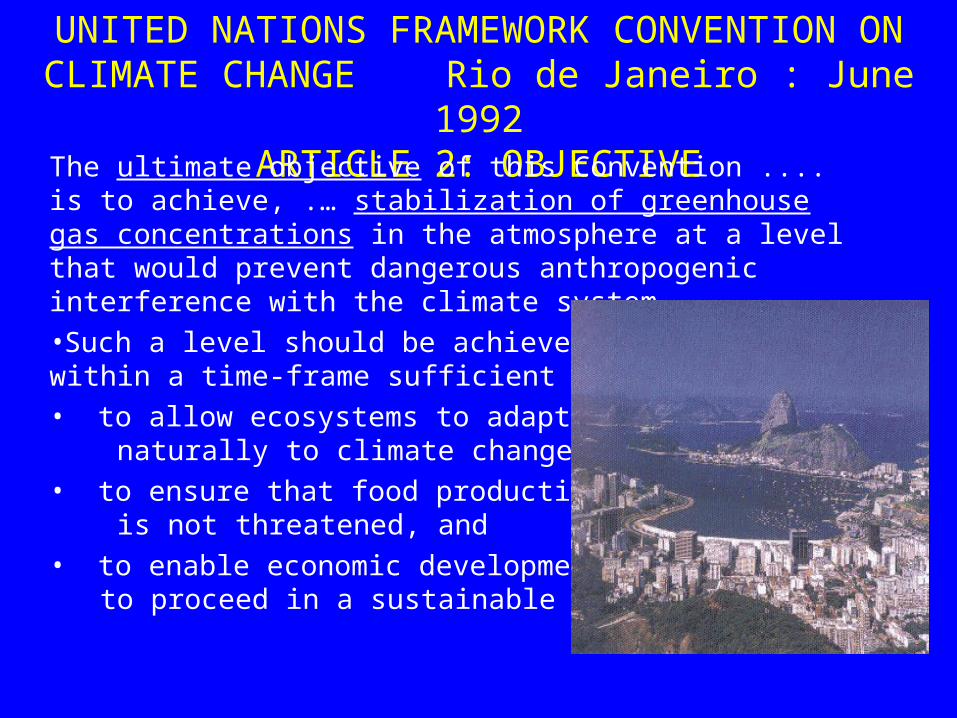
UNITED NATIONS FRAMEWORK CONVENTION ON CLIMATE CHANGE Rio de Janeiro : June 1992
ARTICLE 2: OBJECTIVEThe ultimate objective of this Convention .... is to achieve, .… stabilization of greenhouse gas concentrations in the atmosphere at a level that would prevent dangerous anthropogenic interference with the climate system.•Such a level should be achieved within a time-frame sufficient :• to allow ecosystems to adapt naturally to climate change.• to ensure that food production is not threatened, and • to enable economic development to proceed in a sustainable manner.
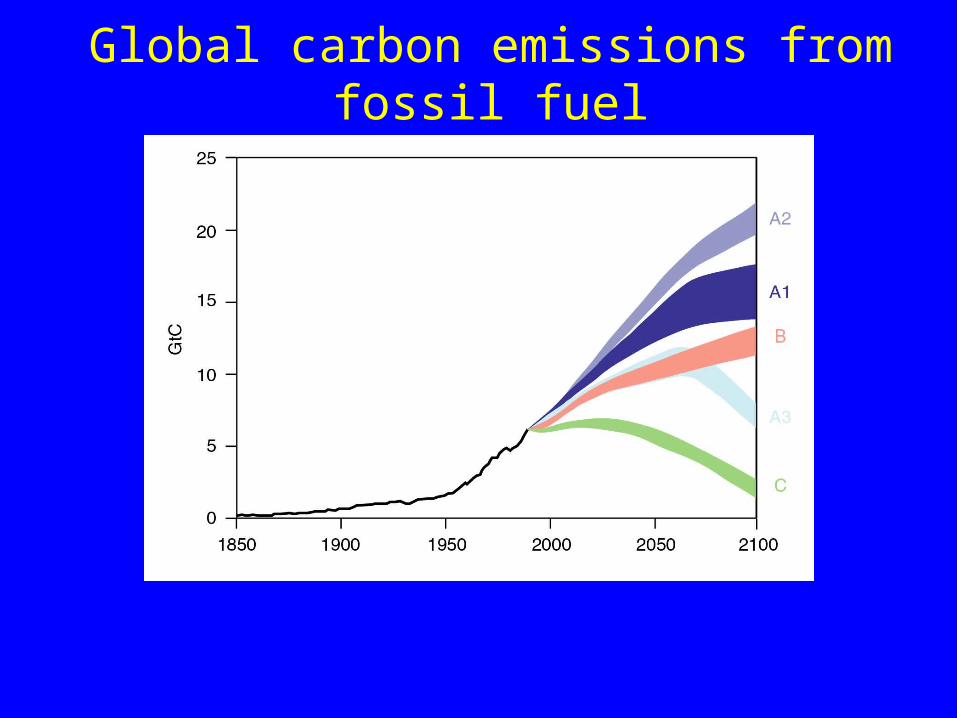
Global carbon emissions from fossil fuel
Global carbon emissions from fossil fuel use, 1850 to 1990, and for scenarios to 2100, in GtC.For each scenario, the range shows the difference between gross and net emissions.
From IIASA/WEC Global Energy Perspectives 1998.

Four Principles governing International Agreements
• Precautionary Principle • Principle of Sustainable
Development• Polluter Pays Principle • Principle of Equity

Carbon Emissions per capita per annum in 2000
(tonnes C)
USA 5.5 UK 2.5 China 0.7 India 0.3
World Average 1.0

Carbon dioxide contraction for 450 ppm & convergence
by 2030 to globally equal per capita emissions rights

Saving Energy in Buildings
• Use of white surfaces to reduce air conditioning
• Low-energy lighting
• Better insulation and control of space heating
• More efficient appliances
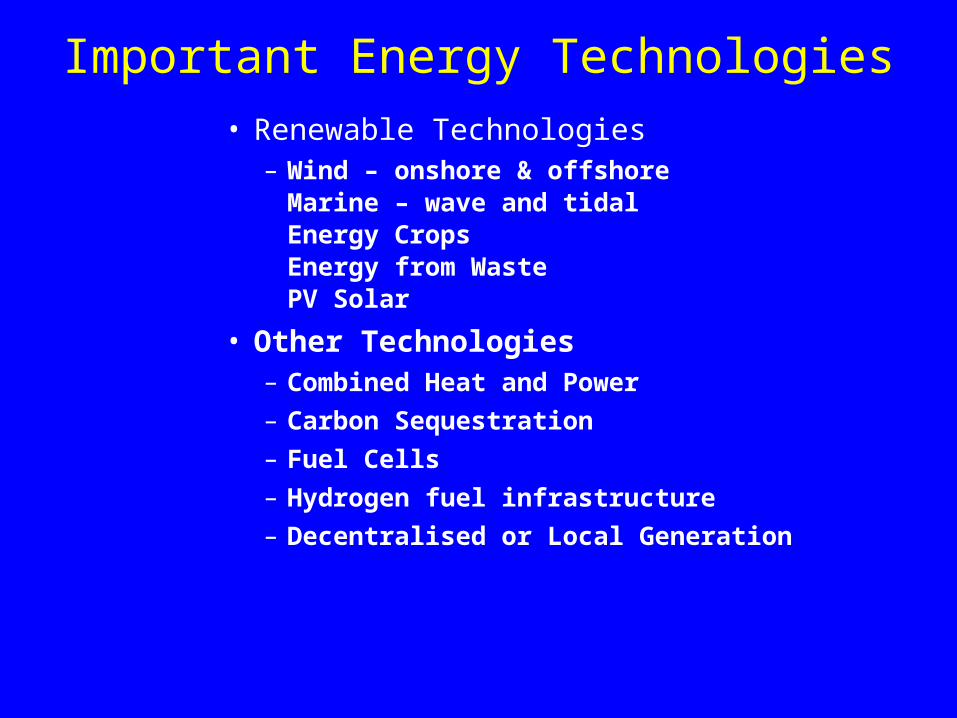
Important Energy Technologies• Renewable Technologies
– Wind – onshore & offshoreMarine – wave and tidalEnergy CropsEnergy from WastePV Solar
• Other Technologies– Combined Heat and Power– Carbon Sequestration– Fuel Cells– Hydrogen fuel infrastructure– Decentralised or Local Generation

Biomass

Car batteryRefrigerator
T.V.
Light Solar cell array
~1m2
~100 W peak power
Local solar energy supply
+ -
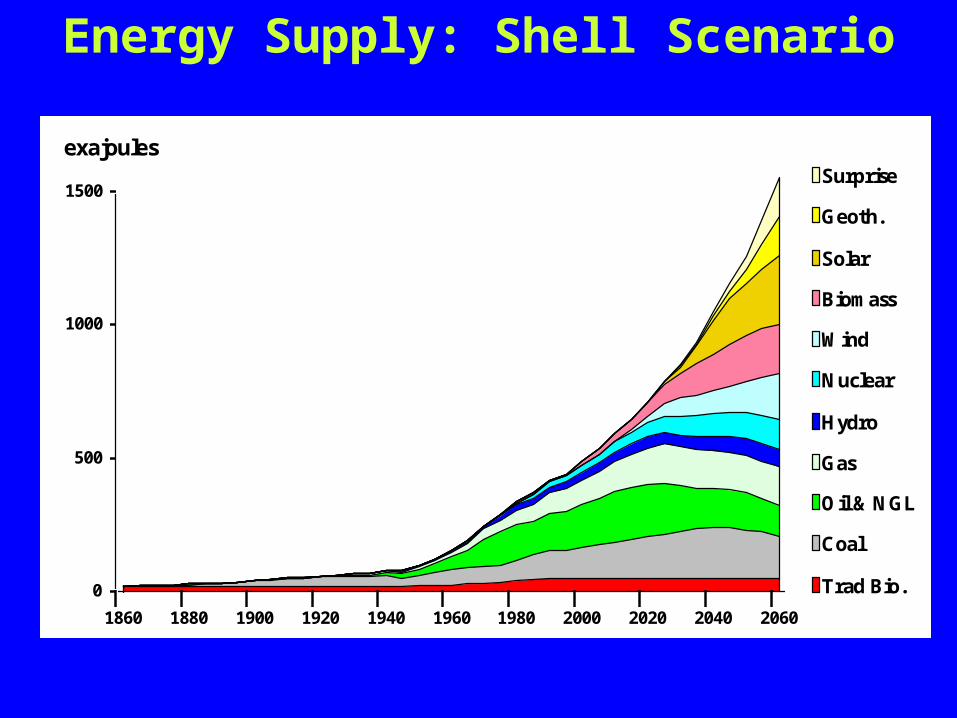
Surprise
Geoth.
Solar
Biomass
Wind
Nuclear
Hydro
Gas
Oil & NGL
Coal
Trad Bio.0
500
1000
1500
1860 1880 1900 1920 1940 1960 1980 2000 2020 2040 2060
exajoules
Energy Supply: Shell ScenarioSustained Growth Scenario
Source: Shell International Limited.
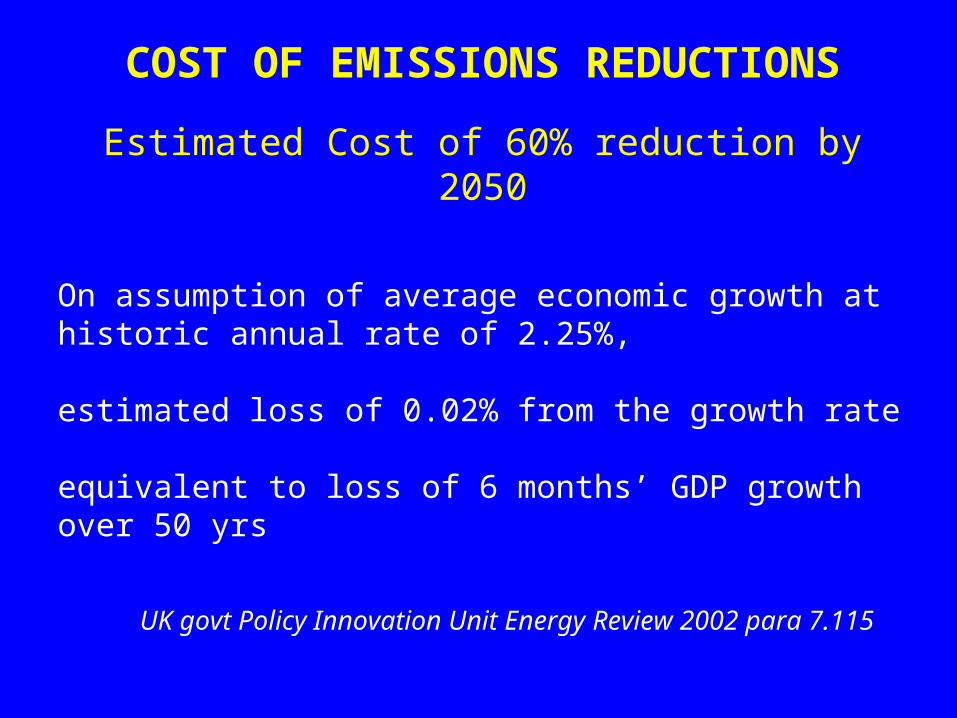
COST OF EMISSIONS REDUCTIONS
Estimated Cost of 60% reduction by 2050
On assumption of average economic growth at historic annual rate of 2.25%,
estimated loss of 0.02% from the growth rate
equivalent to loss of 6 months’ GDP growth over 50 yrs
UK govt Policy Innovation Unit Energy Review 2002 para 7.115
~1% GNP (DCs)~2-5% GNP (LDCs)
Plus other less quantifiable but important impacts
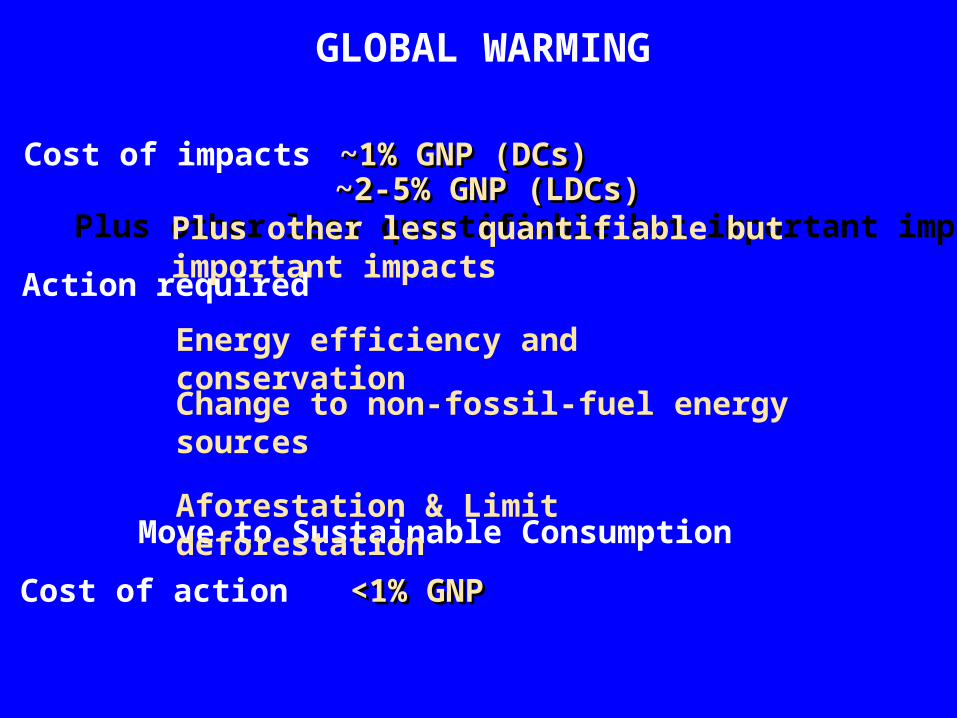
Move to Sustainable Consumption
<1% GNP
Cost of impacts ~1% GNP (DCs)~2-5% GNP (LDCs)
Plus other less quantifiable but important impacts
Action required
Energy efficiency and conservation
Change to non-fossil-fuel energy sources
Aforestation & Limit deforestation
Cost of action <1% GNP
GLOBAL WARMING
Global Warming Presents a Challenge to:
• scientists• industry and
technologists• governments • everybody
Message from Industry“No single company or country can solve the problem of climate change.It would be foolish and arrogant to pretend otherwise.But I hope we can make a difference - not least to the tone of the debate - by showing what is possible through constructive action.”
John Browne, BP, Berlin, 30 September 1997

Reasons for optimism
- Commitment of scientific community
- Necessary technology available
- God’s commitment to his creation

‘Nobody made a greater mistake than he who
did nothing because he could only do a little’
Edmund Burke