global vc investment landscape cost to start enterprise ...€¦ · cost to start enterprise and...
TRANSCRIPT
Venture Capital Insights® – 2Q14
Global VC investment landscapeCost to start enterprise and consumerventure-backed companies
August 2014
Venture Capital Insights® – 2Q14Page 1
Insights development team
► Bryan Pearce, Global Leader, Entrepreneur Of The Year TM and GlobalVenture Capital Advisory Group, EY
► Jeff Grabow, United States, Venture Capital Leader, EY► Sandra Feldner Vandergriff, Americas Venture Capital Advisory Group, EY► Shanta Kumari, EY Knowledge, EY► Aseem Goyal, EY Knowledge, EY► Prof. George Foster, Graduate School of Business, Stanford University► Dr. Martin Haemmig, Adjunct Professor, Globalization of Venture Capital,
CeTIM and former Senior Advisor on Venture Capital,Stanford University (SPRIE)
► Prof. Steven Kaplan, Graduate School of Business, University of Chicago
*All data contained in this is sourced to Dow Jones VentureSource unless otherwise noted.
Venture Capital Insights® – 2Q14Page 2
Venture Capital Insights
This edition of Venture Capital Insights analyzes global VC investments and exits from 2008 through1H14. The presentation also provides an overview of the dollars required to scale a company in theenterprise and consumer sectors and current ownership status of those venture-funded companies.
Content overview:1 Global VC investments
2 Global VC exit landscape – IPO and M&A
3 VC investment in enterprise and consumer segments by round class
3.1 Cost to start up enterprise and consumer venture-backed companies
3.2 VC investment in enterprise and consumer segments by geography
3.3 Median amount raised and valuations by round class (by year of investment)
3.4 Median amount raised and valuations by round class (by year of liquidity)
3.5 Median total equity raised prior to liquidity, valuations and time to liquidity
4 Current ownership status of venture-funded companies
Section 1: Global VC investment landscapeAnalysis by geography, hotbed, sectors, stages of development and round classes

Venture Capital Insights® – 2Q14Page 4
Section 1: Global venture capital investment landscapeSummary
Global VC investment activity
► Globally, 2Q14 recorded the highest quarterly VC investments US$21.1b since 1Q01 levels. Subsequently, VCinvestments for the first half of 2014 reached US$37.8b, the highest first-half total since 2001.
► VC investment activity saw significant growth in the dollar amounts invested across all markets. Compared to the1Q14, the dollar amount invested in 2Q14 was up 26%, with an increase of 3% in number of rounds.
► Europe saw the highest increase in dollars raised, up 42% for 2Q14 versus the previous quarter; the US and Chinasaw increases of 21% and 19%, respectively, for the same period.
► The Bay Area continues to account for close to half of the dollar amount invested in the 15 major VC hotbeds: 49% for1Q14 and 47% in 2Q14. The top two deals of the quarter were San Francisco-based companies, one of which was aUS$1.2b investment in Uber Technologies Inc., at a post-valuation of US$18.2b.
► Consumer services and business and financial services were the two most attractive sectors for 2Q14 in valueand volume.
► Companies operating at revenue generation stage continue to attract larger investments, primarily in the later –round classes.
► For1H14, median deal values at later round class were at their all-time high for all VC markets, except for China.However, China still recorded the highest median value at this stage, globally.
► By stage of development, 1H14 saw a significant increase in median values across all stages, particularly in the US,Europe and China.
Venture Capital Insights® – 2Q14Page 5
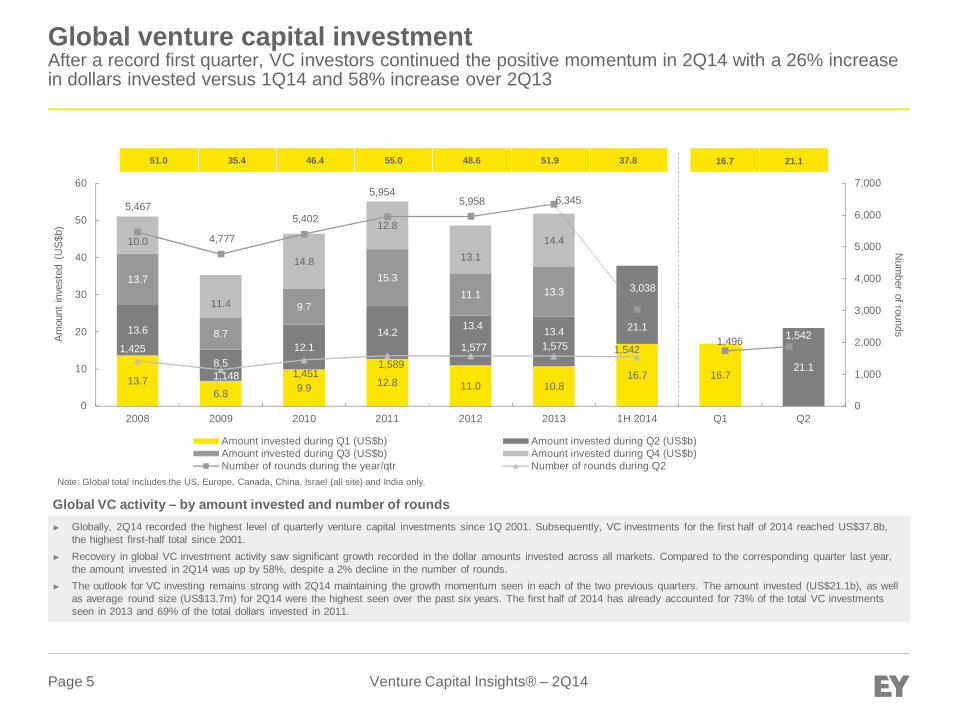
► Globally, 2Q14 recorded the highest level of quarterly venture capital investments since 1Q 2001. Subsequently, VC investments for the first half of 2014 reached US$37.8b,the highest first-half total since 2001.
► Recovery in global VC investment activity saw significant growth recorded in the dollar amounts invested across all markets. Compared to the corresponding quarter last year,the amount invested in 2Q14 was up by 58%, despite a 2% decline in the number of rounds.
► The outlook for VC investing remains strong with 2Q14 maintaining the growth momentum seen in each of the two previous quarters. The amount invested (US$21.1b), as wellas average round size (US$13.7m) for 2Q14 were the highest seen over the past six years. The first half of 2014 has already accounted for 73% of the total VC investmentsseen in 2013 and 69% of the total dollars invested in 2011.
Global VC activity – by amount invested and number of rounds
Global venture capital investmentAfter a record first quarter, VC investors continued the positive momentum in 2Q14 with a 26% increasein dollars invested versus 1Q14 and 58% increase over 2Q13
13.76.8 9.9 12.8 11.0 10.8
16.7 16.7
13.6
8.512.1
14.2 13.4 13.4 21.1
21.1
13.7
8.7
9.7
15.311.1 13.3
10.0
11.4
14.8
12.8
13.114.4
5,467
4,777
5,402
5,9545,958 6,345
3,038
1,425
1,148 1,4511,589
1,577 1,575 1,542
0
1,000
2,000
3,000
4,000
5,000
6,000
7,000
0
10
20
30
40
50
60
2008 2009 2010 2011 2012 2013 1H 2014 Q1 Q2
Num
berofrounds
Am
ount
inve
sted
(US
$b)
Amount invested during Q1 (US$b) Amount invested during Q2 (US$b)Amount invested during Q3 (US$b) Amount invested during Q4 (US$b)Number of rounds during the year/qtr Number of rounds during Q2
Note: Global total includes the US, Europe, Canada, China, Israel (all site) and India only.
51.0 35.4 46.4 55.0 48.6 51.9 37.8 16.7 21.1
1,496 1,542
Venture Capital Insights® – 2Q14Page 6
US
Europe
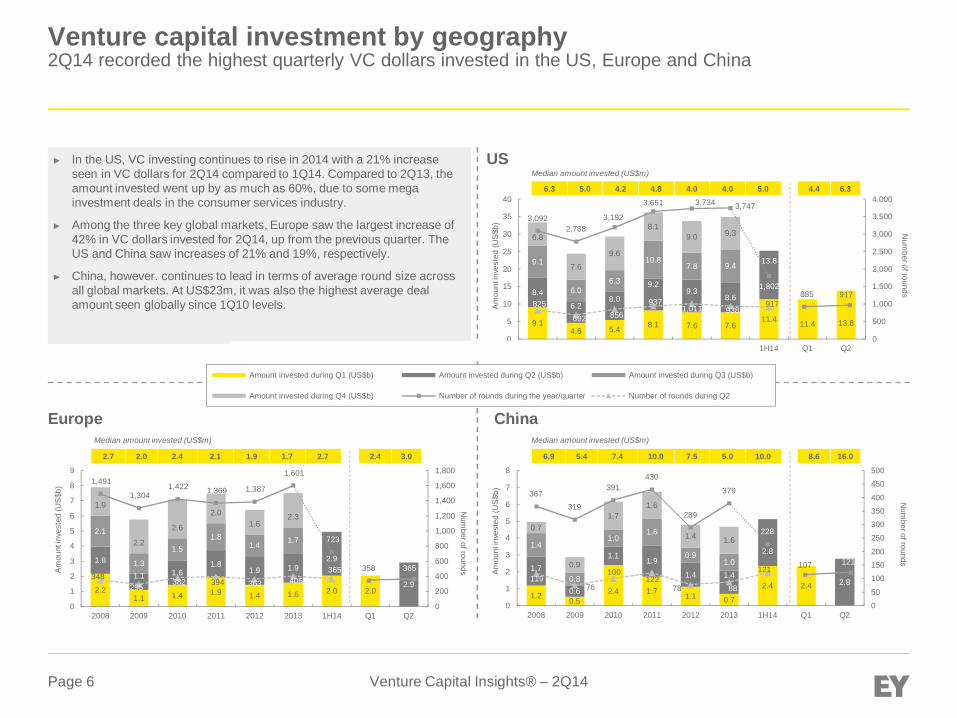
► In the US, VC investing continues to rise in 2014 with a 21% increaseseen in VC dollars for 2Q14 compared to 1Q14. Compared to 2Q13, theamount invested went up by as much as 60%, due to some megainvestment deals in the consumer services industry.
► Among the three key global markets, Europe saw the largest increase of42% in VC dollars invested for 2Q14, up from the previous quarter. TheUS and China saw increases of 21% and 19%, respectively.
► China, however. continues to lead in terms of average round size acrossall global markets. At US$23m, it was also the highest average dealamount seen globally since 1Q10 levels.
China
Venture capital investment by geography2Q14 recorded the highest quarterly VC dollars invested in the US, Europe and China
9.14.6 5.4 8.1 7.6 7.6
11.4 11.4 13.8
8.4
6.28.0
9.29.3
8.6
13.89.1
6.06.3
10.87.8 9.4
6.8
7.6
9.6
8.19.0 9.3
3,0922,788
3,192
3,651 3,734 3,747
1,802
825
692 856937
1,011 938917
0
500
1,000
1,500
2,000
2,500
3,000
3,500
4,000
0
5
10
15
20
25
30
35
40
2008 2009 2010 2011 2012 2013 1H14 Q1 Q2
Num
berofrounds
Am
ount
inve
sted
(US
$b)
6.3 5.0 4.2 4.8 4.0 4.0 5.0
Median amount invested (US$m)
4.4 6.3
885 917
2.21.1 1.4 1.9 1.4 1.6 2.0 2.0
1.8
1.1 1.61.8
1.9 1.92.9
2.9
2.1
1.3
1.51.8
1.4 1.7
1.9
2.2
2.6
2.01.6
2.3
1,491
1,3041,422 1,369 1,387
1,601
723
348295
382 394 363 406365
0
200
400
600
800
1,000
1,200
1,400
1,600
1,800
0
1
2
3
4
5
6
7
8
9
2008 2009 2010 2011 2012 2013 1H14 Q1 Q2
Num
berofroundsAm
ount
inve
sted
(US
$b)
1.20.5
2.4 1.7 1.1 0.7
2.4 2.4
1.7
0.6
1.1 1.9
1.4 1.4
2.8
2.8
1.4
0.8
1.01.6
0.91.0
0.7
0.9
1.71.6
1.4 1.6
367319
391430
289
379
228
11976
100122
78 88
121
0
50
100
150
200
250
300
350
400
450
500
0
1
2
3
4
5
6
7
8
2008 2009 2010 2011 2012 2013 1H14 Q1 Q2
Num
berofrounds
Am
ount
inve
sted
(US
$b)
Median amount invested (US$m)Median amount invested (US$m)
2.7 2.0 2.4 2.1 1.9 1.7 2.7 2.4 3.0 6.9 5.4 7.4 10.0 7.5 5.0 10.0 8.6 16.0
358 365 107 121
050
Amount invested during Q1 (US$b) Amount invested during Q2 (US$b) Amount invested during Q3 (US$b)
Amount invested during Q4 (US$b) Number of rounds during the year/quarter Number of rounds during Q2

Venture Capital Insights® – 2Q14Page 7
Venture capital investment by geographyContinued recovery in amount invested by VCs was evident across all markets, although number ofdeals declined in Israel and Canada, compared to 1Q14
► Canada saw the steepest growth 134% in the amount of VC investment,compared to 1Q14, followed by India at 92%.
► Compared to 2Q13, Israel was the only market that saw a decline in VCinvestments, both in terms of deals and dollars. Compared to 1Q14,however, the amount invested rose by 6% on account of recovery inhealthcare and information technology (IT) sector.
► The outlook for VC investmenting in Canada and India is positive, with1H14 investments significantly exceeding 1H13 levels. However, Israel hasyet to cross 2013 halfway mark.
0.80.2 0.3 0.3 0.3 0.3 0.3 0.3
0.6
0.2
0.90.6
0.20.6 0.4
0.4
0.5
0.3
0.20.4
0.3
0.4
0.3
0.2
0.5 0.6
0.4
0.4
289
178
163 180 163196
96
75
41
5454
3352
42
0
50
100
150
200
250
300
350
0
1
2
3
2008 2009 2010 2011 2012 2013 1H 2014 Q1 Q2
Num
berofrounds
Am
ount
inve
sted
(US
$b)
0.2 0.1 0.20.4
0.2 0.2 0.2 0.2
0.10.1
0.2
0.4
0.2 0.2 0.40.4
0.30.1
0.4
0.3
0.3 0.30.2
0.2
0.2
0.1
0.30.4
11092
114
143151
182
80
27 26 25
37 40 40 38
0
20
40
60
80
100
120
140
160
180
200
0
1
2
2008 2009 2010 2011 2012 2013 1H 2014 Q1 Q2
Num
berofrounds
Am
ount
inve
sted
(US
$b)
0.2 0.2 0.2 0.3 0.4 0.4 0.4 0.4
0.9
0.1 0.20.4
0.30.6
0.8
0.8
0.4
0.1 0.2
0.4 0.4
0.5
0.2
0.30.3
0.4 0.4
0.4
11896
120
181
234240
109
3118 34
45 52 51 59
0
50
100
150
200
250
300
0
1
2
2008 2009 2010 2011 2012 2013 1H 2014 Q1 Q2
Num
berofrounds
Am
ount
inve
sted
(US
$b)
42 38
54 4250 59
Canada5.0 4.6 4.0 5.0 2.7 2.1 2.3
Median amount invested (US$m)
1.5 5.9
IndiaMedian amount invested (US$m)
7.0 4.2 6.4 5.0 3.7 3.9 4.1 3.0 5.0
Israel (all site)Median amount invested (US$m)
5.0 4.0 5.0 7.0 4.0 4.8 4.8 4.0 5.4
050
Amount invested during Q1 (US$b) Amount invested during Q2 (US$b) Amount invested during Q3 (US$b)
Amount invested during Q4 (US$b) Number of rounds during the year/quarter Number of rounds during Q2

Venture Capital Insights® – 2Q14Page 8
► The Bay Area continued to account for close to half of the dollar amount invested in the top 15 major VC hotbeds- -- 49% in 1Q14 and 47% in 2Q14, up from 2008–13 when itaccounted for less than 38% of the total dollars invested. The top two deals of the quarter were San Francisco-based companies, one of which was a US$1.2b investment inUber Technologies Inc., at a post-valuation of US$18.2b.
► Increased VC investing in India saw Bengaluru move up three ranks from 15th, for the first time since 2009. Beijing, the most attractive VC hotbed in the Asia-Pacific region,continues its climb and is now among in the top five.
Venture capital investment by hotbedBeijing was the only non-US destination among the top five VC hotbeds for 2Q14; the Bay Areacontinues its dominance in attracting the top two deals of the quarter
6
23
33
13
42
38
46
22
74
97
71
66
102
122
323
Numberof rounds
108
139
178
278
364
376
439
473
541
821
856
1,114
1,190
1,575
7,400
Switzerland
Illinois
Potomac
Bengaluru
Israel (all site)
Canada
Germany
Shanghai
France
UK
S. Calif
Beijing
New England
NY Metro
Bay Area
Amount invested(US$m)
Top five hotbeds1
US$12.1b(77% of the total2)
Top five hotbeds1
684(63% of the total2)
113
385
394
421
572
634
881
901
954
981
1,509
1,820
2,306
3,234
8,786
Bengaluru
Switzerland
Shanghai
Illinois
Canada
Potomac
Israel (all site)
Beijing
France
Germany
UK
NY Metro
S. Calif
New England
Bay Area
Amount invested(US$m)
Top five hotbeds1
US$17.7b(74% of the total2)
2009 2Q14
316
384
730
832
1,084
1,214
1,282
1,655
1,951
1,996
2,759
3,344
3,835
3,933
14,075
Bengaluru
Switzerland
Illinois
Germany
Shanghai
Canada
France
Potomac
Israel (all site)
UK
Beijing
NY Metro
New England
S. Calif
Bay Area
Amount invested(US$m)
Top five hotbeds1
US$27.9b(71% of the total2)
2011
412
564
570
730
1,092
1,105
1,242
1,521
1,707
2,106
2,305
3,264
3,491
3,891
13,488
Switzerland
Illinois
Bengaluru
Shanghai
France
Canada
Potomac
Germany
Israel (all site)
Beijing
UK
S. Calif
NY Metro
New England
Bay Area
Amount invested(US$m)
Top five hotbeds1
US$26.4b(71% of the total2)
2013
83
134
139
161
193
251
340
342
517
669
704
775
1,056
1,263
6,278
Bengaluru
Switzerland
Illinois
Canada
Potomac
France
Germany
Israel (all site)
UK
S. Calif
Shanghai
Beijing
NY Metro
New England
Bay Area
Amount invested(US$m)
Top five hotbeds1
US$10.1b(78% of the total2)
1Q14
*Data on Israel is based on Israel (all site).
1 Top five hotbeds by amount invested. 2 Total of 15 major VC hotbeds listed above.

Venture Capital Insights® – 2Q14Page 9
Venture capital investment by industryConsumer services and business and financial services were the two hottest sectors in 2Q14
By number of rounds:► The business and financial services sector continues to be ranked first globally. The IT sector in the US was displaced from its number one ranking in 2Q14 for the first time
since 1Q08.► Compared to 2Q13, the increase in deal count was the highest in business and financial services at 18%, followed by consumer services at 6%, while the IT sector saw a
decline of 17%.By amount invested:► The amount invested in both the business and financial services and consumer services sectors doubled versus the amount invested in 2Q13.► Even though there is an increased focus by VC investors on cloud-based and mobile technology types of companies, the consumer services sector saw top three deals of the
quarter, with a total investment of US$19.5b.
1,693
240
1,165
240
1,304
186
1,115
Information technology
Industrial goods and materials
Healthcare
Energy and utilities
Consumer services
Consumer goods
Business and financial services
2011
1,779
206
1,074
176
1,424
183
1,092
Number of rounds
Amount invested (US$b)
726
74
514
52
746
112
803
Note: There are also some deals for which sector has not been assigned.
2012 2013 1H14 1Q14 2Q14
366
31
242
23
366
63
398
360
43
272
29
380
49
405
11.51.9
12.34.7
13.1
2.1
9.5
Information technology
Industrial goods and Materials
Healthcare
Energy and utilities
Consumer services
Consumer goods
Business and financial services2011
12.7
1.5
10.6
2.4
11.1
1.4
8.6
8.4
0.5
6.6
0.7
11.8
0.7
9.0
2012 2013 1H14 1Q14 2Q14
4.4
0.2
2.9
0.4
4.4
0.3
4.3
4.0
0.4
3.7
0.3
7.5
0.4
4.8
12.4
1.4
11.8
1.7
12.0
1.8
10.8
1,719
207
1,113
160
1,474
208
1,451

Venture Capital Insights® – 2Q14Page 10
Venture capital investment by country2Q14 was the strongest quarter in the US, Europe and China for dollars invested
By number of rounds:► In 2Q14, the number of rounds in the US and Europe grew marginally when compared to the previous quarter. For the developing economies ‒ India and China ‒ deal volume
increased by 18% and 13%, respectively, due to strong deal activity in the consumer services sector.► The number rounds in Canada and Israel declined 10% and 22% respectively, in 2Q14 compared to 1Q14. In Israel, slow deal activity in the consumer services sector,
particularly in the consumer information services subsector was behind the decline. In Canada, the information technology sector saw only 13 deals compared to 18 deals in thepast quarter.
By amount invested:► VC activity picked up across all markets in 2Q14, with the US, Europe and China seeing growth of 21%, 45% and 22%, respectively. Even investing in the smaller VC markets
grew impressively, with Canada and India showing \100% growth each over the last quarter and Israel grew by 33%.► Subsequently, the average deal size also grew across all markets for 2Q14 compared to 1Q14. For the largest VC market, the US, average deal size increased by 17%, and in
Europe, it grew by 42%. India, Israel and Canada also saw big gains in average deal sizes with 69%, 71% and 121%, respectively.
181
180
143
430
1,369
3,651
India
Israel
Canada
China
Europe
US
234
163
151
289
1,387
3,734
Number of rounds
Amount invested (US$b)
240
196
182
379
1,601
3,747
109
96
80
228
723
1,802
50
54
42
107
358
885
59
42
38
121
365
917
1.5
2.0
1.2
6.7
7.5
36.2
India
Israel
Canada
China
Europe
US
1.6
1.2
0.9
4.8
6.4
33.7
1.9
1.7
1.1
4.7
7.5
34.9
1.3
0.7
0.5
5.1
4.9
25.2
0.4
0.3
0.2
2.3
2.0
11.4
0.8
0.4
0.4
2.8
2.9
13.8
2011 2012 2013 1H14 1Q14 2Q14
2011 2012 2013 1H14 1Q14 2Q14

Venture Capital Insights® – 2Q14Page 11
Venture capital investment by round class and stage of developmentCompanies operating at revenue generation stage continued to attract large investments primarily,through later round classes
1,622
1,067
2,279
626
Later stageSecond round
First roundSeed round
2011
1,537
995
2,355
733
Number of rounds
Amount invested (US$b)
2012 2013 1H14 1Q14 2Q14
1,532
1,225
2,591
697
866
638
1,196
207
392
283
612
138
474
355
584
69
27.7
10.8
12.0
0.6
Later stage
Second round
First round
Seed round
2011
25.5
8.2
10.5
0.5
2012 2013 1H14 1Q14 2Q14
26.8
10.3
10.9
0.5
21.2
6.8
5.7
0.2
8.3
2.9
2.6
0.1
12.9
4.0
3.1
0.1
297
3,664
1,427
559
Profitable
Generating revenue
Product development
Startup
2011
231
3,858
1,293
571
Number of rounds
Amount invested (US$b)
2012 2013 1H14 1Q14 2Q14
270
4,344
1,242
486
144
2,262
515
115
71
1,095
255
74
5.6
36.1
12.2
1.1
Profitable
Generating revenue
Product development
Startup
2011
3.4
35.8
8.6
0.7
2012 2013 1H14 1Q14 2Q14
4.7
37.8
8.7
0.6
4.2
28.9
4.5
0.2
2.2
12.3
2.1
0.1
2.0
16.6
2.4
0.1
By stage of development
By round class
73
1,167
260
41
Venture Capital Insights® – 2Q14Page 12
Median round size by round classIn 1H14, median deal values in the later round classes were at their all-time high for all VC markets,except for China. However, China still recorded the highest median deal value at this stage globally
10.0
8.0
7.7 10
.0
10.0
10.0
11.3
5.9
4.4 5.3
5.5 7.
4
6.2 10
.0
9.2
7.3 10
.0
20.0
18.0 19
.9
20.0
9.5
5.7 8.
9
7.3 8.
8
3.8
14.7
9.0
6.1 9.
9 11.0
10.0
7.6
15.5
11.6 11.5
10.8
10.0
9.0 10
.4 15.0
0
5
10
15
20
25
2008 2009 2010 2011 2012 2013 1H14
8.0
5.0
5.5 6.0
5.3 5.
8 6.5
3.8
2.6 3.0
2.9
3.3
3.3 4.0
10.0
8.2 10
.0
15.0
15.4
12.5
20.0
5.1
5.6
5.0 6.
9
6.0
6.0
4.46.
0
5.0 6.
0 8.0
5.5 9.
0
8.5
10.6
7.6 9.0
6.9
6.1 6.0 8.
0
0
5
10
15
20
25
2008 2009 2010 2011 2012 2013 1H14
4.1
3.5
3.0
3.0
2.7 2.
5 3.0
2.1
1.6 1.8
1.6
1.5
1.3 1.7
5.0
4.0 5.
0
7.7
3.7
3.3
3.04.
2
2.8
3.0
3.3
2.0
1.6
1.3
4.0
2.5
2.0
3.5
2.6 3.0 3.3
5.5
4.0
3.7 4.0
3.1
1.6 2.0
0
2
4
6
8
10
2008 2009 2010 2011 2012 2013 1H14
0.8
0.6 0.
7 0.8
0.7
0.5 0.
60.8
0.6
0.5
0.5
0.3
0.2
1.0
0.7
NS
NS
1.0
0.2 0.
3
1.0
0.6
NS
0.9
0.9
0.5
0.1 0.
2
0.6
0.6
0.6 0.
7
0.5 0.
7
0.6
NS
NS
NS
0.3 0.
4
0.2
NS
0.0
0.5
1.0
1.5
2008 2009 2010 2011 2012 2013 1H14
Seed round (median round size in US$m)
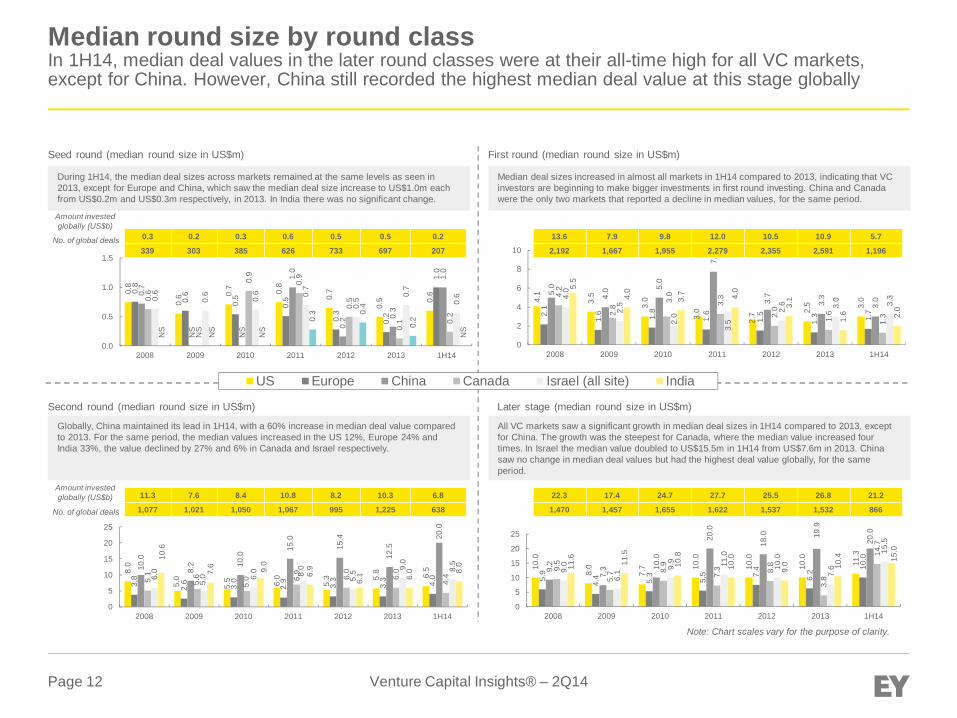
During 1H14, the median deal sizes across markets remained at the same levels as seen in2013, except for Europe and China, which saw the median deal size increase to US$1.0m eachfrom US$0.2m and US$0.3m respectively, in 2013. In India there was no significant change.
First round (median round size in US$m)
Median deal sizes increased in almost all markets in 1H14 compared to 2013, indicating that VCinvestors are beginning to make bigger investments in first round investing. China and Canadawere the only two markets that reported a decline in median values, for the same period.
Second round (median round size in US$m)
Globally, China maintained its lead in 1H14, with a 60% increase in median deal value comparedto 2013. For the same period, the median values increased in the US 12%, Europe 24% andIndia 33%, the value declined by 27% and 6% in Canada and Israel respectively.
Later stage (median round size in US$m)
All VC markets saw a significant growth in median deal sizes in 1H14 compared to 2013, exceptfor China. The growth was the steepest for Canada, where the median value increased fourtimes. In Israel the median value doubled to US$15.5m in 1H14 from US$7.6m in 2013. Chinasaw no change in median deal values but had the highest deal value globally, for the sameperiod.
Note: Chart scales vary for the purpose of clarity.
0.3 0.2 0.3 0.6 0.5 0.5 0.2
339 303 385 626 733 697 207
Amount investedglobally (US$b)
No. of global deals
Amount investedglobally (US$b)
No. of global deals
13.6 7.9 9.8 12.0 10.5 10.9 5.7
2,192 1,667 1,955 2,279 2,355 2,591 1,196
US Europe China Canada Israel (all site) India
11.3 7.6 8.4 10.8 8.2 10.3 6.8
1,077 1,021 1,050 1,067 995 1,225 638
22.3 17.4 24.7 27.7 25.5 26.8 21.2
1,470 1,457 1,655 1,622 1,537 1,532 866
Venture Capital Insights® – 2Q14Page 13
Median round size by stage of developmentSignificant increase in median values across stages, particularly for the US, Europe and China
7.0
5.0
5.0 5.2
5.0 5.
0 5.8
3.0
2.1 2.4
2.2
2.4
1.9 2.5
7.3 7.3 8.
8 10.0
8.0
6.5
10.0
6.0
4.0 5.
0
5.0
3.3
2.5
2.6
6.0
4.6 6.
0
9.1
5.0 6.
0 6.5
8.0
4.6
6.8
5.5
4.0 4.0
4.1
0
2
4
6
8
10
12
2008 2009 2010 2011 2012 2013 1H14
8.0
5.0 6.1 9.
1
6.3
5.3 10
.0
3.9
2.9 5.
6
4.0
4.1
3.3 10
.0
7.2
5.7 6.7
20.0
18.5
11.2 15
.5
NS
7.9 14
.6
NS
NS
7.5
NS
9.0
NS
8.5 9.8
7.0 12
.0
NS7.
2
5.1
5.0 8.
0 9.2
45.8
4.4
05
101520253035404550
2008 2009 2010 2011 2012 2013 1H14
7.0
5.1
4.1
5.0
3.7 3.3 4.
5
2.5
2.1 2.6
1.9
1.3 1.7 2.
8
2.7
3.9 5.
0
3.1 3.6
1.5
3.03.3
4.2
3.0
6.0
2.0
1.5
1.0
4.5 3.8
4.0
4.4
2.8 4.
3
2.5
6.3
1.8
8.7
0.4
3.3
2.2
NS
0
2
4
6
8
10
2008 2009 2010 2011 2012 2013 1H14
1.2
1.0
1.0
1.0
1.0
0.7
0.70.9
0.8
0.6 0.7
0.4
0.2 0.
8
NS
1.9
2.0
2.1
0.5
0.3
NS
NS
1.5
1.4
0.9
NS
NS
NS
2.5
1.5
0.9 1.
8
0.6 0.9 1.1
NS
NS
6.7
3.0
0.5
0.2
NS
012345678
2008 2009 2010 2011 2012 2013 1H14
Startup (median round size in US$m)
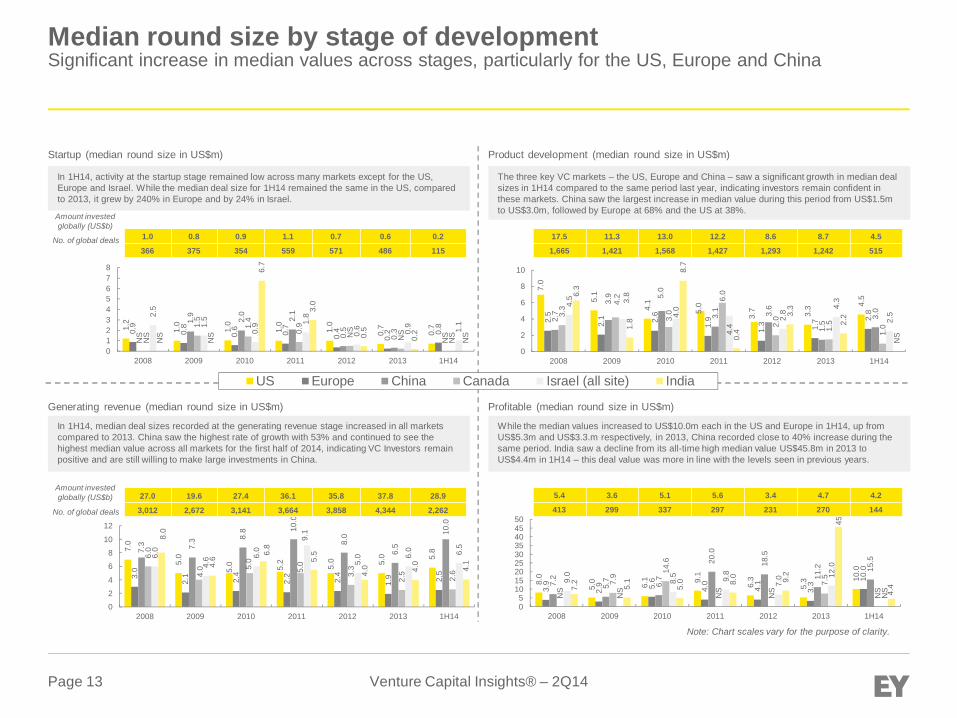
In 1H14, activity at the startup stage remained low across many markets except for the US,Europe and Israel. While the median deal size for 1H14 remained the same in the US, comparedto 2013, it grew by 240% in Europe and by 24% in Israel.
Product development (median round size in US$m)
The three key VC markets ‒ the US, Europe and China ‒ saw a significant growth in median dealsizes in 1H14 compared to the same period last year, indicating investors remain confident inthese markets. China saw the largest increase in median value during this period from US$1.5mto US$3.0m, followed by Europe at 68% and the US at 38%.
Generating revenue (median round size in US$m)
In 1H14, median deal sizes recorded at the generating revenue stage increased in all marketscompared to 2013. China saw the highest rate of growth with 53% and continued to see thehighest median value across all markets for the first half of 2014, indicating VC Investors remainpositive and are still willing to make large investments in China.
Profitable (median round size in US$m)
While the median values increased to US$10.0m each in the US and Europe in 1H14, up fromUS$5.3m and US$3.3.m respectively, in 2013, China recorded close to 40% increase during thesame period. India saw a decline from its all-time high median value US$45.8m in 2013 toUS$4.4m in 1H14 ‒ this deal value was more in line with the levels seen in previous years.
Note: Chart scales vary for the purpose of clarity.
Amount investedglobally (US$b)
No. of global deals 1.0 0.8 0.9 1.1 0.7 0.6 0.2
366 375 354 559 571 486 115
17.5 11.3 13.0 12.2 8.6 8.7 4.5
1,665 1,421 1,568 1,427 1,293 1,242 515
Amount investedglobally (US$b)
No. of global deals
27.0 19.6 27.4 36.1 35.8 37.8 28.9
3,012 2,672 3,141 3,664 3,858 4,344 2,262
5.4 3.6 5.1 5.6 3.4 4.7 4.2
413 299 337 297 231 270 144
US Europe China Canada Israel (all site) India
Section 2: Global VC exit landscape – IPO and M&AAnalysis by geography
Venture Capital Insights® – 2Q14Page 15
Section 2: Global VC exit landscape – IPO and M&ASummary
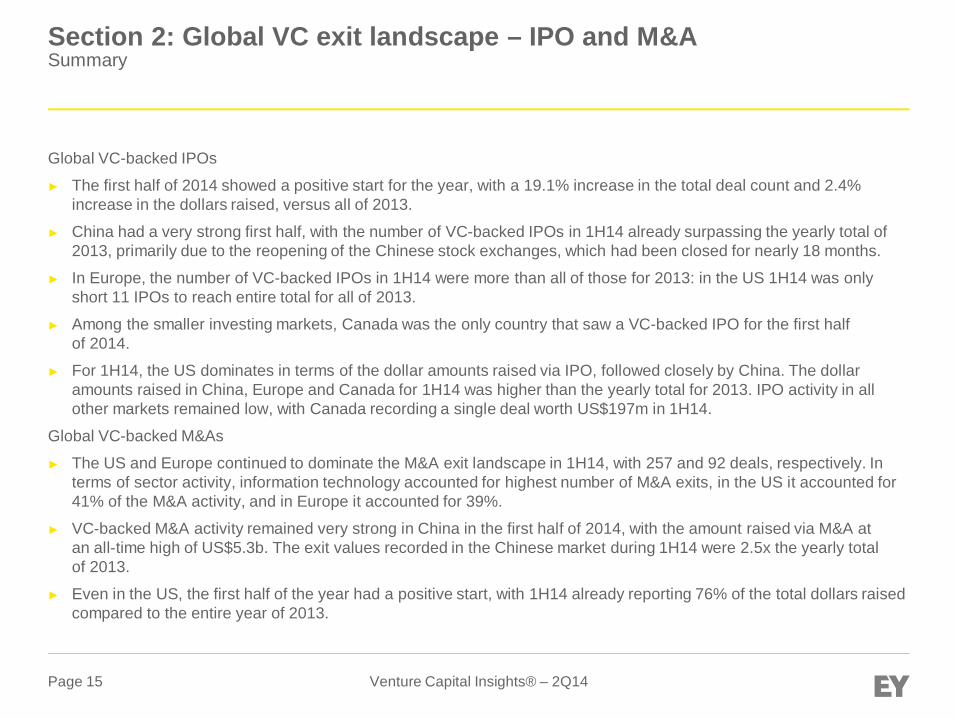
Global VC-backed IPOs
► The first half of 2014 showed a positive start for the year, with a 19.1% increase in the total deal count and 2.4%increase in the dollars raised, versus all of 2013.
► China had a very strong first half, with the number of VC-backed IPOs in 1H14 already surpassing the yearly total of2013, primarily due to the reopening of the Chinese stock exchanges, which had been closed for nearly 18 months.
► In Europe, the number of VC-backed IPOs in 1H14 were more than all of those for 2013: in the US 1H14 was onlyshort 11 IPOs to reach entire total for all of 2013.
► Among the smaller investing markets, Canada was the only country that saw a VC-backed IPO for the first halfof 2014.
► For 1H14, the US dominates in terms of the dollar amounts raised via IPO, followed closely by China. The dollaramounts raised in China, Europe and Canada for 1H14 was higher than the yearly total for 2013. IPO activity in allother markets remained low, with Canada recording a single deal worth US$197m in 1H14.
Global VC-backed M&As
► The US and Europe continued to dominate the M&A exit landscape in 1H14, with 257 and 92 deals, respectively. Interms of sector activity, information technology accounted for highest number of M&A exits, in the US it accounted for41% of the M&A activity, and in Europe it accounted for 39%.
► VC-backed M&A activity remained very strong in China in the first half of 2014, with the amount raised via M&A atan all-time high of US$5.3b. The exit values recorded in the Chinese market during 1H14 were 2.5x the yearly totalof 2013.
► Even in the US, the first half of the year had a positive start, with 1H14 already reporting 76% of the total dollars raisedcompared to the entire year of 2013.
Venture Capital Insights® – 2Q14Page 16
29 NS
NS
105
NS
2
197
158
NS
532
46 20 11 NS
NS 7 42 24 NS
156
NS
2008 2009 2010 2011 2012 2013 1H14
Canada India Israel
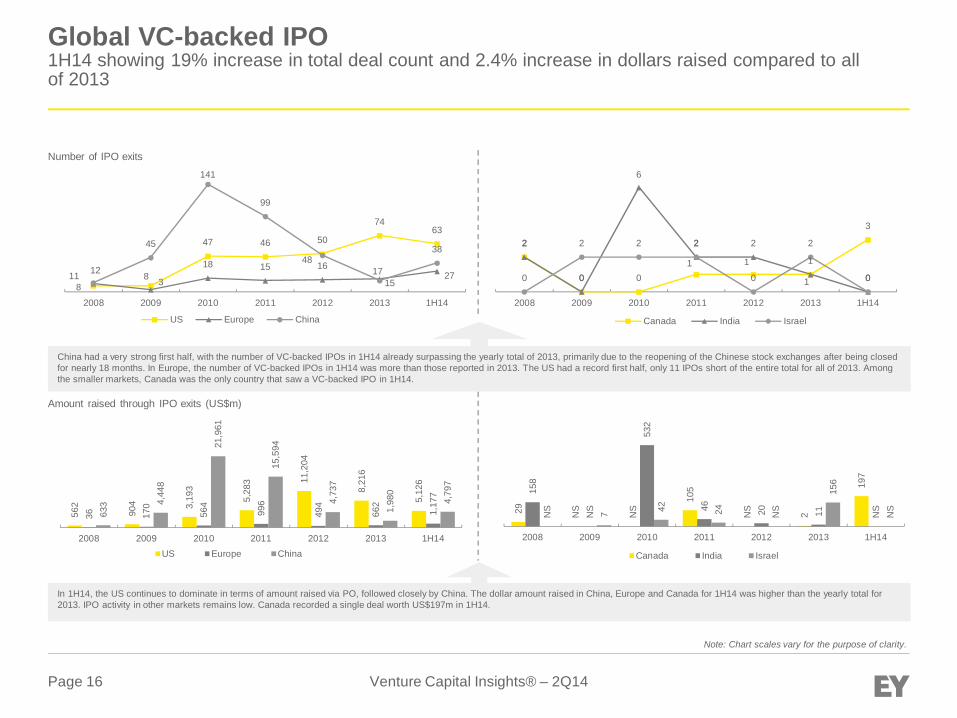
Amount raised through IPO exits (US$m)
In 1H14, the US continues to dominate in terms of amount raised via PO, followed closely by China. The dollar amount raised in China, Europe and Canada for 1H14 was higher than the yearly total for2013. IPO activity in other markets remains low. Canada recorded a single deal worth US$197m in 1H14.
Global VC-backed IPO1H14 showing 19% increase in total deal count and 2.4% increase in dollars raised compared to allof 2013
562
904 3,19
3
5,28
3 11,2
04
8,21
6
5,12
6
36 170
564
996
494
662
1,17
7
633 4,
448
21,9
61
15,5
94
4,73
7
1,98
0
4,79
7
2008 2009 2010 2011 2012 2013 1H14US Europe China
Note: Chart scales vary for the purpose of clarity.
2
0 01 1 1
3
2
0
6
2 2
1 00
2 2 2
0
2
0
2008 2009 2010 2011 2012 2013 1H14
Canada India Israel
88
47 46 50
7463
11 3
18 15 16 17 2712
45
141
99
48
15
38
2008 2009 2010 2011 2012 2013 1H14
US Europe China
China had a very strong first half, with the number of VC-backed IPOs in 1H14 already surpassing the yearly total of 2013, primarily due to the reopening of the Chinese stock exchanges after being closedfor nearly 18 months. In Europe, the number of VC-backed IPOs in 1H14 was more than those reported in 2013. The US had a record first half, only 11 IPOs short of the entire total for all of 2013. Amongthe smaller markets, Canada was the only country that saw a VC-backed IPO in 1H14.
Number of IPO exits
Venture Capital Insights® – 2Q14Page 17
2,30
9
1,13
0
1,35
6
2,39
6
2,87
4
2,68
8
434
44 243
1,21
3
413
336 73
3
433
1,33
3
799 962
827
907
1,56
1
245
2008 2009 2010 2011 2012 2013 1H14
Canada India Israel
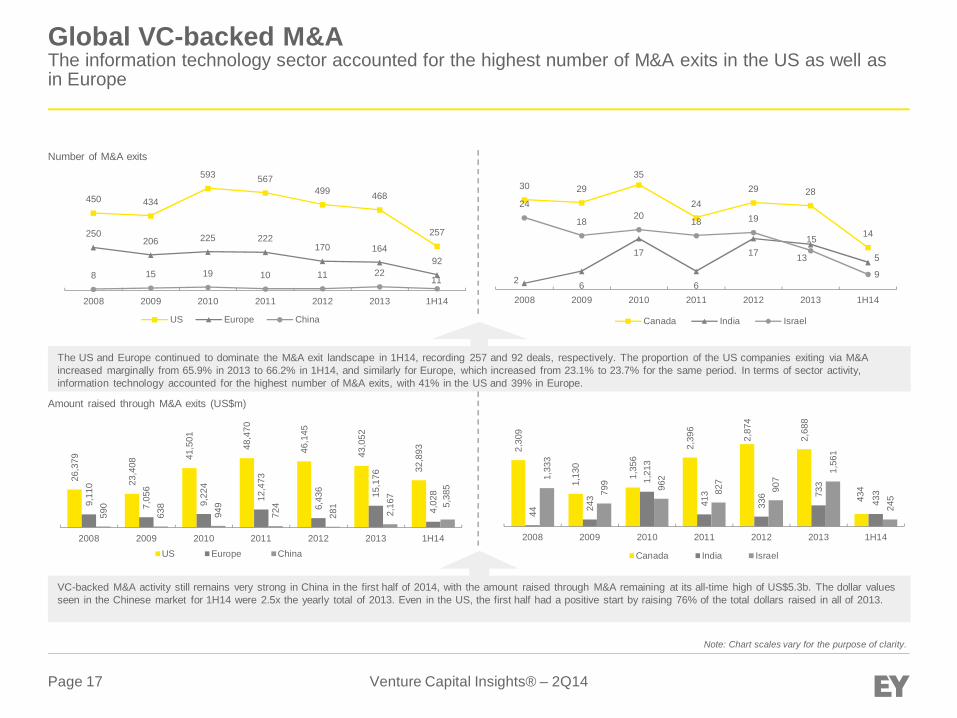
Amount raised through M&A exits (US$m)
VC-backed M&A activity still remains very strong in China in the first half of 2014, with the amount raised through M&A remaining at its all-time high of US$5.3b. The dollar valuesseen in the Chinese market for 1H14 were 2.5x the yearly total of 2013. Even in the US, the first half had a positive start by raising 76% of the total dollars raised in all of 2013.
Global VC-backed M&AThe information technology sector accounted for the highest number of M&A exits in the US as well asin Europe
26,3
79
23,4
08
41,5
01
48,4
70
46,1
45
43,0
52
32,8
93
9,11
0
7,05
6
9,22
4
12,4
73
6,43
6 15,1
76
4,02
8
590
638
949
724
281
2,16
7
5,38
5
2008 2009 2010 2011 2012 2013 1H14US Europe China
Note: Chart scales vary for the purpose of clarity.
30 2935
2429 28
14
2 6
17
6
1715
9
24
18 20 18 19
13 5
2008 2009 2010 2011 2012 2013 1H14
Canada India Israel
450 434
593 567499 468
257250206 225 222
170 16492
8 15 19 10 11 2211
2008 2009 2010 2011 2012 2013 1H14
US Europe China
The US and Europe continued to dominate the M&A exit landscape in 1H14, recording 257 and 92 deals, respectively. The proportion of the US companies exiting via M&Aincreased marginally from 65.9% in 2013 to 66.2% in 1H14, and similarly for Europe, which increased from 23.1% to 23.7% for the same period. In terms of sector activity,information technology accounted for the highest number of M&A exits, with 41% in the US and 39% in Europe.
Number of M&A exits
Section 3: Investment in enterprise and consumerventure-backed companiesAnalysis by geography round class, median amount raised and pre-money valuation
Venture Capital Insights® – 2Q14Page 19
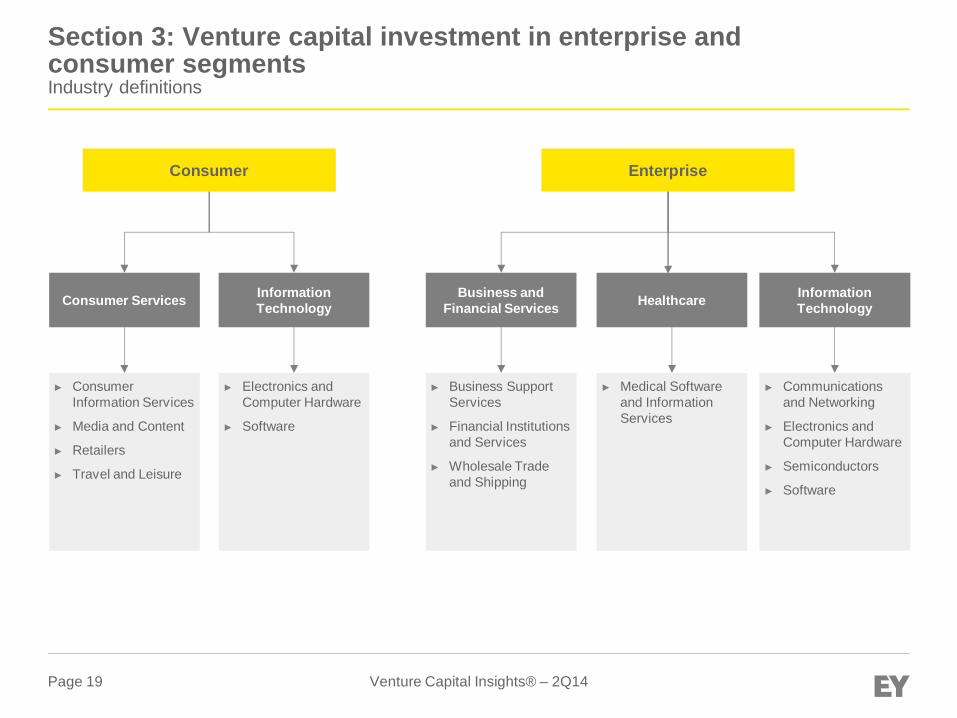
Section 3: Venture capital investment in enterprise andconsumer segmentsIndustry definitions
Consumer Enterprise
Consumer Services InformationTechnology
Business andFinancial Services Healthcare Information
Technology
► ConsumerInformation Services
► Media and Content
► Retailers
► Travel and Leisure
► Electronics andComputer Hardware
► Software
► Business SupportServices
► Financial Institutionsand Services
► Wholesale Tradeand Shipping
► Medical Softwareand InformationServices
► Communicationsand Networking
► Electronics andComputer Hardware
► Semiconductors
► Software
Venture Capital Insights® – 2Q14Page 20
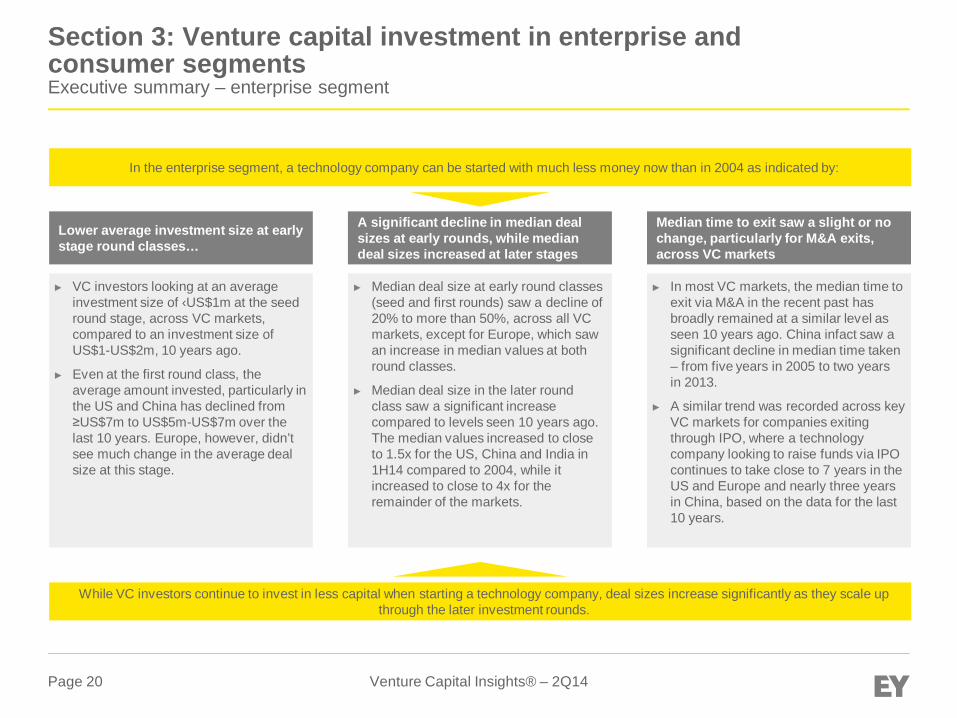
Section 3: Venture capital investment in enterprise andconsumer segmentsExecutive summary – enterprise segment
In the enterprise segment, a technology company can be started with much less money now than in 2004 as indicated by:
While VC investors continue to invest in less capital when starting a technology company, deal sizes increase significantly as they scale upthrough the later investment rounds.
► VC investors looking at an averageinvestment size of ‹US$1m at the seedround stage, across VC markets,compared to an investment size ofUS$1-US$2m, 10 years ago.
► Even at the first round class, theaverage amount invested, particularly inthe US and China has declined from≥US$7m to US$5m-US$7m over thelast 10 years. Europe, however, didn’tsee much change in the average dealsize at this stage.
Lower average investment size at earlystage round classes…
► Median deal size at early round classes(seed and first rounds) saw a decline of20% to more than 50%, across all VCmarkets, except for Europe, which sawan increase in median values at bothround classes.
► Median deal size in the later roundclass saw a significant increasecompared to levels seen 10 years ago.The median values increased to closeto 1.5x for the US, China and India in1H14 compared to 2004, while itincreased to close to 4x for theremainder of the markets.
A significant decline in median dealsizes at early rounds, while mediandeal sizes increased at later stages
► In most VC markets, the median time toexit via M&A in the recent past hasbroadly remained at a similar level asseen 10 years ago. China infact saw asignificant decline in median time taken– from five years in 2005 to two yearsin 2013.
► A similar trend was recorded across keyVC markets for companies exitingthrough IPO, where a technologycompany looking to raise funds via IPOcontinues to take close to 7 years in theUS and Europe and nearly three yearsin China, based on the data for the last10 years.
Median time to exit saw a slight or nochange, particularly for M&A exits,across VC markets
Venture Capital Insights® – 2Q14Page 21
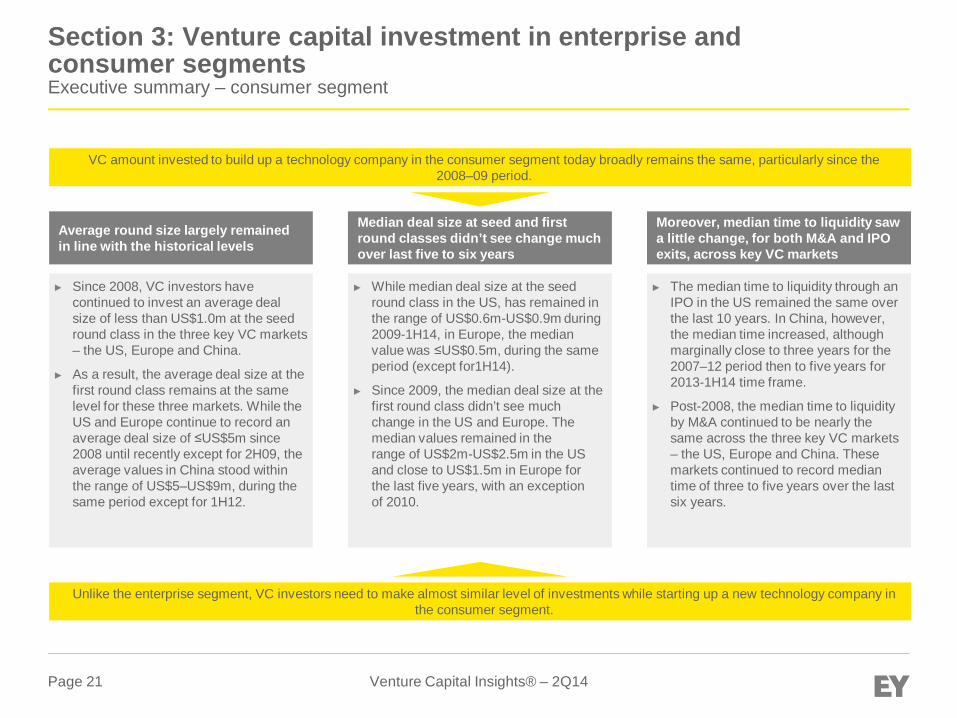
Section 3: Venture capital investment in enterprise andconsumer segmentsExecutive summary – consumer segment
► Since 2008, VC investors havecontinued to invest an average dealsize of less than US$1.0m at the seedround class in the three key VC markets– the US, Europe and China.
► As a result, the average deal size at thefirst round class remains at the samelevel for these three markets. While theUS and Europe continue to record anaverage deal size of ≤US$5m since2008 until recently except for 2H09, theaverage values in China stood withinthe range of US$5–US$9m, during thesame period except for 1H12.
► While median deal size at the seedround class in the US, has remained inthe range of US$0.6m-US$0.9m during2009-1H14, in Europe, the medianvalue was ≤US$0.5m, during the sameperiod (except for1H14).
► Since 2009, the median deal size at thefirst round class didn’t see muchchange in the US and Europe. Themedian values remained in therange of US$2m-US$2.5m in the USand close to US$1.5m in Europe forthe last five years, with an exceptionof 2010.
► The median time to liquidity through anIPO in the US remained the same overthe last 10 years. In China, however,the median time increased, althoughmarginally close to three years for the2007–12 period then to five years for2013-1H14 time frame.
► Post-2008, the median time to liquidityby M&A continued to be nearly thesame across the three key VC markets– the US, Europe and China. Thesemarkets continued to record mediantime of three to five years over the lastsix years.
VC amount invested to build up a technology company in the consumer segment today broadly remains the same, particularly since the2008–09 period.
Unlike the enterprise segment, VC investors need to make almost similar level of investments while starting up a new technology company inthe consumer segment.
Average round size largely remainedin line with the historical levels
Median deal size at seed and firstround classes didn’t see change muchover last five to six years
Moreover, median time to liquidity sawa little change, for both M&A and IPOexits, across key VC markets

Section 3.1: Venture capital investment in enterprise andconsumer segmentsAnalysis by geography
Venture Capital Insights® – 2Q14Page 23
Section 3.1: VC investment in enterprise and consumer segmentsSummary by geography
Enterprise segment
► For the US and Europe, the average deal sizes have broadly remained the same over the last 10 years. While for the US, it has been close toUS$10m, except in 1H14, which saw an average of US$14m, Europe has seen average deal sizes of US$5m over the same time frame. Thisindicates that the VC investors have been investing similar amounts of money to build technology companies across these two markets since1H04 up until 1H14.
► Over the last 10 years, China saw higher average values ‒ for 1H08-1H12 period, the market had average values of US$10m or more, exceptfor 2H09. While the average deal size declined during 2H12-2H13 potentially due to IPO markets being closed for 18 months, in 1H14, itrebounded to US$16m to reach the highest level seen over the last 10 years.
► Smaller markets like Canada and Israel saw a mixed trend in average deal sizes over the last 10 years. However, developing markets such asIndia, building a technology company primarily in BFSI and the information technology (IT) sub-sectors has become cheaper, as reflected byfalling average deal sizes over the same period. After seeing average deal sizes close to US$10m for 2H06-1H09 period, India saw a sharpdecline, with average deal value dropping down to nearly US$6m-US$8m for the 2H09-1H14 period, with the exception for 2H11, which saw anaverage value of US$10m.
Consumer segment
► In the consumer segment, building a technology company across the consumer services and IT sub-sectors is the least expensive in Europe asthe European market continued to see the lowest average deal size compared to the US and Chinese markets in 1H14. The average deal sizein Europe remained below US$10m mark for the first half of 2014, although it was the highest seen in the last 10 years at US$8m.
► While the US average deal size remained broadly in line with the historical levels, China saw a huge jump over the last 10 years, largely drivenby consumer services sector. The average value in China grew from US$10m during 1H04-2H07 time period to ≥US$12m since 1H08 up untilrecently, with the exception in 2009, which saw an average deal size of US$9m, suggesting VC investors continued to remain optimistic ininvesting, albeit largely in the later round classes, to build a technology company in the consumer segment in China.
► In Canada and Israel, the average deal size largely stayed close to US$5m for the last 10 years, there are a few exceptions where there mayhave been a few megadeals that resulted in a skewed deal size in the consumer segment. In India, however, the average values declined fromas high as US$21m in 2H05 to below US$10m mark since 1H07, largely driven by the consumer services sub-sector.
Venture Capital Insights® – 2Q14Page 24
1,50
1
1,49
6
1,53
5
1,55
1
1,42
1
1,25
3 1,43
3 1,65
5
1,70
6
1,79
0
875
748
755
640 71
5
556
471
498
481
513 582
319
63 74 112
139
125
102
107
118
90 120
8473 66 59 62 54 45 59 64 84 90 4082 84 84 93 85 56 42 45 45 78 369 13 32 46 51 48 52 69 80 87 36
2004 2005 2006 2007 2008 2009 2010 2011 2012 2013 1H14
Number of unique companies by year of financing event – enterprise segment US Europe China Canada Israel (all site) India
177 26
1
376 46
8 506
442
572
740
839
774
370
118
136 17
0
296
285
249 29
9 347 42
0 494
221
37 70
112
132
130
101
119 20
6
153 18
7
121
5 7 10 17 9 14 8 26 29 37 165 7 14 18 13 14 12 14 22 25 230 7 24 25 39 22 38 64 96 85 51
2004 2005 2006 2007 2008 2009 2010 2011 2012 2013 1H14
Number of unique companies by year of financing event – consumer segment
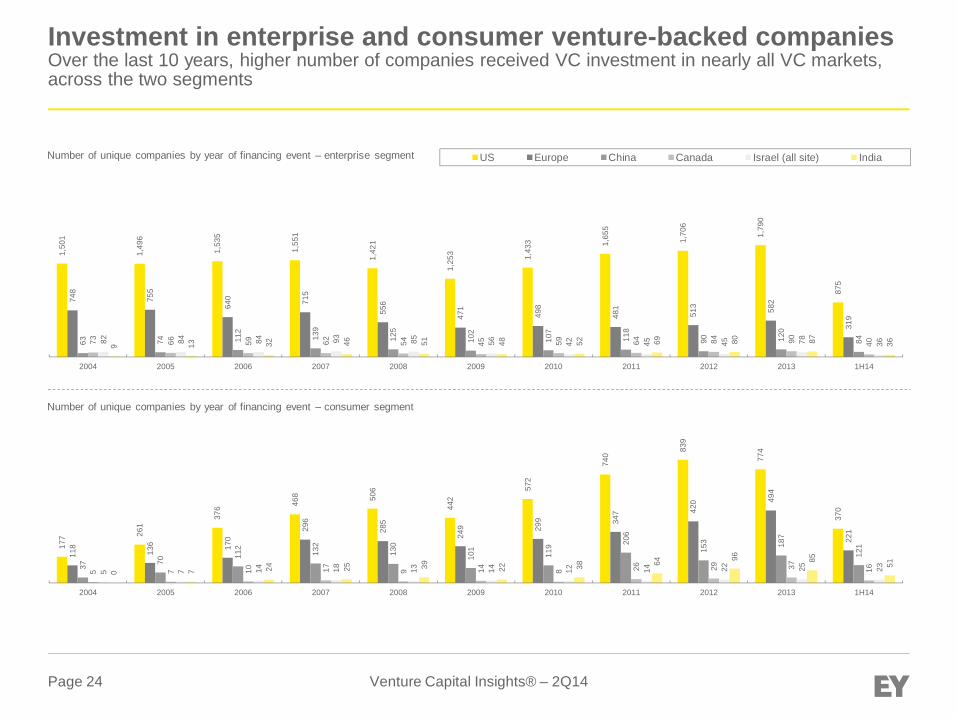
Investment in enterprise and consumer venture-backed companiesOver the last 10 years, higher number of companies received VC investment in nearly all VC markets,across the two segments

Venture Capital Insights® – 2Q14Page 25
Investment in enterprise and consumer venture-backed companiesVC investors continue to make larger investments in China across the two segments, particularlypost-2010
1,57
2
1,57
0
1,60
6
1,61
4
1,47
3
1,30
9
1,52
5
1,73
7
1,77
6
1,89
2
894
785
786
670
737
570
485
516
492
521
607
320
66 81 118
146
128
104
112
121
92 127
8473 68 63 63 57 47 62 69 86 93 4084 87 87 97 90 58 43 46 47 80 3610 13 32 49 51 49 52 69 81 87 38
2004 2005 2006 2007 2008 2009 2010 2011 2012 2013 1H14
Number of rounds – enterprise segment
Amount invested (US$m) – enterprise segment
Number of rounds – consumer segment
Amount invested (US$m) – consumer segment
192 27
9 396 48
5
537
466 59
9 793 88
3
814
377
122
147
174 31
1
290
261
308
359 43
5 519
229
37 76 120
136
133
103
128 21
9
154
203
124
5 7 10 17 9 16 9 27 32 40 165 7 15 20 13 14 12 14 23 26 230 7 28 26 40 22 39 69 101
93 52
2004 2005 2006 2007 2008 2009 2010 2011 2012 2013 1H14
13,7
84
14,3
40
16,7
71
15,9
27
13,3
29
9,37
1
11,5
12
14,4
66
15,1
45
16,1
64
12,3
62
2,20
9
2,46
1
2,51
5
2,98
1
2,82
5
1,61
7
2,68
3
2,11
7
1,86
2
1,99
6
1,79
3
597
704
1,24
0
1,27
2
1,31
3
834
1,29
1
1,44
2
911
1,07
3
1,37
2
428
395
417
369
462
290
394
357
587
633
246
404
451
463
610
636
252
242
379
207
520
319
69 110
267
454
482
411
387
541
424
462
244
2004 2005 2006 2007 2008 2009 2010 2011 2012 2013 1H14
1,46
1
2,14
0
3,21
4
3,95
3
4,35
7
3,25
0 5,39
9
7,21
2
6,48
3
6,84
9
6,20
7
434
490
800
1,13
9
1,20
0
1,34
2
1,14
2
2,03
0
2,07
6
2,60
2
1,73
5
115
493
859
1,37
0
2,21
1
928
3,12
7
3,76
2
2,92
8
2,76
8
3,46
4
35 27 61 83 35 44 45 253
162
193
163
24 25 86 73 48 22 115
71 122
521
540 91 272
175
349
119
268
621
611
1,00
3
926
2004 2005 2006 2007 2008 2009 2010 2011 2012 2013 1H14
US Europe China Canada Israel (all site) India
Venture Capital Insights® – 2Q14Page 26
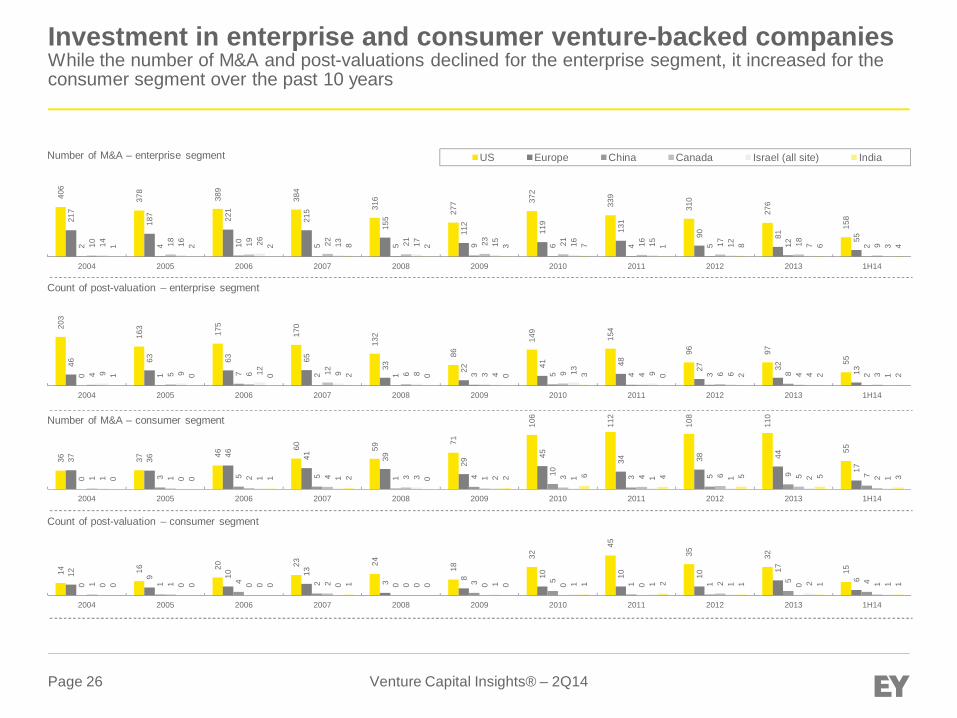
Investment in enterprise and consumer venture-backed companiesWhile the number of M&A and post-valuations declined for the enterprise segment, it increased for theconsumer segment over the past 10 years
406
378
389
384
316
277 37
2
339
310
276
15821
7
187 221
215
155
112
119
131
90 81 55
2 4 10 5 5 9 6 4 5 12 210 18 19 22 21 23 21 16 17 18 914 16 26 13 17 15 16 15 12 7 31 2 2 8 2 3 7 1 8 6 4
2004 2005 2006 2007 2008 2009 2010 2011 2012 2013 1H14
Number of M&A – enterprise segment
Count of post-valuation – enterprise segment
Number of M&A – consumer segment
Count of post-valuation – consumer segment
36 37 46
60 59
71
106
112
108
110
55
37 36 46 41 39 29
45
34 38 44
17
0 3 5 5 1 4 10 3 5 9 71 1 2 4 3 1 3 4 6 5 21 0 1 1 3 2 1 1 1 2 10 0 1 2 0 2 6 4 5 5 3
2004 2005 2006 2007 2008 2009 2010 2011 2012 2013 1H14
203
163
175
170
132
86
149
154
96 97
5546 63 63 65
33 22 41 48 27 32 130 1 7 2 1 3 5 4 3 8 24 5 6 12 6 3 9 4 6 4 39 9 12 9 8 4 13 9 6 4 11 0 0 2 0 0 3 0 2 2 2
2004 2005 2006 2007 2008 2009 2010 2011 2012 2013 1H14
14 16 20 23 24
18
32
45
35 32
1512 9 10 13
3 8 10 10 10
17
6
0 1 4 2 0 3 5 1 1 5 41 1 0 2 0 0 0 0 2 0 10 0 0 0 0 1 1 1 1 2 10 0 0 1 0 0 1 2 1 1 1
2004 2005 2006 2007 2008 2009 2010 2011 2012 2013 1H14
US Europe China Canada Israel (all site) India
Section 3.2: Venture capital investment in enterprise andconsumer segmentsAnalysis by key geographies and round class
Venture Capital Insights® – 2Q14Page 28
Section 3.2: Venture capital investment in enterprise andconsumer segmentsSummary by key geographies and round class
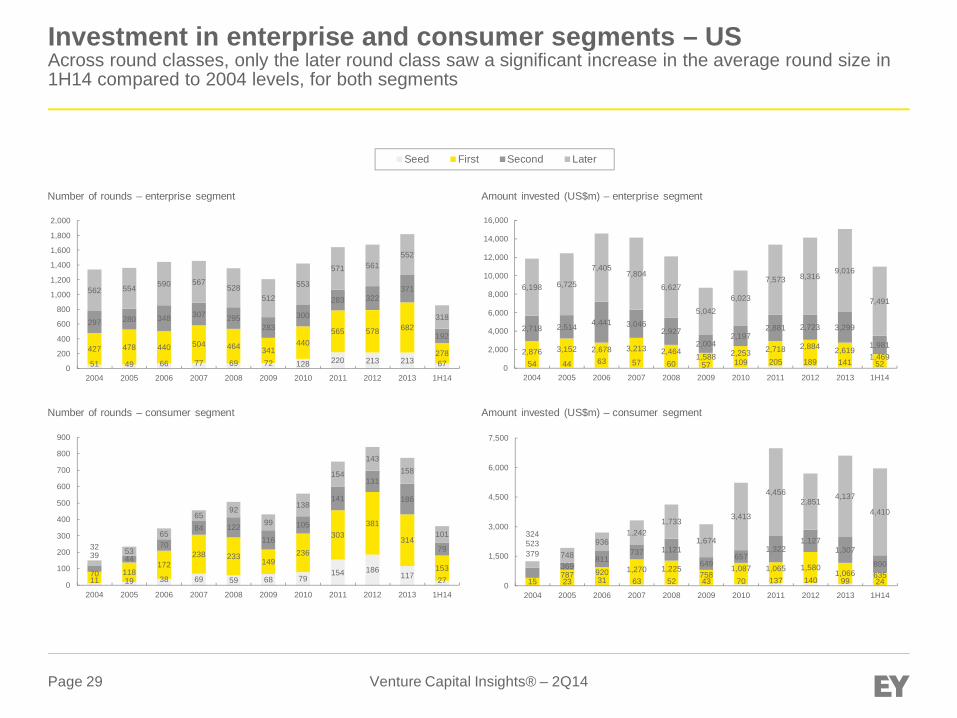
Enterprise segment► Global investment patterns show that a technology company could be started in 2014 with lower initial amount invested than in
2004, as evident from lower investment sizes at early rounds.
► Proportion of seed and first rounds in total deal count increased in the last 10 years, while that of later rounds has decreased.For the seed round, it has doubled from 4% in 1H04 to 8% in 1H14, while for later stage rounds, it dropped down from 39% to30%, respectively, during the same period. This implies that VC funding activity at early stages has became more frequent in therecent past, compared to that of 10 years ago.
► In terms of the dollar amount invested, there was a reverse in the investing pattern as the average round size at seed rounddropped down from US$1.1m in 1H04 to US$0.7m in 1H14, and the average round size in later stage rounds surged fromUS$8.9m to US$21.8m. This indicates that the technology companies are now able to start with much less capital than in 2004and scale it up later with much larger deals.
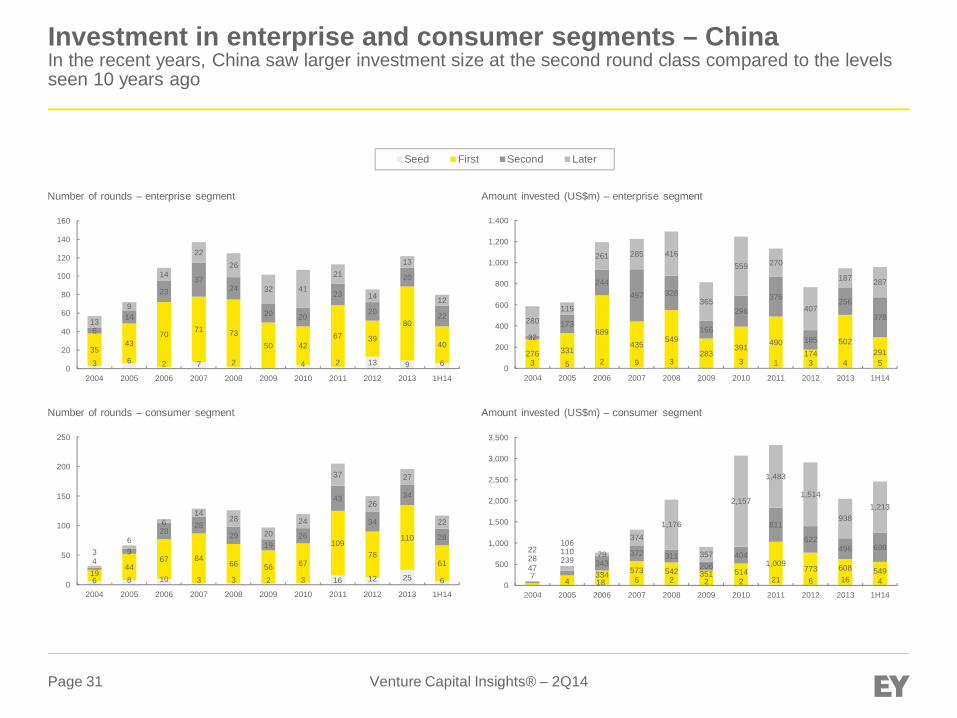
Consumer segment► The average deal sizes for seed, first and second rounds largely remained in line with the historical levels for the three key VC
markets – the US, Europe and China – indicating VC investors continue to make similar level of dollar investments while buildingup technology companies in these markets for the past 10 years.
► While the average values for seed round remained ≤US$1m across these three markets, China recorded significantly higheraverage deal sizes for the first and second rounds when compared to the US and Europe. Since 1H11, the US and Europe sawan average deal size of ≤US$5m for the first round and nearly US$10m for the second round. For China, the average deal valueswere close to US$10m, with an exception of 2H12–2H13 and, US$15m–US$20m for first and second rounds, respectively, for thesame period.
► Across these key markets, the average deal sizes at the later round class has increased significantly over the last 10 years.This suggests that VC investors are increasingly making larger investments to help the technology company scale up with anintent to have a successful exit via IPO or M&A.
Venture Capital Insights® – 2Q14Page 29
Investment in enterprise and consumer segments – USAcross round classes, only the later round class saw a significant increase in the average round size in1H14 compared to 2004 levels, for both segments
11 19 38 69 59 68 79154 186
117 2770 118
172238 233
149236
303381
314
15339 44
70
84 122116
105
141
131
186
7932 53
65
6592
99
138
154
143158
101
0
100
200
300
400
500
600
700
800
900
2004 2005 2006 2007 2008 2009 2010 2011 2012 2013 1H14
Number of rounds – consumer segment
15 23 31 63 52 43 70 137 140 99 24
379
787 920 1,270 1,225758
1,087 1,065 1,5801,066 635
523
369811
737 1,121
649657
1,3221,127
1,307
890
324
748936
1,2421,733
1,674
3,413
4,4562,851
4,137
4,410
0
1,500
3,000
4,500
6,000
7,500
2004 2005 2006 2007 2008 2009 2010 2011 2012 2013 1H14
Amount invested (US$m) – consumer segment
51 49 66 77 69 72 128 220 213 213 67
427 478 440 504 464 341440
565 578 682
278
297 280 348 307 295283
300
283 322371
192
562 554 590 567528
512
553
571 561552
318
0
200
400
600
800
1,000
1,200
1,400
1,600
1,800
2,000
2004 2005 2006 2007 2008 2009 2010 2011 2012 2013 1H14
54 44 63 57 60 57 109 205 189 141 522,876 3,152 2,678 3,213 2,464
1,588 2,253 2,718 2,884 2,6191,469
2,718 2,514 4,441 3,0462,927
2,0042,197
2,881 2,723 3,299
1,981
6,198 6,725
7,4057,804
6,627
5,0426,023
7,573 8,3169,016
7,491
0
2,000
4,000
6,000
8,000
10,000
12,000
14,000
16,000
2004 2005 2006 2007 2008 2009 2010 2011 2012 2013 1H14
Seed First Second Later
Number of rounds – enterprise segment Amount invested (US$m) – enterprise segment

Venture Capital Insights® – 2Q14Page 30
Investment in enterprise and consumer segments – EuropeThe consumer segment saw the average deal size increasing to US$28m in 1H14 from US$4m in 2004,while for enterprise, it increased from US$4m to US$14m
16 20 35 35 25 30 34 43 79 61 18
246 279 268 317246 223 232 251
262 315
182
171 150 121122
12185 90 86
83109
62
266 275187
209
147119 122 89
6885
52
0
100
200
300
400
500
600
700
800
2004 2005 2006 2007 2008 2009 2010 2011 2012 2013 1H14
11 15 24 28 22 24 24 34 45 22 12510 703 795 885 791 446 637 701 632 712 524
559 403539 530 541
391375
498 493 503376
1,0101,185
1,0401,425 1,406
650
1,048 796664 731
749
0
500
1,000
1,500
2,000
2,500
3,000
3,500
2004 2005 2006 2007 2008 2009 2010 2011 2012 2013 1H14
4 6 7 21 27 22 24 44 59 7411
57 63 109
195 162108
177186
230266
12514
1520
29 56
59
4868
73
88
4826
38
17
32 2449
3736
45
53
30
0
100
200
300
400
500
600
2004 2005 2006 2007 2008 2009 2010 2011 2012 2013 1H14
2 6 3 14 18 14 14 24 20 24 11
223 121339
597 494 596 571 670 589 537 361
70 9492
261 330 298 258398 502 774
271
110 226233
196 295407
272
747931
1,180
832
0
500
1,000
1,500
2,000
2,500
3,000
2004 2005 2006 2007 2008 2009 2010 2011 2012 2013 1H14
Number of rounds – consumer segment Amount invested (US$m) – consumer segment
Number of rounds – enterprise segment Amount invested (US$m) – enterprise segment
Seed First Second Later
Venture Capital Insights® – 2Q14Page 31
Investment in enterprise and consumer segments – ChinaIn the recent years, China saw larger investment size at the second round class compared to the levelsseen 10 years ago
6 8 10 3 3 2 3 16 12 25 619
4467 84
66 56 67
10978
110
6149
2828
2919
26
43
34
34
28
36
614
28
2024
37
26
27
22
0
50
100
150
200
250
2004 2005 2006 2007 2008 2009 2010 2011 2012 2013 1H14
7 4 18 6 2 2 2 21 6 16 447
239
334 573 542 351 5141,009
773 608 54928
110343
372 311206
404
811
622496 69822
10679
3741,176
357
2,157
1,483
1,514
9381,213
0
500
1,000
1,500
2,000
2,500
3,000
3,500
2004 2005 2006 2007 2008 2009 2010 2011 2012 2013 1H14
3 6 2 7 2 4 2 13 9 6
3543
70 71 7350 42
67 39
80
40
6
14
2337
24
20 20
23
20
20
2213
9
14
2226
32 41
21
14
13
12
0
20
40
60
80
100
120
140
160
2004 2005 2006 2007 2008 2009 2010 2011 2012 2013 1H14
3 5 2 9 3 3 1 3 4 5276 331
689435
549
283391 490
174502
291
32
173
244497 328
166
296
376
185
256
378280115
261 285 416
365
559 270
407
187 287
0
200
400
600
800
1,000
1,200
1,400
2004 2005 2006 2007 2008 2009 2010 2011 2012 2013 1H14
Number of rounds – enterprise segment Amount invested (US$m) – enterprise segment
Number of rounds – consumer segment Amount invested (US$m) – consumer segment
Seed First Second Later

Venture Capital Insights® – 2Q14Page 32
33 21 24 20 40 24 38 19 43 17 24 34 46 63 89 115
100
89 82 59 523 12 10 13 15 16 33 30 34 18 15 28 32 38 57 80 74 66 43 56 24
4 7 12 718 20
38 3140
1931
37
40 39
67
8799
87
58 59
272823 28 21
36 30 4334
4821
3537
66 62
105115
126
87
124
89
67
020406080100120140
020406080
100120140
1H04 2H04 1H05 2H05 1H06 2H06 1H07 2H07 1H08 2H08 1H09 2H09 1H10 2H10 1H11 2H11 1H12 2H12 1H13 2H13 1H14
Investment in seed roundCompared to the consumer segment, the proportion of seed rounds in total deal count for the enterprisesegment has been consistently higher in the US in last 10 years, except in 1H14
US
Note: Chart scales vary for the purpose of clarity.
Europe
1.2 0.9 0.8 1.0 1.1 0.8 0.9 0.5 0.9 0.8 0.7 0.9 0.7 1.0 0.9 1.0 0.8 1.0 0.7 0.7 0.8
Amount invested (US$m) — enterprise Amount invested (US$m) — consumer Number of rounds — enterprise Number of rounds — consumer
0.8 1.7 0.8 1.8 0.8 0.8 0.9 1.0 0.9 1.0 0.5 0.8 0.8 1.0 0.9 0.9 0.7 0.8 0.7 0.9 0.9
Average round size (US$m)
Enterprise
Consumer
0.6 0.8 0.6 0.9 0.6 0.7 0.9 0.8 1.0 0.8 1.3 0.6 0.5 0.8 0.6 0.9 0.9 0.4 0.4 0.4 0.7
0.4 - 1.9 0.6 0.4 0.4 0.6 0.7 0.8 0.5 0.8 0.6 0.7 0.5 0.6 0.5 0.5 0.3 0.4 0.3 1.0
Average round size (US$m)
Enterprise
Consumer
6 5 8 6 11 12 13 15 10 12 13 12 6 18 10 24 23 23 6 16 122 4 2 1 2 7 7 12 6 4 10 4 10 14 10 9 11 10 14 11
4 0 2 4 2
5 129
1611
5 17 6
1822 22 20
39
23
51
11106
137
18 17 1520
1015
10
2012
2217
26 25
54
17
44
18
0
10
20
30
40
50
60
0
5
10
15
20
25
30
1H04 2H04 1H05 2H05 1H06 2H06 1H07 2H07 1H08 2H08 1H09 2H09 1H10 2H10 1H11 2H11 1H12 2H12 1H13 2H13 1H14

Venture Capital Insights® – 2Q14Page 33
Investment in seed roundLower round sizes are seen in China and Canada compared to 10 years ago
China- 1.0 0.3 1.2 0.9 - 1.0 1.8 2.0 0.6 - - 0.8 0.7 0.4 0.8 0.3 0.2 0.6 0.4 0.8
1.8 0.9 0.5 0.8 2.8 0.7 1.4 3.0 0.7 0.5 0.6 1.5 0.5 0.5 1.1 1.4 0.6 0.2 0.5 0.7 0.7
Average round size (US$m)
Enterprise
Consumer
Canada
1.5 1.5 0.7 1.1 0.6 3.0 1.6 1.1 0.6 0.3 0.7 0.7 - 1.2 0.7 0.9 0.6 1.1 0.5 0.9 0.3
- 1.0 0.5 - - - 0.7 0.8 - 0.5 0.5 0.7 - 0.3 0.6 0.6 0.7 0.1 0.5 0.2 -
Average round size (US$m)
Enterprise
Consumer
3 1 4 2 5 4 2 1 2 1 0 1 3 1 2 2 54 4 3 1 14 4 3 3 1 1 1 1 1 1 6 15 4 1 4 12 4
2
4
7
1
5 5
2 1 2 1 1
1
21
5
11
75
9
16
6
0
3 3 32
0
52
11
00
3 1 1 1
9
44
56
024681012141618
02468
1012141618
1H04 2H04 1H05 2H05 1H06 2H06 1H07 2H07 1H08 2H08 1H09 2H09 1H10 2H10 1H11 2H11 1H12 2H12 1H13 2H13 1H14
3 5 3 7 2 3 3 2 1 0 2 1 2 2 3 3 6 3 6 11 1 1 1 0 1 1 1 2 1 4 1 2 00
1 1
0 0 0
21
0
1 11 0
2
3
2
6 6
4
3
0
23
4
6
3
12 2 2
1
3
1
02
3
3
6 66 6
4
01234567
01234567
1H04 2H04 1H05 2H05 1H06 2H06 1H07 2H07 1H08 2H08 1H09 2H09 1H10 2H10 1H11 2H11 1H12 2H12 1H13 2H13 1H14
Note: Chart scales vary for the purpose of clarity.
Amount invested (US$m) — enterprise Amount invested (US$m) — consumer Number of rounds — enterprise Number of rounds — consumer
Venture Capital Insights® – 2Q14Page 34
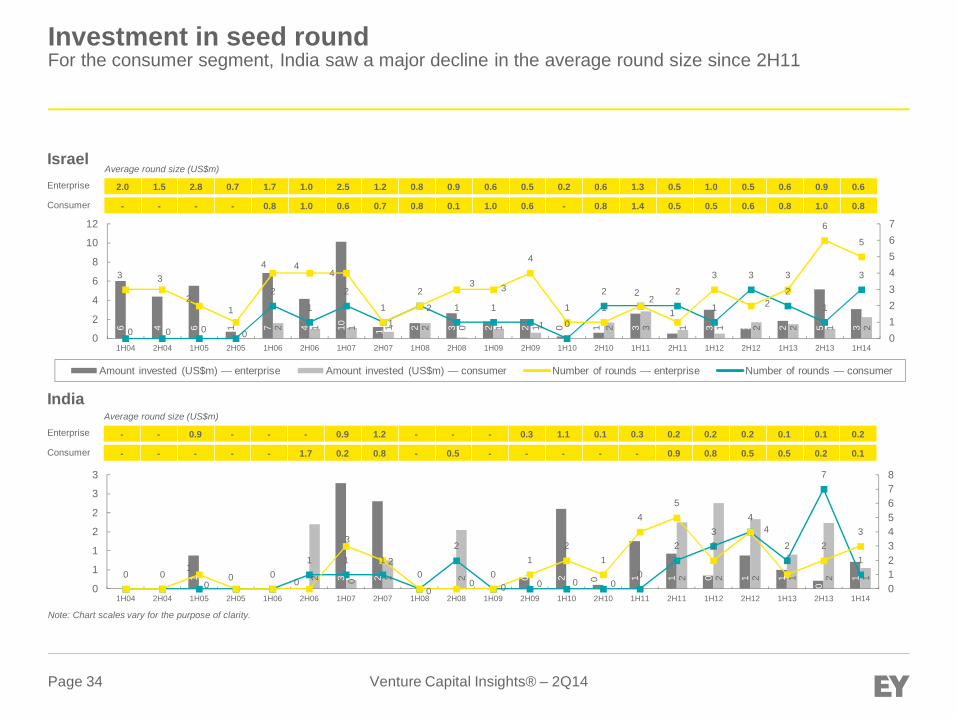
Investment in seed roundFor the consumer segment, India saw a major decline in the average round size since 2H11
Israel2.0 1.5 2.8 0.7 1.7 1.0 2.5 1.2 0.8 0.9 0.6 0.5 0.2 0.6 1.3 0.5 1.0 0.5 0.6 0.9 0.6
- - - - 0.8 1.0 0.6 0.7 0.8 0.1 1.0 0.6 - 0.8 1.4 0.5 0.5 0.6 0.8 1.0 0.8
Average round size (US$m)
Enterprise
Consumer
India
- - 0.9 - - - 0.9 1.2 - - - 0.3 1.1 0.1 0.3 0.2 0.2 0.2 0.1 0.1 0.2
- - - - - 1.7 0.2 0.8 - 0.5 - - - - - 0.9 0.8 0.5 0.5 0.2 0.1
Average round size (US$m)
Enterprise
Consumer
Note: Chart scales vary for the purpose of clarity.
1 3 2 0 2 0 1 1 0 1 1
0
12 0 1 2 2 2 2 1 2 10 00
01 1 1
0
2
00 0 0
0
23
4
2
7
11
0 0
3
2
00 0
12
1
45
2
4
12
3
012345678
0
1
1
2
2
3
3
1H04 2H04 1H05 2H05 1H06 2H06 1H07 2H07 1H08 2H08 1H09 2H09 1H10 2H10 1H11 2H11 1H12 2H12 1H13 2H13 1H14
6 4 6 1 7 4 10 1 2 3 2 2 0 1 3 1 3 1 2 5 32 1 1 1 2 0 1 1 2 3 1 1 2 2 1 20 0 0 0
2
1
2
1
2
1 1
1 0
2 2 2
1
3
2
1
33 3
21
4 44
12
3 3
4
1 12
1
3
2
3
6
5
01234567
0
2
4
6
8
10
12
1H04 2H04 1H05 2H05 1H06 2H06 1H07 2H07 1H08 2H08 1H09 2H09 1H10 2H10 1H11 2H11 1H12 2H12 1H13 2H13 1H14
Amount invested (US$m) — enterprise Amount invested (US$m) — consumer Number of rounds — enterprise Number of rounds — consumer

Venture Capital Insights® – 2Q14Page 35
Investment in first roundIn Europe, while the consumer segment saw a decline in the average round size over the last 10 years,the enterprise segment saw an increase of close to 50% in 1H14 compared to 1H04
US7.3 6.2 7.7 5.6 6.4 5.7 6.3 6.4 5.2 5.4 4.9 4.5 5.0 5.2 5.1 4.5 5.4 4.6 3.7 4.0 5.3
6.8 4.3 8.9 5.2 5.9 5.0 4.8 5.8 5.1 5.5 2.9 6.6 4.1 5.0 3.3 3.7 4.7 3.5 3.4 3.4 4.1
Average round size (US$m)
Enterprise
Consumer
Europe
2.0 2.1 2.4 2.7 3.2 2.7 3.2 2.4 3.6 2.9 1.8 2.1 2.7 2.8 2.3 3.3 2.3 2.5 2.2 2.3 2.9
3.5 4.3 1.3 2.4 2.5 3.5 3.1 3.1 3.5 2.6 2.1 8.4 3.5 3.0 4.8 2.6 3.1 2.1 2.5 1.5 2.9
Average round size (US$m)
Enterprise
Consumer
Note: Chart scales vary for the purpose of clarity.
1,55
8
1,31
8
1,77
6
1,37
6
1,51
5
1,16
3
1,71
1
1,50
2
1,19
0
1,27
4
742
846
988
1,26
5
1,37
1
1,34
7
1,51
2
1,37
2
1,23
0
1,38
9
1,46
9
211 16
8
416
371
428
492
538
732
689
535
178
580
412
675
480
584
984
596
519
547
63531 39 47 71 73
99 111 127 13598
6188 101
135 145 158211
170 154 160 153
213 214 232 246 237203
271233 227 237
153188 198
242268
297 279 299334 348
278
050100150200250300350400
0200400600800
1,0001,2001,4001,6001,8002,000
1H04 2H04 1H05 2H05 1H06 2H06 1H07 2H07 1H08 2H08 1H09 2H09 1H10 2H10 1H11 2H11 1H12 2H12 1H13 2H13 1H14
230
280
306
397
437
358
526
359
388
403
181
264
339
298
301
400
293
339
318
394
524
94 129
35 85 106
234
271
325
283
211
103
493
280
291
401
270
331
258
346
191
361
27 30 27 36 4267
89106
82 80
49 59
7998
84 102 108122 141
125 125115131 130
149137 131
167150
109
137
99124 125
107131
120 127 135147
168182
020406080100120140160180200
0
100
200
300
400
500
600
1H04 2H04 1H05 2H05 1H06 2H06 1H07 2H07 1H08 2H08 1H09 2H09 1H10 2H10 1H11 2H11 1H12 2H12 1H13 2H13 1H14
Amount invested (US$m) — enterprise Amount invested (US$m) — consumer Number of rounds — enterprise Number of rounds — consumer
Venture Capital Insights® – 2Q14Page 36
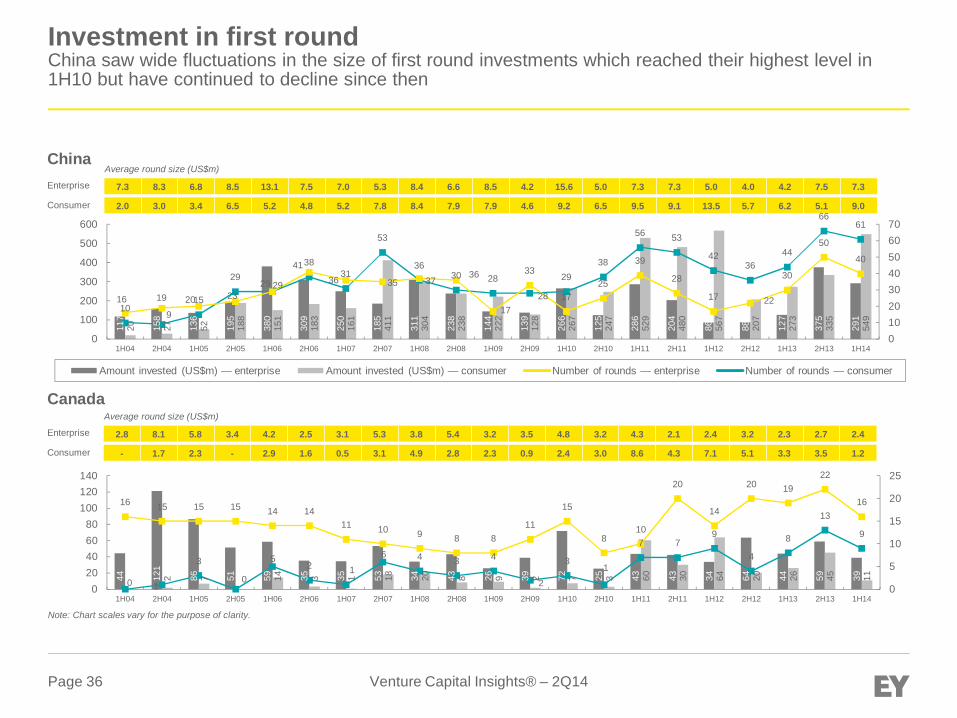
Investment in first roundChina saw wide fluctuations in the size of first round investments which reached their highest level in1H10 but have continued to decline since then
China7.3 8.3 6.8 8.5 13.1 7.5 7.0 5.3 8.4 6.6 8.5 4.2 15.6 5.0 7.3 7.3 5.0 4.0 4.2 7.5 7.3
2.0 3.0 3.4 6.5 5.2 4.8 5.2 7.8 8.4 7.9 7.9 4.6 9.2 6.5 9.5 9.1 13.5 5.7 6.2 5.1 9.0
Average round size (US$m)
Enterprise
Consumer
Canada
2.8 8.1 5.8 3.4 4.2 2.5 3.1 5.3 3.8 5.4 3.2 3.5 4.8 3.2 4.3 2.1 2.4 3.2 2.3 2.7 2.4
- 1.7 2.3 - 2.9 1.6 0.5 3.1 4.9 2.8 2.3 0.9 2.4 3.0 8.6 4.3 7.1 5.1 3.3 3.5 1.2
Average round size (US$m)
Enterprise
Consumer
Note: Chart scales vary for the purpose of clarity.
117
158
136
195
380
309
250
185
311
238
144
139
266
125
286
204
86 88 127
375
291
20 27 52 188
151
183
161
411
304
238
222
128
267
247
529
480
567
207
273
335
549
109
15
2929
3831
53
3630 28
28
2938
56 53
4236
44
6661
16 19 20 2329
4136 35 37
36
17
33
1725
39
28
17 22
30
50
40
010203040506070
0
100
200
300
400
500
600
1H04 2H04 1H05 2H05 1H06 2H06 1H07 2H07 1H08 2H08 1H09 2H09 1H10 2H10 1H11 2H11 1H12 2H12 1H13 2H13 1H14
44 121
86 51 59 35 35 53 34 43 26 39 72 25 43 43 34 64 44 59 392 7 14 3 1 18 20 8 9 2 7 3 60 30 64 20 26 45 110 1
3
0
52 1
6 4 3 4
2
31
7 79
4
8
13
9
16 15 15 15 14 1411 10 9 8 8
11
15
810
20
14
20 1922
16
0
5
10
15
20
25
020406080
100120140
1H04 2H04 1H05 2H05 1H06 2H06 1H07 2H07 1H08 2H08 1H09 2H09 1H10 2H10 1H11 2H11 1H12 2H12 1H13 2H13 1H14
Amount invested (US$m) — enterprise Amount invested (US$m) — consumer Number of rounds — enterprise Number of rounds — consumer

Venture Capital Insights® – 2Q14Page 37
Investment in first roundIn the enterprise segment, India recorded significantly high investments in the 2006-07 period, afterwhich the average round size saw a sharp decline
Israel3.7 3.4 3.2 6.0 4.1 3.5 7.6 5.1 5.3 5.1 3.4 3.8 3.0 4.7 1.9 4.9 2.0 3.0 3.7 4.4 5.1
- - 3.6 - 3.1 5.7 3.9 2.6 1.7 - 1.6 1.6 1.4 - 4.1 15.5 5.4 1.9 2.8 3.9 2.6
Average round size (US$m)
Enterprise
Consumer
India
2.5 12.2 3.8 6.1 4.9 14.0 10.7 7.2 6.8 7.5 4.1 3.7 5.4 4.0 3.8 5.4 2.5 2.8 2.3 2.5 3.2
- - 2.2 25.2 10.2 9.8 6.3 3.4 8.1 7.4 3.3 3.6 10.0 6.4 4.9 3.4 2.7 3.5 1.0 2.7 2.4
Average round size (US$m)
Enterprise
Consumer
Note: Chart scales vary for the purpose of clarity.
41 38 45 79 53 38 121
107
85 66 52 23 21 33 13 44 14 30 78 79 6615 3 17 28 10 5 6 2 4 16 31 27 13 25 16 410 04
01 3
74 3
0
4
1
30
42 5
7
9
4
16
11 1114 13 13
11
16
21
1613
15
6 7 7 79
710
2118
13
0
5
10
15
20
25
020406080
100120140
1H04 2H04 1H05 2H05 1H06 2H06 1H07 2H07 1H08 2H08 1H09 2H09 1H10 2H10 1H11 2H11 1H12 2H12 1H13 2H13 1H14
5 24 15 31 59 154
215
86 89 135
50 62 75 40 65 92 58 68 39 70 327 50 112
69 63 17 121
89 20 25 50 84 63 61 99 99 15 72 57
0 0
3
2
117
10
5
15
12
6 7 5
1313
18
37
28
15
2724
2 2 4 5
12 11
20
1213
18
12
1714
10
17 17
2324
17
28
10
0510152025303540
0
50
100
150
200
250
1H04 2H04 1H05 2H05 1H06 2H06 1H07 2H07 1H08 2H08 1H09 2H09 1H10 2H10 1H11 2H11 1H12 2H12 1H13 2H13 1H14
Amount invested (US$m) — enterprise Amount invested (US$m) — consumer Number of rounds — enterprise Number of rounds — consumer
Venture Capital Insights® – 2Q14Page 38
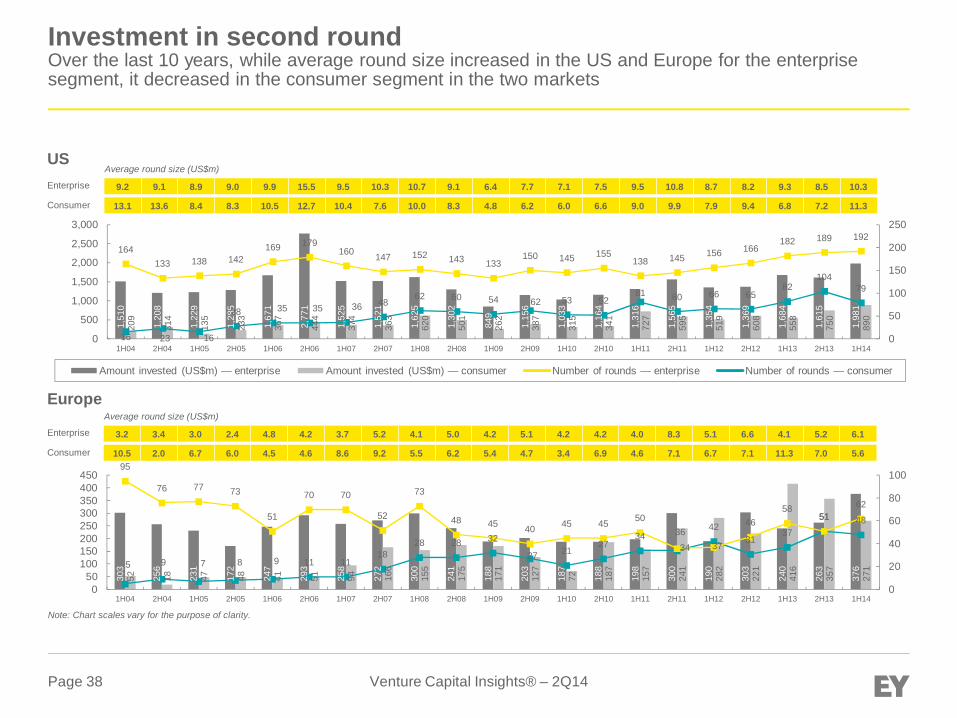
Investment in second roundOver the last 10 years, while average round size increased in the US and Europe for the enterprisesegment, it decreased in the consumer segment in the two markets
US9.2 9.1 8.9 9.0 9.9 15.5 9.5 10.3 10.7 9.1 6.4 7.7 7.1 7.5 9.5 10.8 8.7 8.2 9.3 8.5 10.3
13.1 13.6 8.4 8.3 10.5 12.7 10.4 7.6 10.0 8.3 4.8 6.2 6.0 6.6 9.0 9.9 7.9 9.4 6.8 7.2 11.3
Average round size (US$m)
Enterprise
Consumer
Europe
3.2 3.4 3.0 2.4 4.8 4.2 3.7 5.2 4.1 5.0 4.2 5.1 4.2 4.2 4.0 8.3 5.1 6.6 4.1 5.2 6.1
10.5 2.0 6.7 6.0 4.5 4.6 8.6 9.2 5.5 6.2 5.4 4.7 3.4 6.9 4.6 7.1 6.7 7.1 11.3 7.0 5.6
Average round size (US$m)
Enterprise
Consumer
Note: Chart scales vary for the purpose of clarity.
1,51
0
1,20
8
1,22
9
1,28
5
1,67
1
2,77
1
1,52
5
1,52
1
1,62
5
1,30
2
849
1,15
6
1,03
3
1,16
4
1,31
6
1,56
5
1,35
4
1,36
9
1,68
4
1,61
5
1,98
1
209
314
135
233
367
444
374
363
620
501
262
387
315
341
727
595
519
608
558
750
890
16 23 16
28 35 35 36 4862 60 54 62 53 52
81 60 66 6582
10479
164133 138 142
169 179160 147 152 143 133
150 145 155138 145 156 166
182 189 192
0
50
100
150
200
250
0
500
1,000
1,500
2,000
2,500
3,000
1H04 2H04 1H05 2H05 1H06 2H06 1H07 2H07 1H08 2H08 1H09 2H09 1H10 2H10 1H11 2H11 1H12 2H12 1H13 2H13 1H14
303
256
231
172
247
293
258
272
300
241
188
203
187
188
198
300
190
303
240
263
376
52 18 47 48 41 51 94 166
155
175
171
127
72 187
157
241
282
221
416
357
2715 9 7 8 9 11 11
1828 28 32
27 2127
3434
4231
37
51 48
95
76 77 73
51
70 70
52
73
48 45 40 45 45 5036
37
4658
5162
0
20
40
60
80
100
050
100150200250300350400450
1H04 2H04 1H05 2H05 1H06 2H06 1H07 2H07 1H08 2H08 1H09 2H09 1H10 2H10 1H11 2H11 1H12 2H12 1H13 2H13 1H14
Amount invested (US$m) — enterprise Amount invested (US$m) — consumer Number of rounds — enterprise Number of rounds — consumer
Venture Capital Insights® – 2Q14Page 39
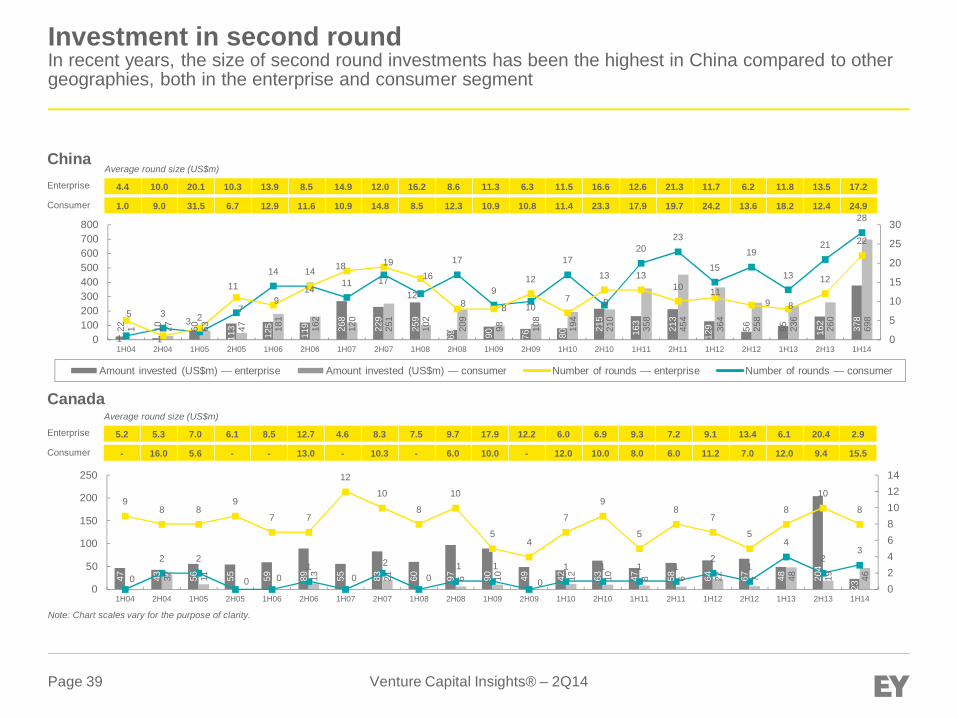
Investment in second roundIn recent years, the size of second round investments has been the highest in China compared to othergeographies, both in the enterprise and consumer segment
China4.4 10.0 20.1 10.3 13.9 8.5 14.9 12.0 16.2 8.6 11.3 6.3 11.5 16.6 12.6 21.3 11.7 6.2 11.8 13.5 17.2
1.0 9.0 31.5 6.7 12.9 11.6 10.9 14.8 8.5 12.3 10.9 10.8 11.4 23.3 17.9 19.7 24.2 13.6 18.2 12.4 24.9
Average round size (US$m)
Enterprise
Consumer
Canada
Amount invested (US$m) — enterprise Amount invested (US$m) — consumer Number of rounds — enterprise Number of rounds — consumer
5.2 5.3 7.0 6.1 8.5 12.7 4.6 8.3 7.5 9.7 17.9 12.2 6.0 6.9 9.3 7.2 9.1 13.4 6.1 20.4 2.9
- 16.0 5.6 - - 13.0 - 10.3 - 6.0 10.0 - 12.0 10.0 8.0 6.0 11.2 7.0 12.0 9.4 15.5
Average round size (US$m)
Enterprise
Consumer
Note: Chart scales vary for the purpose of clarity.
22 10 60
113
125
119 26
8
229
259
69 90 76 80
215
163
213
129 56 95 162
378
1 27 63 47 181
162
120
251
102
209
98 108
194
210
358
454
364
258
236
260
698
1
3 27
14 1411 17
12
17
9
10
17
9
2023
1519
13
21
28
5
1
3
119
14
18 1916
8 8
12
7
13 1310 11
9 8
12
22
0
5
10
15
20
25
30
0100200300400500600700800
1H04 2H04 1H05 2H05 1H06 2H06 1H07 2H07 1H08 2H08 1H09 2H09 1H10 2H10 1H11 2H11 1H12 2H12 1H13 2H13 1H14
47 43 56 55 59 89 55 83 60 97 90 49 42 63 47 58 64 67 48 204
23
32 11 13 21 6 10 12 10 8 6 22 7 48 19 460
2 2
0 01
02
01 1
0
1 1 1 12
1
4
23
98 8
9
7 7
12
10
8
10
54
7
9
5
87
5
8
10
8
02468101214
0
50
100
150
200
250
1H04 2H04 1H05 2H05 1H06 2H06 1H07 2H07 1H08 2H08 1H09 2H09 1H10 2H10 1H11 2H11 1H12 2H12 1H13 2H13 1H14

Venture Capital Insights® – 2Q14Page 40
Investment in second roundAverage round size in Israel rose significantly during 2H13 across segments, but remained below thelevels seen in 1H08
Israel8.3 4.3 5.8 5.3 6.6 10.8 5.2 6.8 14.3 6.6 4.6 10.4 4.6 8.5 7.7 8.2 4.0 4.5 9.0 10.2 7.6
1.0 16.0 - - 8.3 11.3 - 6.1 20.4 - 1.0 2.3 - 5.6 10.0 4.3 9.3 - 6.0 13.3 4.5
Average round size (US$m)
Enterprise
Consumer
India
Amount invested (US$m) — enterprise Amount invested (US$m) — consumer Number of rounds — enterprise Number of rounds — consumer
1.1 6.5 - - 4.0 13.7 15.3 5.8 12.7 10.8 23.9 6.7 13.1 6.7 6.7 14.8 10.0 8.2 10.3 5.5 6.2
- - - - - 10.5 16.3 10.0 10.1 12.7 5.0 4.2 9.2 7.0 22.3 13.5 8.6 11.7 14.7 9.5 10.0
Average round size (US$m)
Enterprise
Consumer
Note: Chart scales vary for the purpose of clarity.
100
21 52 21 86 76 36 74 172
73 28 42 23 68 62 16 8 23 81 72 611 16 8 23 24 20 1 5 17 10 9 19 6 53 9
1 10 0
12
0
4
10
1 2
0
31
2 2
0
1
4
2
12
5
9
4
13
7 7
1112
11
6
45
8 8
2 2
5
9
78
02468101214
0
50
100
150
200
1H04 2H04 1H05 2H05 1H06 2H06 1H07 2H07 1H08 2H08 1H09 2H09 1H10 2H10 1H11 2H11 1H12 2H12 1H13 2H13 1H14
2 7 8 41 31 17 51 43 72 40 78 47 13 148
50 58 92 71 6263 33 20 20 51 30 4 37 35 134
108
77 35 103
95 90
0 00 0
0
6
22 2
4
6
14 5
6 8
9
3
7
10
9
21 2
32
34 4
3
6 67
2
10
57
9
13
10
02468101214
020406080
100120140160
1H04 2H04 1H05 2H05 1H06 2H06 1H07 2H07 1H08 2H08 1H09 2H09 1H10 2H10 1H11 2H11 1H12 2H12 1H13 2H13 1H14
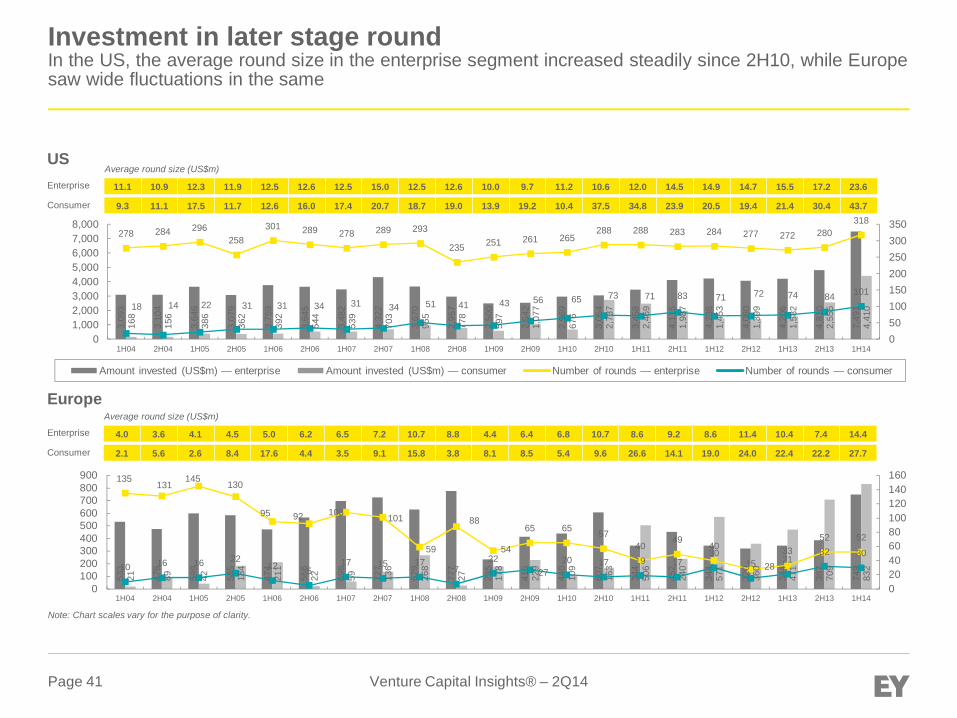
Venture Capital Insights® – 2Q14Page 41
Investment in later stage roundIn the US, the average round size in the enterprise segment increased steadily since 2H10, while Europesaw wide fluctuations in the same
US11.1 10.9 12.3 11.9 12.5 12.6 12.5 15.0 12.5 12.6 10.0 9.7 11.2 10.6 12.0 14.5 14.9 14.7 15.5 17.2 23.6
9.3 11.1 17.5 11.7 12.6 16.0 17.4 20.7 18.7 19.0 13.9 19.2 10.4 37.5 34.8 23.9 20.5 19.4 21.4 30.4 43.7
Average round size (US$m)
Enterprise
Consumer
Europe
Amount invested (US$m) — enterprise Amount invested (US$m) — consumer Number of rounds — enterprise Number of rounds — consumer
4.0 3.6 4.1 4.5 5.0 6.2 6.5 7.2 10.7 8.8 4.4 6.4 6.8 10.7 8.6 9.2 8.6 11.4 10.4 7.4 14.4
2.1 5.6 2.6 8.4 17.6 4.4 3.5 9.1 15.8 3.8 8.1 8.5 5.4 9.6 26.6 14.1 19.0 24.0 22.4 22.2 27.7
Average round size (US$m)
Enterprise
Consumer
Note: Chart scales vary for the purpose of clarity.
3,09
3
3,10
4
3,64
6
3,07
9
3,75
9
3,64
5
3,48
2
4,32
2
3,67
0
2,95
7
2,50
0
2,54
2
2,96
9
3,05
4
3,45
8
4,11
5
4,23
6
4,08
0
4,20
6
4,81
0
7,49
1
168
156
386
362
392
544
539
703
955
778
597
1,07
7
676
2,73
7
2,46
9
1,98
7
1,45
3
1,39
9
1,58
2
2,55
5
4,41
018 14 22 31 31 34 31 34 51 41 43 56 65 73 71 83 71 72 74 84 101
278 284 296258
301 289 278 289 293
235 251 261 265288 288 283 284 277 272 280
318
050100150200250300350
01,0002,0003,0004,0005,0006,0007,0008,000
1H04 2H04 1H05 2H05 1H06 2H06 1H07 2H07 1H08 2H08 1H09 2H09 1H10 2H10 1H11 2H11 1H12 2H12 1H13 2H13 1H14
533
476
599
585
474
566
698
727
629
777
235
415
440
607
344
452
344
320
344
387
749
21 89 42 184
211
22 59 136
268
27 178
229
109
163
506
240
571
360
471
709
83210 16 16 22
12 517 15 17
722
2720 17 19 17
3015 21
32 30
135131
145 130
95 92 108 101
59
88
54
65 65 5740
4940
28
3352 52
020406080100120140160
0100200300400500600700800900
1H04 2H04 1H05 2H05 1H06 2H06 1H07 2H07 1H08 2H08 1H09 2H09 1H10 2H10 1H11 2H11 1H12 2H12 1H13 2H13 1H14
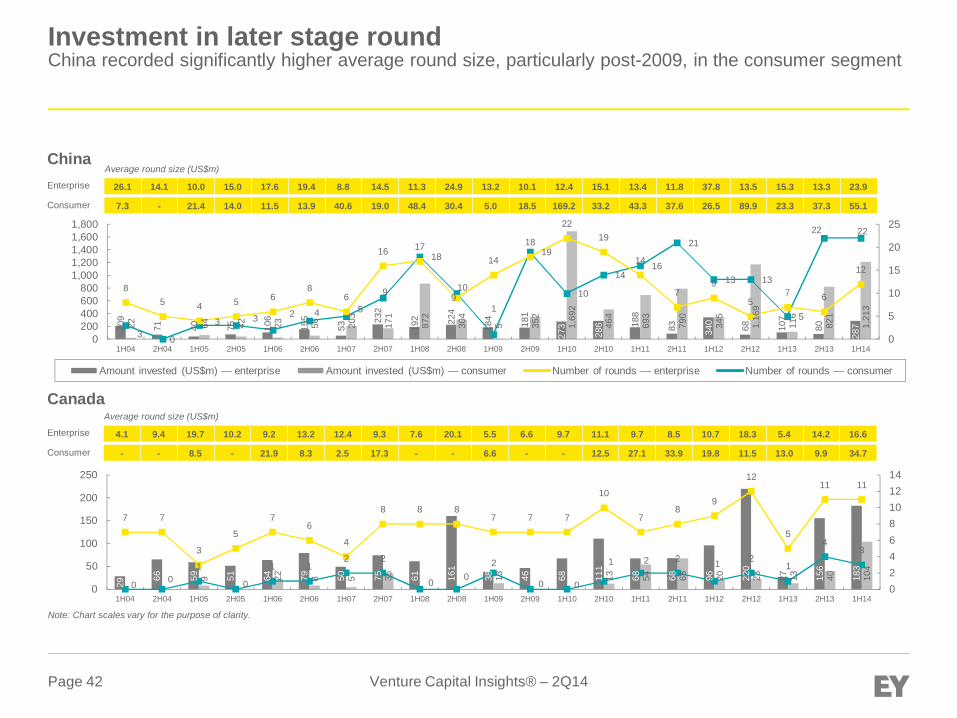
Venture Capital Insights® – 2Q14Page 42
Investment in later stage roundChina recorded significantly higher average round size, particularly post-2009, in the consumer segment
China26.1 14.1 10.0 15.0 17.6 19.4 8.8 14.5 11.3 24.9 13.2 10.1 12.4 15.1 13.4 11.8 37.8 13.5 15.3 13.3 23.9
7.3 - 21.4 14.0 11.5 13.9 40.6 19.0 48.4 30.4 5.0 18.5 169.2 33.2 43.3 37.6 26.5 89.9 23.3 37.3 55.1
Average round size (US$m)
Enterprise
Consumer
Canada
Amount invested (US$m) — enterprise Amount invested (US$m) — consumer Number of rounds — enterprise Number of rounds — consumer
4.1 9.4 19.7 10.2 9.2 13.2 12.4 9.3 7.6 20.1 5.5 6.6 9.7 11.1 9.7 8.5 10.7 18.3 5.4 14.2 16.6
- - 8.5 - 21.9 8.3 2.5 17.3 - - 6.6 - - 12.5 27.1 33.9 19.8 11.5 13.0 9.9 34.7
Average round size (US$m)
Enterprise
Consumer
Note: Chart scales vary for the purpose of clarity.
209
71 40 75 106
155
53
232
192 22
4
184
181
273
286 18
8
83 340 68 107
80
28722 64 42 23 56 20
3
171
872
304
5 352
1,69
2
464
693
790
345
1,16
9
116
821
1,21
3
3 0
3 3 2 4 5
9
18
10
1
19
10
1416
21
13 13
5
22 22
85 4 5 6
86
16 17
9
14
18
2219
14
79
57 6
12
0
5
10
15
20
25
0200400600800
1,0001,2001,4001,6001,800
1H04 2H04 1H05 2H05 1H06 2H06 1H07 2H07 1H08 2H08 1H09 2H09 1H10 2H10 1H11 2H11 1H12 2H12 1H13 2H13 1H14
29
66 59 51 64 79 50 75 61 161
38 46 68 111
68 68 96 220
27 156
183
9 22 8 5 35 13 13 54 68 20 23 13 40 104
0 01
0
1 12 2
0 02
0 0
1 2 2 1 21
43
7 7
3
5
76
4
8 8 87 7 7
10
78
9
12
5
11 11
02468101214
0
50
100
150
200
250
1H04 2H04 1H05 2H05 1H06 2H06 1H07 2H07 1H08 2H08 1H09 2H09 1H10 2H10 1H11 2H11 1H12 2H12 1H13 2H13 1H14
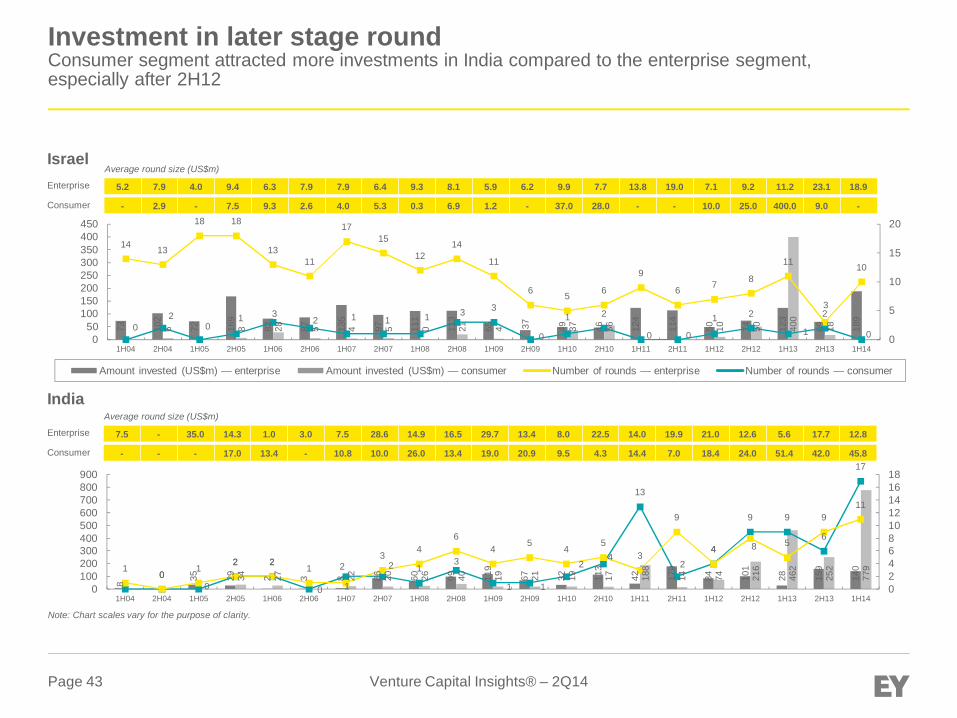
Venture Capital Insights® – 2Q14Page 43
Investment in later stage roundConsumer segment attracted more investments in India compared to the enterprise segment,especially after 2H12
Israel5.2 7.9 4.0 9.4 6.3 7.9 7.9 6.4 9.3 8.1 5.9 6.2 9.9 7.7 13.8 19.0 7.1 9.2 11.2 23.1 18.9
- 2.9 - 7.5 9.3 2.6 4.0 5.3 0.3 6.9 1.2 - 37.0 28.0 - - 10.0 25.0 400.0 9.0 -
Average round size (US$m)
Enterprise
Consumer
India
Amount invested (US$m) — enterprise Amount invested (US$m) — consumer Number of rounds — enterprise Number of rounds — consumer
7.5 - 35.0 14.3 1.0 3.0 7.5 28.6 14.9 16.5 29.7 13.4 8.0 22.5 14.0 19.9 21.0 12.6 5.6 17.7 12.8
- - - 17.0 13.4 - 10.8 10.0 26.0 13.4 19.0 20.9 9.5 4.3 14.4 7.0 18.4 24.0 51.4 42.0 45.8
Average round size (US$m)
Enterprise
Consumer
Note: Chart scales vary for the purpose of clarity.
73 102
72 169
82 87 135
97 111
113
65 37 49 46 124
114
50 74 123
69 189
6 8 28 5 4 5 0 21 4 37 56 10 50 400
1802
01 3
2 1 1 1 3 3
0
1 2
0 0
1 2
1
2
0
14 13
18 18
1311
1715
1214
11
6 5 6
9
6 7 8
11
3
10
0
5
10
15
20
050
100150200250300350400450
1H04 2H04 1H05 2H05 1H06 2H06 1H07 2H07 1H08 2H08 1H09 2H09 1H10 2H10 1H11 2H11 1H12 2H12 1H13 2H13 1H14
8 35 29 2 3 8 86 60 99 119
67 32 113
42 179
84 101
28 159
140
34 27 22 20 26 40 19 21 19 17 188
14 74 216
462
252
779
00
2 2
0
2 2 13
1 1
24
13
24
9 9
6
17
10
12 2
1
1
34
64
54
53
9
4 8 5
911
024681012141618
0100200300400500600700800900
1H04 2H04 1H05 2H05 1H06 2H06 1H07 2H07 1H08 2H08 1H09 2H09 1H10 2H10 1H11 2H11 1H12 2H12 1H13 2H13 1H14

Section 3.3: Venture capital investment in enterprise andconsumer segmentsAnalysis by median amount raised and pre-money valuations by round class
Venture Capital Insights® – 2Q14Page 45
Section 3.3: Median amount raised and pre-money valuations byround classSummary by year of investment
Median amount raised► In the US, companies are raising lower amounts in seed, first and second rounds compared to 10 years ago, and it is even more
notable since 2008. However, in contrast to lower amounts being raised in the earlier stages, higher amounts are being raised inthe later stage rounds.► In the US, for seed round investments, the median amount raised in the enterprise segment was the highest in 2004 and 2005 for
the past 10 years. Post-2005, it has consistently remained below the million-dollar mark.► For first round investments in the US, median amounts have been in the range of US$4.0m–US$5.1m for enterprise segment and
US$3.7–US$4.1m for consumer segment. Post 2008, this has come down to US$2.7m–US$3.5m and US$2.0m–US$3.0m, forenterprise and consumer segments, respectively.
► At US$12m for the enterprise segment, the median amount raised in 1H14 was the highest for the past 10 years.► Unlike the US, median amounts in Europe for 1H14 were higher than those reported 10 years ago, both in enterprise and
consumer segment, across all round classes.► In China, first round investments in the enterprise segment saw lower median amounts in 1H14, compared to 2004, while for all
other round types the median amount invested saw an increase.Median pre-money valuation► Early stage valuations remained largely stable in the US and Europe, while there was a significant increase in valuations reported
by Chinese companies during 2007-11.► In China, first round valuations rose post-2006 and remained at a high during the 2007-11 period, both in the enterprise and
consumer segments. Post-2011, however, there was a decline, but the median amounts still remained above pre-2007 levels.► Later stage investments in the US have been priced significantly high since 2011, as median pre-money valuations rose both in
the enterprise and consumer segments.► Unlike Europe and China, later stage pre-money valuations in the US since 2011 have risen multifold, compared to 2004-10 levels,
as VCs continue to pour more dollars, even for a lower share in the equity.► In 1H14, step-ups in the median pre-money valuations from second round were also attractive in the US, with an 11X step-up seen
in the enterprise segment and a 23X step-up in the consumer segment.
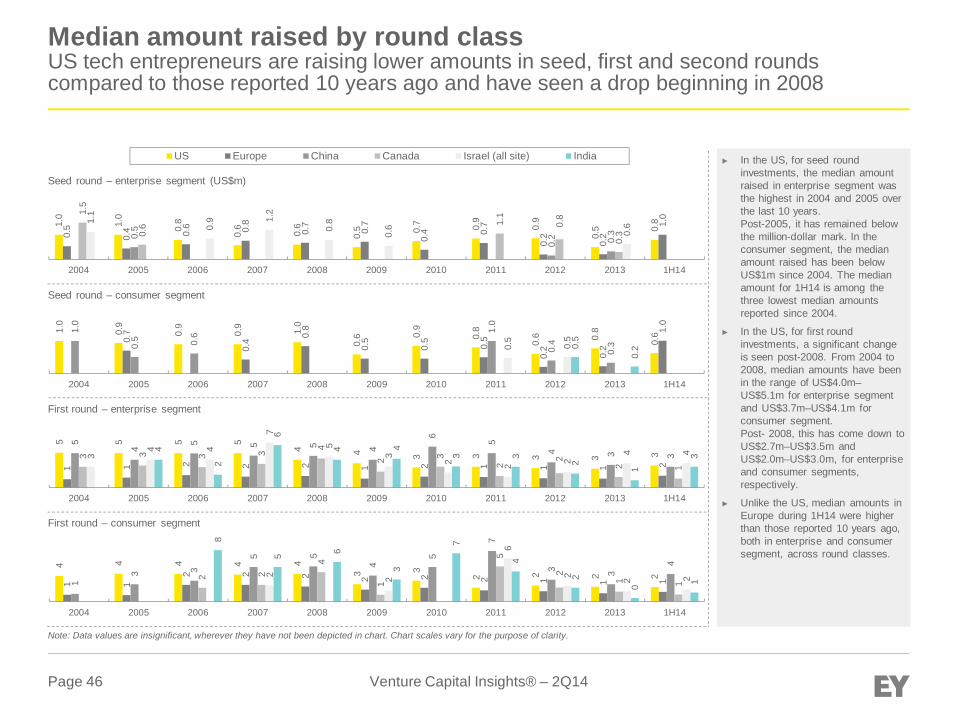
Venture Capital Insights® – 2Q14Page 46
Median amount raised by round classUS tech entrepreneurs are raising lower amounts in seed, first and second roundscompared to those reported 10 years ago and have seen a drop beginning in 2008
1.0
1.0
0.8
0.6
0.6
0.5 0.
7 0.9
0.9
0.5 0.
8
0.5
0.4 0.6 0.8
0.7
0.7
0.4 0.
7
0.2
0.2
1.0
0.5
0.2 0.3
1.5
0.6 1.
1
0.8
0.3
1.1
0.9 1.
2
0.8
0.6 0.6
2004 2005 2006 2007 2008 2009 2010 2011 2012 2013 1H14
Seed round – enterprise segment (US$m)
Seed round – consumer segment
US Europe China Canada Israel (all site) India
1.0
0.9
0.9
0.9 1.0
0.6 0.
9
0.8
0.6 0.
8
0.60.7
0.4 0.
8
0.5
0.5
0.5
0.2
0.2
1.0
1.0
0.5 0.6 1.
0
0.4
0.30.5
0.5
0.5
0.2
2004 2005 2006 2007 2008 2009 2010 2011 2012 2013 1H14
5 5 5 5
4 4 3 3 3 3 3
1 1 2 2 2 1 2 1 1 1 2
5
4
5 5 5 4
6
5
4 3 33 3 3 3 4
2 3
2
2
2 1
3
4 4
7
5
3
2 2 2
4 44
2
6
4 4
3 3
2
1
3
2004 2005 2006 2007 2008 2009 2010 2011 2012 2013 1H14
First round – enterprise segment
4 4 4 4 4
3 3
2 2 2 2
1 1
2 2 2 2 2 2 1 1 11
3 3
5 5
4
5
7
3 3
4
2 2
4
1
5
2
1 1
2 2
6
2 2 2
8
5 6
3
7
4
2
0 1
2004 2005 2006 2007 2008 2009 2010 2011 2012 2013 1H14
First round – consumer segment
► In the US, for seed roundinvestments, the median amountraised in enterprise segment wasthe highest in 2004 and 2005 overthe last 10 years.Post-2005, it has remained belowthe million-dollar mark. In theconsumer segment, the medianamount raised has been belowUS$1m since 2004. The medianamount for 1H14 is among thethree lowest median amountsreported since 2004.
► In the US, for first roundinvestments, a significant changeis seen post-2008. From 2004 to2008, median amounts have beenin the range of US$4.0m–US$5.1m for enterprise segmentand US$3.7m–US$4.1m forconsumer segment.Post- 2008, this has come down toUS$2.7m–US$3.5m andUS$2.0m–US$3.0m, for enterpriseand consumer segments,respectively.
► Unlike the US, median amounts inEurope during 1H14 were higherthan those reported 10 years ago,both in enterprise and consumersegment, across round classes.
Note: Data values are insignificant, wherever they have not been depicted in chart. Chart scales vary for the purpose of clarity.
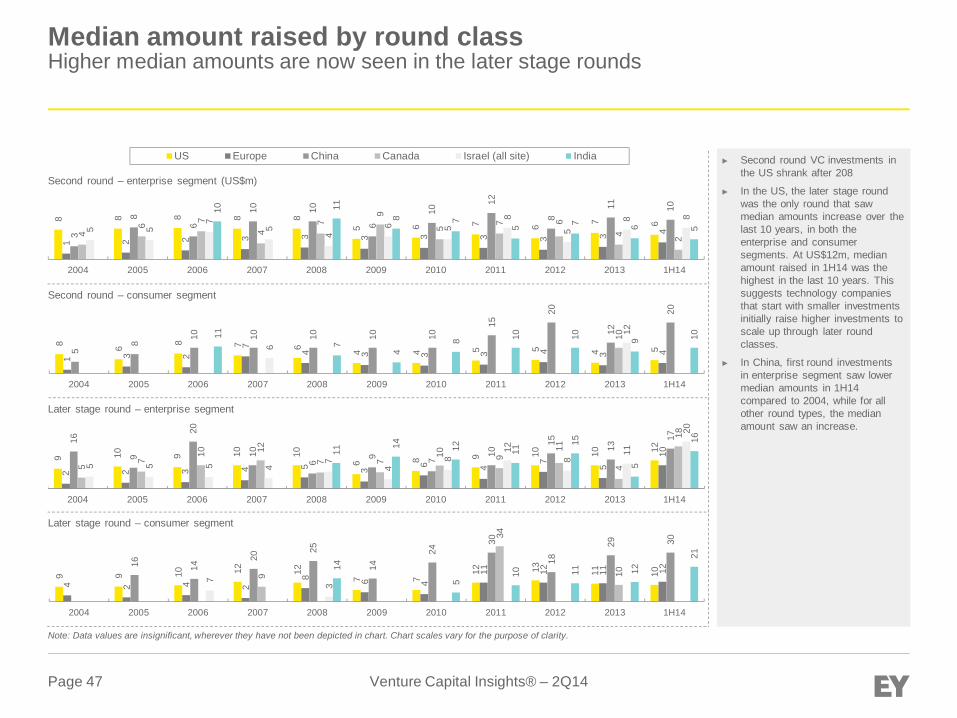
Venture Capital Insights® – 2Q14Page 47
Median amount raised by round classHigher median amounts are now seen in the later stage rounds
Note: Data values are insignificant, wherever they have not been depicted in chart. Chart scales vary for the purpose of clarity.
Second round – enterprise segment (US$m)
Second round – consumer segment
Later stage round – enterprise segment
Later stage round – consumer segment
► Second round VC investments inthe US shrank after 208
► In the US, the later stage roundwas the only round that sawmedian amounts increase over thelast 10 years, in both theenterprise and consumersegments. At US$12m, medianamount raised in 1H14 was thehighest in the last 10 years. Thissuggests technology companiesthat start with smaller investmentsinitially raise higher investments toscale up through later roundclasses.
► In China, first round investmentsin enterprise segment saw lowermedian amounts in 1H14compared to 2004, while for allother round types, the medianamount saw an increase.
US Europe China Canada Israel (all site) India
8 8 8 8 8
5 6 7 6 7 6
1 2 2 3 3 3 3 3 3 3 43
8
6
10 10
6
10
12
8
11 10
4
6 7
4
7
9
5 7 6
4 2
5 5
7
5
4
6 5
8
5
8 8
10 11
8 7
5 7 6 5
2004 2005 2006 2007 2008 2009 2010 2011 2012 2013 1H14
8 6 8 7 6 4 4 5 5 4 5
1 3 2
7
4 3 3 3 4 3 45
8
10 10 10 10 10
15
20
12
20
10
6
1211
7
4
8 10 10 9 10
2004 2005 2006 2007 2008 2009 2010 2011 2012 2013 1H14
9 10 9 10 10
6 8 9 10 10 12
2 2 3 4 5 3 6 4
7 5
10
16
9
20
10
6
9 7
10
15 13
17
5 7
10 12
7 7
10 9
11
4
18
5 5 5 4
7
4
8
12
8
11
20
11
14 12 11
15
5
16
2004 2005 2006 2007 2008 2009 2010 2011 2012 2013 1H14
9 9 10 12 12
7 7
12 13 11 10
4 2 4 2
8 6 4
11 12 11 12
16 14
20
25
14
24
30
18
29 30
9
34
107 314
5
10 11 12
21
2004 2005 2006 2007 2008 2009 2010 2011 2012 2013 1H14

Venture Capital Insights® – 2Q14Page 48
Median pre-money valuation by round classEarly stage valuations remained largely stable in the US and Europe, while there was asignificant increase in pre-money valuations for Chinese companies during 2007–11
Note: Data values are insignificant, wherever they have not been depicted in chart. Chart scales vary for the purpose of clarity.
Seed round (US$m) – enterprise segment
Seed round (US$m) – consumer segment
First round (US$m) – enterprise segment
First round (US$m) – consumer segment
► Early stage pre-money valuationshave largely remained stable inthe US and Europe over the last10 years, while China saw asignificant increase in pre-moneyvaluations during 2007–11 as firstand second round investmentsbecame more expensive.
► At the seed round, medianpre-money valuations in theenterprise segment in the US didnot see much change with valuesremaining in the range ofUS$1.7m to US$2.8m during last10 years, except in 2012. In theconsumer segment, valuationssaw a yearly decline in 2012and 2013.
► In China, first round valuationsrose post–2006 and first round VCinvestments were pricedsignificantly higher during the2007–11 period, both in theenterprise and consumersegments. Median amounts stilldeclined after 2011 but remainedabove pre-2007 levels.
US Europe China Israel (all site)
2 2
2 2 2
3
2
3
4
2
1 1 1 1
2004 2005 2006 2007 2008 2009 2010 2011 2012 2013 1H14
1
2 2
3
2
11 14
2004 2005 2006 2007 2008 2009 2010 2011 2012 2013 1H14
3 3 4 5 4 2 3 3 3 2 69 10 8 11
23 26
30
18
6 8 12
6 3 7 10
6
2004 2005 2006 2007 2008 2009 2010 2011 2012 2013 1H14
5 8 7 7 6 8 6 5 8 4 63 2 4 3 6 3 5 6 3 2 23 5 5
31
15 18 15 18
5 8
13
2004 2005 2006 2007 2008 2009 2010 2011 2012 2013 1H14
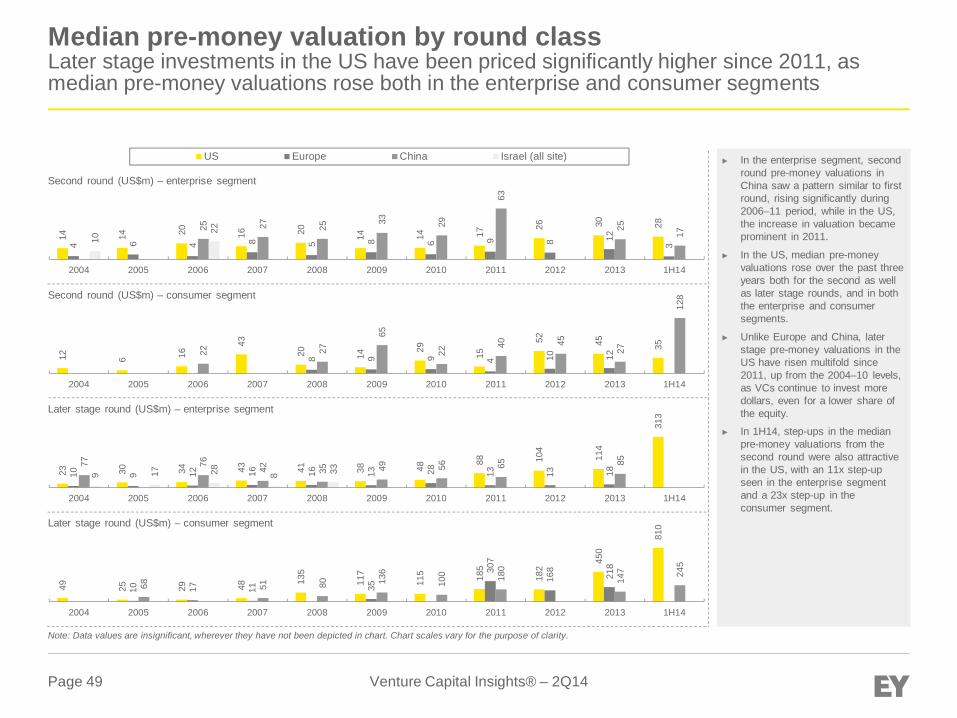
Venture Capital Insights® – 2Q14Page 49
Median pre-money valuation by round classLater stage investments in the US have been priced significantly higher since 2011, asmedian pre-money valuations rose both in the enterprise and consumer segments
Note: Data values are insignificant, wherever they have not been depicted in chart. Chart scales vary for the purpose of clarity.
Second round (US$m) – enterprise segment
Second round (US$m) – consumer segment
Later stage round (US$m) – enterprise segment
Later stage round (US$m) – consumer segment
► In the enterprise segment, secondround pre-money valuations inChina saw a pattern similar to firstround, rising significantly during2006–11 period, while in the US,the increase in valuation becameprominent in 2011.
► In the US, median pre-moneyvaluations rose over the past threeyears both for the second as wellas later stage rounds, and in boththe enterprise and consumersegments.
► Unlike Europe and China, laterstage pre-money valuations in theUS have risen multifold since2011, up from the 2004–10 levels,as VCs continue to invest moredollars, even for a lower share ofthe equity.
► In 1H14, step-ups in the medianpre-money valuations from thesecond round were also attractivein the US, with an 11x step-upseen in the enterprise segmentand a 23x step-up in theconsumer segment.
US Europe China Israel (all site)
12 6 16
43
20 14
29 15
52 45 35
8 9 9 4 10 1222 27
65
22
40 45
27
128
2004 2005 2006 2007 2008 2009 2010 2011 2012 2013 1H14
23 30 34 43 41 38 48
88 104
114
313
10 9 12 16 16 13 28 13 13 18
77 76 42 35 49 56 65 85
9 17 28 8 33
2004 2005 2006 2007 2008 2009 2010 2011 2012 2013 1H14
49 25 29 48 135
117
115 185
182
450
810
10 17 11 35
307
168
218
68 51 80 136
100 18
0
147 24
5
2004 2005 2006 2007 2008 2009 2010 2011 2012 2013 1H14
14 14 20 16 20 14 14 17
26 30 28
4 6 4 8 5 8 6 9 8 12
3
25 27 25
33 29
63
25
1710
22
2004 2005 2006 2007 2008 2009 2010 2011 2012 2013 1H14
Section 3.4: Venture capital investment in enterprise andconsumer segmentsAnalysis by median amount raised and pre-money valuations by round class by year of liquidity
Venture Capital Insights® – 2Q14Page 51
Section 3.4: Median amount raised and pre-money valuations byround classSummary by year of liquidity
Median amount raised► In the US, the consumer segment companies that have exited in the recent past raised lower amounts of funding in
first and second rounds and higher amounts in late stage rounds compared to 2010 levels, while in the enterprisesegment, size of VC funding remains relatively consistent for all years across all round classes.► Size of first round funding in the consumer segment has seen a consistent decline in the US starting in 2010 for companies
that exited via IPO.
► US companies in the consumer segments raised lower-sized second rounds compared to those 10 years ago. For theenterprise companies in the US, however, median round sizes did not show much if any change.
► Compared to 2010, US companies in the consumer segment raised larger amounts in later stage rounds for liquidity during1H14, while the enterprise segment saw an opposite trend.
Median pre-money valuation► Across markets, only the US recorded median pre-money valuations prior to M&A in the enterprise segment at the
seed round. Since 2009, the valuations have stayed close to US$2m up until 2013 for the US, compared to US$5mduring 2006-08.
► Since 2011, the median pre-money valuations at the first round in the US declined significantly for the consumersegment, particularly for IPO from US$17m in 2011 to US$6m in 1H14. For the enterprise segment it has remained atthe same levels US$6m–US$8m for the same period.
► In the US 1H14, median pre-money valuations prior to IPO at the second round reached its highest levels (US$43m)since 2011 for the enterprise segment, while other markets continued to record insignificant valuations. The consumersegment, however, recorded an all-time low median valuations in the US (US$26m) for the same period.
► For the later round, 1H14 saw the highest pre-money valuations prior to IPO for the enterprise segment over the past10 years in the US (US$158m) and China (US$65m).
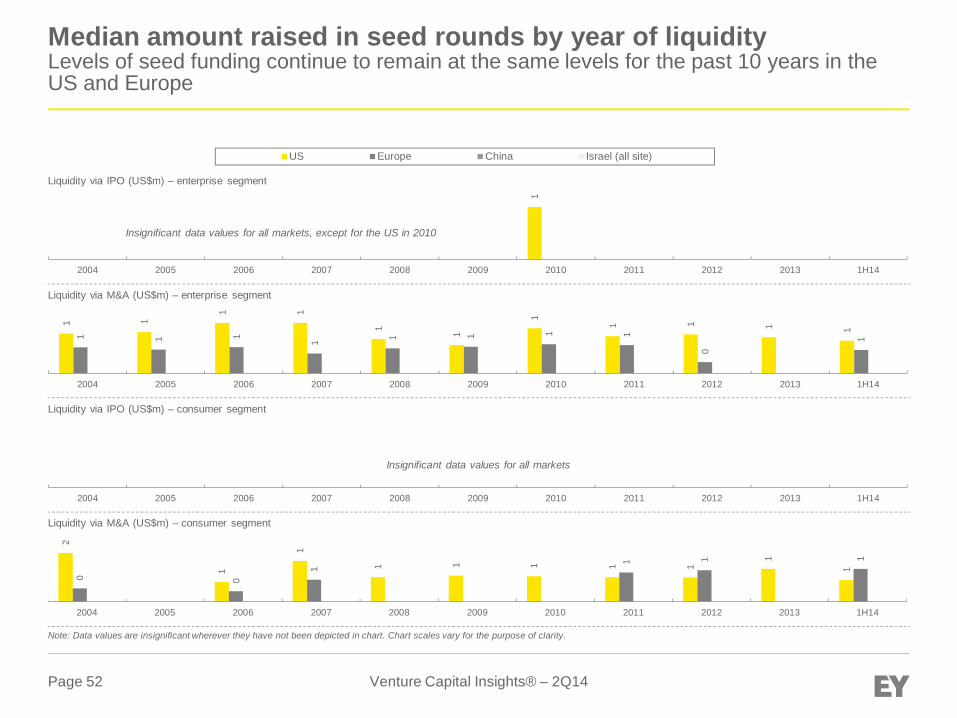
Venture Capital Insights® – 2Q14Page 52
Median amount raised in seed rounds by year of liquidityLevels of seed funding continue to remain at the same levels for the past 10 years in theUS and Europe
Liquidity via IPO (US$m) – enterprise segment
US Europe China Israel (all site)
Liquidity via M&A (US$m) – enterprise segment
Liquidity via IPO (US$m) – consumer segment
Liquidity via M&A (US$m) – consumer segment1
2004 2005 2006 2007 2008 2009 2010 2011 2012 2013 1H14
1 1
1 1
1 1
1
1 1 1 1
1 1 1
1 1 1 1 1
0
1
2004 2005 2006 2007 2008 2009 2010 2011 2012 2013 1H14
2004 2005 2006 2007 2008 2009 2010 2011 2012 2013 1H14
2
1
1
1 1 1 1 1
1
1
0 0
1
1 1 1
2004 2005 2006 2007 2008 2009 2010 2011 2012 2013 1H14
Insignificant data values for all markets
Insignificant data values for all markets, except for the US in 2010
Note: Data values are insignificant wherever they have not been depicted in chart. Chart scales vary for the purpose of clarity.
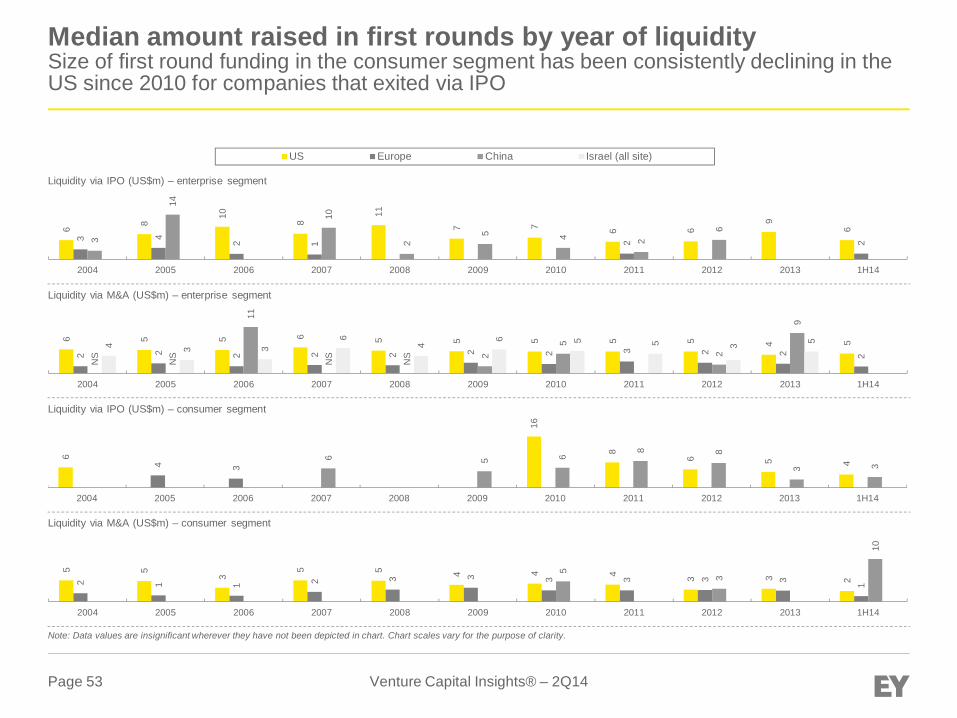
Venture Capital Insights® – 2Q14Page 53
Median amount raised in first rounds by year of liquiditySize of first round funding in the consumer segment has been consistently declining in theUS since 2010 for companies that exited via IPO
Liquidity via IPO (US$m) – enterprise segment
US Europe China Israel (all site)
Liquidity via M&A (US$m) – enterprise segment
Liquidity via IPO (US$m) – consumer segment
Liquidity via M&A (US$m) – consumer segment
Note: Data values are insignificant wherever they have not been depicted in chart. Chart scales vary for the purpose of clarity.
6 8
10
8
11
7 7 6 6
9
6
3 4 2 1 2 23
14
10
2
5 4 2
6
2004 2005 2006 2007 2008 2009 2010 2011 2012 2013 1H14
6 5 5 6 5 5 5 5 5 4 5
2 2 2 2 2 2 2 3 2 2 2
NS
NS
11
NS
NS 2
5
2
9
4 3 3
6
4
6 5 5 3 5
2004 2005 2006 2007 2008 2009 2010 2011 2012 2013 1H14
6
16
8
6 5 44 3
6 5 6
8 8
3 3
2004 2005 2006 2007 2008 2009 2010 2011 2012 2013 1H14
5 5
3
5 5 4 4 4 3 3 22 1 1 2 3 3 3 3 3 3 1
5
3
10
2004 2005 2006 2007 2008 2009 2010 2011 2012 2013 1H14
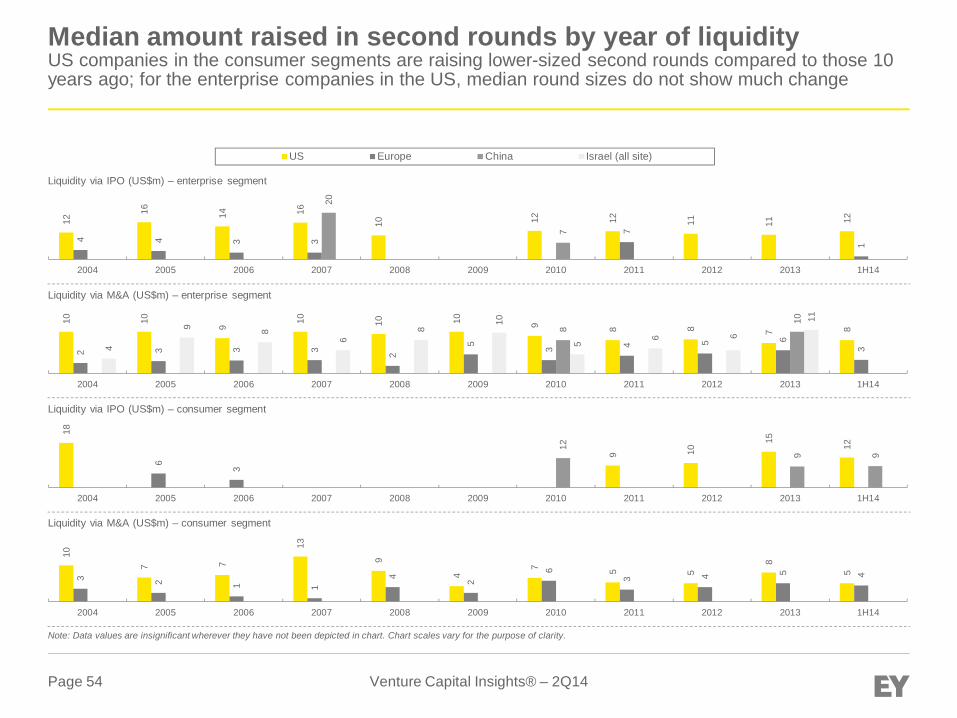
Venture Capital Insights® – 2Q14Page 54
Median amount raised in second rounds by year of liquidityUS companies in the consumer segments are raising lower-sized second rounds compared to those 10years ago; for the enterprise companies in the US, median round sizes do not show much change
Liquidity via IPO (US$m) – enterprise segment
US Europe China Israel (all site)
Liquidity via M&A (US$m) – enterprise segment
Liquidity via IPO (US$m) – consumer segment
Liquidity via M&A (US$m) – consumer segment
Note: Data values are insignificant wherever they have not been depicted in chart. Chart scales vary for the purpose of clarity.
12
16 14 16
10 12 12 11 11 12
4 4 3 3
7
1
20
7
2004 2005 2006 2007 2008 2009 2010 2011 2012 2013 1H14
10 10
9
10 10 10 9 8 8 7 8
2 3 3 3 2
5 3 4 5 6
3
8
10
4
9 8
6
8
10
5
6 6
11
2004 2005 2006 2007 2008 2009 2010 2011 2012 2013 1H14
18
9 10
15 12
6
3
12
9 9
2004 2005 2006 2007 2008 2009 2010 2011 2012 2013 1H14
10
7 7
13
9
4
7 5 5
8
53 2 1 1
4 2
6
3 4 5 4
2004 2005 2006 2007 2008 2009 2010 2011 2012 2013 1H14
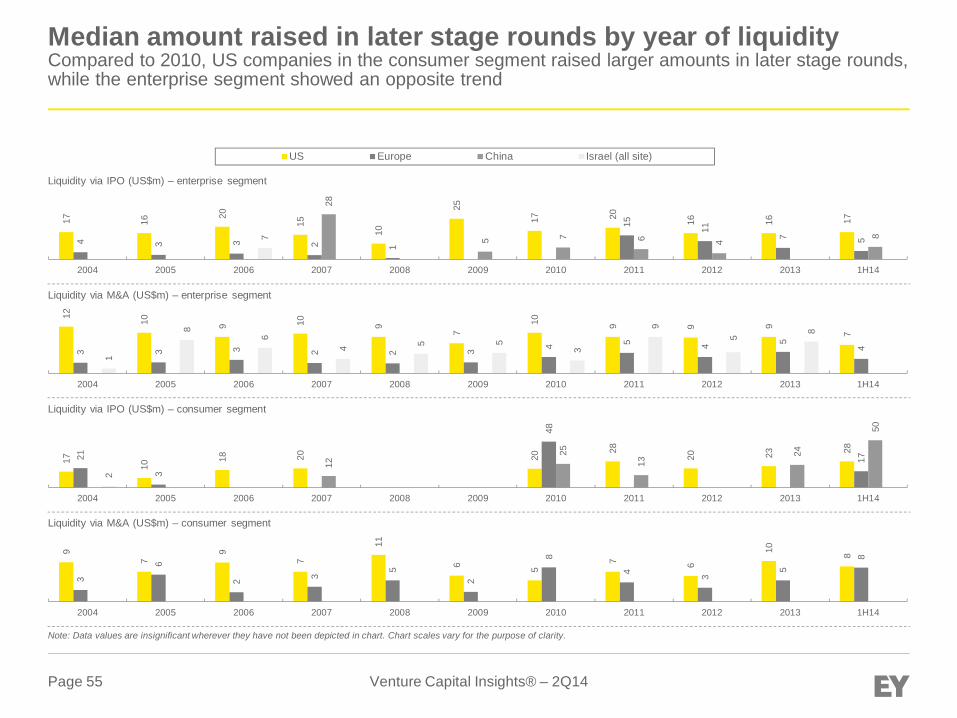
Venture Capital Insights® – 2Q14Page 55
Median amount raised in later stage rounds by year of liquidityCompared to 2010, US companies in the consumer segment raised larger amounts in later stage rounds,while the enterprise segment showed an opposite trend
Liquidity via IPO (US$m) – enterprise segment
US Europe China Israel (all site)
Liquidity via M&A (US$m) – enterprise segment
Liquidity via IPO (US$m) – consumer segment
Liquidity via M&A (US$m) – consumer segment
Note: Data values are insignificant wherever they have not been depicted in chart. Chart scales vary for the purpose of clarity.
17 16
20
15
10
25
17 20 16 16 17
4 3 3 2 1
15 11
7 5
28
5 7 6 4
872004 2005 2006 2007 2008 2009 2010 2011 2012 2013 1H14
12 10 9 10 9
7
10 9 9 9
7
3 3 3 2 2 3 4 5 4 5
4
1
8
6
4 5 5
3
9
5
8
2004 2005 2006 2007 2008 2009 2010 2011 2012 2013 1H14
17
10
18 20 20
28
20 23 28
21
3
48
1712
25
13
24
50
2
2004 2005 2006 2007 2008 2009 2010 2011 2012 2013 1H14
9
7
9
7
11
6 5
7 6
10 8
3
6
2 3
5
2
8
4 3
5
8
2004 2005 2006 2007 2008 2009 2010 2011 2012 2013 1H14

Venture Capital Insights® – 2Q14Page 56
Median pre-money valuation – seed round by year of liquidityAcross markets, only the US recorded median pre-money valuations prior to M&A in the enterprisesegment; in recent years, the valuations had declined to lower than those seen before 2009
Liquidity via IPO (US$m) – enterprise segment
US Europe China Israel (all site)
Liquidity via M&A (US$m) – enterprise segment
Liquidity via IPO (US$m) – consumer segment
Liquidity via M&A (US$m) – consumer segment
Note: Data values are insignificant wherever they have not been depicted in chart. Chart scales vary for the purpose of clarity.
2004 2005 2006 2007 2008 2009 2010 2011 2012 2013 1H14
Insignificant data values for all markets
3 3
5 5 5
2 2 2 2 2
1
2 1
2
1 1
2004 2005 2006 2007 2008 2009 2010 2011 2012 2013 1H14
2004 2005 2006 2007 2008 2009 2010 2011 2012 2013 1H14
2004 2005 2006 2007 2008 2009 2010 2011 2012 2013 1H14
Insignificant data values for all markets
Insignificant data values for all markets

Venture Capital Insights® – 2Q14Page 57
Median pre-money valuation – first round by year of liquiditySince 2011, the median pre-money valuations in the US have declined significantly for the consumersegment, particularly for IPO; however, for the enterprise segment, it remained at similar levels
Liquidity via IPO (US$m) – enterprise segment
US Europe China Israel (all site)
Liquidity via M&A (US$m) – enterprise segment
Liquidity via IPO (US$m) – consumer segment
Liquidity via M&A (US$m) – consumer segment
Note: Data values are insignificant wherever they have not been depicted in chart. Chart scales vary for the purpose of clarity.
11 11 14 8
25
8 8 7 7 7
37
8 9 823
15 10
25
2004 2005 2006 2007 2008 2009 2010 2011 2012 2013 1H14
10 9 8 9 8 8 7 8 7 6 8
4 5 4 4 4 4 4 6
3 4 2
2004 2005 2006 2007 2008 2009 2010 2011 2012 2013 1H14
18 17
13
6 65
24
18
25
13
2004 2005 2006 2007 2008 2009 2010 2011 2012 2013 1H14
14
8 6
17 15
10
7
9 9
4 66
2 5 3
6
3 5 3
6 8
2004 2005 2006 2007 2008 2009 2010 2011 2012 2013 1H14
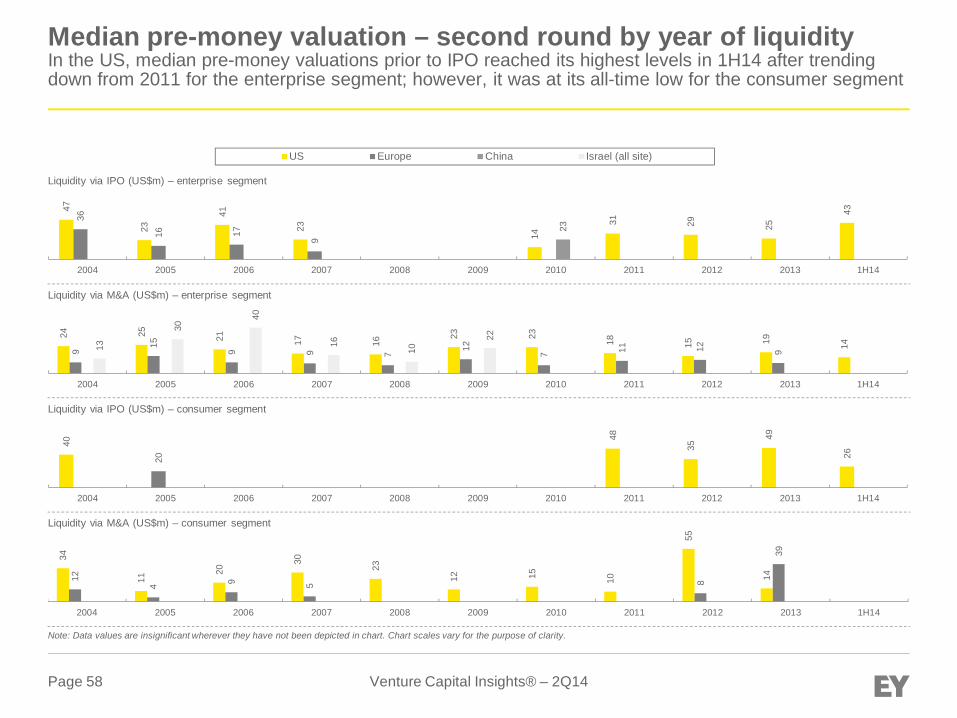
Venture Capital Insights® – 2Q14Page 58
Median pre-money valuation – second round by year of liquidityIn the US, median pre-money valuations prior to IPO reached its highest levels in 1H14 after trendingdown from 2011 for the enterprise segment; however, it was at its all-time low for the consumer segment
Liquidity via IPO (US$m) – enterprise segment
US Europe China Israel (all site)
Liquidity via M&A (US$m) – enterprise segment
Liquidity via IPO (US$m) – consumer segment
Liquidity via M&A (US$m) – consumer segment
Note: Data values are insignificant wherever they have not been depicted in chart. Chart scales vary for the purpose of clarity.
47
23
41
23
14
31 29 25
4336
16 17
9
23
2004 2005 2006 2007 2008 2009 2010 2011 2012 2013 1H14
24 25 21 17 16
23 23 18 15 19 149
15
9 9 7 12 7 11 12 913
30
40
16
10
22
2004 2005 2006 2007 2008 2009 2010 2011 2012 2013 1H14
40
48
35
49
2620
2004 2005 2006 2007 2008 2009 2010 2011 2012 2013 1H14
34
11
20
30
23
12 15 10
55
1412
4 9 5 8
39
2004 2005 2006 2007 2008 2009 2010 2011 2012 2013 1H14

Venture Capital Insights® – 2Q14Page 59
Median pre-money valuation – later round by year of liquidityIn the US and China, 1H14 saw the highest pre-money valuation prior to IPO for the enterprise segmentover the past 10 years
Liquidity via IPO (US$m) – enterprise segment
US Europe China Israel (all site)
Liquidity via M&A (US$m) – enterprise segment
Liquidity via IPO (US$m) – consumer segment
Liquidity via M&A (US$m) – consumer segment
Note: Data values are insignificant wherever they have not been depicted in chart. Chart scales vary for the purpose of clarity.
112
67 87 75 66
125
88 92
158
14 15 31 17
121
12
43 41 33
65772004 2005 2006 2007 2008 2009 2010 2011 2012 2013 1H14
42
50
25
34 29 32
41 41
32
45
2319
9 10 13 7 6 12 17 13 18
10
4
20 20
13
26
19
2004 2005 2006 2007 2008 2009 2010 2011 2012 2013 1H14
134
62 99 89 250
239
155
160
172
123
43 100
3,54
9
2004 2005 2006 2007 2008 2009 2010 2011 2012 2013 1H14
85
20
38
13
67
15 25
49 47
17
38
11 11 22
52004 2005 2006 2007 2008 2009 2010 2011 2012 2013 1H14

Section 3.5: Venture capital investment in enterprise andconsumer segmentsAnalysis by median total equity raised prior to liquidity, pre- and post-valuations, and time to liquidity
Venture Capital Insights® – 2Q14Page 61
Section 3.5: Median total equity raised prior to liquidity, pre-andpost-valuations, and time to liquiditySummary
Median total equity raised prior to liquidity► For total equity raised prior to M&A, median values decreased in the enterprise segment compared to the levels seen 10 years
ago, while they remained at the same level for the consumer segment after 2009, particularly in the US>► The median total equity raised prior to IPO saw a considerable jump after 2010 in the US, suggesting a technology company that
is looking for an IPO exit requires more capital, although marginally, to scale up compared to the earlier years across the twosegments. On the other hand, Chinese market seemed to be relatively cheaper, particularly for the enterprise segment, as themedian equity raised prior to IPO recorded a considerable decline recently, compared to 2005-07 period.
Median valuations► Over the last 10 years, median pre-money valuation for companies exiting via IPO almost doubled in the US and China in
the enterprise segment, while in Europe, the median valuations declined in 1H14 to US$30m to reach the levels recordedduring 2004-07.
► For the consumer segment, median pre-money valuations declined in 1H14, in the US and China compared to 2013, while,Europe recorded an all-time- high median valuation during the first half of 2014: US$1,905m.
► Median post-valuations for the companies exiting via M&A in the enterprise segment increased across markets, exceptfor Canada.
Median time to liquidity► Over the last ten years, it has taken longer for VC investors to exit via IPO in the enterprise segment in the US and Europe, and
it took almost the same amount of time in China. However, the time to liquidity changed albeit marginally for investors that choseto exit via M&A across the same three markets in this segment.
► In other smaller markets like Israel, the median time taken to liquidity via M&A in the enterprise segment peaked in 2010 at 10years, then consistently declined to reach its new level of 5 years in 1H14.
► For the consumer segment, it continued to take close to six years for VC investors to exit via IP;, however, in China, the timetaken increased, although marginally, over the last seven years: three years in 2007 to five years in 1H14. For M&A exits in thissegment, the time to liquidity remained the same across geographies, except in the US, which saw a decline to exit from fiveyears in 2004 to three years in 1H14.
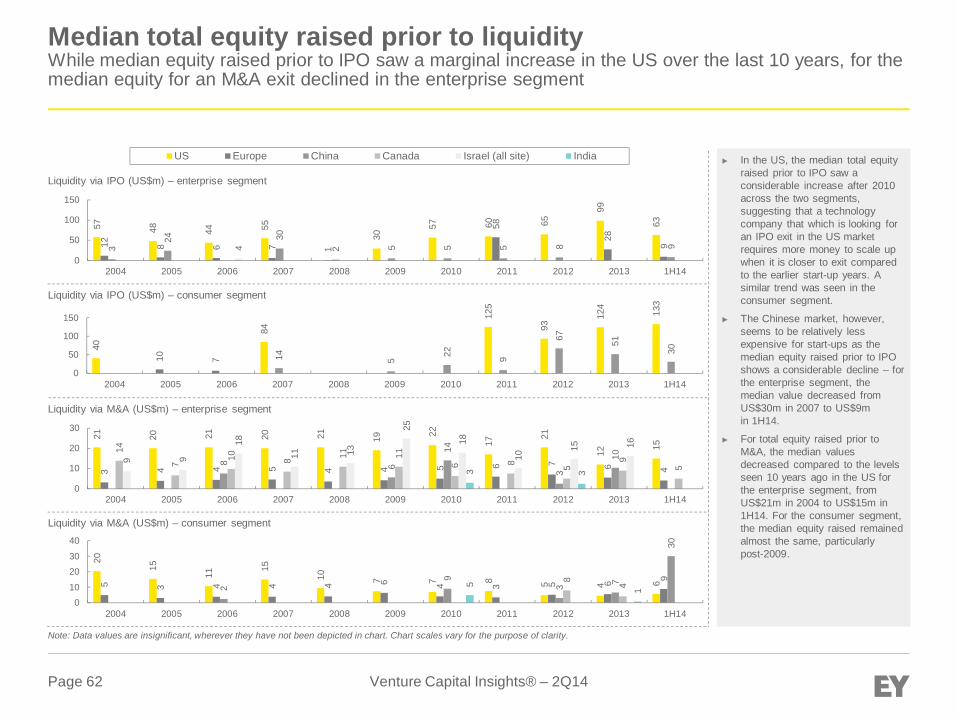
Venture Capital Insights® – 2Q14Page 62
Median total equity raised prior to liquidityWhile median equity raised prior to IPO saw a marginal increase in the US over the last 10 years, for themedian equity for an M&A exit declined in the enterprise segment
Liquidity via IPO (US$m) – enterprise segment
Liquidity via IPO (US$m) – consumer segment
US Europe China Canada Israel (all site) India
Liquidity via M&A (US$m) – enterprise segment
Liquidity via M&A (US$m) – consumer segment
► In the US, the median total equityraised prior to IPO saw aconsiderable increase after 2010across the two segments,suggesting that a technologycompany that which is looking foran IPO exit in the US marketrequires more money to scale upwhen it is closer to exit comparedto the earlier start-up years. Asimilar trend was seen in theconsumer segment.
► The Chinese market, however,seems to be relatively lessexpensive for start-ups as themedian equity raised prior to IPOshows a considerable decline – forthe enterprise segment, themedian value decreased fromUS$30m in 2007 to US$9min 1H14.
► For total equity raised prior toM&A, the median valuesdecreased compared to the levelsseen 10 years ago in the US forthe enterprise segment, fromUS$21m in 2004 to US$15m in1H14. For the consumer segment,the median equity raised remainedalmost the same, particularlypost-2009.
Note: Data values are insignificant, wherever they have not been depicted in chart. Chart scales vary for the purpose of clarity.
57 48 44 55
30
57 60 65
99
63
12 8 6 7 1
58
28
93
24 30
2 5 5 5 8 94
0
50
100
150
2004 2005 2006 2007 2008 2009 2010 2011 2012 2013 1H14
40
84
125
93
124
133
10 7 14 5
22 9
67 51
30
0
50
100
150
2004 2005 2006 2007 2008 2009 2010 2011 2012 2013 1H14
21 20 21 20 21 19 22
17
21
12 15
3 4 4 5 4 4 5 6 7 6 4
8 6
14
3
10
14
7
10 8 11 11
6 8 5
9
5
9 9
18
11 13
25
18
10
15 16
3 3
0
10
20
30
2004 2005 2006 2007 2008 2009 2010 2011 2012 2013 1H14
20
15
11
15
10 7 7 8 5 4 65 3 4 4 4 6 4 3 5 6 9
2
9
3 7
30
8 45
1
010
2030
40
2004 2005 2006 2007 2008 2009 2010 2011 2012 2013 1H14
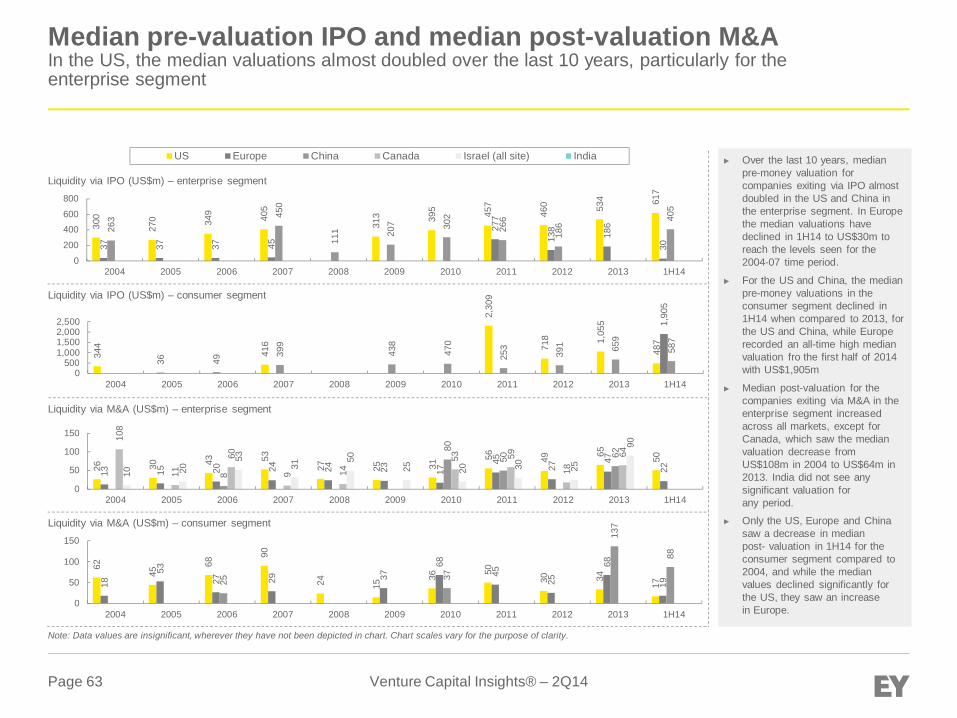
Venture Capital Insights® – 2Q14Page 63
Median pre-valuation IPO and median post-valuation M&AIn the US, the median valuations almost doubled over the last 10 years, particularly for theenterprise segment
Liquidity via IPO (US$m) – enterprise segment
Liquidity via IPO (US$m) – consumer segment
US Europe China Canada Israel (all site) India
Liquidity via M&A (US$m) – enterprise segment
Liquidity via M&A (US$m) – consumer segment
► Over the last 10 years, medianpre-money valuation forcompanies exiting via IPO almostdoubled in the US and China inthe enterprise segment. In Europethe median valuations havedeclined in 1H14 to US$30m toreach the levels seen for the2004-07 time period.
► For the US and China, the medianpre-money valuations in theconsumer segment declined in1H14 when compared to 2013, forthe US and China, while Europerecorded an all-time high medianvaluation fro the first half of 2014with US$1,905m
► Median post-valuation for thecompanies exiting via M&A in theenterprise segment increasedacross all markets, except forCanada, which saw the medianvaluation decrease fromUS$108m in 2004 to US$64m in2013. India did not see anysignificant valuation forany period.
► Only the US, Europe and Chinasaw a decrease in medianpost- valuation in 1H14 for theconsumer segment compared to2004, and while the medianvalues declined significantly forthe US, they saw an increasein Europe.
Note: Data values are insignificant, wherever they have not been depicted in chart. Chart scales vary for the purpose of clarity.
300
270 34
9 405
313 39
5 457
460 53
4 617
37 37 37 45
277
138
186
30
263 45
0
111 20
7 302
266
186
405
0
200
400600
800
2004 2005 2006 2007 2008 2009 2010 2011 2012 2013 1H14
62
45
68
90
24 15
36 50
30 34
1718
53
27 29 37
68
45
25
68
1925 37
137
88
0
50
100
150
2004 2005 2006 2007 2008 2009 2010 2011 2012 2013 1H14
344
416
2,30
9
718 1,05
5
487
36 49
1,90
5
399
438
470
253
391 65
9
587
0500
1,0001,5002,0002,500
2004 2005 2006 2007 2008 2009 2010 2011 2012 2013 1H14
26 30 43 53
27 25 31
56 49 65 50
13 15 20 24 24 23 17
45
27
47
228
80
50 62
108
11
60
9 14
53 59
18
64
10 20
53
31
50
25 20 30 25
90
0
50
100
150
2004 2005 2006 2007 2008 2009 2010 2011 2012 2013 1H14

Venture Capital Insights® – 2Q14Page 64
Median time to liquidityOver the last 10 years, it took longer to exit via IPO in the enterprise segment in the US and Europe; forthe consumer segment it took the same amount of time to exit either via M&A or IPO
Time to liquidity via IPO (in years) – enterprise segment
Time to liquidity via IPO (in years) – consumer segment
US Europe China Canada Israel (all site) India
Time to liquidity via M&A (in years) – enterprise segment
Time to liquidity via M&A (in years) – consumer segment
► Over the past 10 years, itcontinues to take longer in the USand Europe for companies to exitvia IPO in the enterprise segment,while in China it took less thanthree years for a company to exit.The time taken for companies thatexited via M&A changed slightlyacross the three key markets inthis segment.
► In other smaller markets likeIsrael, the median time taken toexit via M&A in the enterprisesegment peaked in 2010 at 10years and is now showing aconsistent decline to reaching itsnew historical level of five yearsin 1H14.
► For the consumer segment, itcontinues to take almost six yearsfor companies to exit via IPO. InChina, the time it takes to an IPOexit has increased over the pastseven years going from threeyears in 2007 to five yearsin 1H14.
► Companies that exited via M&A inthe consumer segment took thesame amount of time acrossgeographies since 2004, exceptfor the US, which saw a declinefrom five years in 2004 to threeyears in 1H14.
Note: Data values are insignificant, wherever they have not been depicted in chart. Chart scales vary for the purpose of clarity.
5 6 7 7
5
10 9 9
7 7
4 5 6 7
3
8 7
9
7
3
1 2
7
2 3 3 2 3
6
0
5
10
15
2004 2005 2006 2007 2008 2009 2010 2011 2012 2013 1H14
6 6 6
7 7
6
5
6
23 2 3 4 3
5 5
02468
2004 2005 2006 2007 2008 2009 2010 2011 2012 2013 1H14
4 5 6 7 7 6 6 6 6 6 6
4 5 6 7 7 6
8 7 7 7 65
3 4 4
6
4
6
2
4 4 4 5 5 6 6
4
7
3 54 5
7 7
5
9 10
7 8
66
3
5 5
3
0
5
10
15
2004 2005 2006 2007 2008 2009 2010 2011 2012 2013 1H14
5
6
7 6
3 3 3 4
3 3
3
4 5
6 6
3
5
3
4 5 4 44
2
4 4 3 3 3
4 4
2
4 3 3
1
02
46
8
2004 2005 2006 2007 2008 2009 2010 2011 2012 2013 1H14
Section 4: Current ownership status of venture-funded companiesAnalysis by geography
Venture Capital Insights® – 2Q14Page 66
Section 4: Current ownership status of venture-funded companiesSummary
► In the enterprise segment, investors can expect to generate relatively early returns in the US andIsrael compared to other geographies.► The proportion of companies that are still private and independent among all the companies that raised VC funding
10 years ago, is the smallest the US (35%) and Israel (25%0..
► This signifies frequent activity and rapid success or failure outcomes for companies in developed VC markets.
► In the US, Israel and Canada, over 50% of the enterprise segment companies funded in 2004 have opted forsuccessful portfolio exits, while this proportion is less than 50% in Europe, China and India
► Among the two segments of technology companies, the enterprise segment has seen a lower failurerate almost across all markets.► In the US, up to 22% of companies that received initial VC funding in 2004 went out of business in the consumer
segment, while in the enterprise segment, only 16% have gone out of business.
► In line with usual exit patterns, a higher proportion of total companies in developed markets, such asthe US, Europe and Canada, have been acquired/merged, while in China, the proportion of publiclylisted companies is higher.► China is the only country where few of the companies receiving their initial financing as late as 2012 and 2013
have also gone public.
► Business sustainability in China and India is significantly higher than the global average.
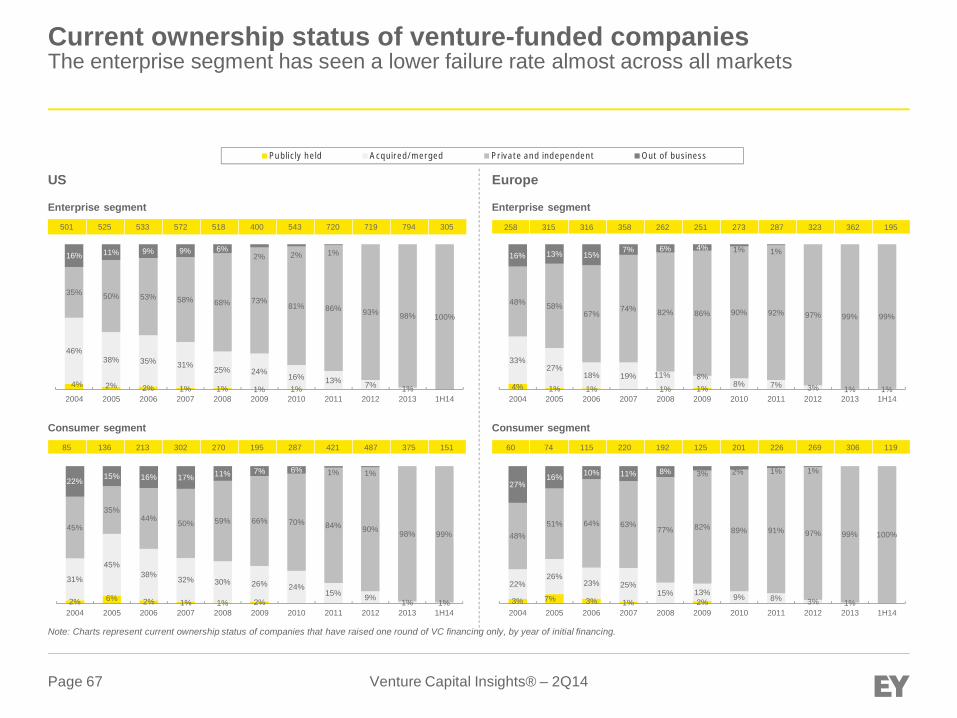
Venture Capital Insights® – 2Q14Page 67
US
Enterprise segment
4% 2% 2% 1% 1% 1% 1%
46%38% 35% 31% 25% 24%
16% 13% 7% 1%
35% 50% 53% 58% 68% 73%81% 86% 93% 98% 100%
16% 11% 9% 9% 6%2% 2% 1%
2004 2005 2006 2007 2008 2009 2010 2011 2012 2013 1H14
501 525 533 572 518 400 543 720 719 794 305
Consumer segment
Enterprise segment
258 315 316 358 262 251 273 287 323 362 195
Consumer segment
60 74 115 220 192 125 201 226 269 306 119
Europe
4% 1% 1% 1% 1%
33%27%
18% 19% 11% 8%8% 7% 3% 1% 1%
48% 58%67%
74% 82% 86% 90% 92% 97% 99% 99%
16% 13% 15%7% 6% 4% 1% 1%
2004 2005 2006 2007 2008 2009 2010 2011 2012 2013 1H14
3% 7% 3% 1% 2%
22%26%
23% 25%15% 13% 9% 8% 3% 1%
48%51% 64% 63%
77% 82% 89% 91% 97% 99% 100%
27%16% 10% 11% 8% 3% 2% 1% 1%
2004 2005 2006 2007 2008 2009 2010 2011 2012 2013 1H14
85 136 213 302 270 195 287 421 487 375 151
2% 6% 2% 1% 1% 2%
31%
45%38% 32% 30% 26% 24%
15% 9% 1% 1%
45%
35%44% 50% 59% 66% 70% 84% 90% 98% 99%
22% 15% 16% 17% 11% 7% 6% 1% 1%
2004 2005 2006 2007 2008 2009 2010 2011 2012 2013 1H14
Publicly held Acquired/merged Private and independent Out of business
Current ownership status of venture-funded companiesThe enterprise segment has seen a lower failure rate almost across all markets
Note: Charts represent current ownership status of companies that have raised one round of VC financing only, by year of initial financing.
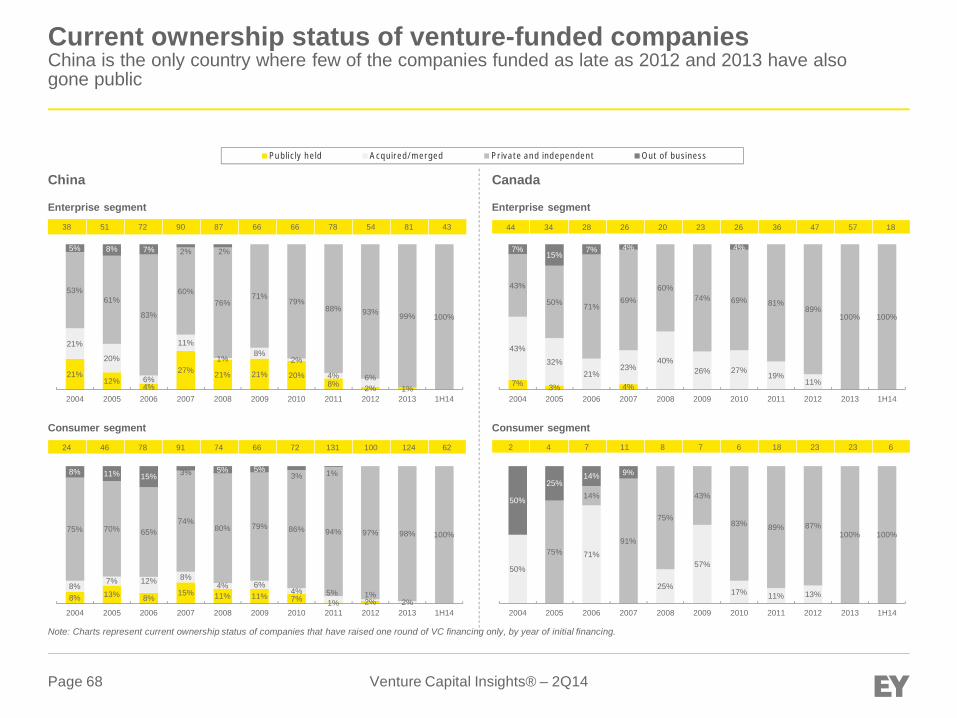
Venture Capital Insights® – 2Q14Page 68
China
Enterprise segment
Consumer segment
Enterprise segment
Consumer segment
Canada
Publicly held Acquired/merged Private and independent Out of business
Note: Charts represent current ownership status of companies that have raised one round of VC financing only, by year of initial financing.
Current ownership status of venture-funded companiesChina is the only country where few of the companies funded as late as 2012 and 2013 have alsogone public
21%12%
4%
27% 21% 21% 20%8% 2% 1%
21%
20%
6%
11%
1%8%
2%
4% 6%
53%61%
83%
60%76%
71%79%
88% 93% 99% 100%
5% 8% 7% 2% 2%
2004 2005 2006 2007 2008 2009 2010 2011 2012 2013 1H14
8% 13% 8%15% 11% 11% 7% 1% 2%
8%7% 12% 8%
4% 6%4% 5% 1%
2%
75% 70% 65%74%
80% 79% 86% 94% 97% 98% 100%
8% 11% 15% 3% 5% 5%3% 1%
2004 2005 2006 2007 2008 2009 2010 2011 2012 2013 1H14
7% 3% 4%
43%
32%21%
23%40%
26% 27%19%
11%
43%
50% 71%69%
60%74% 69% 81%
89%100% 100%
7%15%
7% 4% 4%
2004 2005 2006 2007 2008 2009 2010 2011 2012 2013 1H14
50%
71%
25%
57%
17% 11% 13%
75%
14%
91%
75%
43%
83% 89% 87%100% 100%
50%
25%14% 9%
2004 2005 2006 2007 2008 2009 2010 2011 2012 2013 1H14
38 51 72 90 87 66 66 78 54 81 43 44 34 28 26 20 23 26 36 47 57 18
2 4 7 11 8 7 6 18 23 23 624 46 78 91 74 66 72 131 100 124 62

Venture Capital Insights® – 2Q14Page 69
Current ownership status of venture-funded companiesThe proportion of enterprise segment companies that are still private and independent among all thecompanies funded 10 years ago is the least in Israel (25%), followed by the US (35%)
Israel
Enterprise segment
28 24 31 41 33 25 14 18 21 43 13
Consumer segment
Enterprise segment
4 10 24 36 37 31 32 45 49 47 13
Consumer segment
NA 7 21 19 28 14 21 35 74 51 24
India
NA 2 7 13 6 5 5 9 13 12 16
Publicly held Acquired/merged Private and independent Out of business
Note: Charts represent current ownership status of companies that have raised one round of VC financing only, by year of initial financing.
17%
40%17%
14% 19%6% 2% 2% 4%
100%
60%63%
83%81%
94% 100% 98% 98% 96% 100%
4% 3%
2004 2005 2006 2007 2008 2009 2010 2011 2012 2013 1H14
29%
5% 5% 7% 7%
14%
24% 26%14% 7% 19%
3% 1% 2%
57%71% 68%
71% 86% 76%94% 99% 98% 100%
7% 5% 3%
2004 2005 2006 2007 2008 2009 2010 2011 2012 2013 1H14
NA
3% 2%
61%
21%
35%5% 18% 12% 14%
5% 5%
25%
54%
45%
76%
76%80% 79% 100% 95% 95% 100%
14%25%
16% 17%6% 8% 7%
2004 2005 2006 2007 2008 2009 2010 2011 2012 2013 1H14
29% 31%20%
8% 8%
100%57%
62%
83%
80%
80%
100% 92% 92%100%
14% 8%17% 20%
2004 2005 2006 2007 2008 2009 2010 2011 2012 2013 1H14
NA
Appendix
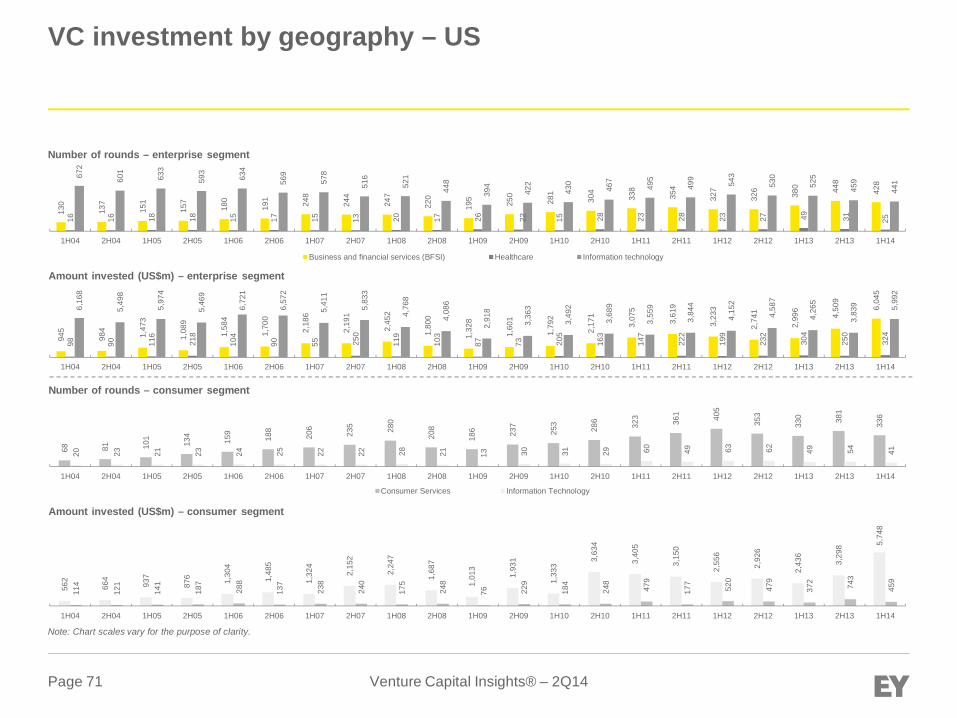
Venture Capital Insights® – 2Q14Page 71
130
137
151
157
180
191 248
244
247
220
195 250
281
304
338
354
327
326
380 44
8
428
16 16 18 18 15 17 15 13 20 17 26 22 15 28 23 28 23 27 49 31 25
672
601
633
593
634
569
578
516
521
448
394
422
430
467
495
499
543
530
525
459
441
1H04 2H04 1H05 2H05 1H06 2H06 1H07 2H07 1H08 2H08 1H09 2H09 1H10 2H10 1H11 2H11 1H12 2H12 1H13 2H13 1H14
Business and financial services (BFSI) Healthcare Information technology
Number of rounds – enterprise segment
945
984
1,47
3
1,08
9
1,58
4
1,70
0
2,18
6
2,19
1
2,45
2
1,80
0
1,32
8
1,60
1
1,79
2
2,17
1
3,07
5
3,61
9
3,23
3
2,74
1
2,99
6
4,50
9
6,04
5
98 90 116
218
104
90 55 250
119
103
87 73 205
163
147
222
199
232
304
250
324
6,16
8
5,49
8
5,97
4
5,46
9
6,72
1
6,57
2
5,41
1
5,83
3
4,76
8
4,08
6
2,91
8
3,36
3
3,49
2
3,68
9
3,55
9
3,84
4
4,15
2
4,58
7
4,26
5
3,83
9 5,99
2
1H04 2H04 1H05 2H05 1H06 2H06 1H07 2H07 1H08 2H08 1H09 2H09 1H10 2H10 1H11 2H11 1H12 2H12 1H13 2H13 1H14
Amount invested (US$m) – enterprise segment
Number of rounds – consumer segment
68 81 101
134
159
188
206
235 280
208
186 23
7
253
286
323
361 405
353
330 38
1
336
20 23 21 23 24 25 22 22 28 21 13 30 31 29 60 49 63 62 49 54 41
1H04 2H04 1H05 2H05 1H06 2H06 1H07 2H07 1H08 2H08 1H09 2H09 1H10 2H10 1H11 2H11 1H12 2H12 1H13 2H13 1H14
Consumer Services Information Technology
Amount invested (US$m) – consumer segment
562
664
937
876 1,30
4
1,48
5
1,32
4
2,15
2
2,24
7
1,68
7
1,01
3
1,93
1
1,33
3
3,63
4
3,40
5
3,15
0
2,55
6
2,92
6
2,43
6
3,29
8 5,74
8
114
121
141
187
288
137
238
240
175
248
76 229
184
248
479
177
520
479
372
743
459
1H04 2H04 1H05 2H05 1H06 2H06 1H07 2H07 1H08 2H08 1H09 2H09 1H10 2H10 1H11 2H11 1H12 2H12 1H13 2H13 1H14
VC investment by geography – US
Note: Chart scales vary for the purpose of clarity.
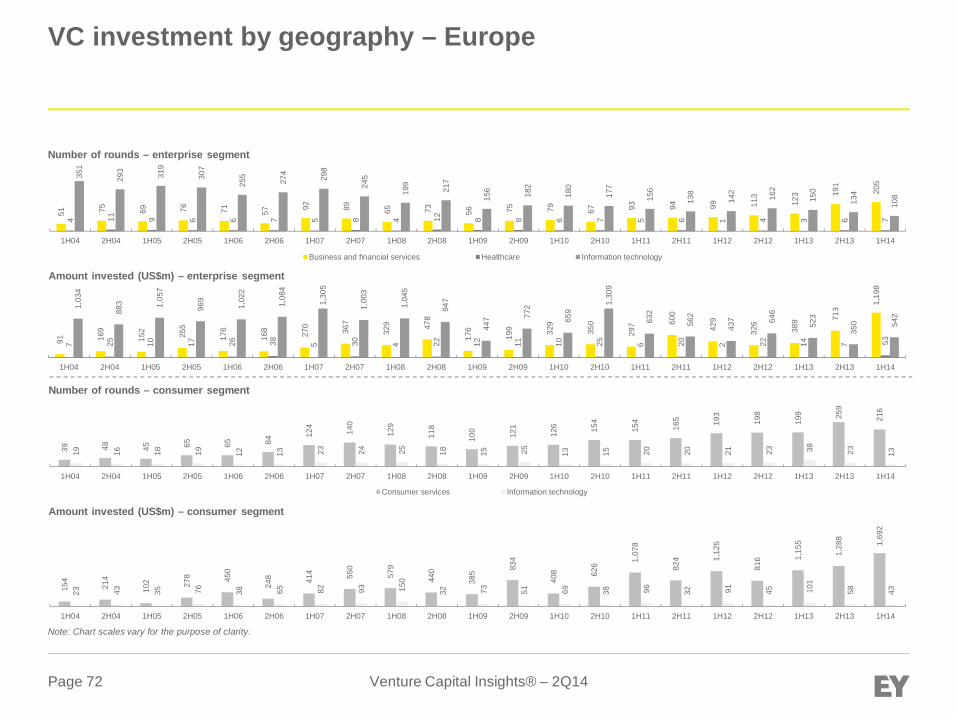
Venture Capital Insights® – 2Q14Page 72
VC investment by geography – Europe
Number of rounds – enterprise segment
Amount invested (US$m) – enterprise segment
Number of rounds – consumer segment
Amount invested (US$m) – consumer segment
Note: Chart scales vary for the purpose of clarity.
51 75 69 76 71 57 92 89 65 73 56 75 79 67 93 94 99 113
123 19
1
205
4 11 9 6 6 7 5 8 4 12 8 8 6 7 5 6 1 4 3 6 7
351
293
319
307
255
274
298
245
199
217
156 182
180
177
156
138
142
162
150
134
108
1H04 2H04 1H05 2H05 1H06 2H06 1H07 2H07 1H08 2H08 1H09 2H09 1H10 2H10 1H11 2H11 1H12 2H12 1H13 2H13 1H14
Business and financial services Healthcare Information technology
91 169
152 255
176
168 270
367
329 47
8
176
199 32
9
350
297 60
0
429
326
389 71
3
1,19
8
7 25 10 17 26 38 5 30 4 22 12 11 10 25 6 20 2 22 14 7 53
1,03
4
883 1,05
7
969
1,02
2
1,08
4
1,30
5
1,00
3
1,04
5
947
447 77
2
659
1,30
9
632
562
437 64
6
523
350 54
2
1H04 2H04 1H05 2H05 1H06 2H06 1H07 2H07 1H08 2H08 1H09 2H09 1H10 2H10 1H11 2H11 1H12 2H12 1H13 2H13 1H14
39 48 45 65 65 84
124
140
129
118
100
121
126 15
4
154
165 19
3
198
199 25
9
216
19 16 18 19 12 13 23 24 25 18 15 25 13 15 20 20 21 23 38 23 13
1H04 2H04 1H05 2H05 1H06 2H06 1H07 2H07 1H08 2H08 1H09 2H09 1H10 2H10 1H11 2H11 1H12 2H12 1H13 2H13 1H14
Consumer services Information technology
154
214
102 27
8 450
248 41
4 550
579
440
385 83
4
408 62
6 1,07
8
824 1,
125
816 1,
155
1,28
8
1,69
2
23 43 35 76 38 65 82 93 150
32 73 51 69 38 96 32 91 45 101
58 43
1H04 2H04 1H05 2H05 1H06 2H06 1H07 2H07 1H08 2H08 1H09 2H09 1H10 2H10 1H11 2H11 1H12 2H12 1H13 2H13 1H14
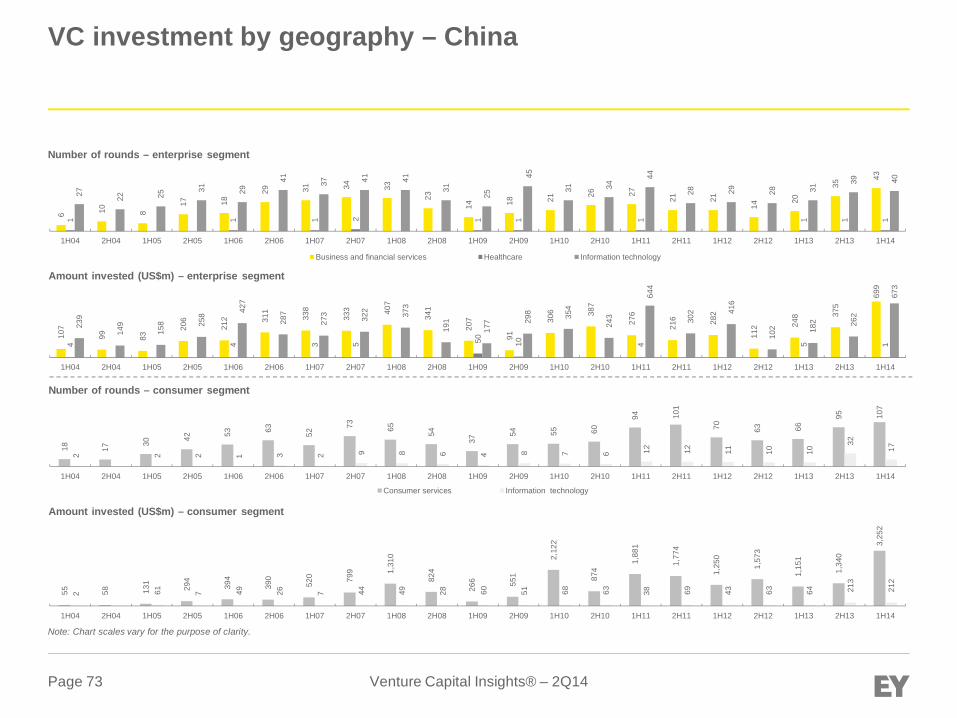
Venture Capital Insights® – 2Q14Page 73
VC investment by geography – China
Number of rounds – enterprise segment
Amount invested (US$m) – enterprise segment
Number of rounds – consumer segment
Amount invested (US$m) – consumer segment
Note: Chart scales vary for the purpose of clarity.
6 10 8
17 18
29 31 34 33
23
14 18 21 26 27
21 21
14
20
35
43
1 1 1 2 1 1 1 1 1 1
27 22 25
31 29
41 37 41 41
31
25
45
31 34
44
28 29 28 31
39 40
1H04 2H04 1H05 2H05 1H06 2H06 1H07 2H07 1H08 2H08 1H09 2H09 1H10 2H10 1H11 2H11 1H12 2H12 1H13 2H13 1H14
Business and financial services Healthcare Information technology
107
99 83
206
212 31
1
338
333 40
7
341
207
91
306 38
7
276
216 28
2
112 24
8 375
699
4 4 3 5 50 10 4 5 1
239
149
158 25
8 427
287
273 322 373
191
177 29
8 354
243
644
302 41
6
102 18
2 262
673
1H04 2H04 1H05 2H05 1H06 2H06 1H07 2H07 1H08 2H08 1H09 2H09 1H10 2H10 1H11 2H11 1H12 2H12 1H13 2H13 1H14
18 17
30 42 53 63 52
73 65 54
37
54 55 60
94 101
70 63 66
95 107
2 2 2 1 3 2 9 8 6 4 8 7 6 12 12 11 10 10
32
17
1H04 2H04 1H05 2H05 1H06 2H06 1H07 2H07 1H08 2H08 1H09 2H09 1H10 2H10 1H11 2H11 1H12 2H12 1H13 2H13 1H14
Consumer services Information technology
55 58 131
294
394
390
520 79
9 1,31
0
824
266 55
1
2,12
2
874
1,88
1
1,77
4
1,25
0
1,57
3
1,15
1
1,34
0
3,25
2
2 61 7 49 26 7 44 49 28 60 51 68 63 38 69 43 63 64 213
212
1H04 2H04 1H05 2H05 1H06 2H06 1H07 2H07 1H08 2H08 1H09 2H09 1H10 2H10 1H11 2H11 1H12 2H12 1H13 2H13 1H14
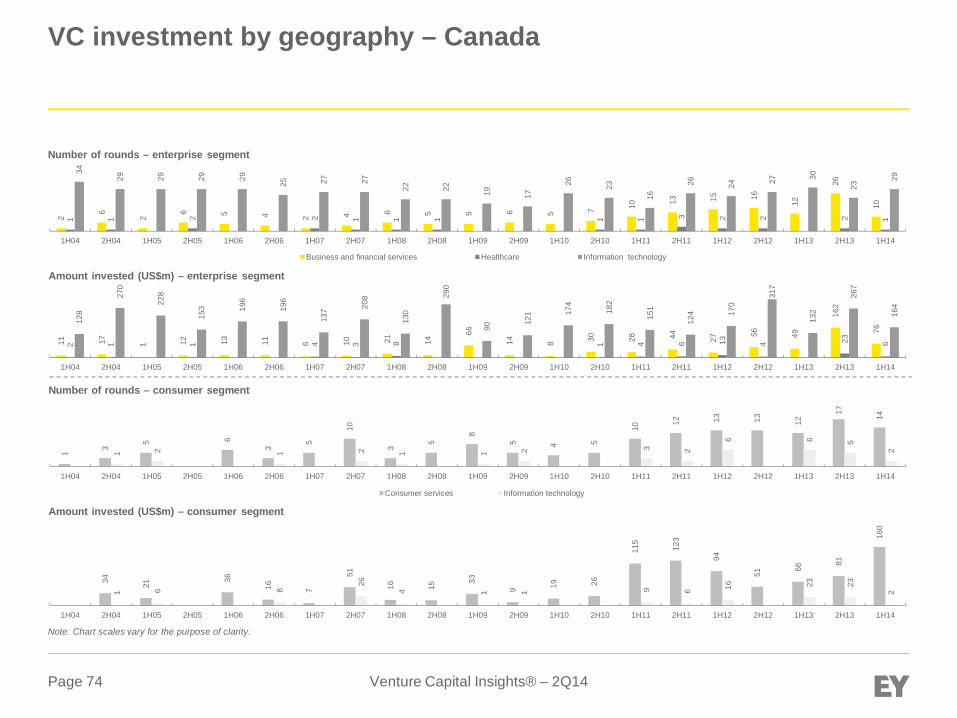
Venture Capital Insights® – 2Q14Page 74
VC investment by geography – Canada
Number of rounds – enterprise segment
Amount invested (US$m) – enterprise segment
Number of rounds – consumer segment
Amount invested (US$m) – consumer segment
Note: Chart scales vary for the purpose of clarity.
2
6
2
6 5 4 2 4 6 5 5 6 5 7 10 13 15 16
12
26
10
1 1 2 2 1 1 1 1 1 3 2 2 2 1
34
29 29 29 29
25 27 27
22 22 19 17
26 23
16
26 24 27 30
23
29
1H04 2H04 1H05 2H05 1H06 2H06 1H07 2H07 1H08 2H08 1H09 2H09 1H10 2H10 1H11 2H11 1H12 2H12 1H13 2H13 1H14
Business and financial services Healthcare Information technology
11 17 1 12 13 11 6 10 21 14
66
14 8 30 28 44 27
56 49
162
76
2 1 1 4 3 8 1 4 6 13 4 23 6
128
270
228
153 19
6
196
137 20
8
130
290
90
121 17
4
182
151
124 17
0
317
132
267
164
1H04 2H04 1H05 2H05 1H06 2H06 1H07 2H07 1H08 2H08 1H09 2H09 1H10 2H10 1H11 2H11 1H12 2H12 1H13 2H13 1H14
1
3
5 6
3
5
10
3
5
8
5 4 5
10
12 13 13 12
17
14
1 2 1 2 1 1 2 3 2
6 6 5
2
1H04 2H04 1H05 2H05 1H06 2H06 1H07 2H07 1H08 2H08 1H09 2H09 1H10 2H10 1H11 2H11 1H12 2H12 1H13 2H13 1H14
Consumer services Information technology
34 21
36
16 7
51
16 15
33
9 19 26
115
123
94
51
66
81
160
1 6 8
26
4 1 1 9 6 16 23 23
2
1H04 2H04 1H05 2H05 1H06 2H06 1H07 2H07 1H08 2H08 1H09 2H09 1H10 2H10 1H11 2H11 1H12 2H12 1H13 2H13 1H14
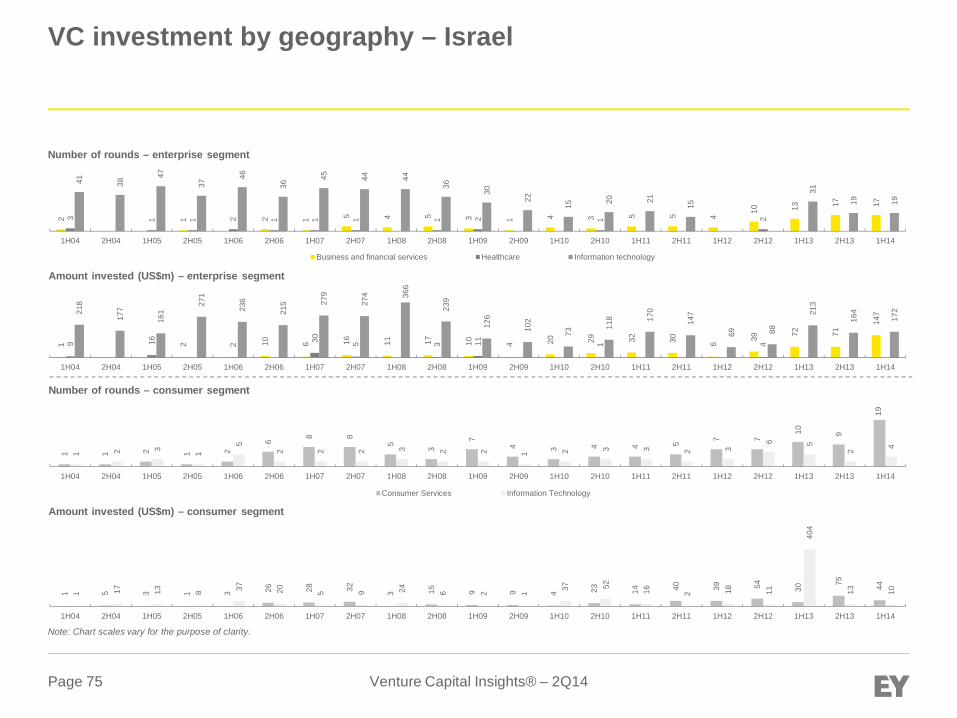
Venture Capital Insights® – 2Q14Page 75
VC investment by geography – Israel
Number of rounds – enterprise segment
Amount invested (US$m) – enterprise segment
Number of rounds – consumer segment
Amount invested (US$m) – consumer segment
Note: Chart scales vary for the purpose of clarity.
2 1 2 1 5 4 5 3 1 4 3 5 5 4
10 13 17 17
3 1 1 2 1 1 1 1 2 1 2
41 38
47
37
46
36
45 44 44
36
30
22
15 20 21
15
31
19 19
1H04 2H04 1H05 2H05 1H06 2H06 1H07 2H07 1H08 2H08 1H09 2H09 1H10 2H10 1H11 2H11 1H12 2H12 1H13 2H13 1H14
Business and financial services Healthcare Information technology
1 2 10 6 16 11 17 10 4 20 29 32 30 6 39 72 71
147
9 16 2 30 5 3 11 1 4
218
177
161
271
236
215 27
9
274 36
6
239
126
102
73
118 17
0
147
69 88
213
164
172
1H04 2H04 1H05 2H05 1H06 2H06 1H07 2H07 1H08 2H08 1H09 2H09 1H10 2H10 1H11 2H11 1H12 2H12 1H13 2H13 1H14
1 1 2 1 2
6 8 8
5 3
7
4 3 4 4 5 7 7
10 9
19
1 2 3 1
5
2 2 2 3 2 2 1 2 3 3 2 3
6 5
2 4
1H04 2H04 1H05 2H05 1H06 2H06 1H07 2H07 1H08 2H08 1H09 2H09 1H10 2H10 1H11 2H11 1H12 2H12 1H13 2H13 1H14
Consumer Services Information Technology
1 5 3 1 3 26 28 32 3 15 9 9 4 23 14 40 39 54 30
75 44
1 17 13 8 37 20 5 9 24 6 2 1 37 52 16 2 18 11
404
13 10
1H04 2H04 1H05 2H05 1H06 2H06 1H07 2H07 1H08 2H08 1H09 2H09 1H10 2H10 1H11 2H11 1H12 2H12 1H13 2H13 1H14
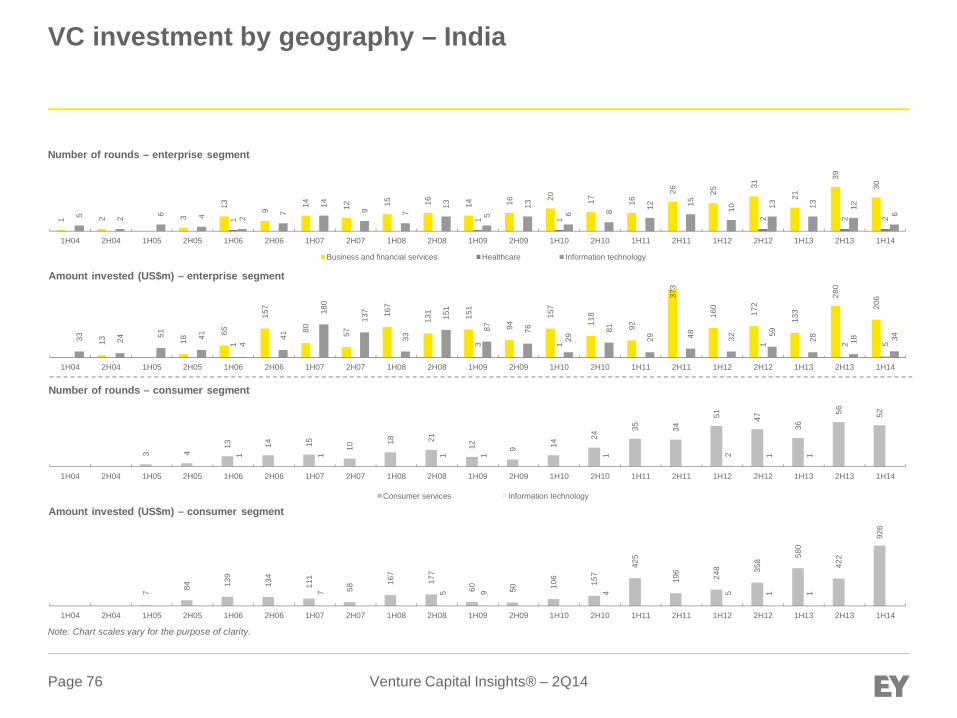
Venture Capital Insights® – 2Q14Page 76
VC investment by geography – India
Number of rounds – enterprise segment
Amount invested (US$m) – enterprise segment
Number of rounds – consumer segment
Amount invested (US$m) – consumer segment
Note: Chart scales vary for the purpose of clarity.
1 2 3
13 9
14 12 15 16 14 16 20 17 16
26 25
31
21
39
30
1 1 1 2 2 25 2 6 4 2
7
14
9 7
13
5
13
6 8 12 15
10 13 13 12
6
1H04 2H04 1H05 2H05 1H06 2H06 1H07 2H07 1H08 2H08 1H09 2H09 1H10 2H10 1H11 2H11 1H12 2H12 1H13 2H13 1H14
Business and financial services Healthcare Information technology
13 18
65
157
80 57
167
131 151
94
157
118
92
373
160
172
133
280
206
1 3 1 1 2 533 24 51 41
4
41
180
137
33
151
87 76
29
81
29 48 32 59
28 18 34
1H04 2H04 1H05 2H05 1H06 2H06 1H07 2H07 1H08 2H08 1H09 2H09 1H10 2H10 1H11 2H11 1H12 2H12 1H13 2H13 1H14
3 4
13 14 15 10
18 21
12 9 14
24
35 34
51 47
36
56 52
1 1 1 1 1 2 1 1
1H04 2H04 1H05 2H05 1H06 2H06 1H07 2H07 1H08 2H08 1H09 2H09 1H10 2H10 1H11 2H11 1H12 2H12 1H13 2H13 1H14
Consumer services Information technology
7 84 139
134
111
58
167
177
60 50 106
157
425
196
248 35
8
580
422
926
7 5 9 4 5 1 1
1H04 2H04 1H05 2H05 1H06 2H06 1H07 2H07 1H08 2H08 1H09 2H09 1H10 2H10 1H11 2H11 1H12 2H12 1H13 2H13 1H14
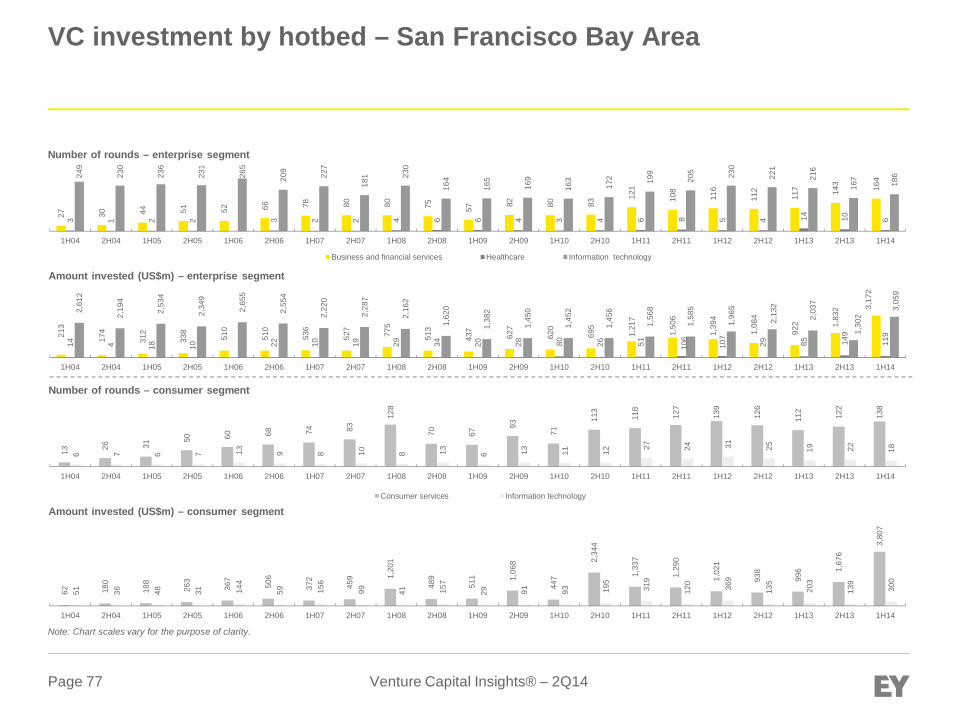
Venture Capital Insights® – 2Q14Page 77
VC investment by hotbed – San Francisco Bay Area
Number of rounds – enterprise segment
Amount invested (US$m) – enterprise segment
Number of rounds – consumer segment
Amount invested (US$m) – consumer segment
Note: Chart scales vary for the purpose of clarity.
27 30 44 51 52 66 78 80 80 75 57 82 80 83
121
108
116
112
117 14
3 164
3 1 2 2 3 2 2 4 6 6 4 3 4 6 8 5 4 14 10 6
249
230
236
231
265
209
227
181 23
0
164
165
169
163
172 19
9
205 23
0
221
216
167
186
1H04 2H04 1H05 2H05 1H06 2H06 1H07 2H07 1H08 2H08 1H09 2H09 1H10 2H10 1H11 2H11 1H12 2H12 1H13 2H13 1H14
Business and financial services Healthcare Information technology
213
174
312
338
510
510
536
527
775
513
437
627
620
695
1,21
7
1,50
6
1,39
4
1,08
4
922 1,
832 3,
172
14 4 18 10 22 10 19 29 34 20 28 80 26 51 106
107
29 85 149
119
2,61
2
2,19
4
2,53
4
2,34
9
2,65
5
2,55
4
2,22
0
2,28
7
2,16
2
1,62
0
1,38
2
1,45
0
1,45
2
1,45
6
1,56
8
1,58
5
1,96
5
2,13
2
2,03
7
1,30
2
3,05
9
1H04 2H04 1H05 2H05 1H06 2H06 1H07 2H07 1H08 2H08 1H09 2H09 1H10 2H10 1H11 2H11 1H12 2H12 1H13 2H13 1H14
13 26 31
50 60 68 74 83
128
70 67
93
71
113
118
127
139
126
112
122
138
6 7 6 7 13 9 8 10 8 13 6 13 11 12 27 24 31 25 19 22 18
1H04 2H04 1H05 2H05 1H06 2H06 1H07 2H07 1H08 2H08 1H09 2H09 1H10 2H10 1H11 2H11 1H12 2H12 1H13 2H13 1H14
Consumer services Information technology
62 180
188
263
367
506
372
459 1,
201
489
511 1,
068
447
2,34
4
1,33
7
1,29
0
1,02
1
938
996 1,
676
3,80
7
51 36 48 31 144
59 156
99 41 157
29 91 93 195
319
120 369
135
203
139
300
1H04 2H04 1H05 2H05 1H06 2H06 1H07 2H07 1H08 2H08 1H09 2H09 1H10 2H10 1H11 2H11 1H12 2H12 1H13 2H13 1H14
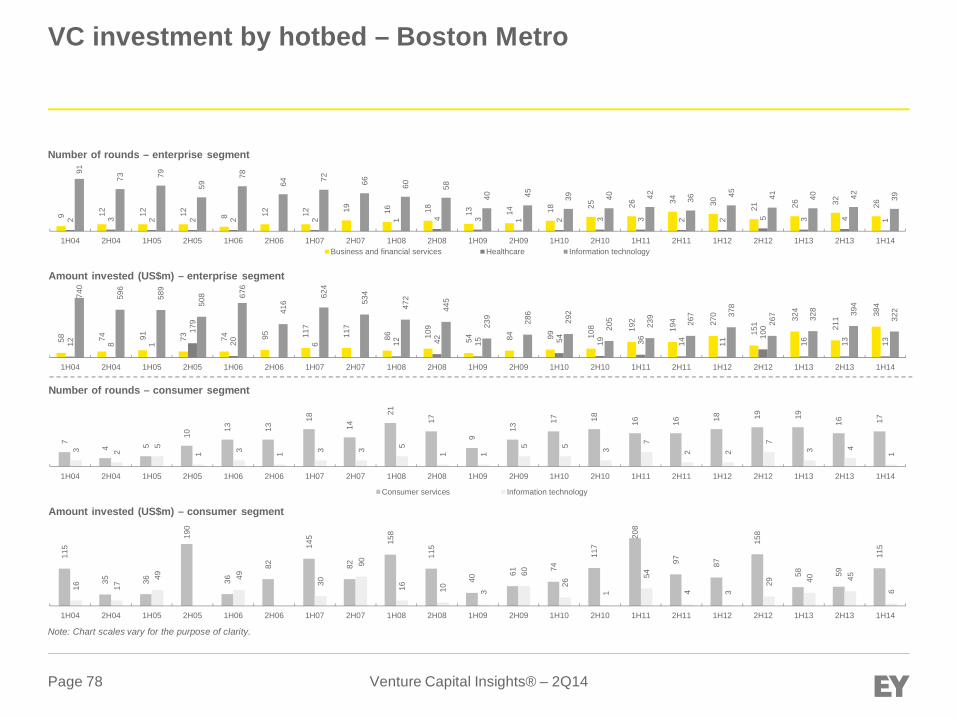
Venture Capital Insights® – 2Q14Page 78
VC investment by hotbed – Boston Metro
Number of rounds – enterprise segment
Amount invested (US$m) – enterprise segment
Number of rounds – consumer segment
Amount invested (US$m) – consumer segment
Note: Chart scales vary for the purpose of clarity.
9 12 12 12 8 12 12 19 16 18 13 14 18 25 26 34 30 21 26 32 26
2 3 2 2 2 2 1 4 3 1 2 3 3 2 2 5 3 4 1
91
73 79
59
78
64 72 66 60 58
40 45 39 40 42 36 45 41 40 42 39
1H04 2H04 1H05 2H05 1H06 2H06 1H07 2H07 1H08 2H08 1H09 2H09 1H10 2H10 1H11 2H11 1H12 2H12 1H13 2H13 1H14Business and financial services Healthcare Information technology
58 74 91 73 74 95 117
117
86 109
54 84 99 108 19
2
194 27
0
151 32
4
211 38
4
12 8 1
179
20 6 12 42 15 54 19 36 14 11
100
16 13 13
740
596
589
508 67
6
416
624
534
472
445
239 286
292
205
239
267 37
8
267 32
8 394
322
1H04 2H04 1H05 2H05 1H06 2H06 1H07 2H07 1H08 2H08 1H09 2H09 1H10 2H10 1H11 2H11 1H12 2H12 1H13 2H13 1H14
7
4 5
10
13 13
18
14
21
17
9
13
17 18 16 16 18 19 19
16 17
3 2
5
1 3 1 3 3 5
1 1
5 5 3
7
2 2
7
3 4
1
1H04 2H04 1H05 2H05 1H06 2H06 1H07 2H07 1H08 2H08 1H09 2H09 1H10 2H10 1H11 2H11 1H12 2H12 1H13 2H13 1H14
Consumer services Information technology
115
35 36
190
36
82
145
82
158
115
40
61 74
117
208
97 87
158
58 59
115
16 17
49 49
30
90
16 10 3
60
26
1
54
4 3
29 40 45
6
1H04 2H04 1H05 2H05 1H06 2H06 1H07 2H07 1H08 2H08 1H09 2H09 1H10 2H10 1H11 2H11 1H12 2H12 1H13 2H13 1H14
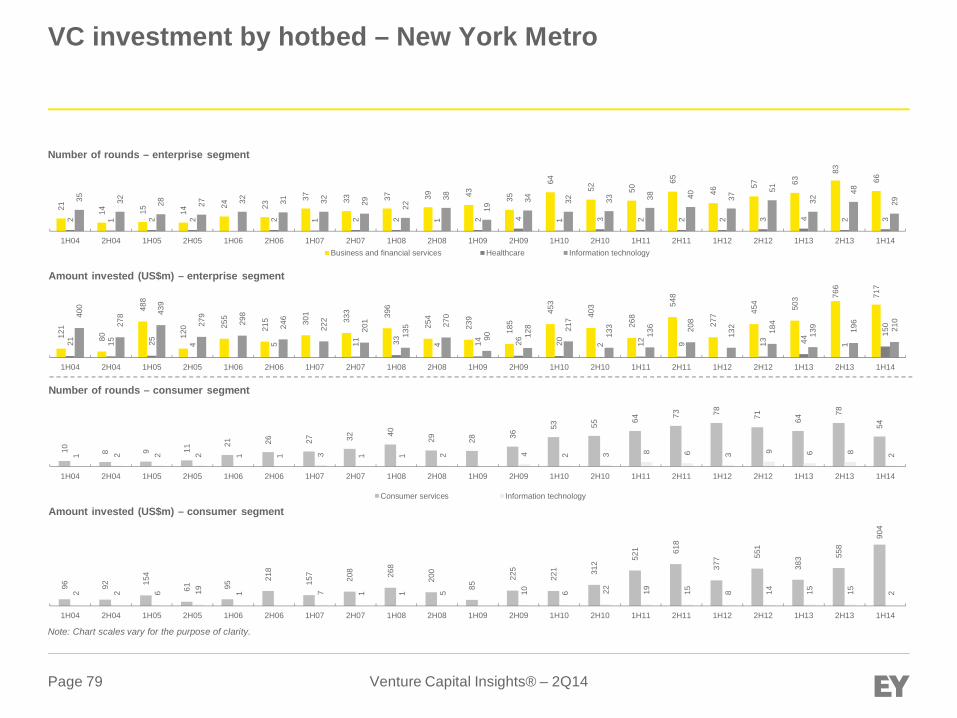
Venture Capital Insights® – 2Q14Page 79
VC investment by hotbed – New York Metro
Number of rounds – enterprise segment
Amount invested (US$m) – enterprise segment
Number of rounds – consumer segment
Amount invested (US$m) – consumer segment
Note: Chart scales vary for the purpose of clarity.
21 14 15 14
24 23
37 33 37 39 43 35
64
52 50
65
46
57 63
83
66
2 1 2 2 2 1 2 2 1 2 4 1 3 2 2 2 3 4 2 3
35 32 28 27 32 31 32 29 22
38
19
34 32 33 38 40 37
51
32
48
29
1H04 2H04 1H05 2H05 1H06 2H06 1H07 2H07 1H08 2H08 1H09 2H09 1H10 2H10 1H11 2H11 1H12 2H12 1H13 2H13 1H14Business and financial services Healthcare Information technology
121
80
488
120 25
5
215 30
1
333 39
6
254
239
185
453
403
268
548
277 45
4
503 76
6
717
21 15 25 4 5 11 33 4 14 26 20 2 12 9 13 44 1
150
400
278 43
9
279
298
246
222
201
135 27
0
90 128 21
7
133
136 20
8
132 184
139 19
6
210
1H04 2H04 1H05 2H05 1H06 2H06 1H07 2H07 1H08 2H08 1H09 2H09 1H10 2H10 1H11 2H11 1H12 2H12 1H13 2H13 1H14
10 8 9 11
21 26 27 32 40
29 28 36
53 55 64 73 78 71 64
78
54
1 2 2 2 1 1 3 1 1 2 4 2 3 8 6 3 9 6 8 2
1H04 2H04 1H05 2H05 1H06 2H06 1H07 2H07 1H08 2H08 1H09 2H09 1H10 2H10 1H11 2H11 1H12 2H12 1H13 2H13 1H14
Consumer services Information technology
96 92 154
61 95
218
157
208 268
200
85
225
221 31
2 521 61
8
377 55
1
383 55
8
904
2 2 6 19 1 7 1 1 5 10 6 22 19 15 8 14 15 15 2
1H04 2H04 1H05 2H05 1H06 2H06 1H07 2H07 1H08 2H08 1H09 2H09 1H10 2H10 1H11 2H11 1H12 2H12 1H13 2H13 1H14

Venture Capital Insights® – 2Q14Page 80
Sector classification
Sector Sub-sectorBusiness and financial services Business support services
Construction and civil engineeringFinancial institutions and servicesWholesale trade and shipping
Consumer goods Food and beverageHousehold and office goodsPersonal goodsVehicles and parts
Consumer services Consumer information servicesMedia and contentRetailersTravel and leisure
Energy and utilities Non-renewable energyRenewable energyUtilities
Healthcare BiopharmaceuticalsHealthcare servicesMedical devices and equipmentMedical software and information services
Industrial goods and materials Aerospace and defenseAgriculture and forestryMachinery and industrial goodsMaterials and chemicals
Information technology Communications and networkingElectronics and computer hardwareSemiconductorsSoftware
Sector Sub-sector Technology segment
Business and financialservices
Business support services EnterpriseFinancial institutions andservices Enterprise
Consumer servicesConsumer informationservices Consumer
Media and content ConsumerRetailers ConsumerTravel and leisure Consumer
Healthcare Medical software andinformation services Enterprise
Information technologyElectronics and computerhardware Enterprise/Consumer
Semiconductors EnterpriseSoftware Enterprise/Consumer

EY’s Global Venture Capital Advisory Group leadership network
Americas Markets and OperationsSandra Feldner Vandergriff+1 213 977 [email protected]
EMEIAAndrea Vogel+31 8 8407 [email protected]
Asia-PacificRingo Choi+86 755 2502 [email protected]
Greater ChinaLawrence Lau+862 1222 [email protected]
France and LuxembourgFranck Sebag+33 1 46 93 73 [email protected]
Global LeaderBryan Pearce+1 617 585 [email protected]
Global SGM LeaderMaria Pinelli+44 20 7980 [email protected]
IndiaMayank Rastogi+91 22 6192 [email protected]
IsraelOren Bar-On+97 2 3568 [email protected]
US LeaderJeff Grabow+1 408 947 [email protected]
EY | Assurance | Tax | Transactions | Advisory
About EYEY is a global leader in assurance, tax, transaction andadvisory services. The insights and quality services wedeliver help build trust and confidence in the capitalmarkets and in economies the world over. We developoutstanding leaders who team to deliver on ourpromises to all of our stakeholders. In so doing, we playa critical role in building a better working world for ourpeople, for our clients and for our communities.
EY refers to the global organization, and may refer toone or more, of the member firms of Ernst & YoungGlobal Limited, each of which is a separate legal entity.Ernst & Young Global Limited, a UK company limited byguarantee, does not provide services to clients. For moreinformation about our organization, please visit ey.com.
About EY’s Strategic Growth Markets NetworkEY’s worldwide Strategic Growth Markets Network is dedicatedto serving the changing needs of high-growth companies. Formore than 30 years, we’ve helped many of the world’s mostdynamic and ambitious companies grow into market leaders.Whether working with international mid-cap companies orearly-stage venture-backed businesses, our professionalsdraw upon their extensive experience, insight and globalresources to help your business succeed. www.ey.com/sgm
© 2014 EYGM Limited.All Rights Reserved.
1408-1308974ED None
This material has been prepared for general informational purposesonly and is not intended to be relied upon as accounting, tax, or otherprofessional advice. Please refer to your advisors for specific advice.
ey.com
Data source: Dow Jones VentureSource