global telecommunication traffic flows and market...
TRANSCRIPT

GLOBAL TELECOMMUNICATION TRAFFIC
FLOWS AND MARKET STRUCTURES:
A QUANTITATIVE REVIEW

AN IIC RESEARCH REPORT
GLOBAL TELECOMMUNICATION TRAFFIC
FLOWS AND MARKET STRUCTURES:
A QUANTITATIVE REVIEW
by Gregory C. Staple and Mark Mullins
International Institute of Communications 1989
THIS IS COPY NUMBER ..L!.
DO NOT REPRODUCE
For additional copies, contact:
International Institute of Communications Tavistock House South Tavistock Square
London WCIH 9LF Tel: 01-388 0671 Fax: 01-380 0623 Tlx: 24578 IICLDN G

TABLE OF CONTENTS
Page
Preface
Executive Summary
I. Introduction
II. International Telecommunication Market Structures: The End Of The Classical Era
A. The Classical Model
B. Post-Classical Models
III. Measuring The Global Market For Public International Telecommunication Traffic
A. The World’s Top Markets And Carriers
B. Bilateral Public Telecommunication Flows: The G-7 Countries
IV.
1. The United States
2. The United Kingdom
3. France
4. - Germany (FR)
5. Italy
6. Japan.
7. Canada
The Changing Demand For International Telecommunication Services: Business Cycles, Travel And Financial Markets
A. The Business Cycle
B. International Travel
C. Financial Market Activity
Appendix A - Methodology and Sources
Endnotes
ooo
111
iv
1
3
3
3
5
5
10
12
15
18
19
20
21
22
25
25
25
26
27

LI~T OF TABL]~
1 The World’s Top 25 Public International Carriers 6
2 The World’s Top 10 National 7 Telecommunication Markets
3 The World’s Top 20 Public Carriers 8
4 The Economies Of The Group Of Seven (G-7) Countries 11
5a The United States And Its Major Telecommunication 12 Correspondents (1986)
5b The Changing U.S. International Telecom Market: 13 Incoming Traffic From Top 10 Countries, 1977, 1987 And 1992
Page
5c The Changing U.S. International Telecom Market: 14 , Outgoing Traffic To Top 10 Countries, 1977, 1987 And 1992
6a The United Kingdom And Its Major 15 Telecommunication Correspondents (1978 And 1986)
6b The Changing U.K: International Telecom Market: 16 Incoming Traffic From Top 10 Countries, 1978, 1987 And 1992
6c The Changing U.K. International Telecom Market: 17 Outgoing Traffic To Top 10 Countries, 1978, 1987 And 1992
France And Its Major Telecommunication Correspondents (1986)
18
8 Germany (FR) And Its Major Telecommunication 19 Correspondents (1986)
9 Italy And Its Major Telecommunication 20 Correspondents (1986)
10 Japan And Its Major Telecommunication 21 Correspondents (1986)
11 Canada And Its Major Telecommunication 22 Correspondents (1986)
ii

PREFACE
The International Institute of Communications (IIC) has long been interested in the flo~" of electronic information -- messages, images, data -- between countries. An understanding of these linkages is crucial for both business and government. The pattern of transborder communications also has major social and cultural implications.
In 1976 the IIC developed a methodology to map the global flow of television programming (InterMedia, October 1976 and February 1977) and subsequently published several reports on this matter. The current research report on transnational telecommunication traffic flows and market structures provides a valuable complement.
The analysis presented here draws on a comprehensive IIC study of telecommunication traffic statistics by Gregory C. Staple, Director of the IIC Telecommunications Forum, and Mark Mullins, an IIC consultant, published in Telecommunications Policy (June 1989). The study calls for the creation of a new set of industry statistics, based on MiTT -- Minutes of Telecommunication Traffic -- to log flows over circuits of common bandwidth. The regular compilation of MiTT statistics is seen to have various benefits, including the potential value of MiTT as a new economic indicator for tracking general business cycles.
As described here, traffic statistics can also provide an important new tool for analyzing the international telecommunication industry. What are the world’s major international telecom service markets9. How will they change in the 1990s? What are the principal bilateral traffic flows to and from the world’s largest economies, the so-called Group of Seven (G-7)? How will liberalization and the telecom needs of Newly Industrialized Countries (NICs) affect traditional traffic patterns? These are some of the questions this report addresses. It should therefore be of widespread interest.
The II¢ is a non-governmental, non-profit, policy and research organization based in London. It specializes in broadcasting and telecommunication issues from an international perspective. Readers interested in IIC membership or in obtaining other Institute publications and reprints (e.g., from Telecommunications Policy or InterMedia) should contact the London Secretariat.
G. Jayasuriya Assistant Director
111

EXECUTIVE SUMMARY
This IIC research report present~ a c~mprehensive overview of global telecommunication traffic flows in the 1980s and highlights trends for the 1990s.
It utilizes statistics on public telecommunication traffic to quantify:
(1) the w6rld market shares of the leading domestic and international telecommunication service carriers;
(2 the relative size of the bilateral telecommunication flows to and from each of the Group of Seven (Go7) countries; and
(3) key factors affecting the level of global telecommunication traffic -- the business cycle, international travel and financial market activity.
Part I introduces the report’s methodology. Analysis of the international telecommunications industry commonly relies upon revenue and facilities figures.
This report takes a fresh approach. It tabulates statistics on the volume of telecommunication traffic actually carried by public service providers and the routes over which the traffic is delivered. Working from dozens of published and unpublished sources, the report presents the first comprehensive survey of global public telecommunication flows in the 1980s.
Part II describes the strategic significance of these telecommunication traffic statistics in today’s markets. Liberalization in the United States, the United Kingdom and Japan -- which together generate over 30% of the world’s international telecom traffic -- are breaking down old market structures. The exclusive rights of national carriers to provide service within their own political jurisdiction and to and from states served by similar national carriers are being challenged.
In the next decade, the world’s major domestic markets and the international routes with the largest, most profitable traffic flows will be subject to increasing competition. This competition will have a global impact, although many countries have yet to decide the scope for competitive service suppliers, because international telecommunication flows are highly concentrated (the top 10 carriers have approximately 70% of the market).
Part IIIA ranks the world’s top 25 international public carriers and compares their size to major domestic carriers. AT&T, the largest international carrier, is seen to carry twice as much traffic as its nearest competitor, the Deutsche Bundespost. The analysis also reveals the enormous traffic bases of the seven Regional Bell Operating Companies (RBOCs) and Bell Canada which, together with NTT and GTE, are the largest carriers in the world today.
Part IIIB tabulates the bilateral traffic flows to and from the G-7 countries: the United States, the United Kingdom, France, Germany, Italy, Japan and Canada. Bar charts are also presented on the changing traffic volumes to and from the top 10 correspondents for the United States and the United Kingdom from the mid 1970s to the mid 1980s, with projections to 1992.
These traffic statistics reveal, among other things, that:
** The U.S. international telecom business is moving West. And South. In the 1990s, Taiwan, South Korea, the Philippines, Australia and Colombia will be an integral part of the American tele-continont. Accordingly, these countries will be as important to some U.S.-based service providers as traditional markets such as France and Italy.
iv,

** During the last decade, the U.K. international telecoms market also looked more to the West. And to the Far Ea.Ct. In 1986, the U.S. accounted for approximately 25% of U.K. outgoing traffic, up more than 40% since 1978. The share of U.K. traffic to Japan and Hong Kong has also doubled in the same period. Traffic to and from continental Europe has declined by comparison.
** The fastest growing telecom service markets in the world are probably Asia’s Newly Industrialized Countries (NICs) --Taiwan, South Korea, Hong Kong and Singapore. Japan’s strong ties to this region suggest that the Asian NICs will continue to be a principal target for Japan’s international carriers.
** Bilateral traffic flows tend to divide the G-7 countries into two tele-blocs. One bloc includes the U.S., Canada, the O.K. and Japan. The other Euro-centric bloc comprises France, Germany and Italy. These tele-blocs tend to mirror the G-7 divides on liberalization. This suggests that international traffic linkages may provide a useful tool for identifying future pressures for liberalization and hence new market opportunities.
Part IV looks briefly at some key factors affecting the changing pattern of international telecom traffic flows described in Parts II and III. New evidence is presented regarding the linkages between telecom traffic flows and (1) the general business cycle; (2) international travel; and (3) activity in financial markets.

GLOBAL TELECOMMUNICATION TRAFFIC FLOWS
AND MARKET STRUCTURES: A QUANTITATIVE REVIEW
I. Introduction
by Gregory C. Staple and Mark Mullins 1
Market structures often define market strategies. So too does the size of a market; knowledge about the level (and location) of market demand generally is as important to the businessman as it is to effective government oversight. This research report is designed to provide the reader with basic data on these two interrelated aspects of the public international telecommunication services market.
The market for international telecom services is now very large. And it continues to grow at double-digit rates. We estimate that the volume of international traffic carried on public voice circuits alone will amount to between 22 and 26 billion minutes in 1989.2 Revenues from this traffic will probably exceed $25 billion; revenues from international leased lines and other international services may add another 10-15%.
Where does all the traffic go? And where will it go tomorrow?
The answers to these questions are now of wide interest. It is of primary concern, of course, to the world’s major carriers whose joint provision of international service has traditionally given them an exclusive overview of global traffic patterns. But, the classical structure of the international market is breaking down.
Technological and economic forces have begun to blur the boundaries between domestic and international carriers. Likewise, liberalization is opening the door for new value-added service providers to offer end-to-end transborder services. It has also brought several new international carriers to the market and spurred existing carriers to undertake a variety of innovative trans- border marketing initiatives. At the same time, economic development has generated large new demands for international telecom services, especially in the Pacific Basin and the Americas.
These changes are already affecting the structure and pattern of traffic in the international market. The big questions are "by how much?" and "what is the direction of future change?"..
To begin to answer these questions, this report reviews the structure of the international telecom services market in the mid-1980s. It is based upon a quantitative analysis of international telecommunication traffic volumes and bilateral calling patterns for the G-7 countries (U.S., U.K., Germany, France, Italy, Japan and Canada). The analysis builds upon a recent International Institute of Communications (IIC) study showing how telecommunication traffic statistics can be used as a new economic and regulatory policy tool.3
For several reasons, this report relies primarily upon traffic statistics (rather than facilities or revenue data) to determine market structures and trends.

First, for most countries, telecommunication statistics are still a "black hole". Published reports offer incomplete information; there is no common international unit of account; and data on traffic flows are rarely disaggregated. Accordingly, no standard tabulation of telecommunication traffic flows to and from the world’s major economies is generally available.
This report follows the convention proposed in the IIC’s recent study in utilizing MiTT -- paid Minutes of Telecommunication Traffic -- as a common statistical standard. As with other widely used economic production statistics (barrels of oil, tons of steel), MiTT is readily understandable. It directly measures the amount of telecommunication service consumed by the user and delivered by the producer.
Further, MiTT is not service- or carrier-specific; it is invariant over time and applicable across national boundaries. For these reasons, this report presents all traffic data in terms of MITT. Traffic data from countries which use a different unit of account have been converted to MITT. Where country or carrier data are incomplete, MiTT statistics have been estimated. See Appendix A.
Second, statistics on telecommunication traffic may capture important information which figures on revenues and facilities do not. Because the aggregate revenue of most carriers is a function of volume, price and service mix, annual changes in earnings are difficult to interpret. Cross- national comparisons can also involve arbitrary foreign exchange assumptions. Similarly, data on the supply of telecommunication facilities (circuit capacity, installed exchange lines) may be of limited value when, as is now often the ease for the G-7 countries, capacity does not constrain demand.
In these circumstances, MiTT statistics can provide a useful alternative measuring rod. They can enhance cross-country comparison of telecommunication providers; underscore differences in per capita calling patterns, network utilization rates and service markets. They can also highlight telecom linkages between countries which are missed by other industry statistics. MiTT data consequently can add a new dimension to the analysis of industry developments beyond that possible from other statistical data bases.
The next part of the report shows why teleeom traffic statistics are of growing strategic importance.

II. International Telecommunication Market Structures: The End Of The Classical Era
A. The Classical Model
For most of the 20th century, international telecommunication followed a classical model. It was predicated on sovereign states which, with limited exception, furnished national telecommunication through state-owned carriers operating as a monopoly. National carriers thus had exclusive rights within their own political jurisdiction.
Within this framework, the operational practice of international telecommunication was straightforward. For example, an international telephone call from Country A to Country B involved a call which was originated by Country A’s national carrier and handed-off to Country B’s national carrier at the border for termination. If A and B were contiguous, the two carriers simply interconnected the appropriate circuits; if not, A and B were generally interconnected through transitting carriers (e.g., in Countries C and D).
Revenues for the call were divided 50/50 between A and B by agreed settlement rules. Country A’s national carrier did not operate in Country B and vice versa. The structure of the public telecommunications business was essentially static. There was thus little reason to look at carrier market shares or bilateral calling patterns because market boundaries were fixed and new service providers were kept out.
B. Post-Classical Models
Today the classical model of international telecommunications is breaking down. One reason is technology. Satellites and cable networks need know no boundaries; governments are defined by the boundaries they keep. The continuing tension between the indiscriminate geographic potential of modern electronic communications systems and the geographic discrimination upon which nations are founded is everywhere apparent.
Since the 1960s, telecommunication satellites have offered the potential for a single service provider in Country A to provide end-to-end international service between users in Countries A, B, C, D, etc., assuming suitable "landing" arrangements could be negotiated. In the 1980s, beginning with limited transborder services in North America, governments agreed to authorize such services although, to date, authorizations have precluded carriage of basic voice services.
Private Branch Exchanges (PBXs) offer similar possibilities for bypassing traditional service arrangements. A telephone user in Country A who desires to communicate with two or more offices of Company X in Country B may do so by making one call to. the Company X main PBX in Country B. Further, if the PBX of Company X is linked (e.g., via a leased line) to company offices in Countries C and D, then the caller may also reach these countries without transmitting the ordinary international facilities of the carriers in Countries C and D.
But new technologies have not only benefitted users and bypassers. Computer controlled billing and switching facilities have enabled established carriers to adopt innovative international routing and marketing techniques. These practices (e.g., customized virtual networks; home-country direct calls; international "800" numbers; multicountry telephone credit cards) are bringing international carriers in competition for customer revenues with (a) traditional correspondents and (b) domestic carriers in foreign markets.

Trade opportunities in the telecom service sector also, ha,ve encouraged new facilities (e.g., private transoceanic cables) and special service arrangements which seek to capture as much of the end-to-end value of a given international telecommunication as possible. Some of these strategies seek to reduce the traditional role of connecting carriers and, where value-added service is involved, the share of the transaction accruing to the basic service carrier. A legal basis for such " special arrangements", with particular relevance for value-added services, was recently agreed by the international community in Article 9 of the ITU International Telecommunication Regulations (Melbourne, 1988).4
It would be a mistake, however, to attribute the erosion of the classical model solely to new technologies; old technologies and old economics may be of equal importance. In fact, some post- classical models for international telecommunications may look very much like the pre-classical models.5
In the 19th century, for example, transoceanic telegraph cables were pioneered by private investors. Private telegraph and telephone networks proliferated before there were government monopolies. And, wireline-based networks have long offered’the, potential for one country to (re)route domestic interexchange traffic over an adjacent’coufitry’s facilities to exploit economies of scale or scope.6 The development of very large capacity satellites and fiber optic cables has only renewed the debate over these options.
Political decisions ultimately determine the extent to which technological and economic forces are able to reshape the industry’s structure. As far as the international telecommunications market is concerned, two recent political developments deserve emphasis. Each will directly affect the market for the core traffic streams described in Part III below.
First, during the last decade, three major telecom powers, the U.S., the U.K. and Japan, have decided: (a) to grant authorizations for competitive facilities-based international telecommunications carriers; and (b) to grant landing licenses for new private transoceanic cables. These decisions will effect a significant de facto allocation of international traffic. The political acceptability of these actions thus is, in part, dependent upon the prevailing belief that the established carriers can "grow down" --i.e., that the growth in the international market will be sufficient to increase existing carriers’ revenues even as they lose market share. (See Part IIIA and Endnote 10 below)
The liberalization of the international services market and the corresponding growth of new international telecom gateways is also leading to new competitive pressures on domestic markets. Should foreign carriers be permitted to provide service wholly between domestic points? In the airline industry, this is known as cabotage. And, amid growing controversy, it is generally prohibited.7 Given the massive traffic generated by key domestic markets as compared to international routes (compare Tables 1 and 2 below) the telecoms equivalent of cabotage (e.g., resale of domestic voice telephone services; special domestic facilities licenses) is also likely to be one of the key telecom issues for the 1990s.
A second and related political development is the increasingly successful campaign by major teleeom users to structure transnational telecommunication arrangements on an end-to-end basis to satisfy their own business requirements. Traditional carriers generally have sought to accommodate these user interests (without impairing the right to serve users’ end-customers) by making available leased lines for closed user groups. Resale is precluded; the lines are jointly provided by_ corresponding carriers and, for the most part, are subject to established settlement procedures.8
4

However, value-added providers seek a more flexible regime. They require basic telecommunication facilities to deliver their own products (e.g., financial information, accountancy services, architectural drawings, data processing, etc.). These service providers, as with their chief customers, are horizontally integrated across national boundaries. They do not want to have their products subject to different pricing or handling practices from country to country. Nor do they wish national telecom carriers to second guess the best way to deliver a product directly from their communication facilities to. a customer’s desk-top terminal.
Hence, the horizontally integrated operations of these companies leads them to search for a flexible, horizontally integrated telecom regime. Where the classical model does not provide it, they seek to forge alternative arrangements.
III. Measurin~ The Global Market For Public International Telecommunication Traffic
The structural changes now under way in the global telecommunications market and the high financial stakes involved make baseline traffic statistics of growing interest. How large are current international traffic flows7 What are the principal routes? What are the market shares of the major carriers?
Before addressing these questions, two major caveats are in order.
First, it is not now possible to tabulate telecommunication traffic statistics on a sector-wide basis. The traffic carried over public international telecommunications circuits is metered and rudimentary data are available for many countries. Absent user surveys, however, accurate statistics on the traffic volumes on private circuits (e.g., leased lines) will remain largely unknown. Accounting for much of the traffic which will transit the post-classical international networks of the future thus presents a growing challenge.
Second, as foreign telecom carriers make direct investments in domestic and international carriers based in other countries, the ultimate national beneficiary of a given international traffic stream will become more difficult to assess.9 This accounting problem is common to many other global industries where foreign investment and trade flows must be considered together in order to compile a meaningful set of national accounts. Such is the new world which the international telecommunications industry is now entering.
With these cave,Its, we offer the following baseline statistics as a point of departure. All of the tables which follow are based upon public voice circuit traffic only. The data sources and methodology utilized in the preparation of the tables are described in Appendix A.
A. The World’s Top Markets And Carriers
Table 1 ranks the world’s top 25 public international telecommunication carriers by traffic volume. Table 2 surveys the largest domestic telecommunication markets and Table 3 provides a composite ranking of the world’s top 20 public telecommunication carriers, domestic and international.

Table I
THE WORLD’,S TOP 25 PUBUC INTERNATIONAL CARRIERS
Rank
Outgoing Market MiTl’in Share
Carrier Country Mllions ~,
1 AT&T U.S. 3833 22.0 2 Deutsche Bundespost Germany 1977 11.3 3 British Telecom U.K. 1310 7.5 4 France Telecom France 1095 6.3 5 Telecom Canada * Canada 941 5.4
6 Swiss PTT Switzerland 802 4.6 7 Italcabte/ASST Italy 609 3.5 8 Netherlands PTT Netherlands 575 3.3 9 Telefonica Spain 500 2.9 10 Belgian PTT Belgium 452 2.6
11 Televerket Sweden 381 2.2 12 Austrian PTT Austria 321 1.8 13 KDD Japan 319 1.8 14 Danish PTT Denmark 241 1.4 15 OTC Australia 239 1.4
16 .Saudi Com. Ministry Saudi Arabia 236 1.4 17 DGT, Mexico Mexico 224 1.3 18 Teleglobe C~.nada Canada 223 1.3 19 Nor. Telecom. Auth. Norway 204 1.2 20 Cable and W~reless * U.K. 204 1.2
21 MCI U.S. 163 0.9 22 Hellenic Telecom. Org. Greece 152 0.9 23 UAE Com. Ministry U.A.E. 120 0.7 24 Finnish PTT Finland 119 O. 7 25 Singapore Telecoms Singapore 99 0.6
Total above 15339 88.0 World total 17436 100.0
First Quintile 52.5 Second Quintile 16.8 Third Quintile 8.6 Fourth Quintile 6.3 Fifth Quintile 3.8
NOTE: Carrier rankinE, s are ba~d on out~oing Minutes of Teiecommunicalion Traffic (MITT) carried by public voice circuits in 1986. MITT values have been estirnated in certain cases where data are incomplete.
* Telecom Canada totalincludes U.S. and IViexico traf/ic originated by nine provincial telephone companies and Telesat Canada; Cable and Wireless total includes only traffic originated by Hone Kong Telephone and, in lhe United Kingdom, by Mercury Communications.
© interna~llnsfitute of Communicafions 1989 All rights reserved

Table 2
THE WORLD’S TOP 10 DOMESTIC TELECOMMUNICATION MARKETS
Rank Country
Domestic Market MiTT in Share millions (%)
1 U.S. 1793832 40.0 2 J a pa n 191467 4.3 3 Canada 159324 3.5 4 France 85411 1.9 5 U.K. 78648 1.8
6 Ge rmany 72259 1.6 7 U.S.S.R. 62860 1.4 8 Brazil 58908 1.3 9 Italy 48676 1.1 10 Taiwan 41190 0.9
Total Above 2592575 57.8 World Total 4488159 100.0
NOTE: Market rankin£s am based on total Iocal(exchanEe) and lone distance (interexchan~,e) Minutes of
Telecommunication Traffic (MiTD carried by public voice circuits in 1986. MiTT values have been est]mated in certain
cases where data are incomplete.
© Internationallnstitute of Communications 1989 All rights reserved
7

Table 3
THE WORLD’S TOP 20 PUBLIC CARRIERS
Market MiTT in Share
Rank Carrier Country millions
1 Bell South U.S. 316428 7.1 2 Bell Atlantic U.S. 284835 6.3 3 Ameritech U.S. 283098 6.3 4 Nynex U.S. 252528 5.6 5 Southwestern Bell U.S. 214962 4~
6 G T E U.S. 201615 4.5 7 Pacific Telesis U.S. 201’~.’!.’~. 4.5 8 NTT Japan 191467 4.3 9 ATT U.S. 144637 3.2 10 US West U.S. 133714 3.0
11 France Telecom France 86506 1.9 12 Bell Canada Canada 83548 1.9 13 British Telecom U.K. 79930 1.8 14 Deutsche Bundespost Germany (FR) 74236 1.7 15 Soviet P1-F U.S.S.R. 62872 1.4
16 Te le b ras Brazil 58974 1.3 17 SIP/ASST Italy 49285 1.1 18 D.G. Telecoms Taiwan Taiwan 41267 0.9 19 Telefonica Spain 30500 0.7 20 Telecom Australia Australia 27089 0.6
Total above 2818936 62.8 World total 4A88159 100.0
Top 5 30.1 Top 10 49.6 19.4 Top 15 58.2 8.6 Top 20 62.8 4.6
NOTE: Carrierrankingsare basedon totaldornestic (exchange andinterexchange)plusoutgoinginternationalMinutesof Telecommunication Traffic ~MiTT) carried by public voice circuits in 1986. MiTT values have been estimated in certain cases
where data are incomplete.
© lntemational lnsfJtute of Communications 1989 All rights reserved

We highlight the following information in Tables 1 to 3:
The world telecommunication market is highly concentrated; five carriers account for approximately 53% of outgoing international voice circuit traffic; 10 carriers account for almost 70% of such traffic.
Carriers from the Group of 7 (G-7) countries are the principal international telecommunication service providers. The other major international players are from Western Europe, the Middle East and Australasia.
The United States (with approximately 120 million access lines) is by far the world’s largest telecommunication market; it accounts for nearly one-quarter of outgoing public international MiTT and approximately two-fifths of the world’s domestic public telecommunication traffic.
The great size of the U.S. market and limited barriers to entry make it a primary target for foreign service providers. The size of the U.S. market also provides America’s eight major domestic exchange carriers (e.g., GTE and the Regional Bell Operating Companies) with a traffic base greater than almost all other national carriers. Some of these carriers may be authorized to expand their international activities in the future and their subscriber base is therefore of increasing interest.
The global traffic shares of Bell Canada and Telecom Canada underscore the relative telecom intensity of the North American economy. In both the U.S. and Canada (with approximately 13 million access lines), the volume of MiTT per access line generally is 3 or 4 times that in other countries because (a) average national call lengths are about 5 minutes (as opposed to 3 or less elsewhere); and (b) the annual number of calls per access llne is about 2 to 3 times that in most other parts of the world.
The relatively lower per access line MiTT figures for Japan and Europe suggest that price and service innovation could trigger a considerable increase in network utilization in these markets. It seems unlikely, however, for both cultural and economic reasons, that Japan and Europe will become as telecom intensive as North America. We note, for example, that because the disparities in MiTT per access line between N. America and Japan/Europe are significantly greater than the disparities in GNP per capita (see Table 4), the Japanese and European economies may be more efficient in their utilization of telecom services.
The traffic being carried by new international carriers in the U.S., the U.K. and Japan is still very small compared to the established carriers. With the exception of MCI, they do not appear in Table 1 or 3 (compiled using 1986 data). Nor will this situation change until the 1990s.10 Yet the concentrated nature of the international telecommunication market suggests that the liberalization of telecom service in relatively few markets is likely to have an expansionary effect on the whole market and, by implication, the ultimate fortunes of new carriers. Liberalization thus need not necessarily be far-reaching geographically to have significant follow-on effects on the international marketplace.

Bilateral Public Telecommcni¢~tion Flows: The G-7 Countries
The billions of individual telephone calls which daily transit the global network are the de facto architects of the changing information economy. As illustrated above, however, the market for public telecommunication is relatively concentrated. Traffic on public voice-grade circuits to and from the G-7 countries -- the U.S., the U.K., France, West Germany, Italy, Japan and Canada -- is crucial; it accounts for over 60% of the total traffic. A detailed analysis of the bilateral traffic flows for the G-7 group thus provides an important guide to the structure of the international telecommunication market as a whole.
Table 4 profiles the economies of the G-7. Tables 5 to 11 profile the public telecommunication traffic flows between each of the G-7 countries and its major correspondents.
10

Table4
THE ECONOMIES OF THE GROUP OF SEVEN (G-7) IN 1986
Popu- GNP Percent Percent Percent Percent lation per world world telephone outgoing
(millions) capita GNP exports access MITT In U$$ lines
U.S. 241.6 17859 32.3 10.3 27.4 23.3 J a p a n 121.4 12850 15.1- 10.0 11.0 1.9 Germany (FR) 60.9 12090 6.9 11.5 62 11.3 Fra n c e 55.4 10710 5.6 5.9 5.5 6.3 Italy 57.2 8550 4.6 4.6 42 3.5 U.K. 56.6 8920 3.6 5.1 52 7.4 C a n a d a 25.6 15614 2.5 42 3.0 6.7
G7 Total 618.7 - 70.6 51.6 62.5 60.4
NOTE: MiTT is Minutes of Telecomrnunicalion Traffic. Data are for public voice circuits only. MiTl’values have been
estimated in certain cases where data are incomplete.
© lnternational lnsMute of Comrnunicaf3ons 1989 All rights reserved
]!

Table 5a
THE UNITED STATES AND ITS MAJOR TELECOMMUNICATION CORRESPONDENTS { 1986)
Destination
Outg, oing Market MiTT in Share
Millions*
Canada 882 21.7 Mexico 540 13.3 U.K. 350 8.6 Germany 260 6.4 Japan 140 3.4
France 100 2.4 Italy 93 2.3 Australia 82 2.0 Hong Kong 78 1.9 Switzerland 76 1.9
Jamaica 76 1.9 Brazil 61 1.5 Netherlands 56 1.4 Sweden 54 1.3 Colombia 52 1.3
Panama .47 1.2 Israel 45 1.1 Taiwan 41 1.0 South Korea 40 1.0 Venezuela 38 0.9
Bahamas 35 0.9 Argentina 32 0.8 Dominican Republic 32 0.8 Spain 29 0.7 Belgium 29 0.7
Total Above 3270 Total U.S. Outgoing 4065
80.4 100.0
Top5 53.4 Top 10 64.0 Top 15 71.3 Top 20 76.5 Top 25 80,4
*MITT is Minutes of Telecommunication Traffic. Data are for internat~onal public voice circuits only.
International lns~’ute of Communicafions 1989 All rights reserved

Table 5b
THE CHANGING US INTERNATIONAL TELECOM MARKET Incoming traffic from the top ten countries
MiTr (millions)
700
600
500
400
300
200
zoo
0 UK GE JA FR IT AU SZ HK JM BR
MiTT level, 1977 ~ M~’i’T" level, 1987 MiTT level, 1992"
* estimated by linear extrapolation using average growth rates from 1982 to 1987
The Country code:
UK = United Kingdom
FR = France
SZ = Switzerland
BR = Brazil
GE = West Germany JA = Japan
IT = Italy AU = Australia
HK = Hong Kong JM = Jamaica
Canada and Mexico are excluded from the table
International InsMute of Communications 1989
All rightS reserved
13

Table 5c
THE CHANGING US INTERNATIONAL TELECOM MARKET Outgoing traffic to the top ten countries
MiTT (billions)
1.0
0.9
0.8
0.7
0’6!
0.4
UK GE JA FR IT CO SK DR PH TN
~ MiTi" level, 1977 i~ MiFI level, 1987 I~ Mil-r level, 1992"
* estimated by linear extT~olation using average growth rates from 1982 to 1987
The Country code:
UK = United Kingdom
FR = France
$K = South Korea
TN = Taiwan
GE = West Germany
IT = Italy
DR = Dominican Republic
Canada and Me,co are excluded from the table
JA = Japan
CO = Colombia PH = Philippines
International Institute of Communications 1989 All rights reserved
14
J

Table 6a
THE UNITED KINGDOM AND iTS MAJOR TELECOMMUNICATION CORRESPONDENTS 1978 AND 1986
Destination
Outgoing Market Share Percent
1978 1986
U.S. 17.1 24.2 WestGermany 13.3 11.0 France 11.7 9.3 Netherlands 7.6 5.5 Italy 6.2 4.7
Switzerland 4.8 4.1 Canada 4.0 3.8 Spain 3.7 3.8 Australia 1.9 3.1 Belgium 4.5 3.1
Sweden 2.7 2.4 Denmark 2.2 1.9 Japan 0.7 1.8 Norway 2.1 1.8 South Africa 1.4 1.5
Greece 2.4 1.4 Hong Kong 0.7 1.3 India 0.4 1.1 Portugal 0.8 0.9 Turkey 0.4 0.7
Total Above 88.1 87.6 Total U.K. 100.0 100.0
Top 5 55.9 54.7 Top 10 74.8 72.7 Top 15 83.9 82.1 Top 20 88.1 87.6
Quartile I 55.9 54.7 Quartile 2 18.9 17.9 Quartile 3 9.0 9.4 Quartile 4 4.3 5.5
NOTE: U.K. total excludes traffic to Eire.
© Intemalionallnsl~ute of Communications 1989
All riehts reserved
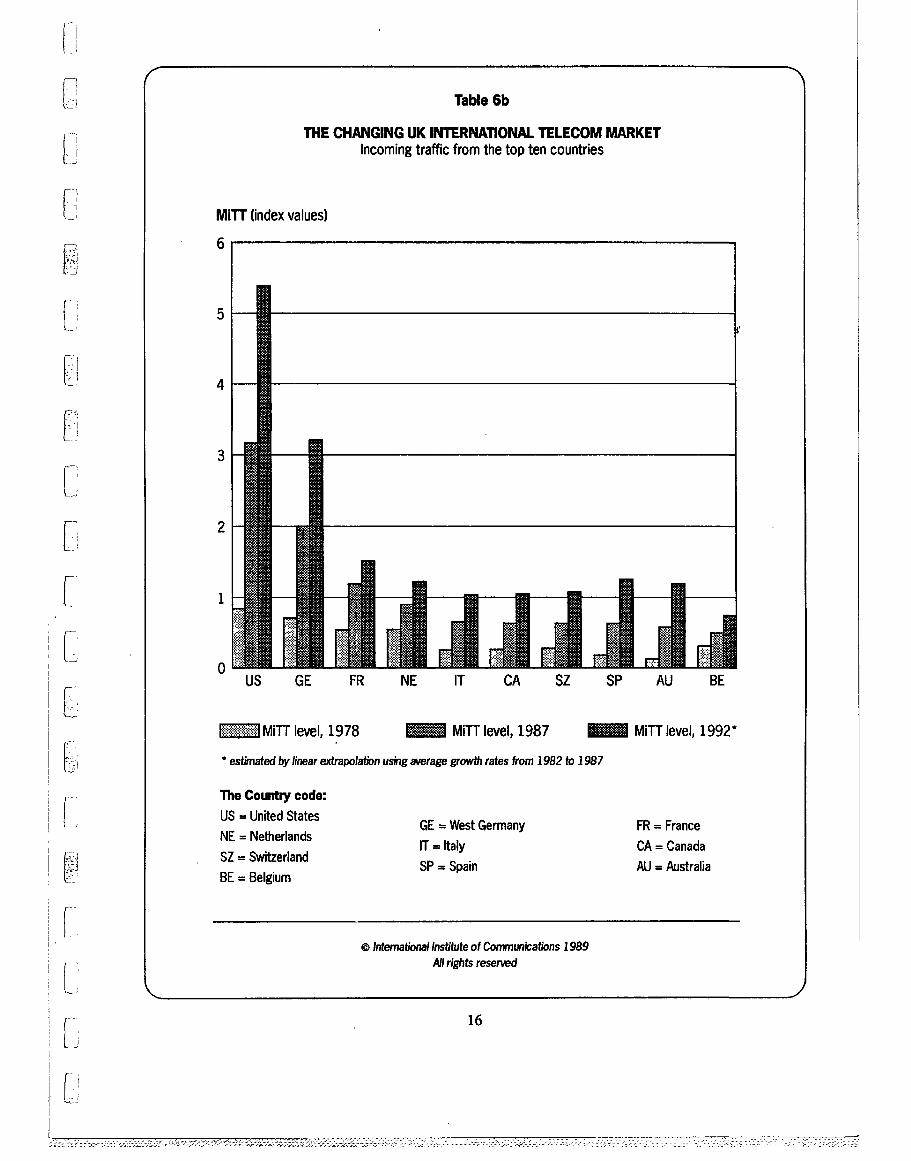
Table 6b
THE CHANGING UK INTERNATIONAL TELECOM MARKET Incoming traffic from the top ten countries
MiTT (index values)
6
0 US GE FR NE IT CA SZ SP AU BE
MiTT level, 1978 MiTT level, 1987 ~ MiTT level, 1992"
* estimated by linear extrai~ola~n using average grovvfh rates from 1982 to 1987
The Country code:
US = United States
NE = Ne~erlands
SZ = Switzerland
BE = Belgium
GE = West Germany FR = France IT = Italy CA = Canada SP = Spain AU = Australia
© International Institute of Communications 1989
All rights reserved
16

Table 6c ’
THE CHANGING UK INTERNATIONAL TELECOM MARKET Outgoing traffic to the top ten countries
Mi’l’r (index values)
7
6
5
4
.3
2
0 US GE FR NE IT SZ CA SP AU BE
MiTT level, 1978 IL~ MiTT level, 1987 ~ MiTT level, 1992"
* estimated by linear extrapolation using, average ~rowth rates from 1982 to 1987
The Country code:
US = United States
NE : Netherlands
CA = Canada
BE = Belgium
GE = West Germany FR = France
IT = Italy SZ = Switzerland SP = Spain AU = Australia
International Institute of Communications 1989 All rights reserved

Table 7
FRANCE AND ITS MAJOR TELECOMMUNICATION CORRESPONDENTS (1986)
Destination
Outgoing Market MiTT in Share
Millions *
Germany 150 13.7 U.K. 115 10.5 Italy 114 10,4 Belgium 93 8.5 Switzerland 76 6.9
Spain 69 6.3 U.S. 67 6.1 Portugal 51 4.7 Netherlands 41 3.7 Algeria 39 3.6
Morocco 27 2.5 Tunisia 21 1.9 Canada 11 1.0 Sweden 11 1.0 Yugoslavia 10 0.9
Greece 9 0.8 Turkey 9 0.8 Austria 8 O. 7 Denmark 8 0.7 Israel 8 0.7
Japan 0.5
TotalAbove 942 86.0 Total France 1095 100.0
Top 5 50.0 Top 10 74.4 Top15 81.7 Top20 85.5
Quartile I 50.0 Quartile 2 24.4 Quartile 3 7.3 Quartile 4 3.8
*MiTT is Minutes of Telecornrnunication Traffic. Data are for internaf~onal public voice circuits only.
© IntematJonal lnstitute of Communications 1989 AJI ri~ ts reserved
18

Table 8
GERMANY (FR) AND ITS MAJOR TELECOMMUNICATION CORRESPONDENTS (1986)
DesUnation
Outgoing Market MiTl’in Sham
Millions * ~
Austria 231 11.7 Switzerland 192 9.7 italy 180 9.1 France 178 9.0 Netherlands 176 8.9
Germany (D I~) 164 8.3 U.K. 158 8.0 Turkey 1~6 6.4 Yugoslavia 95 44 Belgium 77 3.9
U.S. 124 6.3 Canada 12 0.6 Japan 12 0.6
Total Above 1748 90.0 Total Germany 1977 100.0
*MiTTis Minutes of Te/ecommunication Traffic. Data are for international public voice circuits only
© Intema~nal Insl~lute of Communications J 989 All rights reserved

Table 9
ITALY AND ITS MAJOR TELECOMMUNICATION CORRESPONDENTS (1986)
Destination
Outgoing Market MiTT in Share millions * ~
Germany (FR) 138 22.7 France 1Q2 16.7
U.K.Switzerland ~
14.4 9.0
Austria 25 4.1
Belgium 23 3.7 Spain 19 3.1 Netherlands 15 2.5 Greece 15 2.5 Yugoslavia 13 22
U.S. 49 8.0 Canada 8 1.4 Japan 4 0.7
Total above 554 90.9 Total Italy 609 100.0
*MITT is Minutes of Telecommunication Traffic. Data am for international public voice circuits only.
(D Intemational lnsl~tute of Communicalions 1989
All r~hts reserved

Table 10
JAPAN AND ITS MAJOR TELECOMI~NICATiON CORRESPONDENTS (1986)
Destination
Outgoing Market M~’I’I" in Share M~]~ons * ~
U.S. 80 25.1 Canada 4 1.3
Korea 41 12.7 Taiwan 35 11.0 Hong Kong 28 8.8 Singapore 16 5.1
U.K. 18 5.6 Germany(FR) 11 3.5 France 5 1.4 Italy 4 1.2
Total Above 242 75.8 Total Japan 319 100
*MKT is Minutes of TelecommurPJtions Traffic. Data are for international lxtblic v~ce circuits
© lnternaf~al lnslitute of Communicaltons 1989 Mriehtsreserved

Table 11
CANADA AND ITS MAJOR TELECOMMUNICA11ON CORRESPONDENTS (1986)
Destination
Incoming and Outgoing Market MiTT in Share
Millions* ~
U.S. 1823 82.6 U.K. 100 4.5 Germany 29 1.3 France 24 1.1 Italy 24 1.1
Hong Kong 16 O. 7 Netherlands 12 0.5 Australia 11 O. 5 Greece 10 0.4 Japan 9 0.4
Switzerland 9 0.4
TotalAbove 2067 93.7 Total Canada 2207 100.0
*MiTT is Minutes of Telecommunication Traffic. Data am for intemational pubfic voice circuits only.
© Internalionallnstib~te of Communications 1989 All rights reserved

We offer the following additional comments on the bilateral telecommunication traffic flows detailed in Tables 5 to 11:
The United States
** America’s international telecom markets are moving West. And South. Taiwan, South Korea, the Philippines, Colombia and the Dominican Republic are now very much part of the American tele-continent. Within the next decade, some of these countries may be more important than France and Italy for U.S.-based international telecom service providers.
** Despite the foregoing, America’s geographic neighbors are still its chief telecommunication correspondents. Approximately 35% of international traffic goes to Canada and Mexico. Other G-7 countries account for another 23% of outgoing traffic.
** Traffic statistics underscore America’s growing balance of trade deficit for telecom services during the 1980s. (Compare Tables 5b and 5c). This deficit may persist through the 1990s, despite recent tariff reductions by carriers in key correspondent countries (e.g., Japan, Germany), because the pattern of traffic deficits is so widespread.
The United Kingdom
** The U.K. international telecoms markets also looks West, Europe and 1992 notwithstanding. The Far East (or very Far West) is likewise of growing importance. In 1986, almost 25% of outgoing traffic from the U.K. went to the U.S. -- an increase in market share for this bilateral route of over 40% since 1978. During the same period, the share of U.K. traffic going to Japan rose 150%, and to Hong Kong, approximately 90%.
** Within Europe, the fastest growing markets for U.K.-based international telecom service providers are probably Spain, Portugal and Turkey.
** The growing trade imbalance experienced by U.S. telecom carriers (e.g., an excess of outgoing over incoming traffic on almost all routes) does not appear to be replicated by the U.K. As of 1987, aggregate incoming and outgoing traffic for the U.K. appears to be approximately in balance.
Javan
** Japan looks first to Asia and then to the U.S. Approximately 50% of outgoing traffic is directed to Australasia; about 25% to North America. The relatively small share of Japanese traffic which is routed to Europe -- small compared to the number of European exchange lines and size of Japanese foreign investment in Europe -- suggests that the Europe-Japan route may be more significant in the future.11
** Japan’s close ties with Pacific states and the extraordinary growth in telecom traffic being generated by Asia’s Newly Industrialized Countries (NICs) -- Taiwan, South Korea, Hong Kong, Singapore, -- will exert a powerful influence on future traffic flows. International services between Japan and the NICs (and among the NICs) potentially offer some of the richest prizes for service providers.12 Liberalization of international telecom service conditions in these markets thus can be expected to become an important trade issue.
23

Fur[her CQmments
** The Euro-centric international telecom traffic patterns of Germany, France and Italy are in marked contrast to the U.K. The average market share of outgoing U.S. traffic for these countries is about 7%; for the U.K. it is almost 25%. The strong continental telecom linkages of Germany, France and Italy are only likely to be intensified with the completion of the European Community’s internal market.
** The bilateral traffic links surveyed here tend to divide the G-7 countries into two blocs. One bloc is composed of the U.S., Canada, Japan and the U.K.; the other bloc comprises Germany, France and Italy. These, tele-blocs have a strong regulatory correlate. The first bloc generally has moved most rapidly toward liberalization; countries in the second bloc are in a more ambiguous position.
Traffic linkages may thus provide a useful shorthand for analyzing the direction of future regulatory changes and hence market opportunities. One recent American observer put it this way: "[T]he structure of the world information economy is being determined by traffic rather than policy."13
24

IV. The Chanaine Demand For International Telecommunication Services: Business Cycles, Trove! And Financial Markets
The traffic tables presented in Part III summarize the major international telecom flows of the 1980s. In Part IV we will comment briefly on some of the underlying demand factors which, in combination, are responsible for the traffic patterns tabulated in Part III.
It is beyond the scope of this report to provide a rigorous analysis of the changing structure of demand for particular telecom services (and routes) over time. Most major international service providers already have reason.ably sophisticated traffic forecasting models which are re-evaluated as market conditions change.14 But, some readers may be interested in a short description of new evidence -- developed during the course of the IIC’s recent study of telecom traffic statistics -- regarding three factors which affect the demand structure for international telecom services.
We start with the general business cycle.
A. The Business Cycle
The demand for international telecom service has grown at least two or three times as fast as that of most G-7 country economies since the 1970s.15 The rate of increase in the demand for international services nevertheless generally fluctuates according to the business cycle in the country where the telecommunication originates. The cyclical growth pattern of international telecom traffic was confirmed by the IIC’s recent study.16
The study involved, among other things, a statistical analysis of monthly year-on-year changes in international public voice circuit MiTT for the U.K., the U.S. and Singapore. Monthly MiTT statistics were compared with changes in coincident and leading economic indicators in each country. The study found that aggregate outgoing voice circuit MiTT was a fairly good tracking indicator for the general business cycle.
of research cyclical fluctuations in the demand This IIC study underscores the findings ea.rlier on for international telecommunication services.17 This research demonstrated that changes in the leading indicator in the country where telecommunication originates can assist international telecom service providers in anticipating medium to long-term telecom flows and thus cyclical revenue changes.
By adapting the lessons of these studies to their own conditions, we believe telecom service providers may be able to better target their marketing and revenue goals in the 1990s.
B. International Travel
Cyclical changes in the aggregate demand for international telecommunication services are themselves affected by structural changes in the economy. These structural changes (e.g., the relative balance between manufacturing and services exports) may significantly affect the various components of telecom demand during the business cycle. Indeed, the effect of such structural changes may, in some cases, be more important than the business cycle in accounting for changes in demand.
25

One important component of the telecom service market is the changing demand for service generated by international travel. The last decade has seen a growth in the volume of short-term international travelers from major industrialized countries that, for most countries, exceeds the growth rate for international trade in goods and services. 18 These trends have prompted several major international carriers to try to follow their best customers to foreign destinations. Home country direct-calling schemes (i.e., calls routed vi~l a home country operator) and multi-country telecommunication credit cards are but two manifestations of this trend. Our studies of the linkages between MiTT and tourism suggest these kinds of business activities will yield increasing dividends.
To test the impact which international travel may have on the volume of voice circuit MITT, we analyzed 1986 data on short-term arrivals to, and international outgoing MiTT from four G-7 countries: the U.S., the U.K., Canada and France. The analysis of these two factors -- MiTT and travel -- employed standard statistical regression techniques to look at the relationship between bilateral flows (e.g., Dutch travelers to the U.S. and outward U.S. telephone traffic to the Netherlands).
The analysis indicated that at least 87% of the cross-country variability in MiTT could be accounted for by international travelers; we found that only 3% could be accounted for by general trade flows.
The positive correlation between the volume of international MiTT and foreign travel found in our study further suggests that a doubling of foreign arrivals from the OECD countries included in the study would increase outward MiTT from the four target countries by roughly 85%. This average disguises significant individual country differences. Canadian and British outgoing MiTT were found to be most sensitive to inflows of foreign travelers. Only a very marginal increase in outward French MiTT is implied by our study.
We caution that the foregoing analysis focuses on a small subset of bilateral markets for only one year. Nevertheless, because international tourism and business travel have experienced very high growth rates in the 1980s, especially for certain G-7 countries (Japan, Germany), we believe this area deserves sustained attention by international telecom service providers.
C. Financial Market Activity
Structural changes in the economy during the last decade have also given the financial services sector a larger role in most G-7 economies. At the same time, the financial and securities industries have become more telecom intensive; the adoption of advanced data processing and telecommunications facilities is now considered essential to the competitive strategy of most firms in the industry.
Much of the telecom traffic for this sector flows down leased-line circuits within and between financial institutions. Yet the trading of securities is still overwhelmingly dependent upon the public switched telephone network. Dealers may receive market information on screens linked to leased-lines, however, final buy and sell decisions from customers (both wholesale and retail) are generally transmitted to dealers over the public telephone network.
But how large is the impact of securities trading on the aggregate demand for public voice circuit traffic.9 To provide a preliminary answer, we examined the relationship between trading volumes on the New York Stock Exchange (NYSE) and interexchange voice telephone circuit MiTT in the U.S. We chose these two measures as proxies of national telecom flows and national financial activity. Data reviewed were for the period April 1985 to August 1988. Once again, standard statistical regression techniques were used to analyze the relationship between the two variables under study.
26

The study found that trading volumes do appear to have a measurable impact on the demand for telecom traffic. Specifically, we found that by taking into account the volume of trading activity on the NYSE, it was possible to account for significantly more of the monthly year-on-year changes in interexchange telephone traffic than was possible from using past traffic statistics alone. In addition, our analysis suggests that a doubling of the rate of growth in trading volume on the NYSE may lead to an increase of approximately 4% in the rate of growth of interexchange MiTT (i.e., if aggregate interexchange MiTT was growing at 10% per year, the doubling of activity in financial markets will boost this rate by 4% to 10.4%). The study found that this relationship was dynamic, however, and increased over time; the correlation of trading activity and MiTT was significantly greater during 1987 and 1988 than during the prior two years.
The apparent linkages in the U.S. between the volume of activity in the securities markets and telecommunications traffic is probably indicative of international trends. This may be particularly true of the so-called financial triad: Tokyo - London - New York. The growing traffic linkages between Japan, the U.K. and the U.S., tabulated in Part III, are consistent with this thesis. Thus, as with international travel, we believe that closer attention to this important component of the demand for international telecom service will be a priority for companies seeking to compete effectively in the 1990s.
- END-

A~Dendix A
METHODOLOGY AND SOURCE~
The telecommunication traffic statistics in this report were derived from over 40 different sources. They include the annual reports of carriers, government statistical digests, reports of telecommunication regulatory authorities, company interviews and unpublished data made available by service providers.
The report also draws upon data in: the International Telecommunication Union Yearbook Of ~ (ITU, Geneva, 1988); the Siemens Company’s International Fernsorechstati~tik (Siemens, Munich, 1988) and The World’s Telephones (AT&T, Indianapolis, IN., 1988).
The world MiTT totals used in Tables 1 to 3 are based on data from over 165 countries on domestic and international outgoing voice circuit traffic. Unless otherwise stated, carrier traffic statistics do not include traffic from foreign subsidiaries or investments.
All traffic statistics have been compiled using a common accounting unit known as MiTT -- Minutes of Telecommunication Traffic. As used here, MiTT generally refers to paid minutes of public voice circuit traffic. Depending upon national conditions, therefore, MiTT may include voice and non-voice (e.g., facsimile, slow speed data) traffic. The MiTT statistics in this report do not include traffic on mobile systems.
Traffic data compiled in calls or pulses for certain countries and service providers have been converted to MiTT based upon average pulse and call lengths, exchange lines in service, and national calling patterns. Similarly, MiTT has been estimated for countries where traffic data was found to be incomplete.
Actual MiTT data for calendar years have been used wherever possible. In a few cases (e.g., U.K., Japan) MiTT is based upon fiscal year data. Where MiTT has been estimated and data on call lengths were unavailable, this study assumes an average national call length for domestic traffic of 3 minutes; average domestic call lengths were assumed to be approximately 60% of average international call lengths. These averages generally accord with the experience for most Western European countries in the 1980s. See for example, M.E. McDowall, "International Comparisons Of Telephone Charges", Of tel Working Paper No.2 (Of tel, London, 1987).
However, average domestic call lengths in North America are known to be approximately 5 minutes with proportionately longer average international call lengths. Average domestic call lengths in Japan are about 2.7 minutes. Average domestic call lengths in some developing countries are known to be well below 2 minutes due to the significant percenta[ge of calls which are broken off after an initial connection is made.
In view of the foregoing, some care must be taken in interpreting the MiTT data in Tables 1 to 3. For example, because (a) average domestic call lengths for the U.S. and Canada are approximately 1.7 times those in Western Europe; and (b) telephone subscribers in these countries tend, on average, to make approximately three times the number of domestic calls per exchange access line as their Western European counterparts, the MiTT totals for domestic telecom carriers serving these countries are high in comparison to other carriers serving populations of comparable size.
28

Conversely, because average domestic call lengths for carriers in Asia and many developing countries may be below 3 minutes, the estimated contribution of these countries’ telecom traffic to the world MiTT total reported in Part III may be slightly overstated. Notwithstanding the country-to-country variability in average MiTT per exchange line, the authors believe that the global MiTT estimate used in Part III. is probably accurate plus or minus 25%.
The international bilateral data for the G-7 countries reported in Tables 4 to 11 refer to 1986 MiTT and are for outgoing public voice circuit traffic unless otherwise stated. The authors believe that the figures presented in these tables are accurate to within a few percent because, with minor exceptions, they are derived directly from data furnished by the relevant service providers.
Market shares are calculated as a proportion of the international and total world market MITT. These shares and the corresponding MiTT values are presented as point estimates in the tables; the range of estimation variability discussed above should be taken into account when analyzing any particular number in a table.
29

ENDNOTE$
Gregory C. Staple is a communications lawyer and consultant living in Washington, D.C. He was formerly Director of Projects at the IIC in London and now serves as Director of the IIC Telecommunications Forum. Prior to joining the IIC, Mr. Staple practiced law with the Washington, D.C. firms of Koteen & Naftalin and Nixon, Hargrave, Devans & Doyle. He is a graduate of the University of Michigan Law School.
Mark Mullins holds a Masters degree in economics from the University of Western Ontario. He is currently a PhD candidate in economics at the London School of Economics (LSE) where he works with the Financial Markets Group. He was one of the 1988 winners of the prestigious Amex Bank Review prizes for his paper on the linkages between international economic policies and the 1987 stock market crash.
Our estimate of the size of the world market for international telecommunications traffic is based upon a 165 country analysis of the demand for public voice traffic. Based upon this study, we estimate that the global volume of traffic (domestic plus international) carried on public voice circuits will exceed 4,400 billion minutes in 1989 -- equal, on average, to nearly a full business day on the telephone for each of the world’s approximately 500 million subscribers. The methodology and data sources used in this analysis are described in Appendix A.
See Gregory C. Staple and Mark Mullins, "Telecom Traffic Statistics - MiTT Matter", Telecommunications Policy, Volume 14, No. 2, June 1989, pp. 105-128.
Article 9 of the ITU International Telecommunication Regulations (Melbourne, 1988), to come into force on 1 July, 1990, provides inter alia: ~Pursuant to Article 31 of the International Telecommunication Convention (Nairobi, 1982), special arrangements may be entered into on telecommunication matters which do not concern Members in general. Subject to national laws, [1TU] Members may allow administrations or other organizations or persons to enter into such special mutual arrangements with Members, administrations or other organizations or persons that are so allowed in another country for the establishment, operation and use of special telecommunication networks, systems and services, in order to meet specialized international telecommunication needs within and/or between the territories of the Members concerned, and including, as necessary, those financial, technical, or operating conditions to be observed."
See generally Brian Winston, Misunderstanding Media, (Routledge & Kegan Paul, London, 1986).
Historically, east-west traffic in Canada was routed over AT&T lines in the U.S. The TransCanada Telephone System, now Telecom Canada, was established in 1931 to ensure that Canada-Canada services would be routed over Canadian facilities. See Robert R. Bruce, Jeffrey P. Cunard and Mark Director, From Tel¢communicati0ns TO Electronic Services, (Butterworths, London, 1985) p..334.
See Joan M. Feldman, "The Dilemma Of ’Open Skies’", The New York Times Magazine, 2 April 1989, pp.31-33, 6~.
These requirements generally track the D-Series Recommendations of the ITU’s International Telegraph and Telephone Consultative Committee (CCITT).
3O

o
10.
For example, the U.K. company, Cable and Wireless. (C&W), is the principal stockholder in the Hong Kong Telephone Company. It also owns Mercury Communications, which provides competitive domestic and international services in the U.K.; offers interexchange services, through, subsidiaries, in the United States; has a 18% interest, approximately, in International Digital Communications Inc. (IDC), a new Type I!i’~apanese international carrier; and an investment share in the International Telecommunications Satellite Organization (Intelsat). See Cable and Wireless vie Revert and Accounts 191~8.
Pacific Telesis, one of the seven American Regional Bell Operating Companies (RBOCs) has been authorized to acquire a 10% share in IDC. See Financial Times, 15 February 1989, p.6. British Telecom (BT), which is still 48.9% owned by the U.K. government, owns a 2% share in International Telecom Japan Inc., another new Type i) Japanese international carrier. BT has also agreed to acquire approximately 22% of McCaw Communications, an American company which provides cellular mobile telephone service throughout much of the United States. See Financial Times, 20 January, 1989, p.l.
To date, only two countries (the U.S. and the U.K.) have significant experience with facilities based competition. Japan’s new Type I~ international carriers only began service within the last year. The experience in the U.S. and U.K. is summarized below:
Market Share of International Out~oin~ Voice Circuit Traffic
United States
AT&T MCI GTE
1985 98.4 1.2 0.4 1986 94.3 4.0 1.6 1987 92.8 4.7 2.3
United Kimzdom
BT Mercury
1986 99.9 0.1 1988 97.6 2.4
11.
12.
For example, the proportion of Japanese overseas investment in Europe, relative to the international total, grew from 10 to 15% between 1980 and 1986, a greater rate of increase than that for North America. A detailed review of the impact of trade and investment flows on Japanese demand for international communications services can be found in the Communic~ttion~ White P~Pcr, (Ministry of Posts and Telecommunications, Tokyo, 1988) pp.27- 42.
Significantly, South Korea, Hong Kong, Taiwan and Singapore are among the first nine countries to which International Telecom Japan Inc. will provide service during its first year of operation. International Digital Communications has also targeted Singapore and Hong Kong for its start-up year. See C0mmunication~ Wgok Intgrnati0nal, 17 April 1989, p.20.
13. Steward Brand, The Media Lab. (Penguin Books, London, 1988) p.249.

14. Readers interested in telecommunication traffic forecasting models might wish to consult the following standard text: Lester D. Taylor, Telecommunications Demand: A Survey and Critiaue, (Ballinger, Cambridge, 1980). A good review of the application of traffic forecasting work to the international telecommunication industry can be found in Denzil G. Fiebig and Ronald Bewley, "International Telecommunications Forecasting: An Investigation Of Alternative Functional Forms~, At~vlied Economics, Vol. 19, pp.949-960 (1987).
15. See e.g., The Telecommunications Industry: The Challenge Of Structural Change, (OECD, Paris, 1988).
16. See reference 3, pp.l16-120.
17. See e.g., Allan P. Layton, Loraine V. Defris and Ben Zehnwirth, "An International Comparison Of Economic Leading Indicators Of Telecommunications Traffic", International Journal 0f Forecastintt, No.2, 1986, pp.413-425.
18. See E. Philip English The Great E~¢al3o? An Examination of North-South Tourism (The North-South Institute, Ottawa, 1987), p.6.
32