global sukuk: the road ahead
TRANSCRIPT

GLOBAL SUKUK: The Road AheadMohieddine Kronfol - CIO Global Sukuk & MENA Fixed Income
NASDAQ EXECUTIVE BRIEFING

We are a global investment manager
42RESEARCH
LOCATIONS
12TRADING
LOCATIONS
34COUNTRIES
WITH OFFICES
Shareholders in
over 170 countries1
Local asset
management
capabilities in
15 regions
1
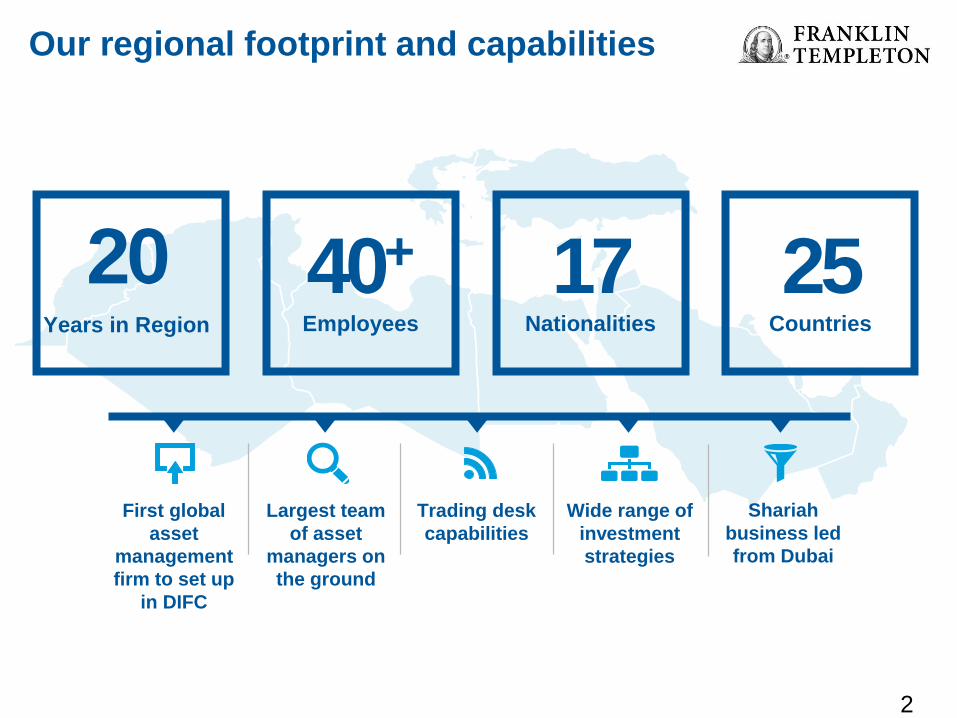
17Nationalities
Our regional footprint and capabilities
20Years in Region
40+Employees
25Countries
First global
asset
management
firm to set up
in DIFC
Largest team
of asset
managers on
the ground
Trading desk
capabilities
Wide range of
investment
strategies
Shariah
business led
from Dubai
2

• Section 1: global sukuk growth story
• Section 2: asset class characteristics
• Section 3: current debates shaping the industry
• Section 4: what we’re thinking about markets in 2019
Agenda
3

GROWTH Section 1

Over US$477 Billion to DateAs of 31 December 2018
$0
$10,000
$20,000
$30,000
$40,000
$50,000
$60,000
2000 2001 2002 2003 2004 2005 2006 2007 2008 2009 2010 2011 2012 2013 2014 2015 2016 2017 2018
US
$ M
illio
n
GCC Asia Other
Exponential Growth in Annual Global
Sukuk Issuance
Source: Bloomberg LP as of 31 December 2018. Data excludes short-term issuance.
The Global Sukuk
market has grown at
24% CAGR since
2000
Islamic finance
continues to grow
and supports
demand for Sukuk
and Sharia
compliant financial
ecosystem
5

As of 31 December 2018
76881001201511712222502682775001,0001,8642,1662,1973,6944,7175,7396,146
12,27714,374
19,61322,294
57,21563,012
184,945
0 30,000 60,000 90,000 120,000 150,000 180,000
KazakhstanGuernsey
JapanJordanIrelandChina
FranceCôte d'IvoireLuxembourg
NigeriaSouth Africa
United States of…Kuwait
SingaporeUnited Kingdom
Hong KongPakistan
OmanBahrain
QatarTurkey
IndonesiaSupranational
United Arab EmiratesSaudi Arabia
Malaysia
… by Country (USD Millions)
2,484
29,098
52,092
55,181
76,807
85,288
102,528
0 20,000 40,000 60,000 80,000 100,000 120,000
Sukuk Al Istisna'a
Sukuk Al Mudarabah
Sukuk Al Musharakah
Other
Sukuk Al-Wakala
Sukuk Al Ijara
Sukuk Al Murabaha
… by Structure (USD Millions)
… by Currency (USD Millions)
Growing Global Sukuk Market
Increasingly Diversified…
64
6,071
6,741
10,372
11,306
17,508
25,532
40,170
46,918
109,475
129,319
0 20,000 40,000 60,000 80,000 100,000 120,000 140,000
Technology
Diversified
Basic Materials
Energy
Communications
Consumer, Cyclical
Consumer, Non-cyclical
Industrial
Utilities
Government
Financial
… by Sector (USD Millions)
1618521202362502775401,0511,7172,6512,6792,7133,0585,691
40,071170,192172,145
0 40,000 80,000 120,000 160,000 200,000
Australian DollarJapanese Yen
Hong Kong DollarJordanian Dinar
Chinese Yuan RenminbiWest African CFA
Nigerian NaraBritish Pound
Oman RialPakistani Rupee
Indonesian RupiahSingaporean Dollar
Turkey LiraEuro
UAE DirhamSaudi RiyalU.S. Dollar
Malaysian Ringgit
6Source: Bloomberg as of 31 December 2018.

0
5
10
15
20
25
30
2008 2009 2010 2011 2012 2013 2014 2015 2016 2017 2018
GCC Asia Other
Number of Issues over US$500 MillionAs of 31 December 2018
0
2
4
6
8
10
12
14
2008 2009 2010 2011 2012 2013 2014 2015 2016 2017 2018
GCC Asia Other
Global Sukuk Issues Are Increasingly
Larger, Listed and Liquid
Number of Issues over US$1 BillionAs of 31 December 2018
Annual Global Sukuk Issuance
Source: Bloomberg LP as of 31 December 2018. Data excludes short-term issuance.
Annual Global Sukuk Issuance
7

Bank of America Merril Lynch, The Hitchhiker’s Guide to the Investment Universe, 14 June 2018, FT Internal
The Global Context
2018 Global Debt Securities – USD 100 Trillion
27.4
8.8
7.5
2.10.5
4.5
Government Investment Grade
Collateralized High Yield
Sukuk Other
2018 Benchmarked Securities – USD 51 Trillion
We estimate global
sukuk outstanding to
exceed $2.7 trillion
by 2030, growing at
15% CAGR
▪ This compares to a CAGR of
24% between 2000-2017.
▪ Global debt grows
approximately 2.5X every
decade.
▪ Global Debt totalled $13 tn
in 1990, $33 tn in 2000 and
$84 tn in 2010
8

Sources: IFSB Stability Report 2018 and BCG, Global Asset Management 2018
Islamic Funds AUM US$ 67 Billion in 1,161 Funds
Shariah Compliant Funds
▪ Global AUM – US$ 80 Trillion. Global
Penetration 40%.
▪ Islamic Funds are less than 0.2% of
fund industry ($33 trillion)
▪ 35% of Islamic funds focus on global
investing total AUM ($32 billion).
▪ Average size of active funds is $80
million (vs $394 million among
conventional funds).
▪ Size and scale remain an issue. 341
funds, 29% of funds, are inactive ($5
billion in assets)
Fixed Income/Sukuk,
10%
Mixed Allocation,
7%
Real Estate,
1%
Equity , 42%
Commodity , 14%
Money Market , 26%
9

2030 AuM Projections - $175 Billion Market
Global Sukuk AUM:
$150 billion
▪ Less than 6% of Sukuk securities
▪ 2018 ratio of Sukuk AUM to Sukuk Securities is 1.5%
▪ Projected growth of 27% - in line with actual FT Sukuk AUM growth 2011-2018
Global Sukuk Retail Funds AUM:
$25 billion
▪ 1/6th of Sukuk AUM, in line with current actual retail/institutional ratios
▪ Assumes modest growth of Islamic Funds to $125 billion (5% CAGR) – with Fixed Income 20% of total, in line with current European 26% and US 21% shares of fixed income Mutual Fund assets.
Source: Bank of America Merril Lynch, Islamic Financial Services Board (IFSB) , Boston Consulting Group, FT Internal
10

INVESTMENT
RATIONALESection 2

FactSet. Important data provider notices and terms available at www.franklintempletondatasources.com. (Global Sukuk is represented by the S&P Dow Jones Sukuk (USD) Index; Shariah Equities are represented by the MSCI AC World Islamic Index).
See Important Disclosures slide for additional information.
Past performance is not an indicator or a guarantee of future performance.
Basic Building Block of a Shariah-
Compliant Asset Allocation
12

Global Sukuk Have Low Correlation to
Oil and Other Major Asset Classes
13

Global Sukuk Index vs. Emerging Markets Bond and Global Bond Indexes, Risk vs. Return
3-Year Period Ended 31 December 2018
Global Sukuk Index Returns Have Strong
Risk/Return Profile versus EM and Global
Bonds
-2%
0%
2%
4%
6%
8%
10%
1% 2% 3% 4% 5% 6% 7% 8% 9% 10% 11% 12%
Ave
rag
e A
nn
ual
To
tal R
etu
rn
Annualised Standard Deviation (Risk)
Emerging Markets
Bond Index
Global
Sukuk IndexGlobal
Bond Index
Source: © 2019 Morningstar. All Rights Reserved. The information contained herein: (1) is proprietary to Morningstar and/or its content providers; (2) may not be copied or distributed; and (3) is not warranted to be accurate, complete or timely. Neither Morningstar nor its content providers are responsible for any damages or losses arising from any use of this information. Sukuk Bonds are represented by the Dow Jones Sukuk Index; Emerging Markets Bonds are represented by the JP Morgan EMBI Plus Index; Global Bonds are represented by the JP Morgan Global Government Bond Index. Indexes are unmanaged, and one cannot invest directly in an index. They do not reflect any fees, expenses or sales charges. Important data provider notices and terms available at www.franklintempletondatasources.com.
Past performance is not an indicator or a guarantee of future performance.
Global Equity
Index
14

Global Sukuk Have Provided Downside
Protection
-20.0
-18.0
-16.0
-14.0
-12.0
-10.0
-8.0
-6.0
-4.0
-2.0
0.0
Jan-
09
Aug
-09
Mar
-10
Oct
-10
May
-11
Dec
-11
Jul-1
2
Feb
-13
Sep
-13
Apr
-14
Nov
-14
Jun-
15
Jan-
16
Aug
-16
Mar
-17
Oct
-17
May
-18
Dec
-18
Bloomberg Barclays Global Aggregate Bloomberg Barclays US Aggregate Bloomberg Barclays Euro Aggregate
JP Morgan EMBI + Dow Jones Sukuk
Apart from the Global Financial Crisis, Global Sukuk Have Experienced Less Downside Risk Compared to Major Global Fixed
Income Benchmarks Over the Past 10 Years
Drawdown1/2009 to 12/2018
15

CURRENT DEBATESSection 3

StandardsCost disadvantage
Minimum thresholds
Structure transparency
Governance SPV Reporting
Legal frameworks
Regulators
ESG Integration
Capital Markets
Sukuk are mainstream
GCC important part of EM
Risk Management Tools
Technology
Important Matters
17

“Ideal Ratings has been
working closely with FT over
the years to establish the
FT Rulebook, a
sophisticated, advanced
and detailed Sharia
standard that covers the
different markets globally”
Mohamed Donia, CEO Ideal
Ratings
FT/Ideal Ratings Sukuk Rule Book
• Screens over 150 Sharia standards, general and
structure specific
• Has mandatory and non-mandatory standards
• Produces a Sharia Compliance Score for each Sukuk
• Applies the same standards objectively across global
Sukuk markets – increasing transparency and facilitating
standardization
• Reduces Sharia Compliance risks
• Enhances Institutional product offering
• Provides insights for ESG and Impact analysis
Increased Standardization,
Transparency and Governance Around
Structures
18

Franklin Templeton - Environmental, Social and Governance (ESG)
Portfolio Construction & Management
Investment Research & Analysis
Investment Portfolios
Dedicated ESG TeamTrack trends and share
industry best practices
with investment teams
Independent
Risk ManagementIntegrate ESG analytics
into fund reviews and
risk reports
Educate and engage to
understand the impact and scope
of ESG considerations and
consult on emerging ESG issues
Evaluate ESG-related research
practices and identify
opportunities to refine and
deepen insights
Enhance analysis by
incorporating independent,
unbiased ESG research
and analytics
19

Sukuk More Mainstream
20
Source: JP Morgan – February 2019.
0%
1%
2%
3%
4%
5%
JPM CEMBI JPM EMBI JPM JACI
Sukuk Weights in Indexes
2.14
13.88
0
17.25
0%
10%
20%
30%
40%
50%
60%
70%
80%
90%
100%
2018 Pro Forma 2018 Pro Forma
GCC Weight in JP Morgan Index
GCC Asia Europe Latam Africa
EMBI Global EMBI Global IG

Technology to Drive Our Business
Investment Management Data
ScienceStrategic Investment Pool Rapid Development Process
Building data science
capabilities to drive
investment out-performance
Invest in companies that
can be complementary or
disruptive
Launch vertical disruptors to
build and test our own
technologies rapidly
3-Pronged Approach to Fintech
Be a leader in leveraging technology to improve our business and outcomes for investors
Most recent investments: Random Forest Capital, Sandbox, Bambu, Advizr,
Agolo, Otonomos, MyWish, IEX
21
MARKET OUTLOOKSection 4
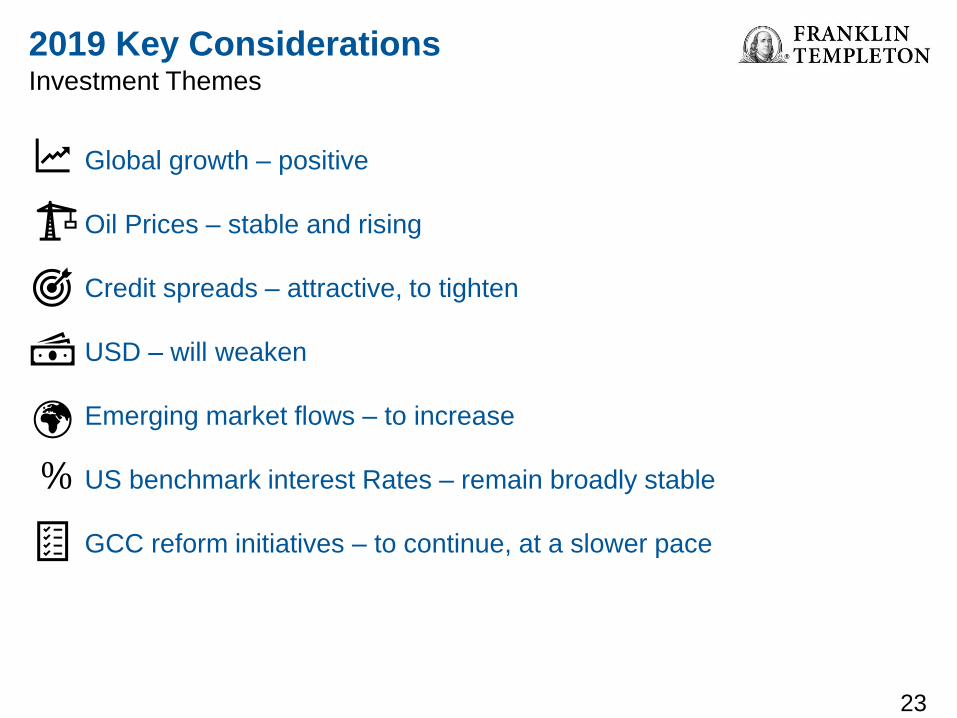
Global growth – positive
Oil Prices – stable and rising
Credit spreads – attractive, to tighten
USD – will weaken
Emerging market flows – to increase
US benchmark interest Rates – remain broadly stable
GCC reform initiatives – to continue, at a slower pace
2019 Key ConsiderationsInvestment Themes
%
23

Important Information
This document is intended to be of general interest only and does not constitute legal or tax advice nor is it an offer for shares or an invitation to apply for shares of any Franklin Templeton Investment fund. Nothing in this document should be construed as investment advice. Given the rapidly changing market environment,
Franklin Templeton Investments disclaims responsibility for updating this material.
Data from third party sources may have been used in its preparation and Franklin Templeton has not independently verified, validated or audited such data.
Franklin Templeton Investments shall not be liable to any user of this document or to any other person or entity for the inaccuracy of information or any errors or omissions in its contents, regardless of the cause of such inaccuracy, error or omission.
A copy of the latest prospectus, the annual report and semi-annual report, if published thereafter can be found on our website: www.franklintempletongem.com or can be obtained, free of charge, from the address below.
Issued by Franklin Templeton Investments (ME) Limited, authorized and regulated by the Dubai Financial Services Authority.
Dubai office: Franklin Templeton Investments, The Gate, East Wing, Level 2, Dubai International Financial Centre, P.O. Box 506613, Dubai, U.A.E., Tel.: +9714-
4284100 Fax:+9714-4284140.
Copyright © 2019 Franklin Templeton Investments. All rights reserved.
24