global statistics from the international union of marine ...euroland united kingdom brazil china...
TRANSCRIPT

1
© 2012 The Actuarial Profession www.actuaries.org.uk
GIRO Conference and Exhibition 2012 Juggling uncertainty the actuary’s part to play
Wednesday 19th September 2012
GIRO Conference and Exhibition 2012
Global Statistics from the International
Union of Marine Insurance Facts and
Figures Committee
Darren Farr, R&Q / Skuld 1897
© 2011 The Actuarial Profession
www.actuaries.org.uk

2
3
This is about Marine Insurance, so there will be none of this ….
4
… those these gals are okay!

3
5
AGENDA
IUMI and the Facts and Figures Committee
Report on World Merchant Fleet and World Trade
Global Marine Insurance Report
6
International Union of Marine Insurance (IUMI)
o Founded in 1874.
o A professional NGO run by and for its members.
o Members are:
• national insurance associations;
• marine insurance associations; and
• marine professionals.
o Provides an important forum to discuss and exchange ideas of
common interest to marine (re)insurers.
o Enables views and ideas on matters of marine (re)insurance to be
disseminated to all interested parties – including NGOs, IGOs, and the
shipping industry.
o Dedicated to maintain and expand international trade.
4
7
IUMI Facts & Figures Committee
o Created in 2002.
o Provides IUMI with
• updated shipping and marine insurance key data and statistics;
• and an overview of trends in these industries.
o Provide marine insurers with risk data to improve the decision making
processes in risk pricing and risk transfer.
o Industry reports are presented twice a year:
• In September (at the annual IUMI Conference) and in March.
o As well as Casualty and Exposure statistics produce:
• Global Marine Insurance Report
• Global Shipping Market Trends
• Ship Repair Cost Index
8
The following presentations are abridged versions
presented yesterday at the IUMI Conference in San Diego….
…where it’s 30oC and
… but they don’t have

5
Report on World Merchant Fleet and World Trade (abridged)
9
Facts & Figures Country data collection 2012 – 2011 Premium
10
Premium volume of all countries covered in 2011: 31.9 billion USD
6
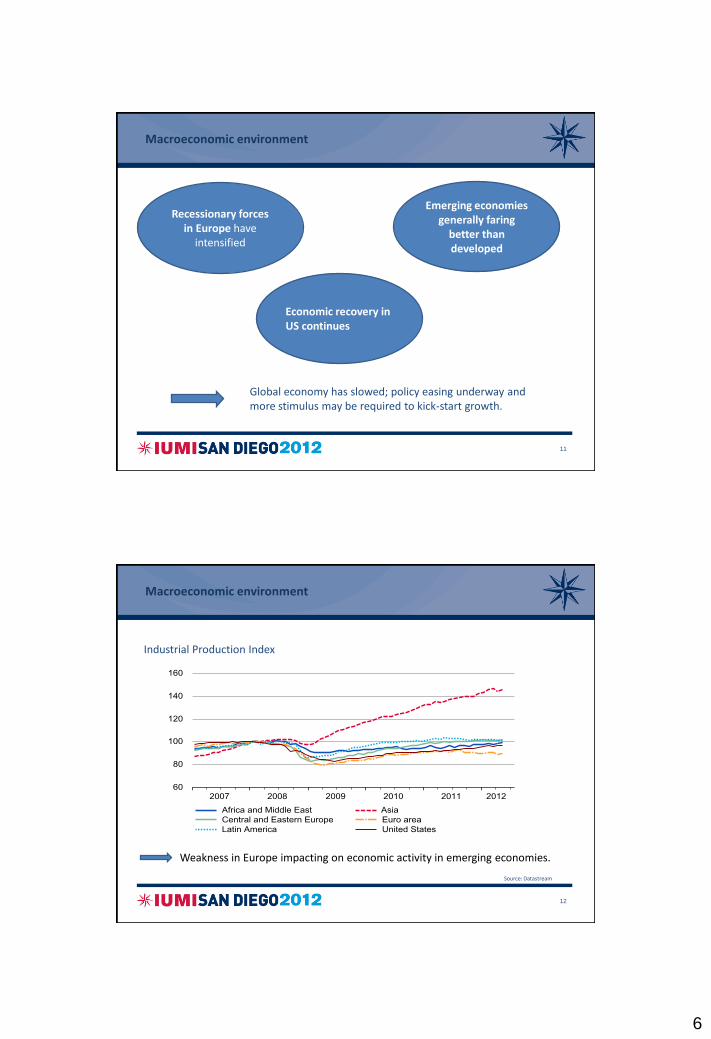
Macroeconomic environment
11
Global economy has slowed; policy easing underway and more stimulus may be required to kick-start growth.
Recessionary forces in Europe have
intensified
Emerging economies generally faring
better than developed
Economic recovery in US continues
Macroeconomic environment
Industrial Production Index
12
Weakness in Europe impacting on economic activity in emerging economies.
Source: Datastream

7
Macroeconomic environment
Real GDP growth rates by region (forecasts)
13
-8%
-6%
-4%
-2%
0%
2%
4%
6%
8%
10%
12%
2009 2010 2011 2012 2013 2014
Real GDP growth
United States
Euroland
United Kingdom
Japan
South & East Asia
World
Brazil
China
India
Pace of recovery likely to remain modest and significant near-term downside risks.
Source: Swiss Re Economic Research & Consulting
Macroeconomic environment
Inflation (CPI) forecasts
14
-4%
-2%
0%
2%
4%
6%
8%
10%
12%
14%
2009 2010 2011 2012 2013 2014
CPI inflation
United States
Euroland
United Kingdom
Japan
Brazil
China
India
Inflation likely to remain well contained (despite recent food price rises).
Source: Swiss Re Economic Research & Consulting
8
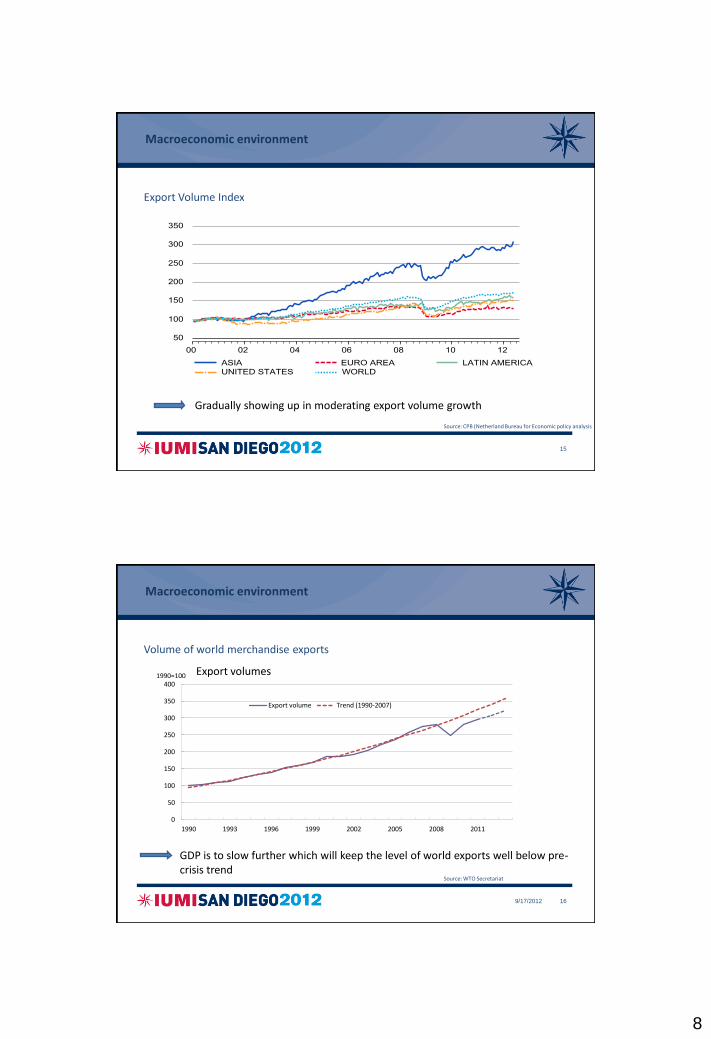
Macroeconomic environment
Export Volume Index
15
Gradually showing up in moderating export volume growth
Source: CPB (Netherland Bureau for Economic policy analysis
Macroeconomic environment
Volume of world merchandise exports
9/17/2012 16
0
50
100
150
200
250
300
350
400
1990 1993 1996 1999 2002 2005 2008 2011
Export volume Trend (1990-2007)
1990=100 Export volumes
GDP is to slow further which will keep the level of world exports well below pre-crisis trend
Source: WTO Secretariat

9
Shipping market
Fleet Capacity
17
0
4'000
8'000
12'000
16'000
20'000
24'000
28'000
32'000
36'0002
00
0
20
01
20
02
20
03
20
04
20
05
20
06
20
07
20
08
20
09
20
10
20
11
20
12
*
DW
T
0
250
500
750
1'000
1'250
1'500
1'750
2'000
2'250
No
. of V
es
se
ls
Tanker Fleet Bulkcarrier Fleet Containership/MPPs Fleets Deliveries Scrapping
*2012 data is year-to-date.
Source: Clarkson Research, August 2012
Shipping Market
Average Age of the World Fleet 2000-2012
18
10
12
14
16
18
20
22
24
26
Ja
n 0
0
Ju
l 0
0
Ja
n 0
1
Ju
l 0
1
Ja
n 0
2
Ju
l 0
2
Ja
n 0
3
Ju
l 0
3
Ja
n 0
4
Ju
l 0
4
Ja
n 0
5
Ju
l 0
5
Ja
n 0
6
Ju
l 0
6
Ja
n 0
7
Ju
l 0
7
Ja
n 0
8
Ju
l 0
8
Ja
n 0
9
Ju
l 0
9
Ja
n 1
0
Ju
l 1
0
Ja
n 1
1
Ju
l 1
1
Ja
n 1
2
Ju
l 1
2
Av
era
ge
Ag
e
Total Tanker Bulkcarrier Containership/MPP Gas Others
Source: Clarkson Research, August 2012

10
Shipping Market
Freight Rates
19
0
5000
10000
15000
20000
Jan 2008 Jul 2008 Jan 2009 Jul 2009 Jan 2010 Jul 2010 Jan 2011 Jul 2011 Jan 2012 Jul 2012
Baltic Panama Index Baltic Supramax Index Capesize
... and freight rates remain low. Source: Bloomberg
Shipping Market
20
• Freight rates are still suffering and are slightly below historical average rate due to the higher cost basis for shipowners
• Current newbuildings orderbook still suggests significant capacity to come on stream in the future even if there's a considerable uncertainty (possible cancellations and delays)
• Bulkcarriers average age dropped from approximately 14 years on January 2010 to 10.5 years on July 2012
• Vessels' demolition rate is still high compared to 2011 for both tankers and bulk carriers
• Shipping market uncertainty remains
linked to macro-economic scenario

11
Outlook for the marine insurance industry
21
weak and often negative growth
risk of inflation
low interest rate environment
further instability in the Euro zone
22
Conclusion

12
2012 Global Marine Insurance Report (abridged)
23
Global Marine Insurance Report 2012
• Cargo – market & results
• Hull – market & results (with some words on major losses...)
• Offshore Energy – market & results ____________________________________________________________
• Underlying Data – for download (Premium by country, Loss ratio triangulations)
13
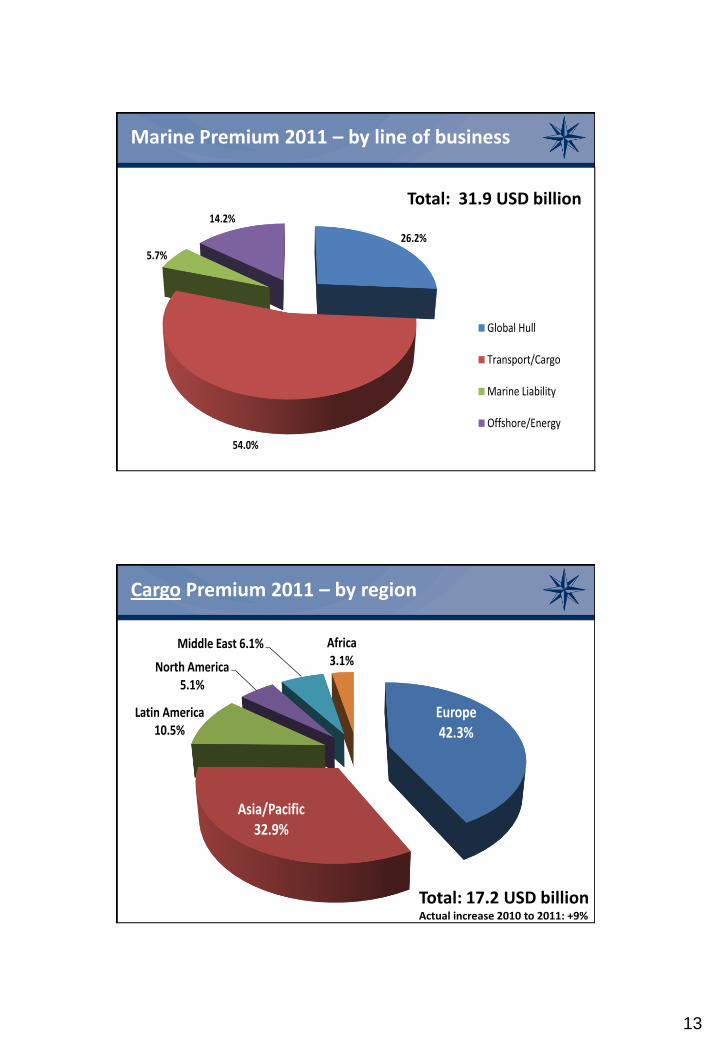
26.2%
54.0%
5.7%
14.2%
2011
Global Hull
Transport/Cargo
Marine Liability
Offshore/Energy
Marine Premium 2011 – by line of business
Total: 31.9 USD billion
Europe42.3%
Asia/Pacific 32.9%
Latin America 10.5%
North America 5.1%
Middle East 6.1% Africa3.1% 2011
Cargo Premium 2011 – by region
Total: 17.2 USD billion Actual increase 2010 to 2011: +9%

14
Belgium2.1%
Brasil4.2%
China9.0%
France5.0%
Germany7.0%
Italy2.9%
Japan11.4%
Mexico2.0%Netherlands
3.0%
Nordic2.2%
Russia2.9%
Spain1.6%
UK (IUA)2.3%
UK (Lloyds)6.8%
USA4.5%
Other markets33.1%
2011
Cargo Premium 2011 – by markets
Total: 17.2 USD billion
**
** includes proportional and facultative reinsurance
0%
20%
40%
60%
80%
100%
120%
140%
19
96
19
97
19
98
19
99
20
00
20
01
20
02
20
03
20
04
20
05
20
06
20
07
20
08
20
09
20
10
20
11
Cargo – Gross* Ultimate Loss Ratio Underwriting years 1996 to 2011 Data from: Belgium, France, Germany, NL, Italy, Spain (no update 2011), UK, USA (2010 Japan tsunami affected mainly Japanese market)
* Technical break even: gross loss ratio does not exceed 100% minus the expense ratio (usually 20%-30% acquisition cost, capital cost, management expenses)
2011: Starts high at 72%, may end at 74%. No technical profit.
Since 2007: Deterioration of results .
2002 to 2006: Gross loss ratios stayed below 60% - technical profit.
..and 2012?

15
40%
50%
60%
70%
80%
1 2 3 4 5
2004
2005
2006
2007
2008
2009
2010
2011
Cargo – Gross reported Loss Ratios Underwriting years 2004–11, as reported after 1, 2, 3, 4, 5 years
2011:
Starts high at new
maximum of 72%.
2010:
follows 2007/2008
pattern; passed 70%
2007/2008:
improved, but still at
high levels > 70%
Since 2007:
Market changes
demand adjustment
of claims reserves
=> Change in typical
pattern
Previous loss ratio level
Recent loss ratio level 2011
Summing up Cargo
2011 Premium growth reflects upswing in trade Commodity prices rising, stock throughput programs expanding (US), but economical environment remains unstable.
Increase in claims reserves – change in pattern 2007/2008 improved later, but loss ratios stay high.
2011 Loss ratio starts at new maximum of 72% Impact of Natural catastrophes (Thailand floods), more general average claims, increasing acquisition costs.
Claim cost unlikely to decrease Increased accumulation risk, moral hazard, theft frequency, natural catastrophes. Sanctions and piracy still a concern.
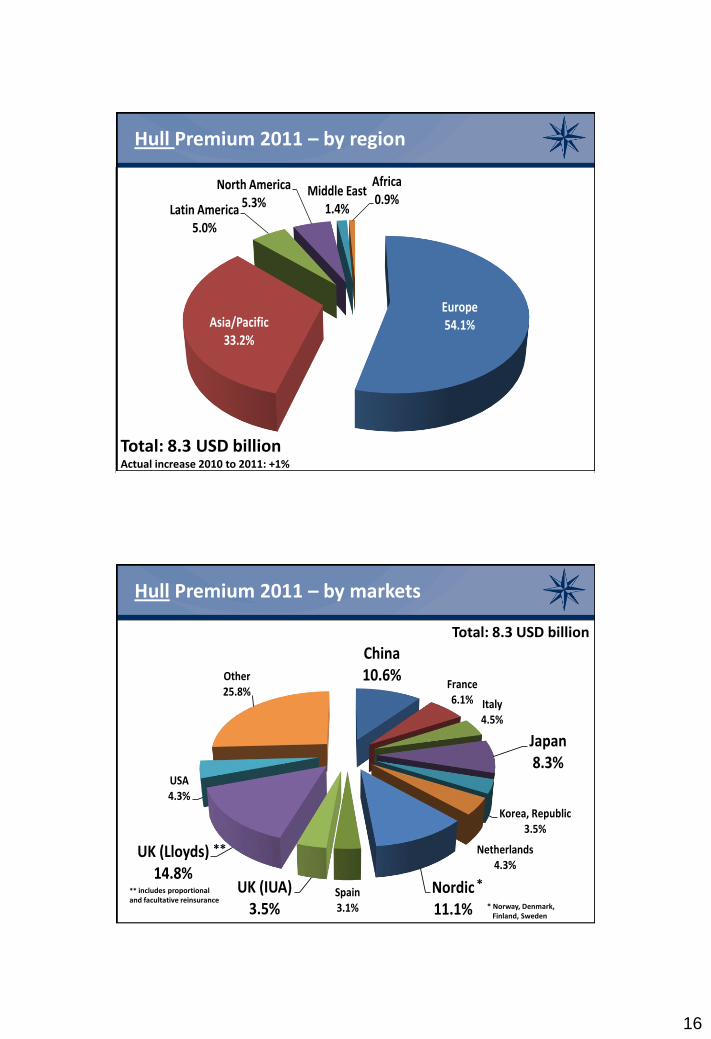
16
Europe54.1%Asia/Pacific
33.2%
Latin America5.0%
North America5.3%
Middle East1.4%
Africa0.9% 2011
Hull Premium 2011 – by region
Total: 8.3 USD billion Actual increase 2010 to 2011: +1%
China10.6%
France6.1% Italy
4.5%
Japan8.3%
Korea, Republic3.5%
Netherlands4.3%
Nordic11.1%
Spain3.1%
UK (IUA)3.5%
UK (Lloyds)14.8%
USA4.3%
Other25.8%
2011
** ** includes proportional and facultative reinsurance
Hull Premium 2011 – by markets
Total: 8.3 USD billion
*
* Norway, Denmark, Finland, Sweden

17
5.4%7.0%
2.4%
8.3%
5.4%
-14.5%
-9.2%
-3.2%
-7.3%
-20.0%
-15.0%
-10.0%
-5.0%
0.0%
5.0%
10.0%
15.0%2
00
4
200
5
200
6
200
7
200
8
200
9
201
0
2011
201
2
Average annual change in insured values on renewed vessels
Source: Cefor - Nordic Marine Insurance Statistics as of 30 June 2012
Decrease in insured values continues
Change in insured values on renewed vessels
by year of renewal
(= insured value on renewal / insured value previous year)
0%
20%
40%
60%
80%
100%
120%
140%
19
96
19
97
19
98
19
99
20
00
20
01
20
02
20
03
20
04
20
05
20
06
20
07
20
08
20
09
20
10
20
11
2012: strong total loss impact (on uw years 2011 & 2012) Costa Concordia: Carnival Corporation & PLC website: 508+17 MUSD from H&M insurance. (2Q financial report, issued 02.07.2012)
...and more total losses in excess of 30 MUSD did incur 1st half 2012 (partly attaching to uw year 2011).
Hull – Gross Ultimate Loss Ratio Underwriting years 1996 to 2011
Data from: Belgium, Germany, France, NL, Nordic, Spain (no update 2011) ,UK, USA

18
40%
50%
60%
70%
80%
90%
1 2 3 4 5
2003
2004
2005
2006
2007
2008
2009
2010
2011
Hull – Gross* Reported Loss Ratio Underwriting years 2003-2011, as reported after 1, 2, 3, 4, 5 years
Previous loss ratio level
Recent loss ratio level
2011
2011:
starts at normal level.
2009-2010:
Price-driving factors
return to ”normal”
levels, but no stable
environment.
2010 strong increase.
2006-2008:
Repair cost driven up
by changing frame
conditions => Change
in claims pattern
40%
50%
60%
70%
80%
90%
100%
110%
1 2 3 4 5
2003
2004
2005
2006
2007
2008
2009
2010
2011
Hull – Gross* Ultimate Loss Ratios Underwriting years 2003-2011 – estimated development towards ultimate
2011:
Unprecedented
total loss impact –
loss ratio may
reach new heights.
1st half 2012:
Increase in no. of
losses xs 30 MUSD.
Impact on
underwriting years
2011 and 1012.
2011 – new heights?

19
Summing up Hull (1)
Frame conditions – still unstable Steel prices / repair yard capacity / exchange rates / commodity prices / vessel utilization /newbuildings / world trade / Euro crisis... Influence • Income (ship values) • Cost (claim frequency/repair cost).
Repair cost / Claim frequency – Stabilize But: catching up of trade/higher utilization rates may cause repair cost to rise again
Major claims – strong impact 1st half 2012 Unprecedented costly event Increase in total loss frequency 1st half 2012 Continuing downturn in insured values creates more
constructive total losses
Summing up Hull (2)
Hull technically at loss for 16 consecutive years!
Future Global Hull Market:
Understand dependencies between macroeconomic parameters and repair cost
Models to estimate expected claim cost (=risk premium)
Trade / Fleet development
Market discipline / capacity
The impact of major claims
Understand the actually covered exposure

20
Major losses 2012
39 « The Economist » June 9th-15th 2012
Major Hull losses 2012
40

21
0.000%
0.050%
0.100%
0.150%
0.200%
0.250%
0.300%
0.350%
0.400%
0.450%
0
5,000,000
10,000,000
15,000,000
20,000,000
25,000,000
30,000,000
35,000,000
40,000,0002000
2001
2002
2003
2004
2005
2006
2007
2008
2009
2010
2011
2012
Claim per Sum Insured & Average Sum Insured
Average Sum Insured excluding total losses including total losses
Source: Cefor Nordic Marine Insurance Statistics as of 30 June 2012; Figures reflect 100% of all vessels, not the share written in a specific market
Average insured value Claim cost in % of total total insured value
41
Watch your Exposure – one Costa Concordia can double the cost relative to the total insured value
Can it get worse...?
Increasing vessel size
Increasing value accumulation per vessel

22
UK (Lloyds)58.1%
Brasil4.8%
USA4.6%
Nigeria4.2%
Malaysia4.0%
UK (IUA)3.5%
Nordic3.0% India
2.9%
Japan2.8%
Italy2.1%
Other10.0%
2011
Offshore Energy Premium 2011 – by markets
No data: Kazakhstan.
*
* includes proportional and
facultative reinsurance
Total: 4.5 USD billion Actual increase 2010 to 2011: 11%
(new)
0%
50%
100%
150%
200%
250%
300%
350%
1996
1997
1998
1999
2000
2001
2002
2003
2004
2005
2006
2007
2008
2009
2010
2011
outstanding
paid 12th year
paid 11th year
paid 10th year
paid 9th year
paid 8th year
paid 7th year
paid 6th year
paid 5th year
paid 4th year
paid 3rd year
paid 2nd year
paid 1st year
2005
Katrina & Rita
2004
Ivan
2008
Ike
Soft market
2009-11 no
major hurricane
activity, but…
Offshore Energy – Gross Reported Loss Ratios including liability – Underwriting years 1996 to 2011
As of December 2011:

23
Summing up Offshore Energy
Volatile business, strong hurricane impact – less in recent years.
Long time lag between accident and claims payment (due to technical complexity of the insured objects)
No regular claims patterns. (Claims reserves set according to knowledge about individual claims).
Recent development:
Reduced hurricane impact (2012 Hurricane Isaac: first Gulf of Mexico hurricane in four years, little impact on results)
Increasing frequency of large single loss events (physical loss and liability)
Events with high liability cost in 2009 and 2010
2011: two losses xs 300 MUSD (Gryphon Alpha, Banff) 2012: one loss xs 300 MUSD (KS Endeavour)
46
Thank you
Further details at
www.iumi.com
and
http://www.iumi.com/index.php/committees/fa
cts-a-figures-committee/statistics

24
47
Questions?