global risk-adjusted payment models - bu...
TRANSCRIPT
Handbook of Global Health Economics and Public Policy
1
CHAPTER 11, VOL 1.
Global Risk-Adjusted Payment Models
Camilo Cid; Randall P. Ellis; Verónica Vargas; Juergen Wasem; Lorena Prieto.
Abstract:
Global health care payment systems reflect enormous differences in provider characteristics, health systems, and development levels. Risk adjustment is used for payment and performance measurement to correct for demand heterogeneity and incentives for plans and providers to prefer healthy, low-cost patients, and to provide quality care. This article reviews the practical, theoretical, and statistical aspects of risk adjustment models, which use socio-demographic variables and more recently morbidity and pharmaceuticals, to predict outcomes. Diverse uses of risk adjustment include geographical budget allocations, health plan premium equalization, pay for performance, primary care provider payment, integrated provider networks, and rewards for good doctor performance. Settings in more than 30 countries are examined, which include high-, middle- and low-income countries, competitive health plans and single payer systems, integrated provider networks, clinics, and solo practice primary care doctors. Recent concepts in health economics are highlighted that hold potential for improving efficiency and equitable patient access to health care.
(153 words)
1. INTRODUCTION
Every health care payment system must make payments to a diverse set of health plans, hospitals, clinics, physicians, laboratories, pharmacies and other types of health care providers. Some health care systems rely on competition among multiple health plans1 (“multiple payers”) to generate funds and pay providers. In other “single payer” health care systems, payment allocation decisions are made centrally by a single government entity; or funds are allocated geographically to regions, states, counties or cities within a single payer structure. A related challenge is that within a health plan, a provider network, or even a clinic or hospital, there will be variation in the cost, utilization level, and health status of patients seen, and it is therefore useful to control for this patient heterogeneity within a provider group when distributing payments. Risk adjustment is a tool that is useful for correcting or controlling for this heterogeneity in all of these payment settings.
The problem of heterogeneity is that the cost of treating patients is never randomly distributed across different groups, whether those groups be insurance plan enrollees, residents in a given state or other geographic region, or users seen by a given hospital, clinic, pharmacy, or individual provider. Nonrandom cost variation introduces efficiency problems (e.g., inadequate resources for certain health plans, regions or providers, leading to undertreatment) as well as fairness problems (e.g., overpaying for some groups, underpaying for others). Parallel concerns
1 Health plans refer to entities that pay providers of health care services. When health plans pool resources and bear risk, they are also referred to as insurance plans or insurers. Not all health plans bear risk or provide insurance. When provider networks receive per capita payments, then they bear risk and become the insurer.

Handbook of Global Health Economics and Public Policy
2
about efficiency and fairness across groups also arise when identifying high- or low-quality health plans, regions, or providers.
Risk adjustment is a technique used to calculate the expected cost (or quality, or utilization) of treating a specific group using information about the members of that group. In many cases, risk adjustment is used to allocate funds between different groups, or at least to develop norms against which actual funding levels can be compared. Often, the goal is to “level the playing field” to ensure that a plan/region/provider group that attracts a sicker-than-average set of enrollees will receive greater resources, or be recognized for achieving higher quality or lower quantity than expected when assessing performance.
The remainder of this chapter describes more carefully why risk adjustment is done and how it is done. After defining risk adjustment, Section 2 characterizes the problems that risk adjustment intends to solve. It then turns to describing the types of information that can be used for risk adjustment as well as alternative estimation methods. Also discussed is the distinction between conventional risk adjustment, in which existing payment patterns are captured in the risk adjustment formula, and optimal risk adjustment, where risk adjustment prices are viewed as tools for correcting underlying distortions. Section 3 presents commonly used classification systems, their limitations and a comparison of the predictive power of models. Sections 4 and 5 discuss how risk adjustment is used in various countries, contrasting uses in countries that have competing health plans with countries that have single-payer systems. Section 6 discusses risk-adjusted payments to individual providers and country examples. Section 7 summarizes the key lessons in the risk adjustment experience, policy concerns and issues that are still being discussed and that need to be addressed in future studies or applications.
2. PAYMENT SYSTEMS IN HEALTH- AND RISK-ADJUSTMENT
2.1 Payment systems
Health care markets are characterized by problems that differentiate them from other markets: large information asymmetries (which lead to risk selection and moral hazard); externalities; imperfect competition; heterogeneity on both the demand and supply sides; and substantial uncertainty that creates a demand for insurance. Insurance in particular distorts consumer choices and conceals consumers’ willingness to pay. Thus, market prices of individual services (often called “fee-for-service” prices), which typically balance willingness to pay with the marginal cost, lose this key role in most health care markets. When the public sector makes regulations, sponsors insurance, or delivers health care, these decisions further disturb normal market performance, especially in the case of payments.
Pricing problems are particularly severe in public health care systems, where in most cases the funder or payer (the government) is the residual creditor for payments, which creates incentives for overpricing and oversupply that work against efficiency (Ortún, et al., 2001). Even if market-driven prices for each service are replaced by fixed rates set by a regulator, service-level pricing will rarely reach a desirable result, since generously insured consumers will tend to demand and receive too many services (demand-side moral hazard). Regulated service prices also tend to affect markets through their effect on providers (supply-side moral hazard). If the price of a given service is set above its marginal cost, then providers will tend to oversupply that service. Problems are even worse when prices are not cost-related, which routinely happens when a government does not have information on actual costs or their dynamics over time (Newhouse et al., 1989). Given this, health systems in many countries are implementing alternative payment systems that place less reliance on fee-for-service (FFS) pricing and change the incentives facing consumers and suppliers (Paris, et al., 2010; Ellis and Miller, 2008).
Most health care payment systems can be classified into four types. The first type is a cost-based reimbursement system that retrospectively pays for the care provided, often in the form of FFS. Under this type of system, providers choose the number, type and quality of service, without much concern for the financial consequences because they are fully reimbursed for
Handbook of Global Health Economics and Public Policy
3
expenses incurred. The second type of system is a bundled payment system, in which payments are based on a predetermined contract that establishes conditions between the payer and the provider and does not directly compensate for increases in care provided. Bundled payments can either be based on predetermined information in which case it is called a prospective payment system, or the bundled payment can be based on information that emerging during the payment period (such as the number and types of diagnoses) in which is it can be called either a concurrent or retrospective payment system. Bundled payments can either be for a period of time such as a year (“capitation”) or for event such as an episode of treatment (e.g., hospital payment for “diagnosis related groups”). The third type of payment system is a budgeted system that relies on an integrated estimate of costs between the funder and the provider. How incentives work in a budgeted system depends on how these budgets are negotiated and updated. For example in budgeting for results the objective is to transform financial resources into outputs and outcomes, which is a multistep process. The budgeting process includes quantification of intermediate objectives, description of interventions, as well as the activities and their associated financial resources. Finally, the fourth type of payment system – considered to be the state-of-the art mechanism in countries more developed in this area of payment methodologies – are mixed payment systems, also called risk-sharing plans, that combine prospective and retrospective features to balance the tradeoff between efficiency and selection(Newhouse, 1996).
Both fully retrospective and mixed payment systems rely on “bundled payments” for all or part of their payments. Prospective payments – whether per person-month, or per event– can promote efficiency because they reduce the financial incentive on the margin to oversupply services, because these payments do not depend on provider-level health spending. Indeed, when marginal payments are below marginal costs, providers may undersupply some services: the theory is that bundled payments give incentives for providers to make the right decisions about which services to provide, given their competition for patients, altruism and concerns about reputation ensuring adequate supply. The central challenge with bundled payment is that it creates incentives for selection, in which providers or health plans try to avoid treating or enrolling patients that are expected to be unprofitable. (How this selection occurs is discussed further below.) In general, retrospective payments may minimize risk selection problems, but worsen efficiency through overprovision. Balancing these two goals – minimizing risk selection and improving efficiency – is an argument for using mixed payment systems, where some but not all costs are shared (Newhouse, 1996).
2.2 Definition of risk adjustment and uses for payment
In their classic study, van de Ven and Ellis (2000) define risk adjustment as using available information to calculate the expected costs or health of individuals or groups of patients for a fixed time period (usually one year). When used for payments to health plans, this implies the need for subsidies for individuals or health plans with higher risks, in order to improve both efficiency and equity in the health system. More recent discussions of risk adjustment generally include its use for controlling for variables while measuring utilization (e.g., numbers of emergency room visits or admissions), quality, or performance measures. This section focuses on the use of risk adjustment for payment purposes.
Every modern health care system can be thought of as having four groups of agents: consumers who receive health care services; providers who provide it; a sponsor who gathers revenue in a wide range of ways, to be used for insurance purposes; and one or more health plans responsible for paying providers. The boundaries between health plans and providers can be blurry in some health care systems, where the health plan owns or directly controls the providers. Two examples of this are managed care plans in competitive systems or single-payer plans with public ownership of facilities. In these cases, as in vertically integrated firms, provider payment decisions are made internally within the health plan-provider groups (Ellis and Fernandez, 2013).
Handbook of Global Health Economics and Public Policy
4
Premium-based risk adjustment systems rely on interactions between the sponsor and the health plan(s). The sponsor pools resources, whether premiums or income-based contributions from diverse enrollees, and then uses a risk adjustment payment formula to calculate per capita payments that go to the health plan. Both the specific institutions used and the structure of payment flows can vary by country, but a common system is that consumers pay a premium (in Europe, called their solidarity contribution), which may be either fixed or, more commonly, calculated as a fraction of their income, to government agency that in turn pays a risk-adjusted per capita amount to the corresponding health plan (Cid, 2011).
A risk-adjusted premium payment system enables the contribution of an individual or worker enrolling in a health plan to differ from the revenue received by their health plan for their care. In this scenario, payments to health plans reflect each individual’s expected cost of health services utilization, regardless of whether it is more or less than the amount the individual contributed. An ideal risk-adjustment formula levels the playing field, so that a health plan is indifferent between accepting healthy or sick, young or old, or rich or poor enrollees, because they are paid based on the enrollees’ expected risk. Most analytical models of risk adjustment suggest that such a perfect system creates strong incentives for efficiency. Unfortunately, no empirical risk adjustment model can ever be perfect in calculating risk. There will always be incomplete information available to the regulator calculating risk adjustment payments, or political or ethical constraints may prohibit the use of certain types of information. Even when health plans and the sponsor have the same information, consumers will generally have private information which may lead to selection problems. This could, in turn, lead to problems of inefficiency, low quality and poor access for high-risk groups.
Risk adjustment can be done at the individual or group level. For example, the costs of treating a city, county, state or region can be aggregated, or the characteristics of a health plan can be used instead of individual-level characteristics. Most risk adjustment frameworks calculate risk adjusted payments for each individual in a population, and then sum up these predictions to the group level. Results from the UK (Rice and Smith, 2001) and the US (Ash et al., 2000) show that individual-level information is much more predictive than aggregate information. Individual-level information should ideally include demographics, health status, socioeconomic characteristics and expenditure data for each health service received. But this level of disaggregation is not easily available. For instance, a health care system may not be able to assign health care expenditures to specific individuals in a health care plan or provider system. Even if only group-level information is available, aggregate models may still be useful in reducing the risk for the provider and improving provider efficiency. Risk adjusted, pooled payments still tend to promote efficiency, because the provider group or region internalizes the cost burden: if the group overspends on some patients or services, it must save on other patients or services to avoid losing money. Risk adjustment based on population characteristics may also improve the equity of payments and promote access to care, but, as mentioned above, if consumers can actively choose what plan or group to be in, then incentives for risk selection will persist.
2.3 Why use risk adjustment in payment systems?
The primary motivation for risk adjustment is risk selection – the tendency in insurance markets for nonrandom sorting between alternative health plans. Risk selection can arise from a variety of processes, for example an individual may have more information about her health status than the health provider or health plan, or the provider may have better information about the a patients expected cost. These information asymmetries lead to both demand- and supply-side selection incentives (Newhouse, 1996). On the demand side, individuals may use their private information towards adverse selection – with higher-cost consumers disproportionately enrolling in more generous or better quality health plans. Risk selection can also result in a favorable selection problem on the supply side when health plans or providers distort the service levels they offer so as to try to attract profitable enrollees (Glazer and McGuire, 2000).
Handbook of Global Health Economics and Public Policy
5
Depending on the market and the payment system, either adverse and favorable selection can result (Newhouse, 1996).
The preceding discussion assumes that selection is made in insurance markets that insure individuals for a fixed unit of time, such as a year. But selection can also occur whenever bundled payments create sorting incentives in other settings, such as per hospital day, per admission, per activity, per episode of treatment, or per bundle of provider services. The choice of the unit of payment affects both the risk selection incentives and the riskiness of the payment system to providers. Risk adjustment can be used to control for observable variables that affect cost, utilization or quality measures for any of these various units of payment although the terminology of severity adjustment is often used in such settings.
Risk selection exists because health care spending varies widely across individuals both for random and systematic reasons. This variation is called risk. Risk pooling – insuring large groups of enrollees – is effective at averaging out variation that is random and unpredictable, although if health care providers or insurers serve only modest numbers of enrollees (e.g., less than 10,000), then even random risk can remain important. More problematic is variation that is predictable and systematic. Agents bearing systematic risk face incentives to attract profitable enrollees, who are usually low cost, healthy enrollees or patients. .
Risk selection is affected by regulations and the structure of the entire health care payment system. For example, regulators may restrict plan benefits or plan behavior intended to attract healthy enrollees, or regulators may restrict who or how often consumers get to change plans. The structure of premiums as well as reinsurance and provider payment systems also affect risk selection, as well as risk bearing and care incentives. Unlike these other features, which may also address fairness or efficiency concerns, risk adjustment has as its primary purpose the reduction of risk selection. As mentioned above, providers may risk select to avoid unprofitable, usually sicker patients or reduce spending, saving at least a portion of the fixed payment received. One direct consequence may be a reduction in service quality for a proportion of the population (and in an extreme case, being denied insurance or access to care). This emphasizes the importance of the information used by risk adjusters: a good expenditure prediction is one that adjusts the fixed payment to the estimate made by the provider. Risk adjustment models that use only age and sex as adjusters, while better than no risk adjustment, leave significant risk selection incentives (Ash et al., 1989; Pope et al., 2000; Rice and Smith, 2001).
Optimal risk adjustment is a concept used to describe a payment model in which both the demand-side and supply-side selection incentives mentioned above are addressed, given allowed payment systems (Glazer and McGuire, 2000). A related term is “perfect risk adjustment” (van Barneveld et al., 2001), which fully compensates providers for all the predictable expenses for each individual, and solves efficiency and selection problems (van de Ven and Ellis, 2000). The key concept in optimal risk adjustment is to use risk adjustment not only to pay plans (or providers) the predicted cost of services provided, but also to correct any undesirable incentives for over or under provision of services. In the presence of imperfect risk adjustment signals, this may require biased rather than unbiased payments for signals. For example, if only half of the patients with an expensive condition in a plan are actually observed to have this condition, then one may need to (substantially) overpay the plan for each observed signal of this condition (or provider’s panel of patients) and underpay for those without this signal. This insight is in Glazer and McGuire (2000).
2.4 Alternative information to use for risk adjusted payment models
2.4.1 Prospective versus retrospective information
Before discussing the different types of information that can be used for risk adjustment, it is worth highlighting that two fundamental approaches are distinct. This section focuses initially on models that predict spending in a fixed period of time, usually a year, which is called the prediction period. Prospective (or ex ante) models use only information that exists prior to the
Handbook of Global Health Economics and Public Policy
6
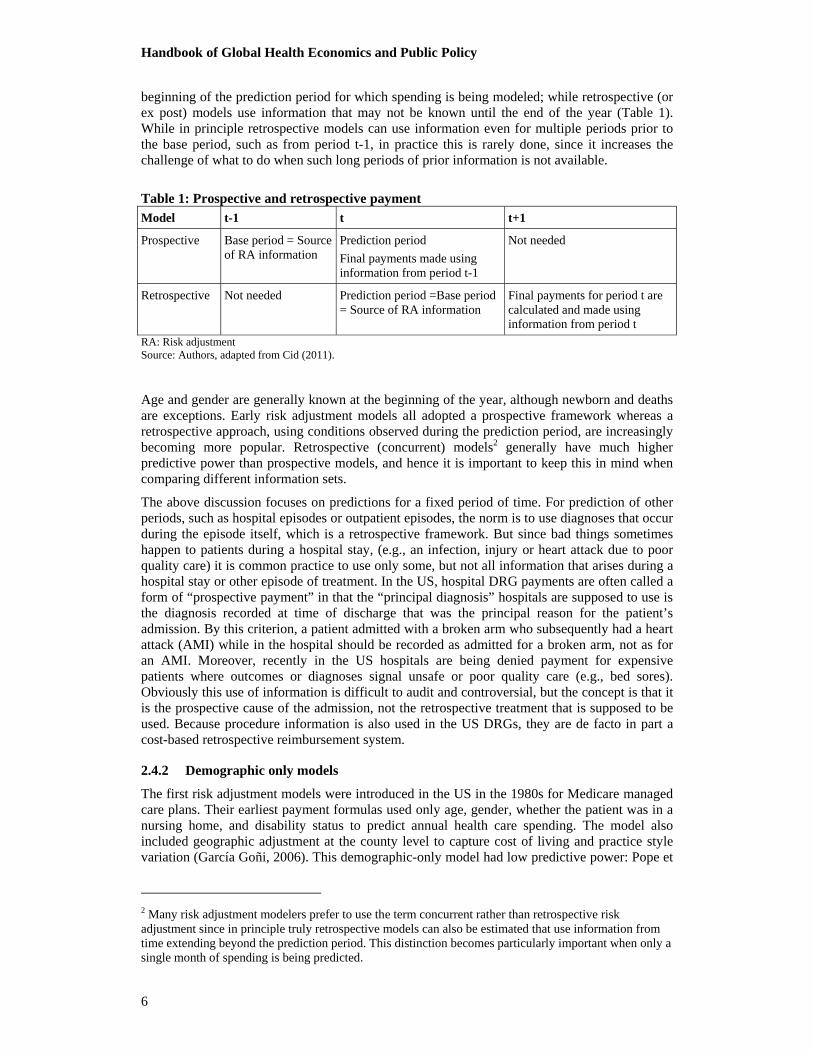
beginning of the prediction period for which spending is being modeled; while retrospective (or ex post) models use information that may not be known until the end of the year (Table 1). While in principle retrospective models can use information even for multiple periods prior to the base period, such as from period t-1, in practice this is rarely done, since it increases the challenge of what to do when such long periods of prior information is not available.
Table 1: Prospective and retrospective payment Model t-1 t t+1
Prospective Base period = Source of RA information
Prediction period
Final payments made using information from period t-1
Not needed
Retrospective Not needed Prediction period =Base period = Source of RA information
Final payments for period t are calculated and made using information from period t
RA: Risk adjustment Source: Authors, adapted from Cid (2011).
Age and gender are generally known at the beginning of the year, although newborn and deaths are exceptions. Early risk adjustment models all adopted a prospective framework whereas a retrospective approach, using conditions observed during the prediction period, are increasingly becoming more popular. Retrospective (concurrent) models2 generally have much higher predictive power than prospective models, and hence it is important to keep this in mind when comparing different information sets.
The above discussion focuses on predictions for a fixed period of time. For prediction of other periods, such as hospital episodes or outpatient episodes, the norm is to use diagnoses that occur during the episode itself, which is a retrospective framework. But since bad things sometimes happen to patients during a hospital stay, (e.g., an infection, injury or heart attack due to poor quality care) it is common practice to use only some, but not all information that arises during a hospital stay or other episode of treatment. In the US, hospital DRG payments are often called a form of “prospective payment” in that the “principal diagnosis” hospitals are supposed to use is the diagnosis recorded at time of discharge that was the principal reason for the patient’s admission. By this criterion, a patient admitted with a broken arm who subsequently had a heart attack (AMI) while in the hospital should be recorded as admitted for a broken arm, not as for an AMI. Moreover, recently in the US hospitals are being denied payment for expensive patients where outcomes or diagnoses signal unsafe or poor quality care (e.g., bed sores). Obviously this use of information is difficult to audit and controversial, but the concept is that it is the prospective cause of the admission, not the retrospective treatment that is supposed to be used. Because procedure information is also used in the US DRGs, they are de facto in part a cost-based retrospective reimbursement system.
2.4.2 Demographic only models
The first risk adjustment models were introduced in the US in the 1980s for Medicare managed care plans. Their earliest payment formulas used only age, gender, whether the patient was in a nursing home, and disability status to predict annual health care spending. The model also included geographic adjustment at the county level to capture cost of living and practice style variation (García Goñi, 2006). This demographic-only model had low predictive power: Pope et
2 Many risk adjustment modelers prefer to use the term concurrent rather than retrospective risk adjustment since in principle truly retrospective models can also be estimated that use information from time extending beyond the prediction period. This distinction becomes particularly important when only a single month of spending is being predicted.

Handbook of Global Health Economics and Public Policy
7
al. (2000) estimated that a demographic risk adjustment model only explained 1.5% of spending variability for the Medicare population in a prospective regression model; Ash et al. (2000) predicted 2% in a similar model using privately insured, Medicaid, and Medicare samples. Models using only age and gender as adjusters typically explain about 3-4 percent of the variation in total annual health spending when the full age distribution is included (van de Ven and Ellis, 2000).
Demographic models use actuarial cells, where each cell represents the expected cost of a previously defined risk group. Until 2009, the German risk equalization model basically used socio-demographic variables and included over 700 cells or risk groups, as is the case with Swiss and Israeli models (van de Ven et al., 2007). The Chilean model adjusts the AUGE benefit basket expenditures between ISAPRES (private insurers) using 36 cells defined by gender and age groups (Cid et al., 2006).3
2.4.3 Diagnoses-based models
To improve prediction, risk adjustment models started including diagnoses based on two lines of research. The work of Weiner et al. (1996) at Johns Hopkins University introduced the Adjusted Clinical Groups (ACG) grading system that initially only allowed the use of outpatient diagnoses, but later evolved to add all types of care. A second line of research has its origins at Boston University, and its most representative works are Ash et al. (1989), Ellis et al. (1996), and Pope et al. (2000). The Diagnostic Cost Group (DCG) classification system initially used only data from the principal diagnoses of hospitalized patients, but was later expanded to include diagnoses from all sources, including outpatient care and was renamed as the Hierarchical Condition Category (HCC) model. Diagnostic classification systems have also evolved in Europe through the work of van Vliet and van de Ven (1993), Lamers and van Vliet (1996) in the Netherlands; Wasem et al. (2006) in Germany.
The underlying assumption of diagnosis-based risk adjustment is that diagnoses are an unbiased measure of each enrollee’s true health status. This may not be true if diagnoses are either unreliable because of incomplete coding, or distorted by strategic up coding by providers or health plans to increase payments. Every system that has started requiring diagnoses on claims for payment or monitoring finds that, initially, the quality of diagnostic coding is highly incomplete, and needs to be audited.
2.4.4 Pharmaceutical prescription-based models
Pharmaceutical prescriptions are also a potential source for variables to predict costs, given that the use of certain medications can infer the existence of certain chronic diseases. Although the explanatory power of prescriptions is similar to that obtained from robust diagnoses-based models, the major concern is that these models may promote perverse incentives for efficiency, as in the case of models based on historical spending (Garcia Goñi, 2006). Higher expenditures in the last year or greater use of high-cost pharmaceuticals are rewarded with increased reimbursement for the following year.
The Netherlands introduced the use of Pharmacy-based Cost Groups (PCGs) in 2002 and added inpatient diagnostic cost groups in 2004 (Lamers et al., 2003; van de Ven et al., 2007). The Dutch system’s focus on a narrow set of originally 12 (now 17) PCGs was intended to capture chronic conditions.
3 Chile’s health sector reform was implemented in 2005 and it is known as AUGE Reform. It defined a basic package to cover selected health problems, with guarantees that began with 26 health problems and was since expanded twice and now includes 80 health problems. The basket defines interventions and guarantees. All sectors must comply with this basket, but it is considered “basic” since the public insurer (FONASA) and the private insurers (ISAPRES) provide coverage for other health problems than the ones in the basic basket.
Handbook of Global Health Economics and Public Policy
8
2.4.5 Survey-based models
Health surveys, e.g., SF-36 and EQ5D, contain other explanatory variables that can be included in a linear regression model to explain health expenditures. In a survey, patients can express their self-perceived health status, quality of life, health care received, etc. The predictive power of these models is not superior to those based on diagnoses, and difficulties in collecting the survey data and the unreliability of some answers make diagnoses-based models preferable to survey-based models (García Goñi, 2006).
Pope et al. (1998) is a popular paper because it explores survey-based risk adjustment for the US population. It presents a simulation with the short version SF-36, along with eight other types of surveys or self-reports and compares it with an early diagnosis-based model (the CMS-HCC model). Pope et al. (1998) find that the explanatory power is relatively low. Self-reported functional status gave an adjusted-R squared of 2.52%, self-reported chronic conditions was 2.74%, self-reported health was 3.11%, SF-36 was 4.05%, and for a comprehensive survey it was 4.18%. In contrast, a diagnosis- only model using prospective HCCs almost doubled the predictive power, explaining 7.27% of the variation. Combining diagnostic information and survey data performed only somewhat better at 7.85%. All models used US prospective data (Pope et al., 1998). More recent work done in the UK and Australia has confirmed that once diagnostic information is present, survey information adds relatively little to the predictive power of a risk adjustment model, both in a retrospective and prospective framework. More recently, Gravelle et al., (2011) and Ellis et al. (2013) explore the incremental information that can be acquired in using surveys in addition to diagnostic information.
2.4.6 Income, need, and other demographic adjusters
Income, poverty, housing characteristics, unemployment, and other socioeconomic information is often used to allocate funds geographically to provider groups or regional authorities in many public, single-payer systems, although in many countries such information is transitioning to using individual-level information. A good example of this is in the UK, where it has gradually evolved from using aggregated information about geographic areas to using individual-level information to allocate budgets for hospital and community care. The UK evolved from allocating funds to 14 resource allocation working areas to using a person-based approach. Gravelle et al. (2011) demonstrated that morbidity markers based on diagnoses largely eliminated the usefulness of most attributed need and supply-side variables for hospital budgets, while Dixon et al. (2011) found similar results for primary care trusts.
2.5 Methods for calculating risk adjustment
In general, there are basically three ways to adjust for risk: synthetic indices methods; actuarial cells formulas; and regression formulas. In the latter field, despite extensive research, including econometric research of predictive models, the simplest and most applicable models are linear regression models, which can be classified into different types depending on the explanatory variables used (Ellis, 2008).
2.5.1 Synthetic indices method
The English (and UK) per capita allocation is known as the “synthetic indices” method. It weighs population using aggregated geographic area medical need information. This method takes into consideration the simultaneity of supply and demand forces in determining health care use and expenditure, as well as the accepted definition of health care. The formula Resource Allocation Working Part (RAWP) and its adaptation for Scotland (Share model), Wales and North Ireland employs the concept of normative utilization, defined as the expected use of services in each geographic area if the responsiveness to the needs of the population were

Handbook of Global Health Economics and Public Policy
9
equal to the national average. In practice, this normative utilization estimation requires excluding the part of demand that is induced by the supply.4
The adjusted per capita system has been used in England since 1970 and is the fundamental resource allocation system in the country. The formula has been extensively studied and has had significant variations over time, where the more important changes occurred in 1976, 1989, 1994-5 and 1999-2000. The initial formula separated operational expenditures from investment expenditures, since these expenditures are planned for differently, and only operational expenditures were included in the adjusted per capita payment. By 1999-2000, the risk adjustment formula converged both types of expenditure into a single formula that considered demographic, additional health needs and health service provision cost variations.
Similar models are used in Spain, Italy and Canada among others. Spain adjusts its per capita by population, past health expenditures, and health service utilization. Italy uses a budget ceiling for each region based on an adjusted per capita (Lo Scalzo et al., 2009). Between 1978 and 1997, the formula used in Italy changed many times, and since then, it has considered health service demand, age structure, and population health status (mortality). In Canada, some provinces have used regional adjustment based on age, gender and socioeconomic status since 1994 (Ellis, 2008).
2.5.2 Actuarial cells models
The matrix or actuarial cell method creates an array where the value of each cell represents the expected expenditure for a person who is characterized by certain variables (e.g., the cell may be at the intersection of sex and age). This method is limited by the availability of information at the individual level, despite being a more suitable method, in comparison to an aggregate data method.
Individual records must include expenditure or utilization information, as well as other variables to measure health needs and therefore costs. The ACG approach is an example of a cell-based model, using diagnostic information and aggregating it into clusters (see below).
2.5.3 Regression models
Regression models that create predictions using multivariate models are the most common form of estimation. These can be estimated using either individual-level data (which is generally preferred) or aggregate data, using geographic averages. Regression models using aggregate data were used in Belgium until 2006 and still underlie the UK budget allocation formulas. These models use population-level data series and they have been criticized for their inaccuracy and the arbitrariness of the variables included. Aggregate risk adjustment models are better than no risk adjustment, but leave significant incentives for selection at the individual level.
2.5.4 Differences between rate cell and regression approaches
There are important differences between the two risk approximation models discussed above (cell and regression models). In rate cell models, each patient is classified uniquely into a single group choosing the most useful for determining severity or patient costs. Patients are typically allocated based on a complex algorithm in which the more complex or more costly, are allocated first. A Clinical Risk Group (CRG) is one of these models. The advantage of these models is that they are simple to construct and the disadvantage is that they are less predictive than regression models, since the latter can capture a large variety of types of patients, and cell models are limited to the array of cases built (Ellis, 2008). Another important difference is that there are models that require not only diagnoses but also procedure information (such as CRGs) while others do not (like DxCG and ACG). Finally, the models differ in the types of disease
4 The best risk adjustment systems attempt to separate the non legitimate factors, unrelated to the purpose for which funding is postulated, from legitimate factors as the observed differences in health spending.
Handbook of Global Health Economics and Public Policy
10
classification used (ICD-9 or ICD-10) and in their design. Although usually all patients are allocated into a group, because models have translation systems, they are not perfect and there is always a remnant of loss of information in the translation process.
2.5.5 Linear versus nonlinear specifications
Early models of individual-level health care spending often preferred nonlinear prediction models that either model the log of spending or decompose spending into a probability of use and level of use models. Such models can generate errors which tend to be close to normality, but create problems in predicting spending levels in the presence of heteroskedasticity. More recently, the preference has been to use linear risk adjustment models, which is to say that the dependent variable is left in its natural, untransformed state, and explanatory variables enter in additively on the right side. Some explanatory variables may themselves be interactions of other variables, including diagnostic conditions and demographic information. The standard estimation approach (Ellis et al., 1996) adopted in the US and Germany is to model spending per month, or equivalently, “annualized spending” as the dependent variable which is spending divided by the fraction of the year each enrollee is eligible, and to weight each observation by the fraction of the year eligible. This is exactly equivalent to using “spending per month” as the dependent variable, and weighting each observation by the number of months a person is eligible for coverage. To accommodate newborns, deaths, and people who move into and out of health plans or regions, models that can accommodate partial year eligibility are important.
A substantial literature, including work by top econometricians, has validated that with very large samples (exceeding a million observations) linear regression models dominate nonlinear models in generating unbiased predictions. Noted econometrician Andrew Jones (2011) summarizes: “It is notable that the simple linear model, estimated by OLS, performs quite well across all of the criteria, a finding that has been reinforced for larger datasets than the one used here.” Nonlinear models may be superior when the goal is hypothesis testing, but for payment purposes, OLS generates better predictions (Dixon et al., 2011; Gravelle et al., 2011; Ellis et al., 2013).
2.5.6 Recalibration methods
For any given classification system or modeling framework, a user from a different country using a different subset of consumers from the population has a variety of choices of how to reestimate or recalibrate a model to fit. If the sample is large enough, then reestimation of the entire model (with perhaps 500 or 1,000 parameters) on the new sample is the preferred approach. The current, most highly refined models (CMS-HCC, HHS-HCC, DxCG, ACG, CRG from the US, and the German and Netherlands models) require sample sizes of more than one million person years to avoid overfitting problems of more than 0.01 in the R2 in prospective and retrospective models. Given this, many users use simplified classification systems with a smaller subset of diagnoses. Researchers in Australia used a coarser classification system with only 127 condition categories to model their sample of 800,000 person years (Ellis et al., 2013). An approach that can be used on even smaller sample sizes (10,000 to 200,000) is to use lightly recalibrated models in which regressions use risk scores calibrated on other samples or other countries. This can be done with a single right hand variable, such as Y = α + β*RRS or simple splines can be used. For example, a three step spline model would use Y = α + β1*RRS + β2*(max(RRS-1.0, 0.0) + β3*(max(RRS-2.0, 0.0). While this approach does not allow for variation in treatment practices for specific illnesses, empirically it will generally achieve R2 that is within 90% or better of the R2 achieved with full recalibration (Winkelman and Mehmud, 2007). Even across different countries, relative risk scores are highly correlated (Ellis et al., 2013).
2.6 Measures used to compare and evaluate risk adjustment models
Risk adjustment models are typically evaluated using five metrics of predictive power. First, the conventional R2 – which measures the fraction of total variation in the dependent variable
Handbook of Global Health Economics and Public Policy
11
explained by the model – is by far the most common means of comparison. Closely related is the root mean squared error – the square root of the average of the squared error – which for a given dataset will generally give the same ranking as the R2. A third metric is the Mean
Absolute Prediction Error, (MAPE), . A fourth metric is the closely related
Cummings Prediction Measure (CPM) which expresses the MAPE in relation to the mean absolute deviations around the sample average. Both the MAPE and CMP are popular because they do not square outliers, which can give a significantly different rating of models and ends up attaching equal importance to deviations at all levels of the distribution rather than focusing on predictions of the largest outliers. Finally, it is common to also evaluate models in terms of predictive ratios – which can be calculated as ratios of actual spending to predicted spending – for various subgroups of the sample about which one is particularly concerned about selection incentives. High-cost groups, groups with certain chronic conditions, low-income households, and geographically remote areas are examples of groups for which undertreatment is a common concern, and predictive ratios, which are ideally close to one for all subsets, provide a useful measure.
As discussed in van de Ven and Ellis (2000) there are a number of adjustments to the dependent variable or sample that can greatly affect all measures of model performance. All of the following measures can change the R2 by more than a few percentage points, making it hard to compare results across studies: using retrospective (concurrent) rather than prospective diagnoses, excluding or topcoding outliers, focusing on subsets of the total population, using only within- rather than out-of-sample goodness of fit measures, overfitting the models on samples that are too small, and failing to adequately distinguish between “out of the box” model performance, where coefficients are taken as given, and recalibrated models in which all of the model parameters are reestimated on a new sample. For a good discussion of these issues, see Winkelman and Mehmud (2007) which was prepared for the US Society of Actuaries.
2.7 Sample calculations for a risk adjustment system
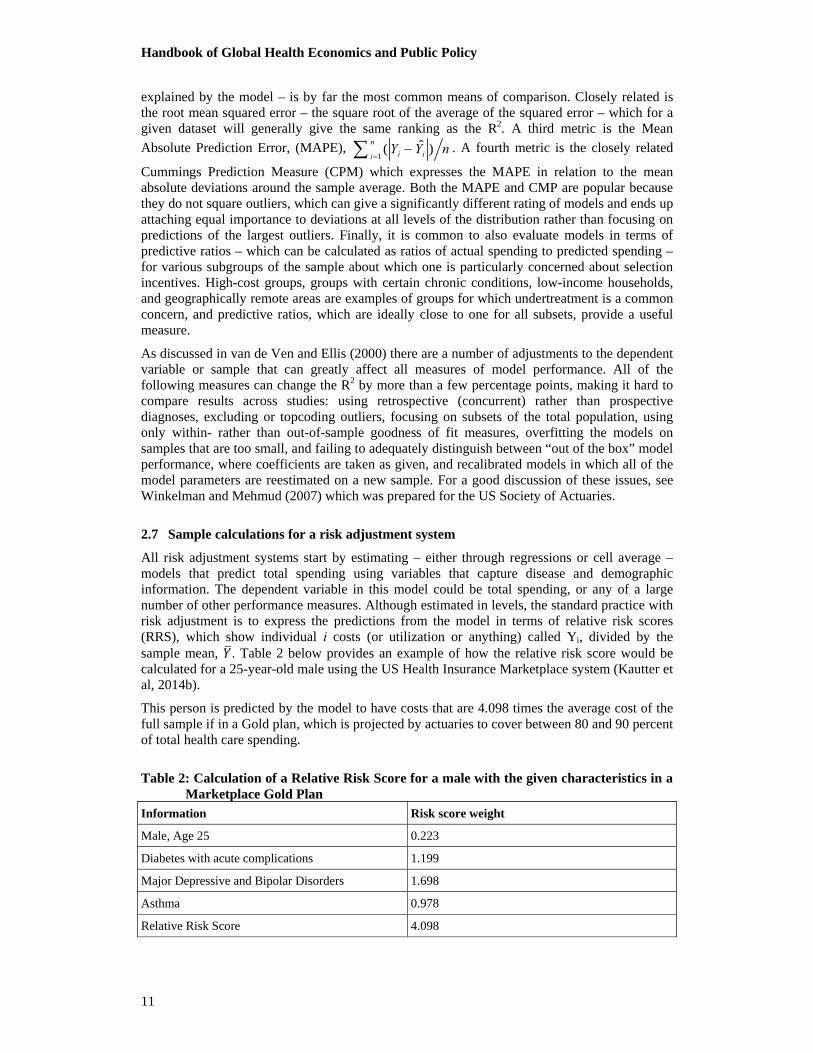
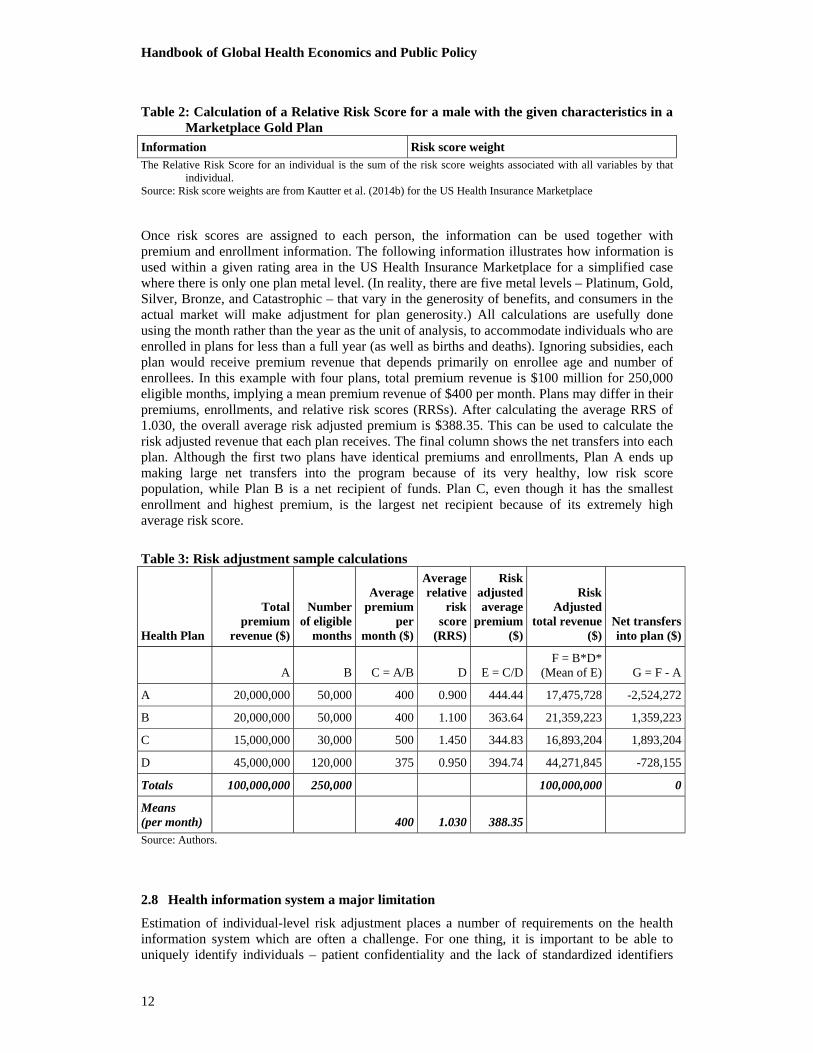
All risk adjustment systems start by estimating – either through regressions or cell average –models that predict total spending using variables that capture disease and demographic information. The dependent variable in this model could be total spending, or any of a large number of other performance measures. Although estimated in levels, the standard practice with risk adjustment is to express the predictions from the model in terms of relative risk scores (RRS), which show individual i costs (or utilization or anything) called Yi, divided by the sample mean, . Table 2 below provides an example of how the relative risk score would be calculated for a 25-year-old male using the US Health Insurance Marketplace system (Kautter et al, 2014b).
This person is predicted by the model to have costs that are 4.098 times the average cost of the full sample if in a Gold plan, which is projected by actuaries to cover between 80 and 90 percent of total health care spending.
Table 2: Calculation of a Relative Risk Score for a male with the given characteristics in a Marketplace Gold Plan
Information Risk score weight
Male, Age 25 0.223
Diabetes with acute complications 1.199
Major Depressive and Bipolar Disorders 1.698
Asthma 0.978
Relative Risk Score 4.098
1ˆ( )
n
i iiY Y n
Handbook of Global Health Economics and Public Policy
12
Table 2: Calculation of a Relative Risk Score for a male with the given characteristics in a Marketplace Gold Plan
Information Risk score weight The Relative Risk Score for an individual is the sum of the risk score weights associated with all variables by that
individual. Source: Risk score weights are from Kautter et al. (2014b) for the US Health Insurance Marketplace
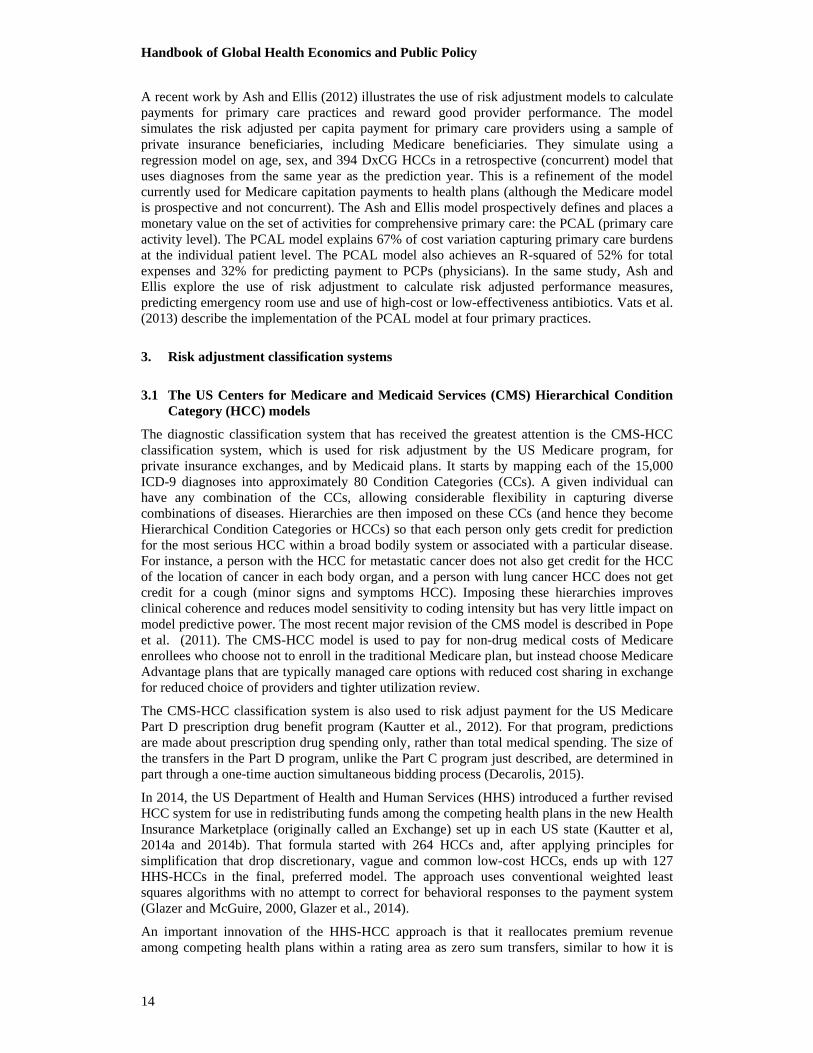
Once risk scores are assigned to each person, the information can be used together with premium and enrollment information. The following information illustrates how information is used within a given rating area in the US Health Insurance Marketplace for a simplified case where there is only one plan metal level. (In reality, there are five metal levels – Platinum, Gold, Silver, Bronze, and Catastrophic – that vary in the generosity of benefits, and consumers in the actual market will make adjustment for plan generosity.) All calculations are usefully done using the month rather than the year as the unit of analysis, to accommodate individuals who are enrolled in plans for less than a full year (as well as births and deaths). Ignoring subsidies, each plan would receive premium revenue that depends primarily on enrollee age and number of enrollees. In this example with four plans, total premium revenue is $100 million for 250,000 eligible months, implying a mean premium revenue of $400 per month. Plans may differ in their premiums, enrollments, and relative risk scores (RRSs). After calculating the average RRS of 1.030, the overall average risk adjusted premium is $388.35. This can be used to calculate the risk adjusted revenue that each plan receives. The final column shows the net transfers into each plan. Although the first two plans have identical premiums and enrollments, Plan A ends up making large net transfers into the program because of its very healthy, low risk score population, while Plan B is a net recipient of funds. Plan C, even though it has the smallest enrollment and highest premium, is the largest net recipient because of its extremely high average risk score.
Table 3: Risk adjustment sample calculations
Health Plan
Total premium
revenue ($)
Number of eligible
months
Average premium
per month ($)
Average relative
risk score
(RRS)
Risk adjusted average
premium ($)
Risk Adjusted
total revenue ($)
Net transfers into plan ($)
A B C = A/B D E = C/DF = B*D*
(Mean of E) G = F - A
A 20,000,000 50,000 400 0.900 444.44 17,475,728 -2,524,272
B 20,000,000 50,000 400 1.100 363.64 21,359,223 1,359,223
C 15,000,000 30,000 500 1.450 344.83 16,893,204 1,893,204
D 45,000,000 120,000 375 0.950 394.74 44,271,845 -728,155
Totals 100,000,000 250,000 100,000,000 0
Means (per month) 400 1.030 388.35Source: Authors.
2.8 Health information system a major limitation
Estimation of individual-level risk adjustment places a number of requirements on the health information system which are often a challenge. For one thing, it is important to be able to uniquely identify individuals – patient confidentiality and the lack of standardized identifiers

Handbook of Global Health Economics and Public Policy
13
across the insurance system are common barriers to this. Second, in many health care systems used to working on a budgeted system (e.g., where hospitals get a fixed budget for providing care to virtually anyone who shows up), it is challenging to attribute services to specific individuals. Similar problems were present in the US when it implemented its DRG payment systems in the 1980s, and more recently in Australia and Germany as they have developed case-based payment systems and risk adjustment models. A third problem is that many information systems do not yet require or keep track of diagnoses for each patient visit. Although requiring diagnoses for hospital reimbursement and monitoring has become fairly routine in most countries, requiring office-based physicians to record diagnoses remains a challenge in many countries. A related problem is that diagnoses recorded by some providers (nurses, home health workers, ambulance paramedics) may be unreliable for use in risk adjusted payments. Providers who record diagnosis may not be properly trained or they may not have the required information, which could translate into errors in the reporting. So screens on which diagnoses are to be used for risk adjustment (as are applied in the US and Germany) can be challenging to develop and incorporate. Cost information for calculating per person costs, even under a fee-based payment system, can be remarkably difficult to sum up, with the large number of duplicate claims and claims adjustments that are common. Finally, the ability of modern health IT systems to over- or under-record and misreport diagnostic information presents a challenge. Once health plan or provider revenue is based on recorded diagnoses, then there are incentives for coding creep (upcoding to increase reimbursement) by interested parties. In health equalization fund settings, which are zero sum payment adjustments, coding intensity creep may jeopardize fairness but not necessarily increase public or private costs.
2.9 Risk adjustment and performance-based payments
Performance-based payment is a new funding mechanism which may be understood as complementary to the risk-adjusted capitation systems. Current international trends in payment methods include paying for results, where incentives are grouped into two categories: first, fixing productivity to the achievement of quality objectives, also known as pay-for-performance (P4P); and second, compensating primary care health workers so that they receive payment comparable to that of hospital health care workers (Palomo et al., 2011). Payment of financial incentives as a method for increasing the quality of care (P4P) has been increasing in recent years in a number of countries, as have related studies. However, according to Eira and Ortún (2012), the authors do not support the use of the P4P nor do the financial incentives improve health outcomes. Countries like Australia, Belgium, Czech Republic, Hungary, Italy, Japan, New Zealand, Portugal, Spain and UK, already include bonuses for primary care physicians in the context of P4P (Paris et al., 2010).
According to Scheffler (2010), under P4P the payment structure is based on quality and efficiency measures associated with rewarding the achievement of goals while controlling for case mix differences or morbidity. The rewards are financial and can also be associated with reputation via the publication of measurements and rankings. In OECD countries in 2008-2009, there were 13 countries using primary care bonus payments for physicians in P4P schemes, 9 of them using bonus payments for specialists, 7 using bonus payments for hospitals, and 16 using incentives to comply with guidelines or treatment protocols. Countries like Hungary, Italy, New Zealand and Portugal only used them for APS physicians. The Czech Republic, Poland and Spain, also used bonus payments for specialists. Belgium, Japan, Turkey, the UK and the US all used bonus payments for the full range of providers, i.e., PCPs (primary care practitioners), specialists and hospitals. Thus, P4P programs were reported in a total of 19 OECD countries, using bonuses to incent PCPs, specialists or hospitals (or some combination of these). The majority of the P4P programs used quality objectives related to preventive health care and chronic disease management (Scheffler et al., 2012). In any case, even performance bonuses need to be risk adjusted because otherwise they may create perverse incentives to avoid the sickest patients, since positive performance measures are more easily obtained with healthier populations.
Handbook of Global Health Economics and Public Policy
14
A recent work by Ash and Ellis (2012) illustrates the use of risk adjustment models to calculate payments for primary care practices and reward good provider performance. The model simulates the risk adjusted per capita payment for primary care providers using a sample of private insurance beneficiaries, including Medicare beneficiaries. They simulate using a regression model on age, sex, and 394 DxCG HCCs in a retrospective (concurrent) model that uses diagnoses from the same year as the prediction year. This is a refinement of the model currently used for Medicare capitation payments to health plans (although the Medicare model is prospective and not concurrent). The Ash and Ellis model prospectively defines and places a monetary value on the set of activities for comprehensive primary care: the PCAL (primary care activity level). The PCAL model explains 67% of cost variation capturing primary care burdens at the individual patient level. The PCAL model also achieves an R-squared of 52% for total expenses and 32% for predicting payment to PCPs (physicians). In the same study, Ash and Ellis explore the use of risk adjustment to calculate risk adjusted performance measures, predicting emergency room use and use of high-cost or low-effectiveness antibiotics. Vats et al. (2013) describe the implementation of the PCAL model at four primary practices.
3. Risk adjustment classification systems
3.1 The US Centers for Medicare and Medicaid Services (CMS) Hierarchical Condition Category (HCC) models
The diagnostic classification system that has received the greatest attention is the CMS-HCC classification system, which is used for risk adjustment by the US Medicare program, for private insurance exchanges, and by Medicaid plans. It starts by mapping each of the 15,000 ICD-9 diagnoses into approximately 80 Condition Categories (CCs). A given individual can have any combination of the CCs, allowing considerable flexibility in capturing diverse combinations of diseases. Hierarchies are then imposed on these CCs (and hence they become Hierarchical Condition Categories or HCCs) so that each person only gets credit for prediction for the most serious HCC within a broad bodily system or associated with a particular disease. For instance, a person with the HCC for metastatic cancer does not also get credit for the HCC of the location of cancer in each body organ, and a person with lung cancer HCC does not get credit for a cough (minor signs and symptoms HCC). Imposing these hierarchies improves clinical coherence and reduces model sensitivity to coding intensity but has very little impact on model predictive power. The most recent major revision of the CMS model is described in Pope et al. (2011). The CMS-HCC model is used to pay for non-drug medical costs of Medicare enrollees who choose not to enroll in the traditional Medicare plan, but instead choose Medicare Advantage plans that are typically managed care options with reduced cost sharing in exchange for reduced choice of providers and tighter utilization review.
The CMS-HCC classification system is also used to risk adjust payment for the US Medicare Part D prescription drug benefit program (Kautter et al., 2012). For that program, predictions are made about prescription drug spending only, rather than total medical spending. The size of the transfers in the Part D program, unlike the Part C program just described, are determined in part through a one-time auction simultaneous bidding process (Decarolis, 2015).
In 2014, the US Department of Health and Human Services (HHS) introduced a further revised HCC system for use in redistributing funds among the competing health plans in the new Health Insurance Marketplace (originally called an Exchange) set up in each US state (Kautter et al, 2014a and 2014b). That formula started with 264 HCCs and, after applying principles for simplification that drop discretionary, vague and common low-cost HCCs, ends up with 127 HHS-HCCs in the final, preferred model. The approach uses conventional weighted least squares algorithms with no attempt to correct for behavioral responses to the payment system (Glazer and McGuire, 2000, Glazer et al., 2014).
An important innovation of the HHS-HCC approach is that it reallocates premium revenue among competing health plans within a rating area as zero sum transfers, similar to how it is

Handbook of Global Health Economics and Public Policy
15
done in Germany and Switzerland (Pope et al, 2014). A stylized example of the process is discussed in the next section. One challenge of doing this in the US is accommodating the substantial variation in plan generosity that is allowed in the Marketplace, unlike the European funds.
3.2 Diagnostic Cost Group (DxCG) System
The DxCG classification system is a private proprietary system licensed by Verisk Health of Waltham Massachusetts, US, which builds upon the classification system developed for Medicare. The diagnostic classification starts by grouping diagnoses coded in the International Classification of Diseases (ICD) system into clinically homogeneous groups, called DxGroups. (Both ICD-9 and ICD-10 versions are available.) The most recent DxCG models classify all 15,000+ diagnoses into 1,010 DxGroups based solely on clinical similarity. These DxGroups are then further collapsed into 394 condition categories (CCs) based on both major disease types and similarity of costs. Most but not all DxGroups map to a CC. Hierarchies are imposed on the CCs to create Hierarchical Condition Categories (HCCs), which identify the most costly manifestation of each disease. Since CCs are not mutually exclusive, a single person may be classified into several categories. CCs can also be further aggregated in to 127 Related Condition Categories (RCCs), and 31 Aggregated Condition Categories (ACCs).
The DxCG HCC classification system was modified to accept ICD-10 diagnoses and implemented in Germany (where the 80 selected HCCs are called Hierarchical Morbidity Groups (HMGs)) for allocating funds between a large number of competing sickness funds (health plans) starting in 2009 (Buchner, et al., 2013). DxCG models have also been evaluated in Canada, Chile, Spain, the UK, and Australia (see Table 4 below).
3.3 Adjusted Clinical Groups (ACG)
The Adjusted Clinical Groups (ACG) system is a proprietary system developed and currently licensed by researchers at Johns Hopkins University. The original system used a rate cell approach that allocates all diagnoses codes into 32 diagnostic groups, known as Aggregated Diagnostic Groups (ADGs). Classification is based on four clinical dimensions: duration, severity, diagnostic certainty and specialization of care. All diseases, including those newly discovered, can be classified according to these dimensions and categorized into one of these 32 groups. The system uses a branching algorithm to place people into one of 93 discrete ACG mutually exclusive categories, based on the particular combination of ADGs of each individual, as well as age and gender. Predictive models are based on linear regression models.
This system has been used in the US and in several other countries. It is generally used in studies that assess its possible inclusion in the countries’ or regions’ risk-adjustment methodology as in Canada, Taiwan, Spain, and South Korea and Sweden. Recently, there has been an ACG pilot in Chile at the primary health care (PHC) level (see Table 4 below).
3.4 Episode Treatment Groups (ETGs) and Episode Risk Groups (ERGs)
Episode Treatment Groups (ETGs)® are a proprietary classification system licensed by Optum Inc. of the US that groups medical and pharmacy claims into episodes of care. It was first described in the literature in 1996. Unlike other groupers considered here, its primary focus is on creating clusters of services, possibly overlapping in time, into episodes of care, separated by clean periods in which there are no services provided. Procedure, diagnostic, and time information as well as provider type are all used in the process of creating episodes. Episode Risk Groups (ERGs) combine information from different episodes during a year to predict annual health care spending at the individual level (Dang et al., 1996a and 1996b).
Handbook of Global Health Economics and Public Policy
16
3.5 Clinical Risk Groups (CRGs)
Clinical Risk Groups (CRGs) were first marketed in 1999 by the US company 3M (who also licenses Diagnosis Related Group (DRG) groupers and other classification systems worldwide) and are used to classify people into mutually exclusive clinical categories, based on the information generated by their contact with the healthcare system. It requires a patient database for all activity in all areas or levels of care and interventions coded in ICD-9-CM. The CRG classification system uses age, gender, diagnoses, procedures, and dates of service information, which differentiates it from other classification systems that avoid procedure and date information. van de Ven and Ellis (2000), among others, would argue that using procedure information in a risk adjustment model for payment weakens cost containment incentives, similar to cost-based reimbursement.
The CRG method emphasizes chronic diseases through various types of breakdowns of 1,099 CRGs, 441 ACRG1, 176 ACRG2 and 46 ACRG3 into clearly identifiable categories from the clinical point of view, and because they are mutually exclusive, it facilitates the analysis (Inoriza et al., 2009). CRGs differ from other grouping systems in that they use a rate cell approach rather than a linear regression model to make predictions: each individual is ultimately classified into a single CRG that predicts their annual cost.
Baixa Emborda county in Catalonia has been using CRGs since 2002 (Inoriza et al., 2009). Inoriza et al. (2009) present a description of morbidity for the period 2002-2005. CRG exercises have also been studied for the population of Quebec in Canada (Berlinguet et al., 2005). The latter study compares the three main models (DxCGs, ACGs and CRGs) and found similar predictive power among the three but argues that the CRG worked better on clinical relevance, resource forecasting and transparency, ease of use and simplicity (Berlinguet et al., 2005).
3.6 RxGroups (of DxCG Inc) and Pharmacy-based Cost Groups (PCGs)
RxGroups are clusters of medically similar drugs that can be used for risk adjustment. The DxCG RxGroup classification system groups more than 100,000 National Drug Codes (NDCs) into one of 155 RxGroups, which in this case are mutually exclusive (unlike the DxGroups which in some cases a person could be in two CCs). RxGroups are based on the therapeutic indication of pharmaceuticals and does not attempt to cluster these classes by disease. The latest version supports the use of ATC codes,5 and this allows it to be used outside of the US.
The Chilean Ministry of Health studied the use of pharmacy information using an RxGroup framework for a regional health service’s per capita allocation in 2009 (Ibern et al., 2008).
Since 2002, the Netherlands’ system has used pharmacy information intended to capture the costs of selected chronic conditions (van de Ven et al., 2007).
3.7 Other classification systems
In addition to the classification and predictive frameworks already described, several other approaches are commonly used. The Chronic Disability Payment System (CDPS) was developed by Richard Kronick and colleagues and is used in several US states to make capitation payments to Medicaid managed care plans (Kronick et al., 1996). The Charlson (1987) Comorbidity Index (with 17 disease categories) and the Elixhauser (1998) system (with 33 disease categories) are diagnosis-based classification system in which weights on each component were based on clinical judgment rather than regression coefficients. For a recent application and comparison, see Bing et al. (2008). A third, more elaborate system called the Clinical Classification System (CCS) is documented and evaluated in Radley et al. (2008), and builds upon the Agency for HealthCare Research and Quality (AHRQ) disease classification system, with 259 conditions. An advantage of each these four systems is that the coding of the
5 ATC refers to the Anatomical Therapeutic Chemical Classification System.

Handbook of Global Health Economics and Public Policy
17
diagnostic classification systems are free and in the public domain, although the disadvantages include that they are not automatically updated, and do not use hierarchies to reduce the sensitivity of the models to coding intensity. None of these systems include software that generates risk scores, but rather they create predictive variables that can be used to create customized risk adjustment models.
The US Society of Actuaries has also evaluated artificial intelligence algorithms that can be used to predict spending, however this modeling approach leads to customized predictive models that are not easily transferred to new datasets and time periods, and have been criticized for not revealing clinically coherent classification systems (Winkelman and Mehmud, 2007).
3.8 Predictive power comparisons
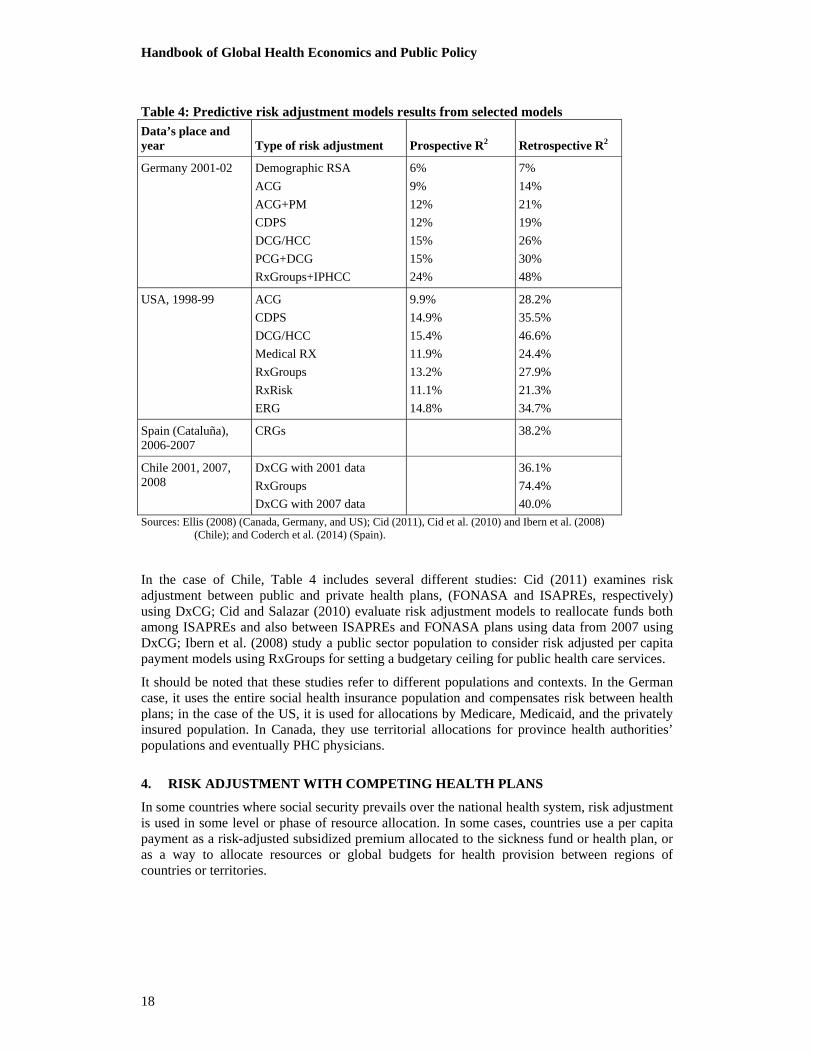
At the individual level, demographic models predict no more than 2.5% to 3.0% of the expenditure variance. When used in combination with other diagnostic and socio-demographic variables, which may include age and sex, these models can increase their predictive power by about 10 times or more (Cid, 2011). However, a comparison of diagnoses models shows differences in predictive power, and studies related to populations from different countries, analyzed mostly by Ellis (2008), show significant differences. Models that combine information such as CRG, RxGroups and the ERG tend to be better predictors than those using only one type of information. Retrospective models predict much better than prospective models, because retrospective models use information of the year being predicted. RxGroups is the prospective model that has the best predictive results, for example, in Germany (24%) and the Netherlands, although it is not the most studied. The most studied models are those that incorporate diagnostic codes, such as DxCG, ACG, CRG, and the ones that fit best are the DxCG/HCC models.
Retrospective (concurrent) models are generally used as an assessment tool or to make payment simulations. Examples are RxGroups in Germany, DxCG/HCC, and CRG in Canada-Quebec (43%), and DxCG in Chile (36.1%) (Cid, 2011).
Table 4: Predictive risk adjustment models results from selected models Data’s place and year Type of risk adjustment Prospective R2 Retrospective R2
Canada –Alberta
1998-00
ADG
CRG
DCG/HCC
7%
5%
9%
25%
31%
47%
Canada-Ontario
1988-00
Age-sex
ADG
CRG
DCG/HCC
2%
6%
6%
8%
2%
21%
31%
37%
Canada-Quebec
1988-00
Age-sex
ADG
CRG
DCG/HCC
4%
8%
12%
12%
4%
22%
43%
33%
Handbook of Global Health Economics and Public Policy
18
Table 4: Predictive risk adjustment models results from selected models Data’s place and year Type of risk adjustment Prospective R2 Retrospective R2
Germany 2001-02 Demographic RSA
ACG
ACG+PM
CDPS
DCG/HCC
PCG+DCG
RxGroups+IPHCC
6%
9%
12%
12%
15%
15%
24%
7%
14%
21%
19%
26%
30%
48%
USA, 1998-99 ACG
CDPS
DCG/HCC
Medical RX
RxGroups
RxRisk
ERG
9.9%
14.9%
15.4%
11.9%
13.2%
11.1%
14.8%
28.2%
35.5%
46.6%
24.4%
27.9%
21.3%
34.7%
Spain (Cataluña), 2006-2007
CRGs 38.2%
Chile 2001, 2007, 2008
DxCG with 2001 data
RxGroups
DxCG with 2007 data
36.1%
74.4%
40.0%
Sources: Ellis (2008) (Canada, Germany, and US); Cid (2011), Cid et al. (2010) and Ibern et al. (2008) (Chile); and Coderch et al. (2014) (Spain).
In the case of Chile, Table 4 includes several different studies: Cid (2011) examines risk adjustment between public and private health plans, (FONASA and ISAPREs, respectively) using DxCG; Cid and Salazar (2010) evaluate risk adjustment models to reallocate funds both among ISAPREs and also between ISAPREs and FONASA plans using data from 2007 using DxCG; Ibern et al. (2008) study a public sector population to consider risk adjusted per capita payment models using RxGroups for setting a budgetary ceiling for public health care services.
It should be noted that these studies refer to different populations and contexts. In the German case, it uses the entire social health insurance population and compensates risk between health plans; in the case of the US, it is used for allocations by Medicare, Medicaid, and the privately insured population. In Canada, they use territorial allocations for province health authorities’ populations and eventually PHC physicians.
4. RISK ADJUSTMENT WITH COMPETING HEALTH PLANS
In some countries where social security prevails over the national health system, risk adjustment is used in some level or phase of resource allocation. In some cases, countries use a per capita payment as a risk-adjusted subsidized premium allocated to the sickness fund or health plan, or as a way to allocate resources or global budgets for health provision between regions of countries or territories.
Handbook of Global Health Economics and Public Policy
19
4.1 Risk adjustment in social health insurance programs
4.1.1 Risk adjusted payments in risk equalization systems in Europe
During the 1990s, a number of European countries introduced or enforced competition between different social health insurance plans by abolishing regional monopolies of the plans and introducing or expanding plan choice for the insured. These countries accompanied the introduction of competition with mandatory open enrollment and with the implementation of risk adjustment (van de Ven et al., 2003).
With regard to the financial flow, two types of systems in which the risk adjustment mechanism is embedded can be observed: In the Netherlands, Belgium and Israel, a central health fund is established. In these countries, the insured pay solidarity contributions to the central health fund, the insurers receive risk adjusted capitation payments from the fund, and (in the Netherlands and Belgium), the insured pay sickness-fund-specific additional nominal premiums to their health insurer (Lamers et al., 2003; Schokkaert and van de Voorde, 2003); in Israel no additional premium is allowed, so the health plans have tight budgets imposed through the risk adjusted capitation payments (Shmueli et al., 2003). This model is called “external” risk adjustment in the terminology of van den Ven and Ellis (2000). On the other hand, in Switzerland, the insured pay the solidarity contribution to their sickness fund, and risk adjustment occurs between these insurers: payments flow from those with above average good risks (healthier enrollees) to those with above average bad risks (sicker enrollees) (Beck et al., 2003). This model is called “internal” risk adjustment, as the risk adjusted payments are within the health insurance system and not from a central fund “outside.” Germany in 2009 has switched from the internal to the external model (Göpffarth and Henke, 2013).
In all of these countries, risk adjustment started with age and gender as risk adjusters. Germany added an invalidity marker beginning in 1994, followed in 2001 by a variable for being registered in a disease management program as a proxy for morbidity (Buchner and Wasem, 2003); finally, in 2009, a model adding the use of diagnoses (based on the DCG model) and to a limited extent pharma-codes was implemented (Buchner et al., 2013). The Netherlands started risk adjustment in 1993, added region and source of income as variables in 1995, pharmacy-based cost groups and diagnostic based cost-groups in 2002 and 2004 (Lamers et al., 2003; van de Ven et al., 2007). They had further developments later on, among them making use of multiple-year high-cost groups since 2012, thus implementing a variable referring to the actual costs of the individual insured (van Kleef and van Vliet, 2012). Belgium started risk adjustment with, in addition to age and gender, a set of socio-economic variables like unemployment, mortality or urbanization – until 2002, these variables were used on the aggregate level of local sickness funds. However, since then, individual data became available and started being used (Schokkaert and van de Voorde, 2003). In 2006, Belgium added health status data, based on inpatient diagnoses and outpatient pharmacy prescriptions (van de Ven et al., 2007). Switzerland, until 2011, only used age and gender as variables, then they added information about whether the insured was hospitalized the year before (van de Ven et al., 2013). From 2016 onwards, a health status indicator based on past high expenditures for drugs will be added to the Swiss model. Israel has basically remained with its model in which only age and gender are used as risk adjusters; however, a variable for remoteness for those living in remote areas has been introduced in the meantime.
In the Netherlands and Germany, introduction of risk adjustment went along with an increase in the financial responsibility of the health plan. In the Netherlands, health plans traditionally were not risk-bearing entities, as differences between revenues and expenditures were financed from the outside through ex post compensation. In Germany, before the introduction of risk adjustment all expenditures for seniors were pooled and financed through ex post compensation. Today, in both countries, health plans have to carry their marginal costs when increasing expenditures. In contrast, in Belgium still today 92% of the differences between risk adjusted payments to health plans and their actual expenditures are compensated ex post (van de Ven et

Handbook of Global Health Economics and Public Policy
20
al., 2013). However in Switzerland, even before the introduction of risk adjustment, health plans had to carry full financial risk (Beck et al., 2003).
Also, in some countries of Eastern Europe, multi-payer systems have been established after the breakdown of the socialist systems. In the Czech Republic as well as in Slovakia, insured can choose between various health plans, and there is a risk adjustment mechanism implemented between the funds, adjusting for the different age structures of the plans’ memberships.
4.1.2 Risk adjustment in Latin America
In Latin America, there are some countries that explicitly use risk adjustment for resource allocation in a health coverage program. In Chile, there is a very small fund between ISAPREs for the Guarantee Scheme (GES). Cid et al. (2010) assessed that the fund is insufficient for risk adjustment because of the legal rigidity of certain parameters – used to determine its size and level of risk adjustment – and the small use of GES among ISAPREs. Hence, in the eight years this fund has existed, it has actually only worked as a pilot of risk adjusted payments by sex and age (Cid et al., 2010). In Colombia, risk-adjusted capitation – using sex and age – has been in place for 20 years to finance the Entidad Promotora de Salud (EPS) and Administradora del Regimen Subsidiado (ARS) (Ministry of Social Protection, 2011). Yet, the system has been criticized because of the differences between the subsidized and contributory schemes plans, benefits, per capitas and their adjustment that has only recently been equaled (Giedion and Cañón, 2014). It is argued that the differences in plans, when compared with European models with multiple health plans, generated greater segmentation in the system.
Recently, the Uruguayan health system has increasingly used risk adjustment to allocate FONASA’s resources to “mutuas” (HMO-type entities). The Uruguayan reform created a fund to which workers, enterprises and the state contribute, in order to pay providers on an adjusted per capita basis (using age and sex). Its implementation has been gradual since 2008. The health system has had favorable results related to the reform, which include increasing population covered, lowering the burden of out-of-pocket costs (giving Uruguay the lowest out-of-pocket expenditure in Latin America), and significantly increasing public spending in health (which reached 6% of GDP in 2012) (Oreggioni, 2013). These results place Uruguay as one of the few countries that are achieving WHO recommendations for middle-income countries to increase public expenditure in health and decrease out-of-pocket expenditure as part of the efforts towards universal coverage (WHO, 2010).
4.2 Risk adjustment in the secondary private insurance markets: The experience of Australia, Ireland, and South Africa
A large number of countries use or are contemplating the use of risk adjustment for equalizing payments among competing private health insurance funds, notably in settings where the public sector is the primary insurer and private insurance is secondary to this public sector. Because the secondary private insurance is voluntary, selection issues are potentially serious. In Australia, risk selection into the private insurance markets is countered by open enrollment, penalties for delaying purchase, and retrospective risk equalization between voluntary secondary insurance plans, which is based on the proportion of the population over age 65 and the percent of claimants with high costs in the previous four quarters (Milliman, 2015).
In Ireland, risk selection is countered by open enrollment, lifetime coverage, community rating and minimum benefits. Only age is currently used for risk equalization, although recent proposals suggest expansion to include gender and prospective, diagnosis-based health status measures (Milliman, 2015).
In South Africa, where risk selection is regulated via open enrollment, community rating, and prescribed minimum benefits for specific diseases, risk adjustment mechanisms for equalizing revenues have been explored using data from 2005, but not implemented (Milliman, 2015).
Handbook of Global Health Economics and Public Policy
21
4.3 Risk adjustment in the US Medicare Advantage program and the Health Insurance Marketplace
The US Medicare program, which is a national program that insures the elderly (over age 65) and disabled populations, was the earliest adoption of risk adjusted capitation payments in the US. The risk adjustment formulas, first started in 1972, have been updated approximately every four years. The earliest formula used age, gender, whether or not an individual was institutionalized (in a nursing home or long-term care facility), and whether the person was also eligible for Medicaid coverage due to having a low income or medical need. In 2000, Medicare implemented a prospective risk adjustment formula that used only the principal diagnoses from inpatient hospital stays during the prior year (Pope et al., 2000). This risk adjustment formula was modified in 2004 to start using diagnoses from all types of medical encounters, as long as the diagnoses are coded by clinicians (Pope et al., 2004). Both the transition from the demographic only model and from the inpatient diagnosis only models were phased in gradually over time, with payments during the transition periods (three years each) being a weighted average of the two risk adjustment formulas.
As discussed above in the classification systems section, in 2014 the US Department of Health and Human Services (HHS) introduced a further revised HCC system for use in redistributing funds among the competing health plans in the new Health Insurance Marketplace set up in each US state (Kautter et al., 2014a and 2014b). This program had enrolled more than 8 million Americans as of the end of 2014, and is being used to reallocate funds within each of 501 geographically defined risk rating areas. Since the program is using a retrospective payment approach, the results of this application are not yet available.
5. RISK ADJUSTMENT IN SINGLE PAYER SYSTEMS
Many countries use per capita resource allocation in the health sector, with models that seek equity in the distribution of financial resources, such as the British Resource Allocation Working Party (RAWP), which was practiced until 1989 and still is the most paradigmatic example of such an allocation formula. It was adapted for Scotland (Model Share Scotland), Wales and Northern Ireland. It also serves as the framework for payment allocation models in Canadian provinces, in Spain, Italy, and elsewhere, and is most commonly associated with the actuarial cells method.
5.1 National Health Service (NHS) or National Health Insurance System (NHIS)payments
In general, discussions of payment mechanisms refer to the payment distributed to a single and isolated provider, while payment systems usually refer to a network or Organized Delivery System (ODS), like NHS and NHIS.6 Health care provision happens in an environment of multiple providers that must act in coordination with each other. In this context, the system of incentives must take into account that health services are provided at different levels of care and that the level where services are performed should be the one with the greatest expected health
6 A National Health Service (NHS) system is one where the provision is public – there is no insurer or pooling of resources – and it’s financed based on general taxes. The resources collected and allocated to health are assigned to subnational levels – health authorities in charge of a pre-defined population – through distribution formulas based on health needs. Health coverage is universal and therefore there is a single national pool that distributes risks. Health service provision may be public or private (for-profit or not-for-profit), although it is more common for them to be public, while the private sector takes a more complementary role. A National Health Insurance System (NHIS) is a single fund pooling resources from social security contributions and general taxes and is also a single-payer. As in a national health system, health coverage is universal with a single national pool that distributes risks with solidarity in the funding and that reduces discrimination based on health risks. The provision of health services can be public and/or private, and for-profit or not-for-profit.
Handbook of Global Health Economics and Public Policy
22
gains (Shortell, 1996 and 2000). This type of payment system considers costs, access and quality of care provided at the appropriate level.
Health care coordination is defined as the coordination of health care interventions that are necessary for the patient, regardless of the provider, in order to reach a common goal. Health care coordination is focused on the interaction between providers, and when it reaches the highest level of coordination, it is considered integrated (Vázquez et al., 2012).
Health systems’ complexity has increased as a result of the increase in the number of available health care services due to a high level of specialization and ambulatory-based care. This has been a consequence of the technological change in health care and an increasing population with complex chronic diseases and co-morbidities, which is in turn linked to an aging population. These are issues that contribute to difficulty in coordinating care. To achieve coordination and combat fragmentation in health systems, many policies emphasize collaboration between providers instead of promoting direct competition – for example, the promotion and development of health service networks that include different types of providers and different levels of care in a specific area, so that access is hierarchical; that provide coordinated care across a continuum of services to a defined population; and that are responsible for patients’ costs and health outcomes. The main goals of such policies are to improve the overall efficiency and continuity of care in the health system, by way of an intermediate objective: improving the care coordination or achieving clinical integration.
A per capita payment system promotes coordination between different levels of care and decentralization with appropriate risk transfer. The risk transfer will be appropriate to the extent that the per capita payment is available for the network of providers and for all levels and according to its characteristics (for example, whether it is a risk-adjusted). Different payment mechanisms can coexist in an ODS: global budget, FFS, wages, per capita, etc. However, risk-adjusted per capita financing is one of the most powerful regulatory tools to promote integration across providers.
An adjusted per capita payment is considered a mixed payment system. It considers risk adjustment as a prospective characteristic based on past morbidity (and/or any other risk-adjuster) and recognizes retrospective cost structures or fixed costs that must be covered, as well as the effects in the current period of health planning in these structures. This is a payment mechanism that recognizes both what the provider “is” (the retrospective component associated with the planned costs of installed capacity) and what the provider “does” (the prospective component associated with interventions and risk).
Globally, there are per capita systems where the allocation of resources is defined based on areas, regions, authorities or health services that are associated with populations. It is defined as the amount of resources allocated for a person to receive health care at any necessary level for a specific period. The goal is to provide the necessary financing and resources to areas and health providers based on social determinants of health and the degree of inequality in the area in which they are located (Hernández-Aguado et al., 2012).
Many countries use per capita resource allocation in health, using models that seek equity in the distribution of financial resources, such as the British Resource Allocation Working Party (RAWP) which was practiced until 1989. Today, the UK uses a number of different formulas to allocate funds for hospitals, pharmaceuticals, and office-based care, and is seeking to balance existing expenditure patterns with needs arising especially from inequalities. Buck and Dixon (2013) provide a useful discussion of changes in the allocation formula over time, while Monitor and National Health Service (2014) describes the detailed new payment systems.
Table 5: Risk adjuster for per capita payments used in countries with health systems similar to NHS or NHIS
Country Type of system* Risk adjusters
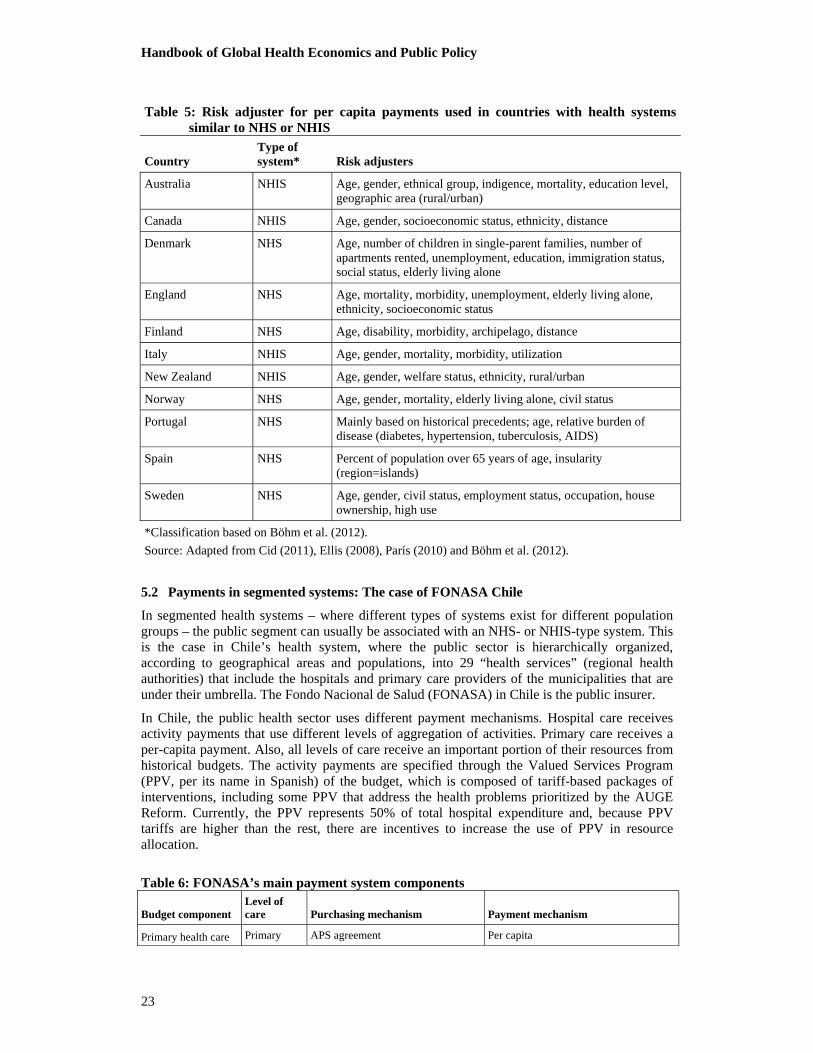
Handbook of Global Health Economics and Public Policy
23
Table 5: Risk adjuster for per capita payments used in countries with health systems similar to NHS or NHIS
Country Type of system* Risk adjusters
Australia NHIS Age, gender, ethnical group, indigence, mortality, education level, geographic area (rural/urban)
Canada NHIS Age, gender, socioeconomic status, ethnicity, distance
Denmark NHS Age, number of children in single-parent families, number of apartments rented, unemployment, education, immigration status, social status, elderly living alone
England NHS Age, mortality, morbidity, unemployment, elderly living alone, ethnicity, socioeconomic status
Finland NHS Age, disability, morbidity, archipelago, distance
Italy NHIS Age, gender, mortality, morbidity, utilization
New Zealand NHIS Age, gender, welfare status, ethnicity, rural/urban
Norway NHS Age, gender, mortality, elderly living alone, civil status
Portugal NHS Mainly based on historical precedents; age, relative burden of disease (diabetes, hypertension, tuberculosis, AIDS)
Spain NHS Percent of population over 65 years of age, insularity (region=islands)
Sweden NHS Age, gender, civil status, employment status, occupation, house ownership, high use
*Classification based on Böhm et al. (2012).
Source: Adapted from Cid (2011), Ellis (2008), París (2010) and Böhm et al. (2012).
5.2 Payments in segmented systems: The case of FONASA Chile
In segmented health systems – where different types of systems exist for different population groups – the public segment can usually be associated with an NHS- or NHIS-type system. This is the case in Chile’s health system, where the public sector is hierarchically organized, according to geographical areas and populations, into 29 “health services” (regional health authorities) that include the hospitals and primary care providers of the municipalities that are under their umbrella. The Fondo Nacional de Salud (FONASA) in Chile is the public insurer.
In Chile, the public health sector uses different payment mechanisms. Hospital care receives activity payments that use different levels of aggregation of activities. Primary care receives a per-capita payment. Also, all levels of care receive an important portion of their resources from historical budgets. The activity payments are specified through the Valued Services Program (PPV, per its name in Spanish) of the budget, which is composed of tariff-based packages of interventions, including some PPV that address the health problems prioritized by the AUGE Reform. Currently, the PPV represents 50% of total hospital expenditure and, because PPV tariffs are higher than the rest, there are incentives to increase the use of PPV in resource allocation.
Table 6: FONASA’s main payment system components
Budget component Level of care Purchasing mechanism Payment mechanism
Primary health care Primary APS agreement Per capita
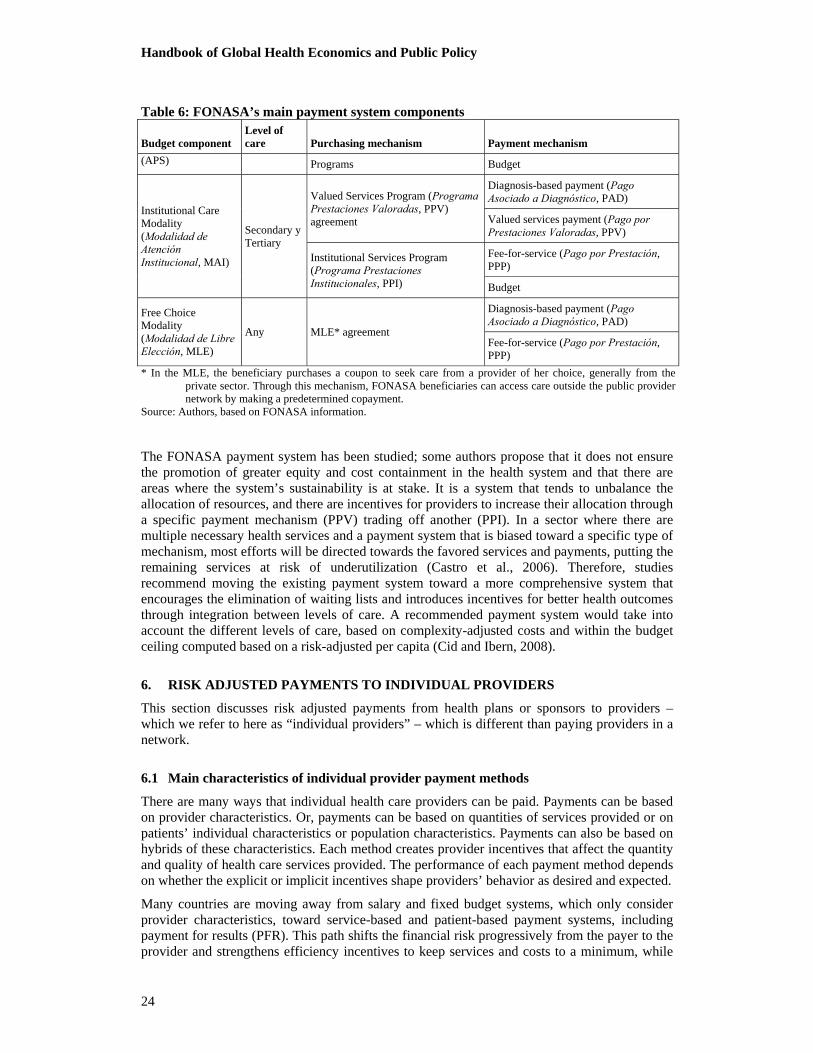
Handbook of Global Health Economics and Public Policy
24
Table 6: FONASA’s main payment system components
Budget component Level of care Purchasing mechanism Payment mechanism
(APS) Programs Budget
Institutional Care Modality (Modalidad de Atención Institucional, MAI)
Secondary y Tertiary
Valued Services Program (Programa Prestaciones Valoradas, PPV) agreement
Diagnosis-based payment (Pago Asociado a Diagnóstico, PAD)
Valued services payment (Pago por Prestaciones Valoradas, PPV)
Institutional Services Program (Programa Prestaciones Institucionales, PPI)
Fee-for-service (Pago por Prestación, PPP)
Budget
Free Choice Modality (Modalidad de Libre Elección, MLE)
Any MLE* agreement
Diagnosis-based payment (Pago Asociado a Diagnóstico, PAD)
Fee-for-service (Pago por Prestación, PPP)
* In the MLE, the beneficiary purchases a coupon to seek care from a provider of her choice, generally from the private sector. Through this mechanism, FONASA beneficiaries can access care outside the public provider network by making a predetermined copayment.
Source: Authors, based on FONASA information.
The FONASA payment system has been studied; some authors propose that it does not ensure the promotion of greater equity and cost containment in the health system and that there are areas where the system’s sustainability is at stake. It is a system that tends to unbalance the allocation of resources, and there are incentives for providers to increase their allocation through a specific payment mechanism (PPV) trading off another (PPI). In a sector where there are multiple necessary health services and a payment system that is biased toward a specific type of mechanism, most efforts will be directed towards the favored services and payments, putting the remaining services at risk of underutilization (Castro et al., 2006). Therefore, studies recommend moving the existing payment system toward a more comprehensive system that encourages the elimination of waiting lists and introduces incentives for better health outcomes through integration between levels of care. A recommended payment system would take into account the different levels of care, based on complexity-adjusted costs and within the budget ceiling computed based on a risk-adjusted per capita (Cid and Ibern, 2008).
6. RISK ADJUSTED PAYMENTS TO INDIVIDUAL PROVIDERS
This section discusses risk adjusted payments from health plans or sponsors to providers – which we refer to here as “individual providers” – which is different than paying providers in a network.
6.1 Main characteristics of individual provider payment methods
There are many ways that individual health care providers can be paid. Payments can be based on provider characteristics. Or, payments can be based on quantities of services provided or on patients’ individual characteristics or population characteristics. Payments can also be based on hybrids of these characteristics. Each method creates provider incentives that affect the quantity and quality of health care services provided. The performance of each payment method depends on whether the explicit or implicit incentives shape providers’ behavior as desired and expected.
Many countries are moving away from salary and fixed budget systems, which only consider provider characteristics, toward service-based and patient-based payment systems, including payment for results (PFR). This path shifts the financial risk progressively from the payer to the provider and strengthens efficiency incentives to keep services and costs to a minimum, while

Handbook of Global Health Economics and Public Policy
25
reaching the desired quality and health outcome goals. Shifting risk to the provider is often a reason for applying some variant of PFR at the margin, which does not base a provider’s entire revenue or income on results.
Table 7: Selected provider payment methods by main focus of incentive design
Payment locus
Individual provider (physicians, psychologist, nurses)
Primary health facility (group, health center, health post) Hospital
Provider Salary by specialty & experience
Flat capitation based population in catchment area
Fixed budget
Block grant
Global budget
Services Fee schedule
Pay-for-performance
Fee schedule
Fee-condition-on-quality
Cost based payment (staff salaries, lab material, and drugs)
Fee schedule
Fix payment per procedure
Per diem rate
Per admission
Individual patient
Health-based risk-adjusted capitation
Bonus per treated case
Per-member-per-month rate
Per-member rate risk-adjusted
Bonus per treated case
Bonus per target
Case-based payment
DRG
Inpatient DCG
Protocols compliance
Population Per-member-per-month rate
Per-member-per-month rate risk-adjusted
Budgeting for results
Bonus per coverage
Bonus per target
Diagnostic Cost Group
Source: Adapted from Ellis and Miller (2008) and Musgrove (2011).
6.1.1 Providers’ characteristics and incentives
Payments to providers may depend on the provider’s own characteristics. For example, doctors can be paid a salary according to their experience and specialty, regardless (at least from a short-term perspective) of how many or which patients they see and regardless of what services they provide. Similarly, in many countries hospitals receive “block grants.” Block grants are budgets based on hospital size or type without explicit regard to the number or type of patients seen or the services provided. Many public hospitals around the world receive annual budgets adjusted for the number of beds, with again no direct relationship to the number or type of patients. Some of the incentives associated with annual budgets include risk selecting patients, under providing care, and even reducing quality of care to reduce costs.
6.1.2 Quantity of services and incentives
Payments for specific services or procedures – such as a patient consultations, immunizations, or surgical procedures – are issued retrospectively, after the services are provided, and are paid according to the quantity of services given. These FFS payment systems can either allow the provider or the payer to set fee levels. Fee schedules set by the payer are the most common form of reimbursement for doctors. Under this system, if a health facility is responsible for purchasing the inputs (e.g., staff salaries, lab materials and drugs) and the fee for an additional

Handbook of Global Health Economics and Public Policy
26
service exceeds the marginal cost of delivery, then providers face a financial incentive to deliver as many services as possible.
On the other hand, there are some innovative modifications of FFS aimed at linking these incentives to results and reining in overutilization. For example, some FFS payments are conditional on quality of care, that is, health care providers are paid for delivering services that follow explicit protocols and conform to specific quality norms, with a system of inspection and auditing to assure compliance and to raise quality where necessary. This type of payment is known as results-based financing (RBF) (Musgrove, 2011). Another example is the CMS Physician Feedback/Value-Based Payment Modifier Program that gathers comparative performance information for adjusting the Medicare FFS physician fee.
6.1.3 Patients’ characteristics, risk adjustment and incentives
Another option is that provider payments can be designed based on patient characteristics. Patient characteristics might refer to a simple count of the number of beneficiaries, to patient demographic characteristics, to socioeconomic status, or to the patient’s health conditions. Diagnostic related groups (DRGs) are one example of a payment system mostly defined by patient characteristics, in this case the patient’s diagnosis.
If a provider assumes responsibility for all the care a patient may need during an interval of time, ranging from a month to a year, even for several health conditions, and is paid a fixed amount for providing that care, then the payment method is called capitation. The Oregon Alternative Payment Methodology (APM) demonstration project in the US is one example of a capitated payment methodology, where participating community health centers (CHCs) no longer earned revenue based on the number of individual patients seen, but instead received a monthly payment based on the size and composition of their patient populations (Hostetler et al., 2015). Also, general practitioners in a number of countries (e.g., the Netherlands and England) are primarily paid by risk-adjusted capitation for registered patients. Ultimately, the capitation fee may be risk-adjusted for the health conditions of a patient or other patient characteristics. This means that the provider will receive a higher-than-average capitation for a sicker patient than for a healthier one. Under this scenario, a physician’s gross income depends upon both the total number of patients and the characteristics of the patients he cares for. The physician’s income does not depend on the type of provider administering the service, nor on the type or the quantity of services provided. As in the previous case, the incentives of flat capitation systems are to reduce costs per patient, risk select patients, overuse referrals, and on the positive side increase preventive care.
6.1.4 Patients’ characteristics, risk adjustment and pay-for-performance (P4P)
Rewarding providers for high performance is another payment approach for aligning provider incentives with patient and population welfare. These payment mechanisms potentially include performance bonuses to providers for extending service to additional beneficiaries. P4P payments could also incentivize increasing certain types of services (e.g., preventive care, immunizations, etc.) if these are linked to higher payments. They can also incentivize either process outcomes (i.e., adherence to evidence-based protocols), and/or health outcomes (i.e., decreasing maternal mortality ). Meaningful and verifiable measures of results are an essential component of this method of payment. Many arrangements are possible. The ideal is perhaps for verification to be undertaken by a neutral third party, even if the principal pays the corresponding costs. Another important component is ‘attributional validity’ – the evidence that observed outcome differences relate directly to quality of provider’s care rather than to other contributing factors not under the control of healthcare providers. To maximize the fairness of P4P measures, risk adjustment may need to be considered (Iezzoni, 2009).
6.1.5 Refining incentives and hybrid payments
Since no single form of health care payment is without drawbacks, and there is always a possibility for perverse incentives (overproduction or underproduction of services), mixed
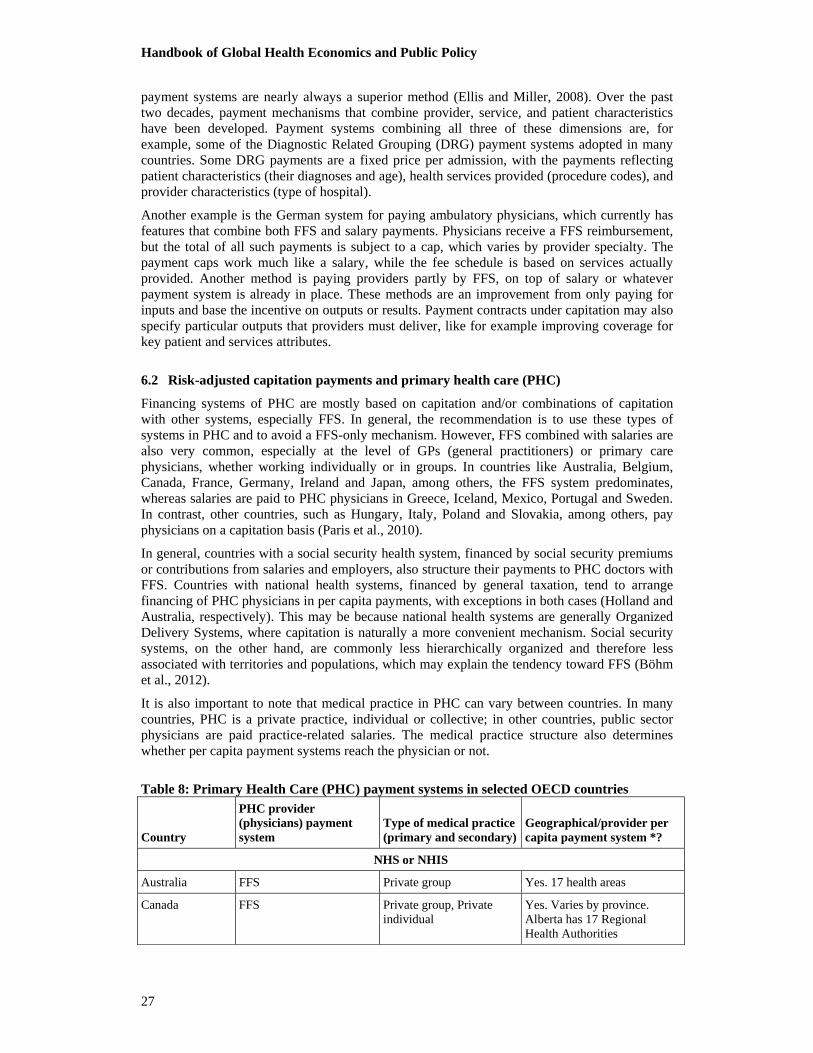
Handbook of Global Health Economics and Public Policy
27
payment systems are nearly always a superior method (Ellis and Miller, 2008). Over the past two decades, payment mechanisms that combine provider, service, and patient characteristics have been developed. Payment systems combining all three of these dimensions are, for example, some of the Diagnostic Related Grouping (DRG) payment systems adopted in many countries. Some DRG payments are a fixed price per admission, with the payments reflecting patient characteristics (their diagnoses and age), health services provided (procedure codes), and provider characteristics (type of hospital).
Another example is the German system for paying ambulatory physicians, which currently has features that combine both FFS and salary payments. Physicians receive a FFS reimbursement, but the total of all such payments is subject to a cap, which varies by provider specialty. The payment caps work much like a salary, while the fee schedule is based on services actually provided. Another method is paying providers partly by FFS, on top of salary or whatever payment system is already in place. These methods are an improvement from only paying for inputs and base the incentive on outputs or results. Payment contracts under capitation may also specify particular outputs that providers must deliver, like for example improving coverage for key patient and services attributes.
6.2 Risk-adjusted capitation payments and primary health care (PHC)
Financing systems of PHC are mostly based on capitation and/or combinations of capitation with other systems, especially FFS. In general, the recommendation is to use these types of systems in PHC and to avoid a FFS-only mechanism. However, FFS combined with salaries are also very common, especially at the level of GPs (general practitioners) or primary care physicians, whether working individually or in groups. In countries like Australia, Belgium, Canada, France, Germany, Ireland and Japan, among others, the FFS system predominates, whereas salaries are paid to PHC physicians in Greece, Iceland, Mexico, Portugal and Sweden. In contrast, other countries, such as Hungary, Italy, Poland and Slovakia, among others, pay physicians on a capitation basis (Paris et al., 2010).
In general, countries with a social security health system, financed by social security premiums or contributions from salaries and employers, also structure their payments to PHC doctors with FFS. Countries with national health systems, financed by general taxation, tend to arrange financing of PHC physicians in per capita payments, with exceptions in both cases (Holland and Australia, respectively). This may be because national health systems are generally Organized Delivery Systems, where capitation is naturally a more convenient mechanism. Social security systems, on the other hand, are commonly less hierarchically organized and therefore less associated with territories and populations, which may explain the tendency toward FFS (Böhm et al., 2012).
It is also important to note that medical practice in PHC can vary between countries. In many countries, PHC is a private practice, individual or collective; in other countries, public sector physicians are paid practice-related salaries. The medical practice structure also determines whether per capita payment systems reach the physician or not.
Table 8: Primary Health Care (PHC) payment systems in selected OECD countries
Country
PHC provider (physicians) payment system
Type of medical practice (primary and secondary)
Geographical/provider per capita payment system *?
NHS or NHIS
Australia FFS Private group Yes. 17 health areas
Canada FFS Private group, Private individual
Yes. Varies by province. Alberta has 17 Regional Health Authorities
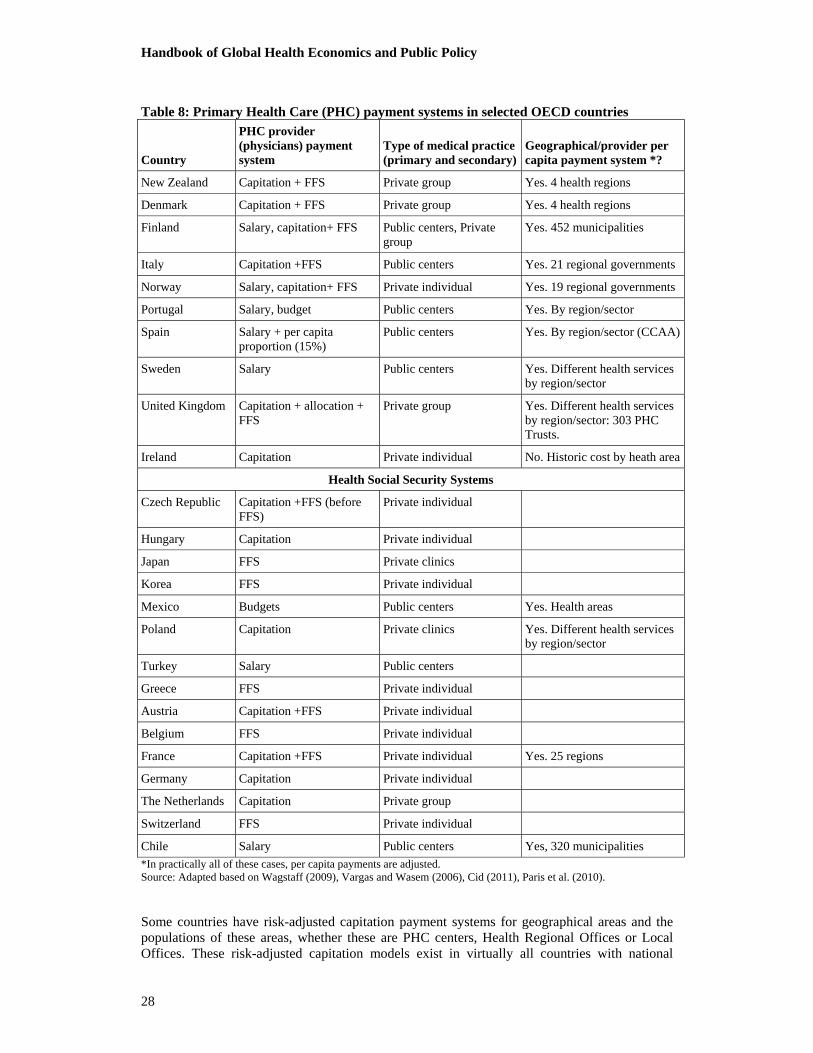
Handbook of Global Health Economics and Public Policy
28
Table 8: Primary Health Care (PHC) payment systems in selected OECD countries
Country
PHC provider (physicians) payment system
Type of medical practice (primary and secondary)
Geographical/provider per capita payment system *?
New Zealand Capitation + FFS Private group Yes. 4 health regions
Denmark Capitation + FFS Private group Yes. 4 health regions
Finland Salary, capitation+ FFS Public centers, Private group
Yes. 452 municipalities
Italy Capitation +FFS Public centers Yes. 21 regional governments
Norway Salary, capitation+ FFS Private individual Yes. 19 regional governments
Portugal Salary, budget Public centers Yes. By region/sector
Spain Salary + per capita proportion (15%)
Public centers Yes. By region/sector (CCAA)
Sweden Salary Public centers Yes. Different health services by region/sector
United Kingdom Capitation + allocation + FFS
Private group Yes. Different health services by region/sector: 303 PHC Trusts.
Ireland Capitation Private individual No. Historic cost by heath area
Health Social Security Systems
Czech Republic Capitation +FFS (before FFS)
Private individual
Hungary Capitation Private individual
Japan FFS Private clinics
Korea FFS Private individual
Mexico Budgets Public centers Yes. Health areas
Poland Capitation Private clinics Yes. Different health services by region/sector
Turkey Salary Public centers
Greece FFS Private individual
Austria Capitation +FFS Private individual
Belgium FFS Private individual
France Capitation +FFS Private individual Yes. 25 regions
Germany Capitation Private individual
The Netherlands Capitation Private group
Switzerland FFS Private individual
Chile Salary Public centers Yes, 320 municipalities
*In practically all of these cases, per capita payments are adjusted. Source: Adapted based on Wagstaff (2009), Vargas and Wasem (2006), Cid (2011), Paris et al. (2010).
Some countries have risk-adjusted capitation payment systems for geographical areas and the populations of these areas, whether these are PHC centers, Health Regional Offices or Local Offices. These risk-adjusted capitation models exist in virtually all countries with national
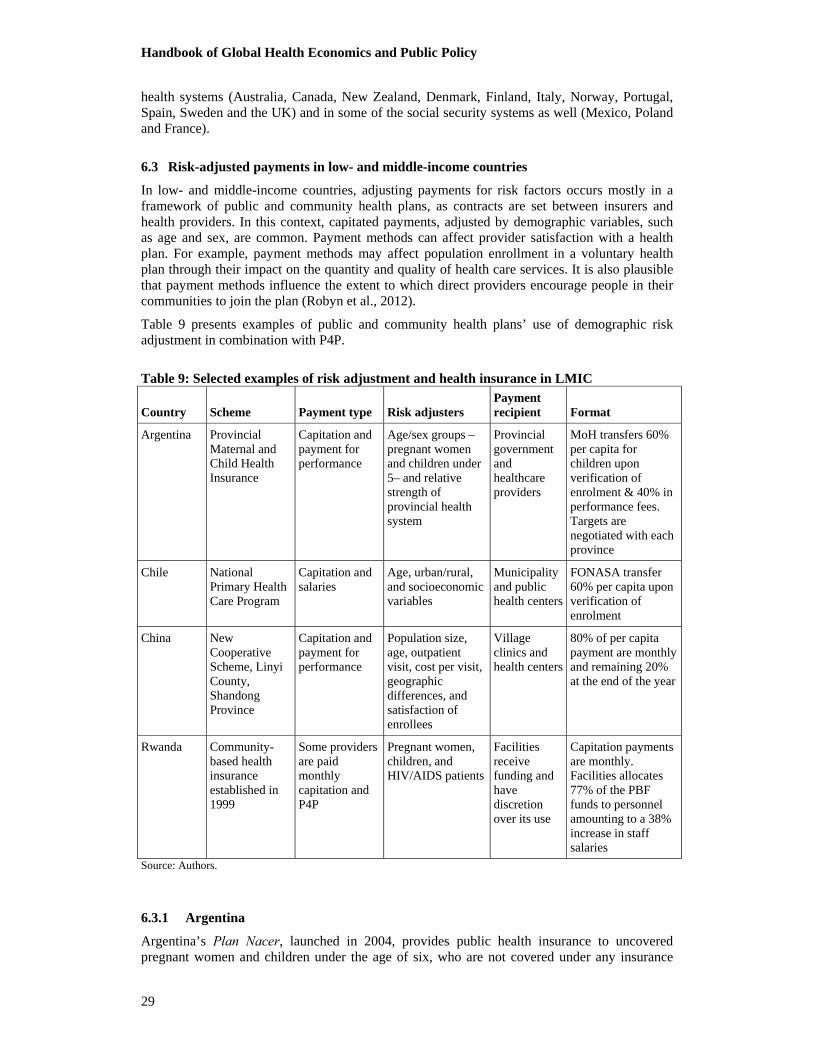
Handbook of Global Health Economics and Public Policy
29
health systems (Australia, Canada, New Zealand, Denmark, Finland, Italy, Norway, Portugal, Spain, Sweden and the UK) and in some of the social security systems as well (Mexico, Poland and France).
6.3 Risk-adjusted payments in low- and middle-income countries
In low- and middle-income countries, adjusting payments for risk factors occurs mostly in a framework of public and community health plans, as contracts are set between insurers and health providers. In this context, capitated payments, adjusted by demographic variables, such as age and sex, are common. Payment methods can affect provider satisfaction with a health plan. For example, payment methods may affect population enrollment in a voluntary health plan through their impact on the quantity and quality of health care services. It is also plausible that payment methods influence the extent to which direct providers encourage people in their communities to join the plan (Robyn et al., 2012).
Table 9 presents examples of public and community health plans’ use of demographic risk adjustment in combination with P4P.
Table 9: Selected examples of risk adjustment and health insurance in LMIC
Country Scheme Payment type Risk adjusters Payment recipient Format
Argentina Provincial Maternal and Child Health Insurance
Capitation and payment for performance
Age/sex groups –pregnant women and children under 5– and relative strength of provincial health system
Provincial government and healthcare providers
MoH transfers 60% per capita for children upon verification of enrolment & 40% in performance fees. Targets are negotiated with each province
Chile National Primary Health Care Program
Capitation and salaries
Age, urban/rural, and socioeconomic variables
Municipality and public health centers
FONASA transfer 60% per capita upon verification of enrolment
China New Cooperative Scheme, Linyi County, Shandong Province
Capitation and payment for performance
Population size, age, outpatient visit, cost per visit, geographic differences, and satisfaction of enrollees
Village clinics and health centers
80% of per capita payment are monthly and remaining 20% at the end of the year
Rwanda Community-based health insurance established in 1999
Some providers are paid monthly capitation and P4P
Pregnant women, children, and HIV/AIDS patients
Facilities receive funding and have discretion over its use
Capitation payments are monthly. Facilities allocates 77% of the PBF funds to personnel amounting to a 38% increase in staff salaries
Source: Authors.
6.3.1 Argentina
Argentina’s Plan Nacer, launched in 2004, provides public health insurance to uncovered pregnant women and children under the age of six, who are not covered under any insurance
Handbook of Global Health Economics and Public Policy
30
(The World Bank, 2013). Plan Nacer uses an innovative combination of capitated assignment and pay-for-performance. Risk adjustment is based on age and gender groups and the relative strength of the provincial health system. Target indicators for performance are negotiated annually; this is a crucial feature of the program because it allows a province with a weaker health system to aim for a lower target than better-off provinces. The funds flow from the provinces to the contracted healthcare providers (public or private), and up to half can be used to pay incentives to staff. The progress of the program is monitored by internal audits that verify the work performed and by independent auditors who submit regular reports to the National Ministry of Health (IEG, 2011)
6.3.2 Chile
In 1995, the Ministry of Health of Chile introduced capitation at the primary health care level. The Ministry of Health allocates a prospective capitation rate for all registered beneficiaries. The rate covers the administrative costs, pharmaceuticals and salaries for the health care personnel. The formula includes an age adjustor, as well as socioeconomic adjustors (geographic location of the health centers and income level of the municipality). An example of age, location, and socioeconomic adjusters would be a health center located in a rural area receiving an upward adjustment of 20% and a poor municipality an upward adjustment of 18% (Vargas and Wasem, 2006). The per capita covers, on average, 70% of expenditures, and the remainder is covered by budgets of specific programs.
6.3.3 China
The New Rural Cooperative Medical Scheme (NRCMS) has been providing basic health security for rural residents in China since 2003. The central government encourages city and local governments to design their own schemes and pilot programs. Meanwhile, in the primary care sector of China, experiments are in progress in which capitation, global budget, or salary are combined with pay-for-performance to improve quality and to encourage providers to practice prevention and management of chronic illnesses. During 2006-2009, Qianjiang province introduced capitation and pay-for-performance. The reform was expected to eliminate incentives for overprescribing and prescribing expensive medicine, and thus to help contain surging medical costs. Yip et al. (2010), in collaboration with the government of Ningxia Province, a predominantly rural area in northwest China, conducted a matched-pair cluster-randomized experiment between 2009 and 2012. The aim of the study was to evaluate the effects of capitation with pay-for-performance on primary care providers’ antibiotic prescribing practices, health spending, outpatient visit volume, and patient satisfaction. Some evidence was found that certain types of provider payment (capitation, salary plus performance bonus) can lead to efficiency gains and can contribute to improved community-based insurance performance in developing countries.
6.3.4 Rwanda
Rwanda’s community-based health insurance program was established by the government and pays a monthly capitation amount to partner health centers based on the number of registered insured. Additionally, providers are rewarded for providing services to pregnant women and children, such as prenatal care visits, immunizations for children and pregnant women, institutional deliveries, and HIV testing. Incentive payments are offered for each of these services provided and are weighted using overall quality scores. This set of incentives motivated providers to increase delivery of contracted services. Researchers found that the program increased institutional delivery rates by 23% and preventive service use among children under age 4 by 25%-50% (Basinga et al., 2011).

Handbook of Global Health Economics and Public Policy
31
7. DISCUSSION: RISK-ADJUSTED PAYMENTS AND IMPROVING EFFICIENCY AND EQUITY
Health care insurance and provider payment systems are constantly changing, and they vary across countries and scenarios, but they share the same goal of trying to increase efficiency, improve fairness and promote high quality, cost effective health care. Unfortunately, as Joseph Newhouse (1996) has identified, plan and provider payment systems that create attractive incentives for efficient production may create incentives for risk selection that create new problems for efficiency, access and quality. Risk adjustment is an important tool for offsetting risk selection, but it remains imperfect and in need of further refinement and research.
A central theme of this article is the tradeoff between selection and incentives. Just because cost-based reimbursement and retrospective payments often create too little incentive for cost containment does not mean that one should go to the other extreme and use a fully prospective payment system. It can be attractive to aim instead for a mixed system that includes retrospective and prospective factors. Retrospective characteristics address the risk selection problem while prospective characteristics provide incentives for efficiency. The best combination of both will depend on specific contexts. An important part of the context is whether health care provision is based on provider networks designed to cover certain populations. A new concern and goal is that the payment system achieve planned or desired health outcomes.
The optimal risk adjustment is one that reflects the expected costs of the provider for the health care needs of the population so that incentives are aligned properly to reach desired levels of quality in health services, efficiency and to avoid risk selection. The ability to more closely predict providers’ expected costs is linked to having the relevant morbidity information for patients served. The increasing use of morbidity information has taken sponsor estimates closer to providers’ expected costs, significantly improving incentives and outcomes as a result.
Health economics has adapted microeconomic tools that are applied in the development of risk-adjustment methodologies. Although there is still a long way to go, there have been important milestones in the evolution of payment systems, with the central design for these systems aimed at responding to populations’ health needs.
7.1 Specific discussions
7.1.1 Using need rather than illness-based indicators
Risk adjustment payment models traditionally focus on payments that reflect health status variation, but demographic factors such as education, income and access can also affect health care needs. More problematic is that supply side availability also affects utilization, while many feel that increased supply should not automatically enable increased payments. A major problem of measuring health needs is the difficulty obtaining direct measures of the need for care. This is generally done using utilization as an indirect measurement. However, this utilization depends on the available level of supply. For example, if there is oversupply, there is induced demand regardless of actual health needs. The opposite may also be true where demand is limited by a lack of existing supply creating access problems. The latter is very common in developing countries. Differences in provider policies may also affect the level of use, which may lead to an incorrect perception of differences in need. When the efficient levels are unknown, this can often be problematic. In some settings, satisfied demand is the closest concept to health need that can be estimated using available data.
7.1.2 Using past expenditures
Health expenditures in a year are often highly correlated with spending in the previous year. Therefore, it is common to use lagged spending to predict future spending, and even to use this as a payment model. Some budgeted systems increase future spending nearly in proportion to the magnitude of lagged amount. If the incremental revenue from spending money in a year has
Handbook of Global Health Economics and Public Policy
32
too much effect on future revenue, it can generate perverse incentives that work against efficiency and cost containment. It can also be unfair, if differences in health spending between two providers or regions are due not only to differences in health status and illness but also due to different medical practices. Thus, if two providers treat people of similar severity with different procedures, using payments based on past expenditures tends to reward the provider who spends more and punish the provider that is most efficient. Basing payments in part on some lagged spending measure is a very simple way to implement a desirable mixed payment system, but bundled payments using something other than lagged spending is needed to avoid perverse incentives.
7.1.3 Conventional versus optimal risk adjustment
Glazer and McGuire, since 2000, have developed an alternative framework to conventional risk adjustment that is only just beginning to be incorporated in international payment systems. In their framework, conventional retrospective and prospective risk adjustment models do not completely solve the risk selection problem, because they remain imperfect, and selection problems can still be serious. They propose a framework for implementing optimal risk adjustment formulas, in which, despite only using prospective information, the weight given to each explanatory variable is not determined by regression analysis, but instead is chosen to maximize efficiency and quality in the provision of services. In order to maximize efficiency, the weights are selected to minimize the variance between premiums and expected costs (in a context of competing health plans). Further elaboration of optimal risk adjustment is found in Breyer et al. (2011) The access problem to health plans created by risk selection is minimized once it has guaranteed an efficient level of quality in service provision (García Goñi, 2006). The criticism of conventional risk adjustment, and cell and regression models in particular, is that they do not base calculations on previously established parameters to reach optimal situations.
7.2 Concluding thoughts and remaining challenges
As mentioned in the introduction, two key health policy concerns are efficiency and equity. The efficient allocation of resources in health optimally distributes resources within health care systems maximizing gains in social welfare and health status improvements (reduction in morbidity and mortality). An equitable allocation reduces differences in health care access, utilization, and ultimately of health status, across groups or regions, for example, by allocating more resources where there are greater health needs, in order to increase the availability of services and quality of care. Hereby, the payment system plays an important role in the goal of achieving greater efficiency, and to the extent it also considers health care needs, it may also achieve greater equity. The policy questions that this chapter addresses are: Which are the payment mechanisms used in different countries and health systems? What are the alternative risk adjustment tools and how do they vary between the different health care systems? Does risk adjustment account for the differences across regions, demography, epidemiology, socioeconomic variables, health status, etc. between groups? What variables are being used to make these adjustments?
The overview presented in this chapter has tried to summarize both the theory and the practice of risk adjustment payment methods. This has required a broad view, considering not only risk adjusted capitation payments between competing health plans, but also risk adjustment as a budget allocation tool for regional budgeting in single payer systems. Bundled payment can be used not only to allocate funds between health plans, but also to pay providers, such as hospitals and primary care practices. Both prospective and retrospective prediction models are currently being used, and yet comprehensive research evaluating their advantages and disadvantages is still lacking. The review of how risk adjustment can be used in practice is only of many possible ways that payment calculations can be made, and further work is needed to evaluate alternative approaches, both for their statistical fit as well as for their incentive properties. Risk adjustment is only one tool for combating risk selection, and other mechanisms – such as premium
Handbook of Global Health Economics and Public Policy
33
structures, reinsurance, and provider risk sharing are further alternatives that deserve greater attention.
This article has briefly reviewed both developed and developing countries in its analysis. The rich set of payment innovations implemented in middle and lower income countries appears not to have been systematically reviewed previously from the perspective of risk adjustment, but calls out for further examination and study. The cost savings and quality consequences of different payment systems and risk adjustment methods also could benefit from further study. Many different types of information are being used, and there are growing concerns about some of this information being gameable, or readily manipulated to the advantage of the fund recipients. This is another example of an area deserving of further research. Finally, this article has not concentrated the analysis on issues of fairness and equity, which are an important motivation for risk adjusted payments in many settings. Further developments in this direction are also very important.
Handbook of Global Health Economics and Public Policy
34
8. References
Ash, A.S. and Ellis, R.P. (2012). Risk-adjusted Payment and Performance Assessment for Primary Care. Medical Care, 50(8), pp.643-653.
Ash, A.S., Ellis, R.P., Pope, G.C., Ayanian, J.Z., Bates, D.W., Burstin, H., Iezzoni, L.I., McKay, E.M., Yu, W. (2000). Using diagnoses to describe populations and predict costs. Health Care Financing Review, 21(3), pp.7-28.
Ash, A.S., Porell, F.W., Gruenberg, L., et al. (1989). Adjusting Medicare capitation payments using prior hospitalization data. Health Care Financing Review, 10, 17-29.
Basinga, P., Gertler, P.J., Binagwaho, A., Soucat, A., Sturdy, J. and Vermeersch, C.MJ. (2011). Effect on maternal and child health services in Rwanda of payment to primary health-care providers for performance: an impact evaluation. The Lancet, 377(9775), pp.1421-1428.
Beck, K., Spycher, S., Holly, A. and Gardiol, L. (2003). Risk adjustment in Switzerland. Health Policy, 65(1), pp.63-74.
Berlinguet, M, Preyra C, and Dean, S. (2005) Comparing the value of three main diagnosis based risk adjustment systems (DBRAS). Canadian Health Services Research Foundation (CHSRF) report.
Bing L, Evans D, Faris P, Dean S, and Quan, H. (2008) Risk adjustment performance of Charlson and Elixhauser comorbidities in ICD-9 and ICD-10 administrative databases. BMC Health Serv Res. 2008; 8: 12.
Böhm, K, Schmid A, Götze R, Landwehr C, Rothgang H (2012) Classifying OECD Healthcare Systems: A Deductive Approach (TranState Working Papers, 165) Bremen: Sfb 597, Staatlichkeit im Wandel”, 2012 ISSN 1861-1176
Breyer, F., Bundorf, K.M., and Pauly, M.V. (2011). Health Care Spending Risk, Health Insurance, and Payment to Health Plans. In: M. Pauly, T. McGuire and P. Barros, ed., 1st ed. Amsterdam: North Holland, Elsevier, pp.691-762.
Buchner, F. and Wasem, J. (2003). Needs for further improvement: risk adjustment in the German health insurance system. Health Policy, 65(1), pp.21-35.
Buchner, F., Göpffarth, D. and Wasem, J. (2013). The new risk adjustment formula in Germany: Implementation and first experiences. Health Policy, 109(3), pp.253-262.
Buck, D., and Dixon A. (2013) Improving the allocation of health resources in England. The Kings Fund.
Castro R, Cid C, Román A, Butala N. (2006) “Changing Health Care Provider Incentives to Promote Prevention: The Chilean Case”. Harvard Health Policy Review, Vol 7, N°2, Fall 2006, pages 102-112.
Charlson, M.E.; Pompei, Peter; Ales, K.L.; MacKenzie, C.R. (1987). "A new method of classifying prognostic comorbidity in longitudinal studies: Development and validation". Journal of Chronic Diseases 40 (5): 373–83.
Cid C, (2011). “Diagnoses-Based Risk Adjusted Capitation Payments for Improving Solidarity and Efficiency in the Chilean Health Care System: Evaluation and Comparison with a Demographic Model”. Department of Economics, Institute of Business and Economics Studies, Institute for Health Care Management, University of Duisburg Essen, Germany. http://duepublico.uni-duisburg-essen.de/servlets/DocumentServlet?id=25690
Cid C, P. Ibern (2008) “Regulación del financiamiento a Hospitales: ‘yardstick competition’ aplicada a los hospitales públicos en Chile”. Cuad. méd.-soc.(Santiago de Chile) 48 (3), 155-164

Handbook of Global Health Economics and Public Policy
35
Cid C; Muñoz A, Sánchez M, Tegtmeier R (2006). “Fondo de ajuste de riesgo en el sistema isapre”. Superintendencia de salud, 2006. http://www.supersalud.gob.cl/documentacion/569/articles-3902_recurso_1.pdf
Cid, C., Salazar, E. (2010). Ajuste de riesgos usando los DxCG: algunas alternativas para mejorar el diseño de un Fondo de Compensación Solidario entre Isapres. Documento de trabajo del Departamento de estudios y desarrollo de la Superintendencia de Salud, Febrero de 2010. http://www.supersalud.gob.cl/documentacion/569/articles-5765_recurso_1.pdf
Coderch, J., Sánchez-Pérez I, Ibern P, Carreras M, Pérez-Berruezo X and Inoriza JM (2014) “Predicción del riesgo individual de alto coste sanitario para la identificación de pacientes crónicos complejos.” Gac Sanit. 2014;28(4):292–300
Dang, D. K., Pont, J. M. & Portnoy, M. A. 1996a. Episode treatment groups: an illness classification and episode building system--Part I. Med Interface, 9, 118-22.
Dang, D. K., Pont, J. M. & Portmoy, M. A. 1996b. Episode treatment groups: an illness classification and episode building system--Part II. Med Interface, 9, 122-8.
Decarolis, F. (2015). Medicare Part D: Are Insurers Gaming the Low Income Subsidy Design?. The American Economics Review.
Dixon, J., Smith, P., Gravelle, H.S.E., Martin, S., Bardsley, M., Rice, N., Georghiou, T., Dusheiko, M.A., Billings, J., Lorenzo, M. and Sanderson, C. (2011). A person based formula for allocating commissioning funds to general practices in England: development of a statistical model. BMJ, 343(nov22 1), pp.d6608-d6608.
Eira C, & Ortún V. (2012). “Incentivos financieros en la mejora de la calidad asistencial”. Informe SESPAS 2012. Gac Sanit. 2012. doi:10.1016/j.gaceta.2011.11.006.
Elixhauser A, Steiner C, Harris DR, Coffey RM. (1998) Comorbidity measures for use with administrative data. Med Care. 36:8–27. doi: 10.1097/00005650-199801000-00004
Ellis, R. P. & Miller, M.M. (2008). Provider payment methods and incentives. In: K. Heggenhougen, ed., Encyclopedia of public health, 1st ed. San Diego: Academic Press, pp.322-329.
Ellis, R.P. (2008). Risk adjustment in health care markets: concepts and applications. In: M. Lu and E. Jonnson, ed., Financing Health Care: New Ideas for a Changing Society, 1st ed. Weinheim, Germany: Wiley-VCH.
Ellis, R.P. and Ash, A.S. (2012). Payments in Support of Effective Primary Care for Chronic Conditions. Nordic Economic Policy Review, 2, pp.191-210.
Ellis, R.P. and Fernandez, J.G. (2013). Risk Selection, Risk Adjustment and Choice: Concepts and Lessons from the Americas. IJERPH, 10(11), pp.5299-5332.
Ellis, R.P., Fiebig, D.G., Johar, M., Jones, G. and Savage, E. (2013). Explaining Health Care Expenditure Variation: Large-Sample Evidence Using Linked Survey and Health Administrative Data. Health Econ., 22(9), pp.1093-1110.
Ellis, R.P., Pope, G.C., Iezzoni, L.I., Ayanian, J.Z., Bates, D.W., Burstin, H. and Ash, A.S. (1996). Diagnosis-Based Risk Adjustment for Medicare Capitation Payments. Health Care Financing Review, 12(3), pp.101-128.
García Goñi M. (2006). Ajuste de riesgo en los mercados sanitarios. En: Ibern P, editor. Integración asistencial: fundamentos, experiencias y vías de avance. Barcelona: Masson; 2006. p. 187-208.
Giedion, U. Cañón, O. (2014). Colombia: el Plan Obligatorio de Salud. En: Giedion U, Bitrán R, Tristao L, Editores. Planes de Beneficios de Salud en América Latina. Una comparación regional. BID, Washington DC, mayo 2014.
Handbook of Global Health Economics and Public Policy
36
Glazer, J. and McGuire, T.G. (2000). Optimal Risk Adjustment in Markets with Adverse Selection: An Application to Managed Care. American Economic Review, 90(4), pp.1055-1071.
Glazer, J., McGuire, T.G. and Shi, J. (2014). Risk Adjustment of Health Plan Payments to Correct Inefficient Plan Choice from Adverse Selection. National Bureau of Economic Research Working Paper No. 19998.
Göpffarth, D. and Henke, K.D. (2013). The German Central Health Fund—Recent developments in health care financing in Germany. Health Policy, 109(3), pp.246-252.
Gravelle, H, Dusheiko, M, Martin, S, Smith, P, Rice, N, and Dixon J. (2011) Modeling Individual Patient Hospital Expenditures for General Practice Budgets. CHE Reseach Paper 73.
Hernández-Aguado, Santaolaya M, Campos P. (2012). “Las desigualdades sociales en salud y la atención primaria”. Informe SESPAS, 2012. Gac Sanit. 2012. doi:10.1016/j.gaceta.2011.09.03.
Hostetler, C., Sisulak, L., Cottrell, E., Arkind, J. and Likumahuwa, S. (2015). Origins In Oregon: The Alternative Payment Methodology Project. [online] Health Affairs Blog. Available at: http://healthaffairs.org/blog/2014/04/14/origins-in-oregon-the-alternative-payment-methodology-project/ [Accessed 25 Jan. 2015].
Ibern P, Ortún V, Meneu R, García-Goñi M. (2008) “Sistema de asignación poblacional de recursos. Informe para MINSAL – FONASA”. Centre de Recerca e Economia i Salut Universitat Pompeu Fabra.
Ibern P, Ortún V, Meneu R, García-Goñi M. (2008) “Sistema de pago de los egresos hospitalarios”. Informe para FONASA-MINSAL. 2008, Centre de Recerca e Economia i Salut Universitat Pompeu FabraI
Iezzoni, L.I. (2009). Performance measurement for health system improvement: experiences, challenges and prospects. In: P. Smith, ed., Risk adjustment for performance measurement, 1st ed. Cambridge: Cambridge University Press, pp.251-285.
Iezzoni, L.I., ed. (2013). Risk adjustment for measuring healthcare outcomes, Fourth edition. Ann Arbor, Michigan: Health Administration Press.
Independent Evaluation Group (IEG), (2011), Results-Based Health Programs in Argentina and Brazil: Performance Assessment Report, IEG Public Sector Evaluation, Report No.: 62571, The World Bank Group: Washington.
Inoriza JM, Coderch J, Carreras M, Vall-llosera L, García-Goñi M, Lisbona JM, Ibern P. (2009). La medidad de la morbilidad atendida en una organización sanitaria integrada. Gac Sanit, 2009;23(1): 29-37
Jones A.M. (2011). Models for health care. In Oxford Handbook of Economic Forecasting, Clements MP, Hendry DF (eds). Oxford University Press, New York.
Kautter, J., Ingber, M., Pope, G.C. and Freeman, S. (2012). Improvements in Medicare Part D Risk Adjustment. Medical Care, 50(12), pp.1102-1108.
Kautter, J., Pope, G.C. and Keenan, P. (2014a). Affordable Care Act Risk Adjustment: Overview, Context, and Challenges. MMRR, 4(3), pp.E1-E11.
Kautter, J., Pope, G.C., Freeman, S., Patterson, L., Cohen, M. and Keenan, P. (2014b). The HHS-HCC Risk Adjustment Model for Individual and Small Group Markets under the Affordable Care Act. MMRR, 4(3), pp.E1-E46.
Kronick R, Dreyfus T, Lee L, Zhou Z. (1996). Diagnostic risk adjustment for Medicaid: the disability payment system. Health Care Financ Rev. 1996;17(3):7–33
Lamers L M, and van Vliet R C J A, (1996). Multiyear diagnostic information from prior hospitalization as a risk-adjuster for capitation payments. Medical Care, 34(6), 549-561.

Handbook of Global Health Economics and Public Policy
37
Lamers, L., van Vliet, R.C. and van de Ven, W.P.M.M. (2003). Risk adjusted premium subsidies and risk sharing: key elements of the competitive sickness fund market in the Netherlands. Health Policy, 65(1), pp.49-62.
Lo Scalzo A, Donatini A, Orzella L, Cicchetti A, Profili S, Maresso A (2009). Italy: Health system review. Health Systems in Transition, 2009; 11(6)1-216.
Milliman, (2015) Medical underwriting and risk adjustment practices in 8 countries around the world. Downloaded on March 26, 2015 from http://www.milliman.com/insight/health/Medical-underwriting-and-risk-adjustment-practices-in-8-countries-around-the-world/.
Ministerio de la Protección Social. República de Colombia (2011). Estudio de la suficiencia y de los mecanismos de ajuste de riesgo para el cálculo de la Unidad de Pago por Capitación para garantizar el Plan Obligatorio de Salud en el Año 2008, Colección Estudios de Suficiencia UCP-POS. Bogotá Colombia, Septiembre 2011. ISBN Colección: 978-958-8717-25-8, ISBN: 978-958-817-28-9
Monitor and National Health Service (2014). The NHS payment system: documents and guidance. https://www.gov.uk/government/collections/the-nhs-payment-system-regulating-prices-for-nhs-funded-healthcare May
Musgrove, P., (2011). Financial and other rewards for good performance or results: a guide tour of concepts and terms and a short glossary. Wold Bank; Washington DC; may 2011.
Newhouse, J. P. et al. (1989). Adjusting capitation rates using objective health measures and prior utilization. Health Care Financing Review, 10, 41-54.
Newhouse, J.P. (1996). Reimbursing health plans and health providers: Selection versus efficiency in production. J. Econ. Lit. 1996, 34, 1236–1263.
Oreggioni I. (2013). Equidad, Gasto público, mancomunación de fondos y protección financiera en el Sistema Nacional Integrado de Salud de Uruguay. División Economía de la Salud Dirección General del Sistema Nacional Integrado de Salud. IV ENCUENTRO DE UNIDADES DE ECONOMÍA DE LA SALUD. 7 – 8 de Noviembre, 2013 - Santiago, Chile.
Ortún V, López G, Puig J, Sabés R. (2001). El sistema de financiación capitativo: posibilidades y limitaciones. Fulls Economics del Sistema sanitario N°35, marzo 2001, pags 8-16. 45.
Orueta JF, Urraca J, Berraondo I, et al (2006). Adjusted Clinical Groups (ACGs) explain the utilization of primary care in Spain based on information registered in the medical records: a cross-sectional study. Health Policy 2006;76:38–48.
Palomo L, Gené-Badia J, Rodríguez-Sendín J. (2011). “La reforma de la atención primaria, entre el refugio del pasado y la aventura de la innovación”. Informe SESPAS 2012. Gac Sanit. 2011. doi:10.1016/j. gaceta.2011.06.010.
Paris V, Devaux M, Wei L. (2010). “Health Systems Institutional Characteristics: A Survey of 29 OECD Countries”, OECD Health Working Papers, Nº50.
Pope, G.C., Kautter, J., Ingber, M.J., Freeman, S., Sekar, & R. Newhart, C. (2011). Evaluation of the CMS-HCC Risk Adjustment Model Final Report. Centers for Medicare & Medicaid Services Web site. https://www.cms.gov/MedicareAdvtgSpecRateStats/downloads/Evaluation_Risk_Adj_Model_2011.pdf. Published March, 2011.
Pope, G.C., Adamache, K.W., Walsh, E.G., & Khandker, R.K(1998). Evaluating Alternative Risk Adjusters for Medicare. Health Care Financing Review 20(2):109-129.
Pope, G.C., Bachofer, H., Pearlman, A., Kautter, J., Hunter, E., Miller, D., & Keenan, P. (2014). Risk Transfer Formula for Individual and Small Group Markets Under the Affordable Care Act. Medicare & Medicaid Research Review, 4(3), pp.E1-E23.
Handbook of Global Health Economics and Public Policy
38
Pope, G.C., Ellis, R.P. and Ash, A.S. (2000). Principal inpatient diagnostic cost group models for Medicare risk adjustment. Health Care Financing Review, 21(3), pp.93-118.
Pope, G.C., Kautter, J., Ellis, R.P., Ash, A.S., Ayanian, J.Z., Iezzoni, L.I., Ingber, M.J., Levy, J. and Robst, J. (2004). Risk adjustment of Medicare capitation payments using the CMS-HCC model. Health Care Financing Review, 25(4), pp.119-141.
Radley DC Gottlieb DJ, Fisher ES, Tosteson ANA. (2008) Comorbidity Risk-Adjustment Strategies are Comparable Among Persons with Hip Fracture. J Clin Epidemiol. 61(6): 580–587.
Rice, N. and Smith, P.C. (2001). Capitation and Risk Adjustment in Health Care Financing: An International Progress Report. Milbank Quarterly, 79(1), pp.81-113.
Robyn, P.J., Sauerborn, R. and Barnighausen, T. (2012). Provider payment in community-based health insurance schemes in developing countries: a systematic review. Health Policy and Planning, 28(2), pp.111-122.
Scheffer, R.M., Fulton, B.D., & Cashin, C.(2012). Provider Pay for Performance Programs in Health: Key Factors and Selected Country Case Studies. Draft. http://ghlf.berkeley.edu/Prereadings/LondonGHLF/Speakers%20-%20Prereadings/Scheffler%20-%20P4P%20Programs%20in%20the%20OECD.pdf.
Scheffler R M (2010) “Pay For Performance (P4P) Programs in Health Services: What is the Evidence?” World Health Report (2010) Background Paper, 31. http://www.who.int/healthsystems/topics/financing/healthreport/P4PWHR2010ShefflerFINAL.pdf.
Schokkaert, E. and Van de Voorde, C. (2003). Belgium: risk adjustment and financial responsibility in a centralised system. Health Policy, 65(1), pp.5-19.
Shortell SM, Gillies RR, Anderson DA, Erickson KM, Mitchell JB. Remaking health care in America. Hosp Health Netw. 1996 Mar; 70(6):43-44.
Shortell SM, Gillies RR, Anderson DA, Erickson KM, Mitchell JB. Remaking health care in America: The Evolution of Organized Delivery Systems. 2nd ed. San Francisco: Jossey-Bass; 2000.
Shmueli, A., Chernichovsky, D. and Zmora, I. (2003). Risk adjustment and risk sharing: the Israeli experience. Health Policy, 65(1), pp.37-48.
The World Bank, (2011). Financial and other rewards for good performance or results: a guided tour of concepts and terms and a short glossary.. Washington DC: World Bank.
The World Bank, (2013). Argentina - Increasing utilization of health care services among the uninsured population : the Plan Nacer program.
van Barneveld, E.M., Lamers, L.M., van Vliet, R.C.J.A., van de Ven, W.P.M.M. (2001).Risk sharing as a supplement to imperfect capitation in health insurance: a tradeoff between selection and efficiency. J. Health Econ 20, 147-168
van de Ven, W.P.M.M. and Ellis, R.P. (2000). Risk adjustment in competitive health plan markets. In: A. Culyer and J. Newhouse, ed., Handbook in Health Economics, 1st ed. Amsterdam: North-Holland/Elsevier, pp.755-845.
van de Ven, W.P.M.M., Beck, K., Buchner, F., Chernichovsky, D., Gardiol, L., Holly, A., Lamers, L.M., Schokkaert, E., Shmueli, A., Spycher, S., Van de Voorde, C., van Vliet, R.C.J.A., Wasem, J. and Zmora, I. (2003). Risk adjustment and risk selection on the sickness fund insurance market in five European countries. Health Policy, 65(1), pp.75-98.
van de Ven, W.P.M.M., Beck, K., Buchner, F., Schokkaert, E., Schut, F.T., Shmueli, A. and Wasem, J. (2013). Preconditions for efficiency and affordability in competitive healthcare

Handbook of Global Health Economics and Public Policy
39
markets: Are they fulfilled in Belgium, Germany, Israel, the Netherlands and Switzerland?. Health Policy, 109(3), pp.226-245.
van de Ven, W.P.M.M., Beck, K., Van de Voorde, C., Wasem, J. and Zmora, I. (2007). Risk adjustment and risk selection in Europe: 6 years later. Health Policy, 83(2-3), pp.162-179.
van Kleef, R.C. and van Vliet, R.C.J.A. (2012). Improving Risk Equalization Using Multiple-year High Cost as a Health Indicator. Medical Care, 50(2), pp.140-144.
van Vliet, R.C.J.A., and van de Ven W.P.M.M. (1993). Capitation payments based on prior hospitalization. Health Economics, 2: 177-188.
Vargas, V. and Wasem, J. (2006). Risk adjustment and primary health care in Chile. Croatian Medical Journal, 47(3), pp.459-468.
Vats, S., Ash, A. and Ellis, R. (2013). Bending the Cost Curve? Results From a Comprehensive Primary Care Payment Pilot. Medical Care, 51(11), pp.964-969.
Vázquez ML, Vargas I, Nuño R, Toro N. 2012. “Organizaciones sanitarias integradas y otros ejemplos de colaboración entre proveedores”. Informe SESPAS 2012 Gac Sanit. doi:10.1016/j. gaceta.2011.11.006.
Wagstaff A (2009). Social health insurance vs. Tax-financed health systems- Evidence from the OECD. Policy Research Working Paper 4821 Development Research Group, The World Bank, Washington DC, USA, January 2009
Wasem J, Lauterbach LM, and Schrader WF. (2006). Klassifikationsmodelle für Versicherte im morbiditátsorientierten Risikostructurausgleich (Clasificación de modelos de ajuste de riesgos para compensación estructural de riesgos basada en morbilidad). Wissenschaftliches Institut der AOK (2006)
Weiner J.P., Dobson A, Maxwell S.L., Coleman K, Starfield B, Anderson G.F. (1996). Risk-adjusted Medicare capitation rates using ambulatory and inpatient diagnoses. Health Care Financ Rev. 1996;17(3):77–99.
Winkelman, R., and Mehmud, S. (2007). A comparative analysis of claims-based tools for health risk assessment. Schaumburg, Ill.: Society of Actuaries.
World Health Organization (WHO). 2010. Health Systems Financing: The path to universal coverage. The World Health Report: Geneva.
Yip, W.C.M., Hsiao, W., Meng, Q., Chen, W. and Sun, X. (2010). Realignment of incentives for health-care providers in China. The Lancet, 375(9720), pp.1120-1130.