global progress and backsliding on gasoline taxes and ... · as one of the most cost-e˙ective ways...
TRANSCRIPT

ANALYSISPUBLISHED: 9 JANUARY 2017 | VOLUME: 2 | ARTICLE NUMBER: 16201
Global progress and backsliding on gasoline taxesand subsidiesMichael L. Ross1*, Chad Hazlett2 and Paasha Mahdavi3
To reduce greenhouse gas emissions in the coming decades, many governments will have to reform their energy policies.These policies are di�cult to measure with any precision. As a result, it is unclear whether progress has been made towardsimportant energy policy reforms, such as reducing fossil fuel subsidies. We use new data to measure net taxes and subsidiesfor gasoline in almost all countries at the monthly level and find evidence of both progress and backsliding. From 2003 to2015, gasoline taxes rose in 83 states but fell in 46 states. During the same period, the global mean gasoline tax fell by 13.3%due to faster consumption growth in countries with lower taxes. Our results suggest that global progress towards fossil fuelprice reform has been mixed, and that many governments are failing to exploit one of the most cost-e�ective policy tools forlimiting greenhouse gas emissions.
S ince the early 2000s, the Intergovernmental Panel on ClimateChange, the International Energy Agency, the InternationalMonetary Fund (IMF), and the World Bank have urged
governments to remove subsidies for fossil fuels and instead taxthem at rates that account for their social and environmentalcosts1–3. The IMF estimates that global fossil fuel subsidies—including social and environmental costs—reached US$5.3 trillionin 2015, equivalent to 6.5% of global GDP (gross domesticproduct)4. The removal of fossil fuel subsidies is widely regardedas one of the most cost-effective ways for governments to meettheir commitments under the Paris climate agreement to curtailgreenhouse gas (GHG) emissions5,6. At the same time, reducedsubsidies and higher taxes can generate local benefits by reducingroad congestion, traffic fatalities, and local air pollution fromnitrogen oxide, ozone, and fine particulates7.
It is unclear, however, whether governments have been adoptingthese recommendations. Self-reporting by governments is oftenincomplete and unreliable. Many taxes and subsidies are indirect,or hidden in the budgets of state-owned enterprises; moreover, thereal value of taxes and subsidies changes over time due to inflationand currency fluctuations. Some countries announce reforms buteither fail to enact them or nullify their impact with countervailingpolicies, as in the case of Brazil8. Others try to remove gasolinesubsidies quietly to avoid dissent: according to news reports, since2006 attempts to raise gasoline prices have been followed byprotests in at least 19 countries, including Bolivia, Brazil, BurkinaFaso, Cameroon, Chile, Cote D’Ivoire, Ghana, India, Indonesia,Iran, Jordan, Kyrgyzstan,Mozambique,Myanmar,Nicaragua,Niger,Nigeria, Uganda and Yemen.
The taxes and subsidies that governments place on energy reflecttheir efforts to reduce GHG emissions from fossil fuels9. Yet withouta consistent way to measure these taxes and subsidies, we cannotknow much about these efforts and whether they are changing overtime; nor can we know whether the world as a whole is makingprogress towards fossil fuel price reform. Better measures of energypolicies can help observers track the climate change mitigationefforts of governments—including their adherence to the pledges
they made in conjunction with the Paris climate agreement—particularly if the measures are comprehensive, based on observ-able data, replicable, and can be applied to all countries9. Consis-tent measures of fossil fuel price policies will also help scholarsstudy the conditions that foster or impede politically difficultenergy reforms10–12.
We use monthly data on retail gasoline prices in 157 countriesfrom 2003 to 2015 to calculate the implicit net tax or subsidy thatgovernments place on a litre of gasoline. These countries contain97.1% of the world population and represent 98.2% of all GHGemissions. Our analysis shows that from the first half of 2003 tothe first half of 2015, net gasoline taxes rose in 83 countries, withsignificant gains in China, Brazil and Indonesia. Net taxes fell orsubsidies rose in 46 states, including many oil-exporting countriesin the Middle East, North Africa and Latin America. At a globallevel, the unweighted mean gasoline tax across all countries in oursample rose from 42.8 US cents to 50.9 US cents, equivalent toa 1.44% compound annual growth rate (CAGR). Since countriesvary widely in their gasoline consumption, however, this figure doesnot reveal the global per-litre average tax. Moreover, from 2003to 2012, the final year for which consumption data are available,consumption grew more quickly in low-tax countries than high-tax countries. Using a consumption-weighted measure to reflect thetrue per-unit level of taxation, we find that the implicit global meantax fell from 27.9 US cents to 24.2 US cents, a CAGR decline of1.18%. Even though a majority of countries reformed their gasolinetaxes, progress towards higher taxes at a global level was thwartedby a shift in consumption towards countries that had subsidies orlower taxes.
Measuring gasoline taxes and subsidiesAll governments either tax or subsidize the consumption of fossilfuels, but many of these taxes and subsidies are difficult to observeor infer. Coal taxes and subsidies, for example, are exceptionallyhard to determine since in many countries coal is sold directlyto government-owned utilities through long-term contracts ratherthan through retail markets; any subsidies may be hidden in the
1Department of Political Science, University of California Los Angeles, Los Angeles, California 90095, USA. 2Departments of Statistics and PoliticalScience, University of California Los Angeles, Los Angeles, California 90095, USA. 3McCourt School of Public Policy, Georgetown University, WashingtonDC 20057, USA. *e-mail: [email protected]
NATURE ENERGY | www.nature.com/natureenergy 1
© 2017 Macmillan Publishers Limited, part of Springer Nature. All rights reserved.
ANALYSIS NATURE ENERGY
price of electricity11. It is also hard to determine the supply cost forcoal, since there is no single international reference price. Withouteither the supply cost or the retail price, taxes and subsidies are verydifficult to measure.
Our study focuses on gasoline taxes and subsidies, which canbe more readily measured: gasoline is sold directly to consumersin all countries, which gives it an observable retail price; country-to-country differences in gasoline quality are relatively small; andthere is effectively a single world reference price. Until now, dataon gasoline prices have been limited to a single price every twoyears for most countries, which is too infrequent to observe manypolicy changes13.
We collected data on local gasoline retail prices for 157 countriesfrom January 2003 to June 2015 using both primary and secondarysources. We included all sovereign states whose populations weregreater than one million in 2012, except for four countries forwhich we could not locate reliable data: Cuba, Eritrea, North Koreaand Turkmenistan. For 46 countries our coverage is temporallyincomplete for the full time series, with datamissing for 1,067 (4.5%)of the 23,550 country-months. A full list of countries, along with thenumber of country-month observations for each case, is found inSupplementary Table 1.
Primary documents were obtained from national governmentsand found on websites maintained by ministries of finance, com-merce, trade, communications, transportation, natural resources,petroleum, energy, and mining; central statistical agencies; cen-tral banks; energy regulatory bodies; state-owned oil companies,including oil refining companies; and official government de-crees and public announcements. In 17 countries we employedlocal researchers to obtain primary data that were not other-wise accessible.
Secondary sources included the European Commission, theInternational Road Transport Union, the Food and AgricultureOrganization, the Famine Early Warning System, CITAC Africa,the Organization of Arab Petroleum Exporting Countries, anddocuments from the IMF and World Bank. Whenever possiblewe cross-validate price data across multiple sources to alleviateconcerns about measurement bias.
To measure implicit taxes and subsidies we use the price gapmethod, which compares the observed retail price in each countrywith a global benchmark price14. This method yields a single figurethat represents the net per-unit value of all taxes and subsidies,both implicit and explicit, and that can be readily compared acrosscountries and over time. Belowwe refer to these implicitlymeasurednet taxes or subsidies as ‘net taxes’ or ‘net subsidies.’
The price gap method allows us to measure what the IMFcalls ‘pre-tax subsidies’, which represent the difference between theretail price and the international supply cost; we do not attemptto estimate ‘post-tax subsidies’, which are defined as the differencebetween the retail price and the sum of the international supply cost,a basic consumption tax, and a Pigouvian tax that offsets the costs oflocal pollution, congestion, and carbon emissions4. Hence, the pricegap should be interpreted as a lower-bound estimate of total fossilfuel subsidies.
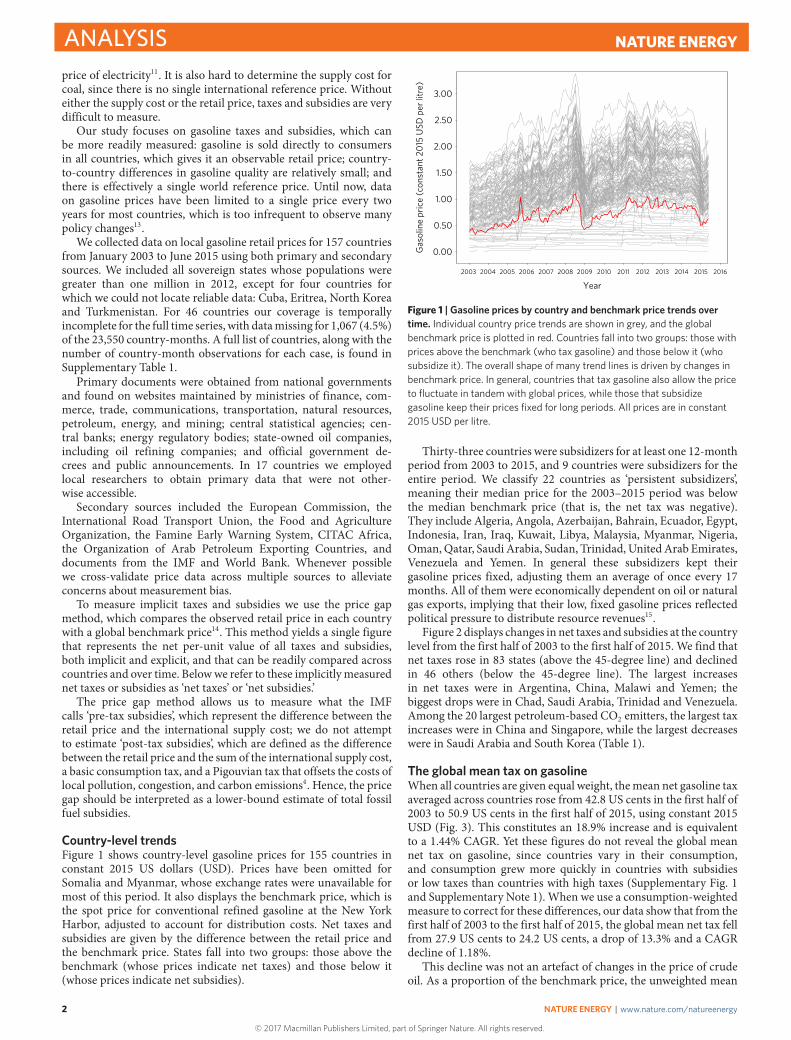
Country-level trendsFigure 1 shows country-level gasoline prices for 155 countries inconstant 2015 US dollars (USD). Prices have been omitted forSomalia and Myanmar, whose exchange rates were unavailable formost of this period. It also displays the benchmark price, which isthe spot price for conventional refined gasoline at the New YorkHarbor, adjusted to account for distribution costs. Net taxes andsubsidies are given by the difference between the retail price andthe benchmark price. States fall into two groups: those above thebenchmark (whose prices indicate net taxes) and those below it(whose prices indicate net subsidies).
Gas
olin
e pr
ice
(con
stan
t 201
5 U
SD p
er li
tre)
0.00
0.50
1.00
1.50
2.00
2.50
3.00
2003 2004 2005 2006 2007 2008 2009 2010 2011 2012 2013 2014 2015 2016
Year
Figure 1 | Gasoline prices by country and benchmark price trends overtime. Individual country price trends are shown in grey, and the globalbenchmark price is plotted in red. Countries fall into two groups: those withprices above the benchmark (who tax gasoline) and those below it (whosubsidize it). The overall shape of many trend lines is driven by changes inbenchmark price. In general, countries that tax gasoline also allow the priceto fluctuate in tandem with global prices, while those that subsidizegasoline keep their prices fixed for long periods. All prices are in constant2015 USD per litre.
Thirty-three countries were subsidizers for at least one 12-monthperiod from 2003 to 2015, and 9 countries were subsidizers for theentire period. We classify 22 countries as ‘persistent subsidizers’,meaning their median price for the 2003–2015 period was belowthe median benchmark price (that is, the net tax was negative).They include Algeria, Angola, Azerbaijan, Bahrain, Ecuador, Egypt,Indonesia, Iran, Iraq, Kuwait, Libya, Malaysia, Myanmar, Nigeria,Oman,Qatar, Saudi Arabia, Sudan, Trinidad, UnitedArab Emirates,Venezuela and Yemen. In general these subsidizers kept theirgasoline prices fixed, adjusting them an average of once every 17months. All of them were economically dependent on oil or naturalgas exports, implying that their low, fixed gasoline prices reflectedpolitical pressure to distribute resource revenues15.
Figure 2 displays changes in net taxes and subsidies at the countrylevel from the first half of 2003 to the first half of 2015. We find thatnet taxes rose in 83 states (above the 45-degree line) and declinedin 46 others (below the 45-degree line). The largest increasesin net taxes were in Argentina, China, Malawi and Yemen; thebiggest drops were in Chad, Saudi Arabia, Trinidad and Venezuela.Among the 20 largest petroleum-based CO2 emitters, the largest taxincreases were in China and Singapore, while the largest decreaseswere in Saudi Arabia and South Korea (Table 1).
The global mean tax on gasolineWhen all countries are given equal weight, themean net gasoline taxaveraged across countries rose from 42.8 US cents in the first half of2003 to 50.9 US cents in the first half of 2015, using constant 2015USD (Fig. 3). This constitutes an 18.9% increase and is equivalentto a 1.44% CAGR. Yet these figures do not reveal the global meannet tax on gasoline, since countries vary in their consumption,and consumption grew more quickly in countries with subsidiesor low taxes than countries with high taxes (Supplementary Fig. 1and Supplementary Note 1). When we use a consumption-weightedmeasure to correct for these differences, our data show that from thefirst half of 2003 to the first half of 2015, the global mean net tax fellfrom 27.9 US cents to 24.2 US cents, a drop of 13.3% and a CAGRdecline of 1.18%.
This decline was not an artefact of changes in the price of crudeoil. As a proportion of the benchmark price, the unweighted mean
2
© 2017 Macmillan Publishers Limited, part of Springer Nature. All rights reserved.
NATURE ENERGY | www.nature.com/natureenergy

NATURE ENERGY ANALYSIS
Distance from benchmark in the 1st half of 2003 (constant 2015 USD per litre)
Dis
tanc
e fr
om b
ench
mar
k in
the
1st h
alf o
f 201
5 (c
onst
ant 2
015
USD
per
litr
e)
Gasoline consumption(thou. bbls per day) a
aa
100
1,000
10,000
−0.50
−0.25
0.00
0.25
0.50
0.75
1.00
1.25
1.50
−$0.25 0.00 0.25 0.50 0.75 1.00 1.25
Angola
UAE
Argentina
Armenia Australia
Austria
Azerbaijan
Burundi
Belgium
Benin
Burkina Faso
Bangladesh Bulgaria
Bahrain
Bosnia and Herzegovina
Belize
Bolivia
Brazil
Botswana
Central African Republic
Canada
Switzerland
Chile
China
Cote d'Ivoire
Cameroon
Congo
Colombia
Costa Rica
Czech Republic
Germany
Denmark
Dominican Republic
Algeria
Ecuador
Egypt
Spain
Estonia
Finland
France
Gabon
United Kingdom
Gambia
Guinea−Bissau
Equatorial Guinea
Greece
Guatemala
Guyana
Croatia
Haiti
Hungary
Indonesia
India
Ireland
Iran
Iraq
Israel
Italy
Jordan
Japan
Kenya
Kyrgyzstan
Cambodia
South Korea
Kuwait
Lebanon
Libya
Sri Lanka
LithuaniaLuxembourg
Latvia
Morocco
Moldova
Madagascar
Mexico
Mali
Mongolia
Mozambique
Mauritania Mauritius
Malawi
Malaysia
Namibia
Niger
Nigeria
Nicaragua
Netherlands
Norway
Nepal
New Zealand
Oman
Panama
Peru
Philippines
Portugal
Paraguay
Qatar
Romania
Russia
Rwanda
Saudi Arabia
Senegal
Singapore
Sierra Leone
Serbia
Suriname
Slovenia
Sweden
Swaziland
Syria
Chad
Togo
Thailand
Tajikistan
Timor−Leste
Trinidad
Turkey
Taiwan
TanzaniaUganda
Ukraine
Uruguay
United States
Venezuela
Viet Nam
Yemen
South Africa
Congo, Dem Rep
Zambia
Figure 2 | Net taxes and subsidies by country in 2003 versus 2015. Eighty-three countries increased their net taxes or reduced their net subsidies betweenthe first six months of 2015 and the first six months of 2003; they are shown in blue and lie above the 45◦ dashed line. By contrast, 46 countries reducednet taxes or increased net subsidies over the same period, and are shown in dark orange below the 45◦ line. While most countries had net taxes in bothperiods (placing them in the upper-right quadrant), 14 countries had subsidies in both periods (placing them in the lower-left quadrant). Just two countrieschanged from net taxers to net subsidizers (lower-right quadrant) while two others changed from net subsidizers to net taxers (upper-left quadrant). Textsize is proportional to average gasoline consumption.
price fell from 210% to 192%, and the consumption-weighted pricefell from 172% to 144% (Supplementary Fig. 2). Nor is it an artefactof our starting point: if we begin our analysis in 2001 or 2005and end in 2011 or 2015, the unweighted mean net tax still showsa modest increase (with a positive CAGR ranging from 0.59% to1.59%), while the consumption-weighted mean net tax still showsa decline (with a negative CAGR ranging from 0.76% to 2.88%)(Supplementary Table 2). These patterns are also robust to the useof alternative benchmark prices (Supplementary Figs 3 and 4 andSupplementary Note 2).
Regional and G20 trendsWhen prices are disaggregated by region (Fig. 4), we find the highestnet taxes in Europe andNorthAmerica and the lowest in the oil-richMiddle East and North Africa. Net taxes in the Middle East roseslightly over the period, while those in Europe and North Americarose sharply in real terms before dropping after July 2014, whenglobal oil prices collapsed.
What is surprising is the pair of regions with the second highestand second lowest net tax levels, respectively, as of June 2015: Africaand the former Soviet Union. African states have some of the highestnet gasoline taxes in the world and have maintained this position
since at least 2003. States that were part of the Soviet Union, on theother hand, began the periodwith the lowest real net taxes but begansteadily increasing them after 2003 before dropping sharply after the2014 oil price crash.
In September 2009, theG20 heads of state agreed to phase out ‘in-efficient fossil fuel subsidies’16. Even though the agreement called at-tention to the problem of fossil fuel subsidies, its real-world effect isnot apparent: we find no evidence that it was followed by a rise in theunweighted mean net gasoline tax across these 20 countries (Fig. 5).
Changes in price fixityOur data allow us to measure changes in price fixity, meaning thedegree to which governments keep gasoline prices fixed or allowthem to fluctuate with market forces. The World Bank and IMFgenerally encourage countries to reform their policies by movingfrom fixed to floating prices, in order to reduce market distortionsand avoid subsidies when supply costs rise17. Price fixity helpsexplain much of the change in subsidies over time: rising global oilprices causedmany fixed-price states to become subsidizers between2003 and 2009, while the drop in global oil prices after mid-2012caused both the number of subsidizers and the magnitude of theirsubsidies to fall18.
NATURE ENERGY | www.nature.com/natureenergy
© 2017 Macmillan Publishers Limited, part of Springer Nature. All rights reserved.
3
ANALYSIS NATURE ENERGY
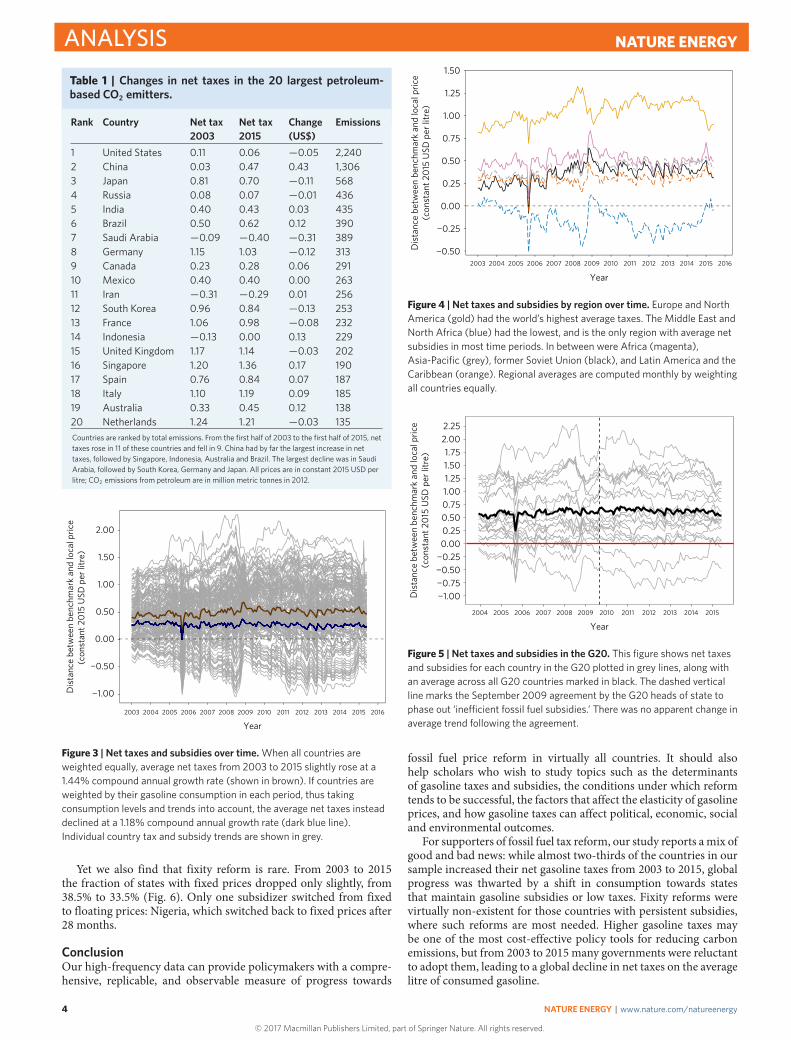
Table 1 | Changes in net taxes in the 20 largest petroleum-based CO2 emitters.
Rank Country Net tax2003
Net tax2015
Change(US$)
Emissions
1 United States 0.11 0.06 −0.05 2,2402 China 0.03 0.47 0.43 1,3063 Japan 0.81 0.70 −0.11 5684 Russia 0.08 0.07 −0.01 4365 India 0.40 0.43 0.03 4356 Brazil 0.50 0.62 0.12 3907 Saudi Arabia −0.09 −0.40 −0.31 3898 Germany 1.15 1.03 −0.12 3139 Canada 0.23 0.28 0.06 29110 Mexico 0.40 0.40 0.00 26311 Iran −0.31 −0.29 0.01 25612 South Korea 0.96 0.84 −0.13 25313 France 1.06 0.98 −0.08 23214 Indonesia −0.13 0.00 0.13 22915 United Kingdom 1.17 1.14 −0.03 20216 Singapore 1.20 1.36 0.17 19017 Spain 0.76 0.84 0.07 18718 Italy 1.10 1.19 0.09 18519 Australia 0.33 0.45 0.12 13820 Netherlands 1.24 1.21 −0.03 135Countries are ranked by total emissions. From the first half of 2003 to the first half of 2015, nettaxes rose in 11 of these countries and fell in 9. China had by far the largest increase in nettaxes, followed by Singapore, Indonesia, Australia and Brazil. The largest decline was in SaudiArabia, followed by South Korea, Germany and Japan. All prices are in constant 2015 USD perlitre; CO2 emissions from petroleum are in million metric tonnes in 2012.
Dis
tanc
e be
twee
n be
nchm
ark
and
loca
l pric
e (c
onst
ant 2
015
USD
per
litr
e)
2003 2004 2005 2006 2007 2008 2009 2010 2011 2012 2013 2014 2015 2016
−1.00
−0.50
0.00
0.50
1.00
1.50
2.00
Year
Figure 3 | Net taxes and subsidies over time. When all countries areweighted equally, average net taxes from 2003 to 2015 slightly rose at a1.44% compound annual growth rate (shown in brown). If countries areweighted by their gasoline consumption in each period, thus takingconsumption levels and trends into account, the average net taxes insteaddeclined at a 1.18% compound annual growth rate (dark blue line).Individual country tax and subsidy trends are shown in grey.
Yet we also find that fixity reform is rare. From 2003 to 2015the fraction of states with fixed prices dropped only slightly, from38.5% to 33.5% (Fig. 6). Only one subsidizer switched from fixedto floating prices: Nigeria, which switched back to fixed prices after28 months.
ConclusionOur high-frequency data can provide policymakers with a compre-hensive, replicable, and observable measure of progress towards
Dis
tanc
e be
twee
n be
nchm
ark
and
loca
l pric
e (c
onst
ant 2
015
USD
per
litr
e)
−0.50
−0.25
0.00
0.25
0.50
0.75
1.00
1.25
1.50
2003 2004 2005 2006 2007 2008 2009 2010 2011 2012 2013 2014 2015 2016
Year
Figure 4 | Net taxes and subsidies by region over time. Europe and NorthAmerica (gold) had the world’s highest average taxes. The Middle East andNorth Africa (blue) had the lowest, and is the only region with average netsubsidies in most time periods. In between were Africa (magenta),Asia-Pacific (grey), former Soviet Union (black), and Latin America and theCaribbean (orange). Regional averages are computed monthly by weightingall countries equally.
Dis
tanc
e be
twee
n be
nchm
ark
and
loca
l pric
e (c
onst
ant 2
015
USD
per
litr
e)
2004 2005 2006 2007 2008 2009 2010
Year2011 2012 2013 2014 2015
−1.00−0.75−0.50−0.250.000.250.500.751.001.251.501.75
2.002.25
Figure 5 | Net taxes and subsidies in the G20. This figure shows net taxesand subsidies for each country in the G20 plotted in grey lines, along withan average across all G20 countries marked in black. The dashed verticalline marks the September 2009 agreement by the G20 heads of state tophase out ‘ine�cient fossil fuel subsidies.’ There was no apparent change inaverage trend following the agreement.
fossil fuel price reform in virtually all countries. It should alsohelp scholars who wish to study topics such as the determinantsof gasoline taxes and subsidies, the conditions under which reformtends to be successful, the factors that affect the elasticity of gasolineprices, and how gasoline taxes can affect political, economic, socialand environmental outcomes.
For supporters of fossil fuel tax reform, our study reports amix ofgood and bad news: while almost two-thirds of the countries in oursample increased their net gasoline taxes from 2003 to 2015, globalprogress was thwarted by a shift in consumption towards statesthat maintain gasoline subsidies or low taxes. Fixity reforms werevirtually non-existent for those countries with persistent subsidies,where such reforms are most needed. Higher gasoline taxes maybe one of the most cost-effective policy tools for reducing carbonemissions, but from 2003 to 2015 many governments were reluctantto adopt them, leading to a global decline in net taxes on the averagelitre of consumed gasoline.
4
© 2017 Macmillan Publishers Limited, part of Springer Nature. All rights reserved.
NATURE ENERGY | www.nature.com/natureenergy

NATURE ENERGY ANALYSIS
Fixed-price states
Transition-price states
Variable-price states
Pric
e ty
pe s
hare
(by
mon
th)
0%
25%
50%
75%
100%
2003 2004 2005 2006 2007 2008 2009 2010
Year2011 2012 2013 2014 2015
Figure 6 | Price fixity over time. We place countries in one of threecategories indicating how many times their gasoline prices changed overthe previous twelve months: three or fewer (black), four to eight (darkgrey), or nine to twelve (light grey). From 2003 to 2015 there was a smalldrop in the proportion of countries with fixed prices and a small rise inthose with fluctuating prices. Shares shown are monthly averages.
MethodsSelection of dates and grades. For countries with data reported more frequentlythan monthly intervals (daily, weekly or bi-weekly), we used the price from thefirst day or week of the month as the monthly price. When data on multiplegasoline grades were available we use regular-graded gasoline (typically between87 and 90 octane) to reflect the type most likely to be purchased by the averageconsumer. In countries where the availability of grades changes over time weselected the grade with the longest coverage. When data were available fordifferent parts of a country we selected the region that includes the capital city.
Converting local currencies. To convert local currencies to US dollars we usemonthly exchange rates from the IMF International Financial Statistics. Forconverting from nominal to real 2015 US dollars we use monthly inflation ratesfrom the US Federal Reserve Economic Database (FRED) Consumer Price Indexfor All Urban Consumers: All Items Less Food and Energy (CPILFESL) series. Incountries that experienced currency changes or revaluations—for example,Romania (July 2005), Turkey (January 2005), Ghana (August 2007)—all priceshave been back-converted to the more recent currency price. For example, theTurkish lira was revalued in January 2005 by dividing by 1,000,000 to usher in the‘Second Turkish lira’. All pre-2005 prices are thus divided by 1,000,000 to be inSecond Turkish lira per litre.
Benchmark prices. To estimate implicit net taxes and subsidies we compute thegap between the local price and the international benchmark price, less a smalladjustment to account for distribution costs. To simplify our analysis we assumelocal distribution costs are fixed for all countries and years at 10 US cents perlitre in constant 2015 US dollars; this estimate is drawn from ref. 19, which uses asimilar figure for the cost of bringing refined gasoline to retailers. Thoughdistribution and other local costs may vary by location, we expect thoseunobserved differences to change slowly, and thus may affect cross-countrycomparisons but not within-country comparisons over time.
For our benchmark we use the spot price for conventional refined gasoline atthe New York Harbor as reported by the US Energy Information Administration.For oil-importing countries, the benchmark price represents the marginal cost ofsupplying gasoline to consumers. For oil-producing countries, who in many casescan supply gasoline to their citizens at a lower cost, the difference between theretail price and the benchmark represents the opportunity cost to thegovernment: if it sets a retail price below the international benchmark, it isforgoing revenue it would otherwise accrue by selling its gasoline at a marketprice. In both cases we treat the difference between the retail price and thebenchmark as the net implicit tax or subsidy.
Start and end dates. Six-month averages for 2003 (‘first half 2003’) and 2015(‘first half 2015’) are computed using prices for January through June, whereavailable. In countries where one or several of these months are missing, weinstead use the average price for the non-missing months. Alternative start andend points used in Supplementary Table 2 use the same six-month averageapproach to smooth out month-to-month fluctuations.
Calculating price fixity. To measure price fixity we count the number ofmonth-to-month changes in gas prices, in local currency, over a rolling
twelve-month interval. Countries that changed their prices three or fewer timesover the prior twelve months were coded as having fixed prices, countries withfour to eight changes were coded as transitional, and countries with nine totwelve changes were coded as having floating prices.
Consumption weighting. We weight implicit net taxes and subsidies byconsumption using data on annual motor gasoline consumption from the USEnergy Information Agency International Energy Statistics. A weight w it
is given by a country’s consumption share, calculated as the total consumptionby each country i divided by total global consumption in month t (assumingconstant consumption share across all 12 months in a given year).A global consumption-weighted mean implicit net tax is then given bytaxt = (
∑ Ni=1w itpriceit) − benchmarkt at each month t . The most recent Energy
Information Administration data on motor gasoline consumption are from 2012;we extrapolate consumption shares up to 2015 by assuming that shares (but notconsumption) remain fixed across the 2012–2015 period.
Data availability. The data that support the plots within this paper and otherfindings of this study are publicly available on the Harvard Dataverseat https://dataverse.harvard.edu/dataverse/mlross.
Received 24 June 2016; accepted 28 November 2016;published 9 January 2017
References1. Gupta, S. & Mahler, W. Taxation of petroleum products: theory and empirical
evidence. Energy Econ. 17, 101–116 (1995).2. Bacon, R. Petroleum taxes: trends in fuel taxes (and subsidies) and the
implications. Viewpoint (World Bank) 240, 1–4 (2001).3. IPCC Climate Change 2001: The Scientific Basis (eds Houghton, J. T. et al.)
(Cambridge Univ. Press, 2001).4. Coady, D., Parry, I., Sears, L. & Shang, B. How large are global energy subsidies?
IMF Working Paper 105, 1–41 (2015).5. Rentschler, J. & Bazilian, M. Reforming fossil fuel subsidies: drivers, barriers
and the state of progress. Clim. Policy 16, 1–24 (2016).6. Davis, L. W. The economic cost of global fuel subsidies. Am. Econ. Rev. 104,
581–585 (2014).7. Parry, I. W., Heine, M. D., Lis, E. & Li, S. Getting Energy Prices Right: From
Principle to Practice (International Monetary Fund, 2014).8. de Oliveira, A. & Laan, T. Lessons Learned from Brazil’s Experience with
Fossil-Fuel Subsidies and their Reform (International Institute for SustainableDevelopment, 2010).
9. Aldy, J. E. & Pizer, W. A. Alternative metrics for comparing domestic climatechange mitigation efforts and the emerging international climate policyarchitecture. Rev. Environ. Econ. Policy 10, 3–24 (2016).
10. Vagliasindi, M. Implementing Energy Subsidy Reforms: Evidence fromDeveloping Countries (The World Bank, 2013).
11. Victor, D. G. The Politics of Fossil-Fuel Subsidies (IISD Global SubsidiesInitiative Series, 2009).
12. Cheon, A., Urpelainen, J. & Lackner, M. Why do governments subsidizegasoline consumption? An empirical analysis of global gasoline prices,2002–2009. Energy Policy 56, 382–390 (2013).
13. Wagner, A. International Fuel Prices 2012/2013 (accessed 1 July 2014);https://energypedia.info/index.php/International_Fuel_Prices
14. Koplow, D.Measuring Energy Subsidies Using the Price-Gap Approach:What Does it Leave Out? (IISD Trade, Investment and Climate ChangeSeries, 2009).
15. Fattou, B. & El-Katiri, L. Energy subsidies in the Middle East and North Africa.Energy Strateg. Rev. 2, 108–115 (2013).
16. G20 Leaders’ Statement The Pittsburgh Summit, September 24–25, 2009(accessed 14 May 2016); https://www.treasury.gov/resource-center/international/g7-g20/Documents/pittsburgh_summit_leaders_statement_250909.pdf
17. Clements, B. et al. Energy Subsidy Reform: Lessons and Implications(International Monetary Fund, 2013).
18. Kojima, M. Petroleum product pricing and complementary policies: experienceof 65 developing countries since 2009.World Bank Policy Research WorkingPaper 6396, 1–116 (2013).
19. Coady, D. et al. Petroleum Product Subsidies: Costly, Inequitable, and Rising(International Monetary Fund, 2010).
AcknowledgementsWe thank K. Bawn, M. Bazilian, D. Coady, A. Cooley, J. Kyle, Y.-M. Liou, I. Parry,D. Posner, B. Shang and D. Treisman for their suggestions on the analysis, IMF andWorld Bank staff for sharing their country data, and E. Chenoweth and A. Glynn fortheir early guidance on the research design. Our data collection efforts were supported by
NATURE ENERGY | www.nature.com/natureenergy
© 2017 Macmillan Publishers Limited, part of Springer Nature. All rights reserved.
5

ANALYSIS NATURE ENERGY
the UCLA Burkle Center and the Natural Resources Governance Institute. Earlierversions of this paper were presented to seminars at the World Bank, the Council onForeign Relations, the 2015 meeting of the American Political Science Association, the2015 meeting of the International Political Economy Society, Georgetown University,UCLA Law School, Yale University and Columbia University.
Author contributionsM.L.R. secured project funding and designed the study; M.L.R. and P.M. supervised thedata collection; P.M. and C.H. analysed the data; P.M. created the figures; and M.L.R.,P.M. and C.H. drafted and edited the manuscript.
Additional informationSupplementary information is available for this paper.Reprints and permissions information is available at www.nature.com/reprints.Correspondence and requests for materials should be addressed to M.L.R.How to cite this article: Ross, M. L., Hazlett, C. & Mahdavi, P. Global progress andbacksliding on gasoline taxes and subsidies. Nat. Energy 2, 16201 (2017).
Competing interestsThe authors declare no competing financial interests.
6
© 2017 Macmillan Publishers Limited, part of Springer Nature. All rights reserved.
NATURE ENERGY | www.nature.com/natureenergy