global precipitation measurement (gpm) mission and … · 11.03.2009 · global precipitation...
TRANSCRIPT

The GPM Mission: Overview and U.S. Science Status
Arthur Y. Hou NASA Goddard Space Flight Center
Global Precipitation Measurement (GPM) Mission and Falling Snow Retrievals
Gail Skofronick JacksonArthur Hou
NASA Goddard Space Flight Center
JCSDAMarch 11, 2009

Skofronick-Jackson, JCSDA, 11 March 2009 G O D D A R D S P A C E F L I G H T C E N T E R 2
Presentation OutlinePolar orbits
•Motivation–
Global Water and Energy Cycles•GPM Mission
–
GPM Science and Mission Concept–
Core Instrument Capabilities–
Constellation Sampling and Performance–
GPM Algorithms and Products•Snow Retrievals
–
Falling Snow Field Campaign–
Falling Snow Detection Process –
Detection Results•Future Work
–
Surface emission studies •Summary

Skofronick-Jackson, JCSDA, 11 March 2009 G O D D A R D S P A C E F L I G H T C E N T E R 3
Accurate global Accurate global precipitation precipitation
measurement is required measurement is required for better prediction of for better prediction of freshwater resources, freshwater resources,
climate changeclimate change, , weatherweather, , and the and the water cyclewater cycle
because because precipitationprecipitation is a is a key process that links key process that links
them allthem all……..
Falling snow and ice that Falling snow and ice that melts into rain are melts into rain are
important components of important components of precipitationprecipitation
Motivation: Precipitation

Skofronick-Jackson, JCSDA, 11 March 2009 G O D D A R D S P A C E F L I G H T C E N T E R 4
Science Objectives
New reference standards for precipitation measurements from space
Better understanding of precipitation physics, water cycle variability, and freshwater availability
Improved numerical weather prediction skills
Improved hydrological prediction capabilities for floods, landslides, and freshwater resources
Improved climate modeling and prediction capabilities
GPM will make data accessible to stakeholders beyond the traditional scientific community to support societal applications, policy planning, and outreach:
–
Freshwater Utilization and Resource Management–
Natural Hazard Monitoring/Prediction–
Operational Weather Forecasting–
Climate Change Assessment–
Agriculture Policy and Planning–
Education and Outreach
GPM: A Science Mission with Integrated Application Goals

Skofronick-Jackson, JCSDA, 11 March 2009 G O D D A R D S P A C E F L I G H T C E N T E R 5
GPM CORE Observatory (65o)DPR (Ku-Ka band)GMI (10-183 GHz)
LRD: July 2013
GPM Low-Inclination Observatory (40o)GMI (10-183 GHz)LRD: Nov. 2014
• Precipitation physics observatory
• Reference standard for inter-calibration of
constellation precipitation measurements
• Enhanced “asynoptic”ob(non-Sun-synchronous) obobservations• Improved sampling for nenear realtime monitoring onof hurricanes and onmidlatitude storms
Partner Satellites: GCOM-W, DMSP, Megha-Tropiques, MetOp-B, NOAA-N’, NPP, NPOESS
An international satellite mission specifically designed to unify and advance global precipitation measurements from dedicated and operational satellites
for research & applications
Next-generation global precipitation products throughadvanced active & passive microwave sensor measurements
a consistent framework for inter-satellite calibration (radiance & rain rates)international collaboration in algorithm development and ground validation
Global Precipitation Measurement (GPM) Reference Concept

Skofronick-Jackson, JCSDA, 11 March 2009 G O D D A R D S P A C E F L I G H T C E N T E R 6
Increased sensitivity (~11 dBZ) for light rain and snow detection
Better measurement accuracy with differential attenuation correction
Detailed microphysical information (DSD mean mass diameter & particle no. density) & identification of liquid, ice, and mixed-phase regions
Dual-Frequency (Ku-Ka band) Precipitation Radar (DPR):
Wide-Band (10-183 GHz) Microwave Imager (GMI):
High spatial resolution
Improved light rain & snow detection
Improved signals of solid precipitation over land (especially over snow-
covered surfaces)
4-point calibration to serve as a radiometeric
reference for constellation radiometers
Combined Radar-Radiometer Cloud Database
DPR & GMI together provide greater constraints on possible solutions to improve retrieval accuracy
Improved a-priori cloud database for constellation radiometer retrievals
Core Observatory Measurement Capabilities

Skofronick-Jackson, JCSDA, 11 March 2009 G O D D A R D S P A C E F L I G H T C E N T E R 7
• Calibration of Level-1 constellation radiometric data using GMI as reference:
GMI is designed to ensure greater accuracy and stability by employing
–
Encased hot load design to minimize solar intrusion–
4-point calibration for nonlinearity removal under nominal conditions and backup calibration during hot-load anomalies
• Calibration of Level-2 rainfall data using DPR+GMI measurements:
Making combined use of GMI and DPR measurements to provide a common cloud/hydrometeor database for precipitation retrievals from the
GPM Core and Constellation radiometers.
GPM: A consistent framework to unify a heterogeneous constellation of radiometers using GMI and DPR
measurements
Physical precipitation retrieval: Matching observed Tb with those simulated from a prior cloud database within a statistical framework
~ 10 km
TB observedTB model #1
Simulated Tb Observed Tb
TRMM uses a model-generated databaseGPM uses a combined DPR+GMI database
Simulated vs. observed TMI Tb

Skofronick-Jackson, JCSDA, 11 March 2009 G O D D A R D S P A C E F L I G H T C E N T E R 8
Average Revisit Time (hr) Year 2013 2014 2015 2016 2017
Land Tropics 1.6 1.5 1.6 1.8 2.3 Extratropics 1.1 1.0 1.0 1.0 1.4 Globe 1.4 1.2 1.3 1.4 1.8 Ocean Tropics 3.1 2.5 3.2 3.9 4.9 Extratropics 3.2 2.6 2.1 2.6 3.3 Globe 3.1 2.5 2.7 3.3 4.2 Land and Ocean Tropics 2.6 2.2 2.7 3.1 4.0 Extratropics 2.3 1.9 1.6 1.9 2.5 Globe 2.4 2.0 2.1 2.5 3.3
Baseline GPM Constellation Performance
Hour
GPM (2015)(< 3h over 92% of globe)
GPM Core Launch
Prime Life Extended Life
1-2 hr revisit time over land
Over Land
Additional partners possible: Brazil, Russia, China
Lin & Hou (2008)
Performance of Sensors over Land (US)

Skofronick-Jackson, JCSDA, 11 March 2009 G O D D A R D S P A C E F L I G H T C E N T E R 9
Improved Temporal Sampling with observations from non-Sun-synchronous orbits
Monthly Samples as a Function of the Time of the Day (1o
x 1o
Resolution)
Current Tropics
GPM 2017 Tropics
GPM 2017 Midlatitudes
TRMM: 3299 “asynoptic”
samples
GPM Core+LIO: 6173 samples
Core+LIO: 1468 samples
87% increase

Skofronick-Jackson, JCSDA, 11 March 2009 G O D D A R D S P A C E F L I G H T C E N T E R 10
Provisional GPM Products
• Level-1 DPR reflectivity products• Level-1 Inter-calibrated Core and constellation radiometric products• Level-2 DPR precipitation products• Level-2 DPR+GMI combined precipitation products• Level-2 Radar-enhanced
constellation radiometer products–
Constellation radiometer retrievals using the DPR+GMI combined cloud database
• Level-3 Multi-satellite MW global precipitation products• Level-3 Multi-satellite MW+IR global precipitation products• Level-4 Model+observation assimilated global precipitation products
–
NWP global precipitation forecasts
–
4D global “dynamic precipitation analyses”
–
High-resolution (1-2 km) model-downscaled regional precipitation products
Levels-1 & 2 are instantaneous orbital productsLevels-3 & 4 are grid-averaged products

Skofronick-Jackson, JCSDA, 11 March 2009 G O D D A R D S P A C E F L I G H T C E N T E R 11
Provisional GPM precipitation products for nowcasting

Skofronick-Jackson, JCSDA, 11 March 2009 G O D D A R D S P A C E F L I G H T C E N T E R 12
Provisional Algorithm Management & Organization
NASA/JAXA Joint Algorithm TeamCo-Leads: A. Hou, K. Nakamura
Radar Only AlgorithmJAXA Lead: T. Iguchi
Combined AlgorithmJAXA Co-Lead: H. Masunaga
NASA Co-Lead: W. Olson
PMR-RE AlgorithmNASA Leads: C. Kummerow
& G. JacksonJAXA WG team:S. Seto
(U. Tokyo)H. Hanado
(NICT)N. Yoshida (JAXA)
NASA WG team:R. Meneghini (NASA)J. Kwiatkowski (NASA)L. Liao (UMD)S. Durden
(JPL)S. Tanelli (JPL)L. Tian (UMD)Chandra (CSU)
JAXA WG team:M. Hirose (Meijo
U.)F. Furuzawa
(Nagoya U.)
NASA WG team:Z. Haddad (JPL)M. Grecu (UMD)G. Liu (FSU)B. Johnson (UMD)L. Tian (UMD)
JAXA WG team:K. Aonashi (JMA/MRI)S. Shige (Osaka Pref. U.)N. Takahashi (NICT)S. Satoh (NICT)Eito
(JMA/MRI)T. Kubota (JAXA)
NASA WG team:G. Petty (U. Wisconsin)G. Liu (FSU)R. Ferraro (NOAA)D. Staelin (MIT) N.-Y. Wang (UMD)K. Hilburn (RSS)
Currently 8 GPM working groups supporting pre-launch algorithm development (e.g., land
surface emissivity, mixed phase, ground validation, etc.)

Skofronick-Jackson, JCSDA, 11 March 2009 G O D D A R D S P A C E F L I G H T C E N T E R 13
25 January 2004
NOAA, Kongoli, et alGeophys Res. Letters 2003
& Ferraro et al TGARS 2005
Snow
Detection
Empi
rica
l App
roac
h
US-Based GPM Falling Snow Radiometer
Algorithm Retrieval Methodologies
Physically-BasedMarch 2001
NASA Goddard/U. Wash.Skofronick-Jackson, et al TGRS 2004,
Kim JGR 2008
ocea
n
5.5mm/hr(Melted)
Physically-BasedRetrieved (@1.5km) Radar (1/14/01)
FSU, Liu & Noh, 2004, 2005Wakasa Bay, Japan data
Neural NetworksMarch 2001
MITChen and Staelin
Trans Geosci Remote Sens 2003
Polar Retrievals
MIT, Staelin

Skofronick-Jackson, JCSDA, 11 March 2009 G O D D A R D S P A C E F L I G H T C E N T E R 14
Challenges in Estimating Snow over Land
Frozen Particle Variability
CPI in situ images, Andy Heymsfield
Non-Linear and Under-ConstrainedRelationships between
physical characteristics of ice particles and microwave observations
Surface Variability

Skofronick-Jackson, JCSDA, 11 March 2009 G O D D A R D S P A C E F L I G H T C E N T E R 15
EC Centre for Atmospheric Research Experiments (CARE) site located ~70km north of Toronto
IOPs include C580 aircraft carrying extensive microphysical instrumentation. Regional Modeling System output (EC and WRF) during entire field campaign.
Satellites: A-Train (AMSR-E, CloudSat/CALIPSO), NOAA (AMSU-A, AMSU-B)
King City dual-Pol C-Band Radar ~30km from CARE (10 minute scan cycle); High resolution RHI’s run over CARE
Instrument array: multi-freq. (C,X,Ku,Ka,W) radars, profiler, disdrometers, gauges, radiometers, lidars, and radiosonde
Four aircraft IOPs:IOP-1:
Oct. 31 –
Nov. 9; IOP-2:
Nov. 30 –
Dec. 11;IOP-3:
Jan. 17 –
Jan. 28 NASA PMM/GPM; IOP-4:
Feb. 18 -
March 1
Collaboration: Canadian MSC/EC, NASA-JPL CloudSat, NASA-Glenn, McGill U., PSU, and CSU-CIRA DoD Geosciences Center (CLEX-10)
Canadian CloudSat/Calipso
Validation
Project (C3VP)

Skofronick-Jackson, JCSDA, 11 March 2009 G O D D A R D S P A C E F L I G H T C E N T E R 16
Estimating Surface Emissivity & Detecting Falling Snow
1) Use forest cover in each AMSU-B/MHS footprint to obtain average forest fraction, f.
2) For forest fraction, use emissivity: ε13) For (1- f ) use emissivities for different snow depths
a)
If snow depth at Egbert ground station = 0 cm; εavg
=
f *ε1 + (1-
f )*ε2 b)
When snow depth < 30cm; εavg
= f *ε1 + 0.5*(1-
f )*(ε2 + ε3)c)
When snow depth > 5cm; εavg
= f *ε4 + (1-
f )*ε3ε1 = emissivity of winter open forestε2 = emissivity of grassε3 = emissivity of deep dry snowε4 = emissivity of snow in close forestε
from Hewison and English 1999, & Hewison 2001
4) Compute TB using surface emis-sivity
and radiosonde
profiles and assuming clear air
5) Take the Difference: TBAMSU-B
- TBcomputedClearAir6) Multiple channel differences less
than zero = snow detection
Forest Fraction Map/UM GLCF

Skofronick-Jackson, JCSDA, 11 March 2009 G O D D A R D S P A C E F L I G H T C E N T E R 17
20 Jan 2007/Lake Effect Snow/Ground Obs2D
VDPa
rsiv
elTB
(K)
0000UTC 2400UTC
0254
0704
1203UTC
CARE Site
0254 0704 1203
0254 UTC
0704 UTC
1203 UTC

Skofronick-Jackson, JCSDA, 11 March 2009 G O D D A R D S P A C E F L I G H T C E N T E R 18
5ox5o
Detection: 20 Jan 2007: Lake Effect SnowNOAA-17 AMSU-B Overpass at 02:45 UTC (150 GHz)20 – 30 cm snow accumulation from 0300 to 1000 UTC at C3VP site
AMSU-B TB EmissivityCalculated TB
TB Differences (AMSUB-Calc)Dark Red = TB Differences are
Negative at 89, 150, 183±3, ±7 GHzKing City Radar

Skofronick-Jackson, JCSDA, 11 March 2009 G O D D A R D S P A C E F L I G H T C E N T E R 19
22 Jan 2007/Synoptic Snow/Ground Obs
King City C-Band 0814 UTCCARE Site
King City C-Band 0653 UTC
Lowest TB ,Highest snow rate
Parsivel
2DVD
Surface T, RH, AMSU-B
0000UTC 1000UTC

Skofronick-Jackson, JCSDA, 11 March 2009 G O D D A R D S P A C E F L I G H T C E N T E R 20
5ox5o
Detection: 0642UTC 22 Jan 2007: Synoptic SnowAMSU-B Overpass at 06:42 UTC (150 GHz)
AMSU-B TB EmissivityCalculated TB
TB Differences (AMSUB-Calc)Dark Red = TB Differences are
Negative at 89, 150, 183±3, ±7 GHzKing City Radar
4-6 cm snow accumulation at C3VP site

Skofronick-Jackson, JCSDA, 11 March 2009 G O D D A R D S P A C E F L I G H T C E N T E R 21
5ox5o
Detection: 0823UTC 22 Jan 2007: Synoptic Snow
AMSU-B Overpass at 08:23 UTC (150 GHz)
AMSU-B TB EmissivityCalculated TB
TB Differences (AMSUB-Calc)Dark Red = TB Differences are
Negative at 89, 150, 183±3, ±7 GHzKing City Radar

Skofronick-Jackson, JCSDA, 11 March 2009 G O D D A R D S P A C E F L I G H T C E N T E R 22
CloudSat,0733 UTC,
Active Detection
Passive versus Active Snow Detection: 22 Jan 2007
0642 UTC, Passive Detection 0823 UTC, Passive Detection
A B
B
A
B
A

Skofronick-Jackson, JCSDA, 11 March 2009 G O D D A R D S P A C E F L I G H T C E N T E R 23
Sensitivity to Surface Temperature: 21 Jan 2007 (Clear Air)NOAA-15 AMSU-B Overpass at 11:31 UTC (150 GHz)
TB Differences when surface emission (temperature) changes.
WRF modeled temperatureDifferences using WRF TDifferences using fixed T
Skofronick-Jackson, JCSDA, 11 March 2009 G O D D A R D S P A C E F L I G H T C E N T E R 24
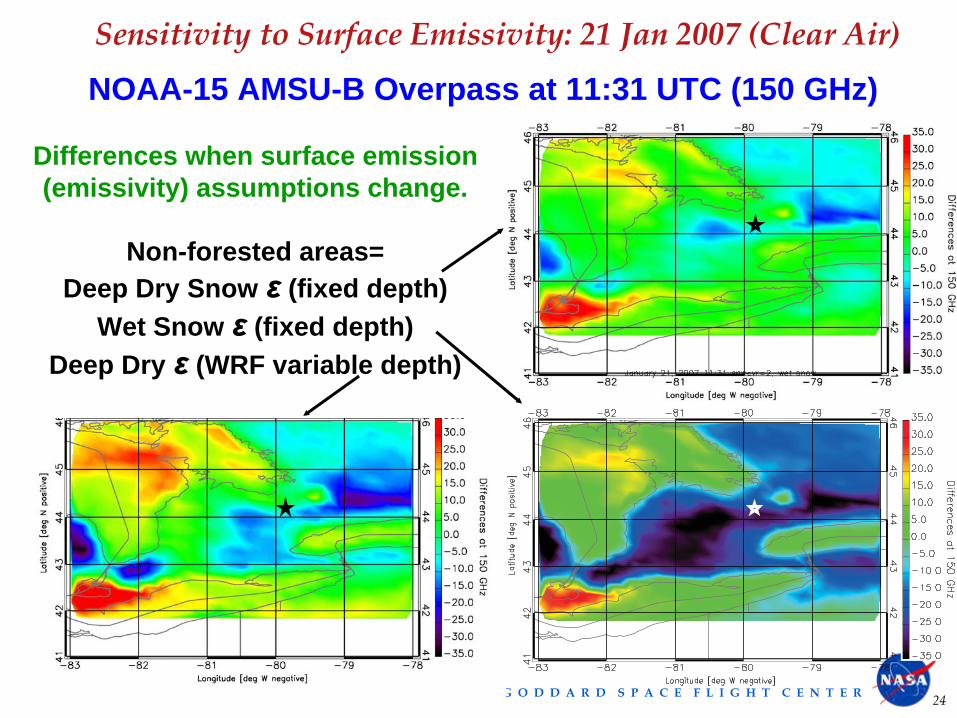
Sensitivity to Surface Emissivity: 21 Jan 2007 (Clear Air)
Differences when surface emission (emissivity) assumptions change.
Non-forested areas=Deep Dry Snow ε
(fixed depth)
Wet Snow ε
(fixed depth)Deep Dry ε
(WRF variable depth)
NOAA-15 AMSU-B Overpass at 11:31 UTC (150 GHz)

Skofronick-Jackson, JCSDA, 11 March 2009 G O D D A R D S P A C E F L I G H T C E N T E R 25
Future Work: Explore Surface Emissivity
•Investigate sensitivity of brightness temperature (10-183 GHz) to changes in surface emission–
Theoretical analysis–
C3VP analysis for clear air days before and after rain and snow events•Evaluate methodologies for obtaining surface emission
–
Comparison study underway for GPM Land Surface Characterization working group–
Estimation from satellite observations (Slide to follow)–
Derived from land surface models (Slide to follow)•
Using measured emissivities
(e.g., Hewison
& English)•
Using numerical models (e.g., F. Weng)–
Other methods (climatology, empirical relationships, etc.)•Test GPM snow detection and estimation algorithms under common
global emission (or emissivity and temperature) database–
Static global database–
Dynamic database

Skofronick-Jackson, JCSDA, 11 March 2009 G O D D A R D S P A C E F L I G H T C E N T E R 26
Emissivity Estimated from AMSU-B Observations
Preliminary results courtesy of James R. Wang
• Retrieved from multiple AMSU-B overpasses per day
• Retrieved emissivity directly over the C3VP site
Future work:1) Use clear-air overpasses only2) Improve TP3000 TPW
retrievals3) Use a multi-layer cloud model
to obtain 183 GHz emissivities
1 Oct 2006 31 Mar 2007
89150
183
89150

Skofronick-Jackson, JCSDA, 11 March 2009 G O D D A R D S P A C E F L I G H T C E N T E R 27
Emissivity Derived from Land Surface Models
Need to adjust surface emissionfor variability in surface state.
Surface Temperature (K)Vegetation Type
Surface Snow Depth (cm)
WRF Modeled Fields
Urban cropland deciduous evergreen/mixed water

Skofronick-Jackson, JCSDA, 11 March 2009 G O D D A R D S P A C E F L I G H T C E N T E R 28
Summary
•GPM Mission Discussion•Snow Detection•Surface Emissivity
QUESTIONS?