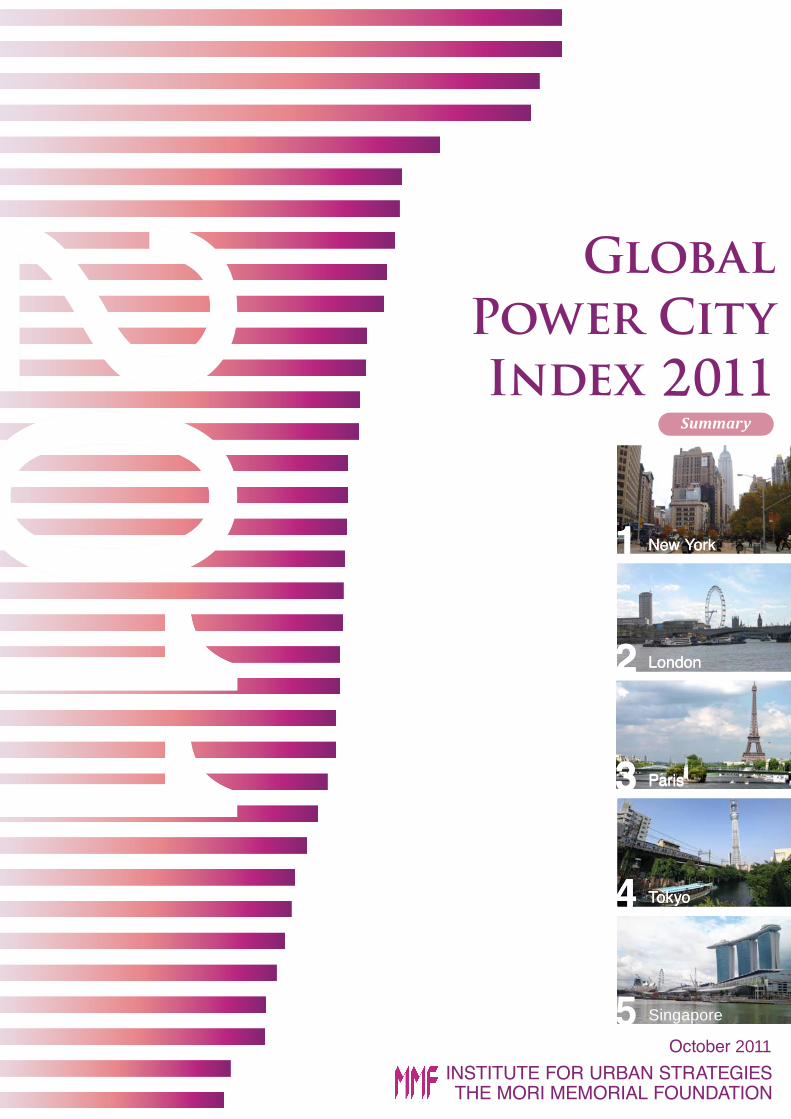
global power city index 2011.pdf
DESCRIPTION
Urban developmentTRANSCRIPT
Singapore
2011
2011
2011
2011
1. New York
2. London
3. Paris
4. Tokyo
5. Singapore
6. Berlin
7. Seoul
8. Hong Kong
9. Amsterdam
10. Frankfurt
11. Sydney
12. Vienna
13. Los Angeles
14. Zurich
15. Osaka
16. Boston
17. Geneva
18. Beijing
19. Copenhagen
20. Madrid
21. San Francisco
22. Vancouver
23. Shanghai
24. Brussels
25. Toronto
26. Chicago
27. Milan
28. Fukuoka
29. Taipei
30. Bangkok
31. Kuala Lumpur
32. Sao Paulo
33. Moscow
34. Mumbai
35. Cairo


Summary of the Global Power City Index-2011
Preface
The Global Power City Index evaluates and ranks the major cities of the world according to their “magnetism,” i.e.,
their comprehensive power to attract creative people and excellent companies from around the world
amidst accelerated interurban competition.
Since the release of the first Global Power City Index in 2008, The Mori Memorial Foundation has vigorously
promoted its findings worldwide via the media and its website, resulting in numerous invitations to present at
international symposiums in New York, Shanghai, Madrid and many other cities. The survey’s findings have been
received well and have stimulated active discussions amongst a large number of leading research institutions
around the world on the topic of urban competitiveness.
The 2011 edition of the Global Power City Index utilizes an extensive database comprised of data from previous
year rankings up to this point to compare each indicator over years and see in what areas Tokyo and other major
world cities are either growing or lagging. A more detailed look at these results will be presented in the “GPCI-2011
YEARBOOK”scheduled for publication at the end of 2011.
It is hoped that these results will serve as a benchmark of the strengths and weaknesses which Tokyo and other
global cities possess, and be utilized as a helpful resource in the development of urban policies and corporate
strategies.
Features of the Global Power City Index (GPCI)
1. The GPCI is the first effort in Japan to analyze and rank comprehensive power of the world’s major cities.
2. Instead of just focusing on specific areas (finance, livability, etc.), the GPCI looks at a variety of functions
which express urban strength in order to assess and rank cities' comprehensive power.
3. Thirty-five of the world’s major cities are selected and evaluated based on six main functions representing
city strength (“Economy,” “Research & Development,” “Cultural Interaction,” “Livability,” “Environment,”
and “Accessibility”), and four global actors who are leading the urban activities in their cities (“Managers,”
“Researchers,” “Artists,” and “Visitors”) and one local actor (“Residents”), thus examining cities from
multiple angles.
4. The 2011 edition of the GPCI has been improved upon in many ways, such as by revising those indicators
which are independently collected and by improving the method used for indicator collection.
5. Challenges which must be addressed for Tokyo to overcome the weaknesses revealed by this ranking
survey have been clarified.
6. This ranking has been produced with the involvement of academics such as Sir Peter Hall, a global authority
in city planning, as well as other experts and analysts, and has been peer reviewed by third parties.
1
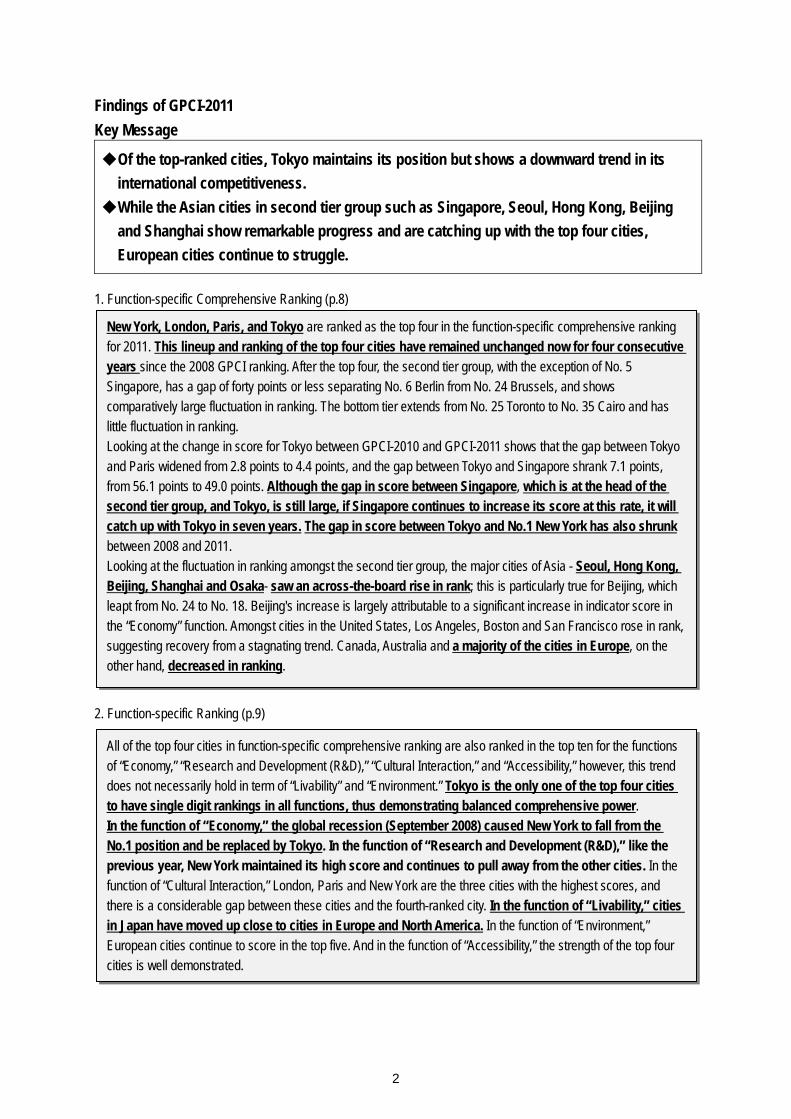
Findings of GPCI-2011
Key Message
◆Of the top-ranked cities, Tokyo maintains its position but shows a downward trend in its
international competitiveness.
◆While the Asian cities in second tier group such as Singapore, Seoul, Hong Kong, Beijing
and Shanghai show remarkable progress and are catching up with the top four cities,
European cities continue to struggle.
1. Function-specific Comprehensive Ranking (p.8)
2. Function-specific Ranking (p.9)
New York, London, Paris, and Tokyo are ranked as the top four in the function-specific comprehensive ranking for 2011. This lineup and ranking of the top four cities have remained unchanged now for four consecutive years since the 2008 GPCI ranking. After the top four, the second tier group, with the exception of No. 5 Singapore, has a gap of forty points or less separating No. 6 Berlin from No. 24 Brussels, and shows comparatively large fluctuation in ranking. The bottom tier extends from No. 25 Toronto to No. 35 Cairo and has little fluctuation in ranking. Looking at the change in score for Tokyo between GPCI-2010 and GPCI-2011 shows that the gap between Tokyo and Paris widened from 2.8 points to 4.4 points, and the gap between Tokyo and Singapore shrank 7.1 points, from 56.1 points to 49.0 points. Although the gap in score between Singapore, which is at the head of the second tier group, and Tokyo, is still large, if Singapore continues to increase its score at this rate, it will catch up with Tokyo in seven years. The gap in score between Tokyo and No.1 New York has also shrunk between 2008 and 2011. Looking at the fluctuation in ranking amongst the second tier group, the major cities of Asia - Seoul, Hong Kong, Beijing, Shanghai and Osaka- saw an across-the-board rise in rank; this is particularly true for Beijing, which leapt from No. 24 to No. 18. Beijing's increase is largely attributable to a significant increase in indicator score in the “Economy” function. Amongst cities in the United States, Los Angeles, Boston and San Francisco rose in rank, suggesting recovery from a stagnating trend. Canada, Australia and a majority of the cities in Europe, on the other hand, decreased in ranking.
All of the top four cities in function-specific comprehensive ranking are also ranked in the top ten for the functions of “Economy,” “Research and Development (R&D),” “Cultural Interaction,” and “Accessibility,” however, this trend does not necessarily hold in term of “Livability” and “Environment.” Tokyo is the only one of the top four cities to have single digit rankings in all functions, thus demonstrating balanced comprehensive power. In the function of “Economy,” the global recession (September 2008) caused New York to fall from the No.1 position and be replaced by Tokyo. In the function of “Research and Development (R&D),” like the previous year, New York maintained its high score and continues to pull away from the other cities. In the function of “Cultural Interaction,” London, Paris and New York are the three cities with the highest scores, and there is a considerable gap between these cities and the fourth-ranked city. In the function of “Livability,” cities in Japan have moved up close to cities in Europe and North America. In the function of “Environment,” European cities continue to score in the top five. And in the function of “Accessibility,” the strength of the top four cities is well demonstrated.
2

3. Actor-specific Ranking (p.10)
4. Comparison of Top 4 Cities <Function-specific> (p.11)
5. Comparison between Tokyo and Major Asian Cities <Function-specific> (p.11)
6.Analysis of the Strengths and Weaknesses of Tokyo (p.12-13)
7. Over year trends (p.14)
The top four cities also rank high amongst actor groups; however, Tokyo ranks comparatively low (No. 8) amongst “Managers.” Last year Tokyo faced fierce competition with Beijing and Shanghai, and with this year's results, it has finally been surpassed. While Tokyo is stagnant in terms of indicators for the “Economy” function, Beijing and Shanghai have surged forward, resulting in a reversal. New York’s ranking amongst “Managers” also declined, going from No. 1 to No. 4. This appears to be the result of a drop in indicator scores stemming from the global recession (September 2008). Like last year, the comprehensive rank of North American and European cities is middling; however, they are ranked in the top ten by “Artists” and “Residents.”
Looking at Tokyo's strengths and weaknesses by indicator group shows that Tokyo has a number of strengths in the functions of “Economy” and “Research and Development (R&D),” while strong indicator groups in other functions include “Shopping & Dining,” “Life Support Functions,” “Ecology” and “Infrastructure of Inner-city Transportation.” On the other hand, indicator groups where Tokyo displays weakness include “Regulations and Risks,” “Accommodation Environment,” “Cost of Living” and “Natural Environment.” Comparing Tokyo's strengths and weaknesses between GPCI-2010 and GPCI-2011 shows that Tokyo has increased its score over the previous year in the “Research and Development (R&D)” indicator groups of “Readiness for Accepting and Supporting Researchers” and “Research Achievement;” the “Livability” indicator group of “Life Support Functions;” and the “Accessibility” indicator group of “Infrastructure of Int'l Transportation.” Tokyo has weakened, however, in the “Economy” indicator group of “Business Environment;” the “Research and Development (R&D)” indicator group of “Research Background;” and the “Cultural Interaction” indicator group of “Accommodation Environment.”
Looking at Tokyo's change over time show that, while still possessing a significant economic concentration, there is a downward trend reflecting such factors as decreasing scores for presence of top companies and visitors from overseas.
Comparing the deviation scores for the top four cities shows a trend similar to the previous year's. New York and London rank comparatively low in the functions of “Livability” and “Environment.” Paris ranks comparatively low in “Environment,” New York offsets these lower rankings, however, with a high ranking in “Research and Development (R&D),” and London offsets them with a high ranking in “Cultural Interaction”. Tokyo is weak in “Cultural Interaction” compared with the top three cities; nevertheless, it is above the average in all functions. However, as will be discussed later in “6. Analysis of the Strengths and Weaknesses of Tokyo,” although Tokyo is above average in all functions, it does not have the kinds of stand-out strengths that the top three cities possess, thus keeping it firmly in the No. 4 spot.
Comparing the major cities of Asia shows that, while Tokyo maintains relative superiority over all other cities except
in the function of “Cultural Interaction, “Beijing is closing the gap in the “Economy” function. In the
“Accessibility” function, reduced traveling time to Narita Airport from Tokyo has helped raise Tokyo's score
compare to the other major Asian cities. Beijing and Shanghai are below the average in the functions of
“Research and Development (R&D)” and “Environment,” revealing these as weaknesses for both cities.
3

1. GPCI-2011 Methodology
1-1. GPCI-2011 Research Organization
The GPCI Committee is comprised of five members, including Sir Peter Hall, Professor at University of London as Principal Advisor, and Heizo Takenaka, Professor at Keio University and the Director of the Global Security Research Institute, as Chairman. The Committee provides supervision of the ranking creation process at key point. The Working Group, headed by Hiroo Ichikawa, Professor and Dean of the Graduate School of Governance Studies at Meiji University, as its Principal, performed research and analysis and elicited advice from expert partners worldwide regarding the perspective of global actors to help in the creation of the ranking. In order to ensure the adequacy of the ranking creation process and results, a third-party peer review by two reviewers is undertaken which checks over the contents and provides suggestions for improvement. The GPCI-2011 has been created under the organization shown below.
Fig. 1-1 Research Organization
This ranking is created under the GPCI Committee, chaired by Heizo Takenaka, chairman of the Institute for Urban Strategies at the Mori Memorial Foundation and professor at Keio University. The Committee also includes scholars such as Sir Peter Hall, a global authority in city planning, as well as expert partners in various fields. A third-party peer review has been undertaken to ensure the fairness of the ranking.
4

1-2. Cities for GPCI-2011
Fig. 1-2 35 cities for GPCI
Areas Cities
Europe Madrid, London, Paris, Brussels, Amsterdam, Geneva, Frankfurt, Berlin, Zurich, Milan,
Copenhagen, Vienna, Moscow
Africa Cairo
Asia Mumbai, Bangkok, Kuala Lumpur, Singapore, Hong Kong, Beijing, Shanghai, Taipei, Seoul,
Fukuoka, Osaka, Tokyo
Oceania Sydney
North America Vancouver, San Francisco, Los Angeles, Chicago, Toronto, New York, Boston
South America Sao Paulo
* Cities are arranged by longitudinal coordinates (from lowest to highest).
Tokyo New York
Boston
Los Angeles
San Francisco
ChicagoSeoul
Toronto
Sydney
Mumbai
Taipei
Hong Kong
Beijing
Shanghai
Bangkok
Kuala Lumpur
Singapore
Moscow
Madrid
Milan
London
Paris
Vienna
Berlin
Amsterdam
Zurich
Geneva
Brussels
Copenhagen
Frankfurt
São Paulo
Cairo
Fukuoka
Osaka
Vancouver
Tokyo New York
Boston
Los Angeles
San Francisco
ChicagoSeoul
Toronto
Sydney
Mumbai
Taipei
Hong Kong
Beijing
Shanghai
Bangkok
Kuala Lumpur
Singapore
Moscow
Madrid
Milan
London
Paris
Vienna
Berlin
Amsterdam
Zurich
Geneva
Brussels
Copenhagen
Frankfurt
São Paulo
Cairo
Fukuoka
Osaka
Vancouver
5

1-3. Ranking Creation Method
Fig. 1-3 Flow of Creation for Function-based Ranking
Comprehensive
Ranking
Economy
Research & Development
Cultural Interaction
Livability
Environment
Accessibility
Function
Market Attractiveness
Research Background
Trendsetting Potential
Working Environment
Ecology
Economic Vitality
Business Environment
Regulations and Risks
Readiness for Accepting& Supporting Researchers
Research Achievement
Accommodation Environment
Resources of Attracting Visitors
Shopping & Dining
Volume of Interaction
Cost of Living
Security and Safety
Life Support Functions
Pollution
Natural Environment
Infrastructure of Int'l Transportation
Infrastructure of Inner-city Transportation
Indicator Group
3
3
4
2
4
4
3
5
3
2
3
2
5
2
3
2
4
5
4
2
4
Indicator
Total 69 Indicators
6

Fig. 1-4 Flow of Creation for Actor-specific Ranking
Research & Development
Cultural Interaction
Livability
Environment
Accessibility
Functio
n
Indicato
rs
Economy
1. Accumulation of Enterprises and Business Deals
2. Potential of Business Growth
3. Ease of Doing Business
4. Business Environment
5. Richness in Human Resources
6. Accumulation of Industry to Support Business
7. Favorable Environment for Employees and their Families
8. Political and Economic Risk, and Disaster Vulnerability
1. Cultural Stimulation
2. Accumulation of Artists
3. Accumulation of Art Markets
4. Environment for Creative Activities (Studio Rent and Spaces)
5. Environment for Daily Life (Ease of Living)
1. Qualities of Research Institutions, Researchers and Directors
2. Accumulation of Research Institutions & Researchers
3. Opportunities that stimulate Researchers in Conducting Academic Activities
4. Readiness for Accepting Researchers (Research Funding, Support with Living Expenses etc.)
5. Career Opportunities for Researchers
6. Environment for Daily Life (Ease of Living)
Actor‐specific Ranking
Actor
Manager Artist Visitor Resident
14
ManagerScore
49Indicators
2
7
12
7
7
ResearcherScore
34Indicators
3
7
7
8
6
3
ArtistScore
24Indicators
2
‐
7
8
6
1
VisitorScore
24Indicators
‐
‐
12
5
‐
7
ResidentScore
39Indicators
6
2
7
11
9
4
1. Environment to Purchase Goods (Prices and Easiness to Get Products)
2. Environment for Daily Life (Ease of Living)
3. Work Environment (Income and Employment Opportunities)
4. Educational Environment
5. Leisure Activities6. Public Safety7. Quality of Medical
Treatment
1. Cultural Attractiveness and Opportunities for Interaction
2. Public Safety 3. Richness in Tourist
Spots4. High-class
Accommodations 5. Dining (Variety of
Cuisines, Prices etc.)
6. Shopping (Environment, Prices, Attractiveness etc.)
7. Mobility (Travel Time and Fares to Destinations)
Researcher
Important Factors Demanded by Each Actor
7
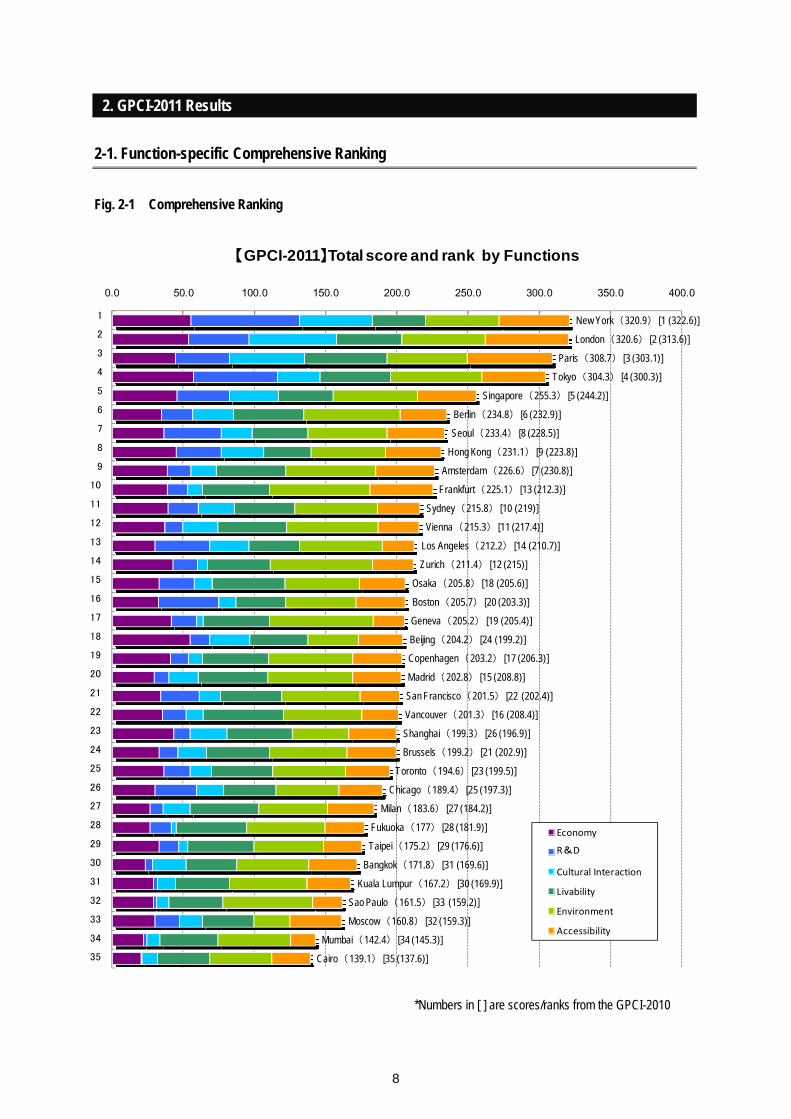
2. GPCI-2011 Results
2-1. Function-specific Comprehensive Ranking
Fig. 2-1 Comprehensive Ranking
New York(320.9)[1 (322.6)]
London(320.6)[2 (313.6)]
Paris(308.7)[3 (303.1)]
Tokyo(304.3) [4 (300.3)]
Singapore(255.3) [5 (244.2)]
Berlin(234.8) [6 (232.9)]
Seoul(233.4) [8 (228.5)]
Hong Kong(231.1) [9 (223.8)]
Amsterdam(226.6)[7 (230.8)]
Frankfurt(225.1) [13 (212.3)]
Sydney(215.8) [10 (219)]
Vienna(215.3) [11 (217.4)]
Los Angeles(212.2) [14 (210.7)]
Zurich(211.4) [12 (215)]
Osaka(205.8)[18 (205.6)]
Boston(205.7)[20 (203.3)]
Geneva(205.2) [19 (205.4)]
Beijing(204.2)[24 (199.2)]
Copenhagen(203.2) [17 (206.3)]
Madrid(202.8) [15 (208.8)]
San Francisco(201.5) [22 (202.4)]
Vancouver(201.3) [16 (208.4)]
Shanghai(199.3) [26 (196.9)]
Brussels(199.2) [21 (202.9)]
Toronto(194.6) [23 (199.5)]
Chicago(189.4) [25 (197.3)]
Milan(183.6) [27 (184.2)]
Fukuoka(177) [28 (181.9)]
Taipei(175.2) [29 (176.6)]
Bangkok(171.8) [31 (169.6)]
Kuala Lumpur(167.2) [30 (169.9)]
Sao Paulo(161.5)[33 (159.2)]
Moscow(160.8)[32 (159.3)]
Mumbai(142.4) [34 (145.3)]
Cairo(139.1) [35 (137.6)]
0.0 50.0 100.0 150.0 200.0 250.0 300.0 350.0 400.0
【GPCI-2011】Total score and rank by Functions
Economy
R&D
Cultural Interaction
Livability
Environment
Accessibility
1
2
3
4
5
6
7
8
9
10
11
12
13
14
15
16
17
18
19
20
21
22
23
24
25
26
27
28
29
30
31
32
33
34
35
*Numbers in [ ] are scores/ranks from the GPCI-2010
8
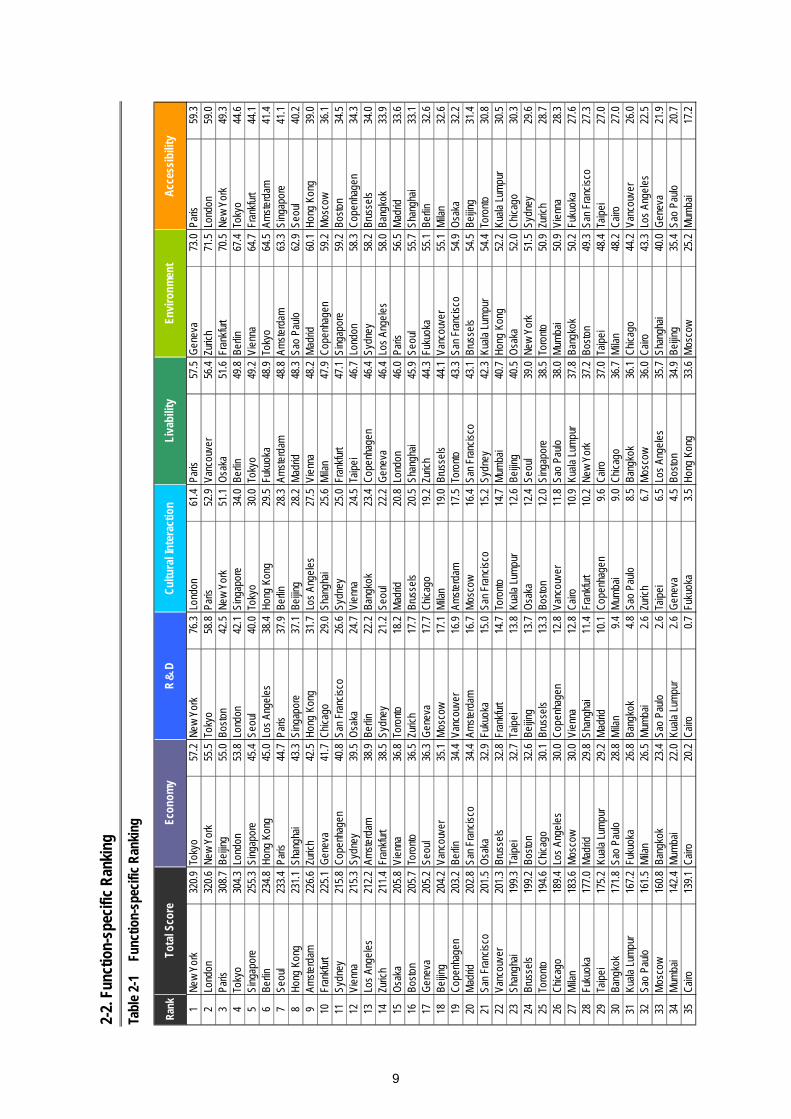
2-2.
Fun
ctio
n-sp
ecifi
c R
anki
ng
Tabl
e 2-
1 Fu
nctio
n-sp
ecifi
c R
anki
ng
Rank 1
New
York
320.
9To
kyo
57.2
New
York
76.3
Lond
on61
.4Pa
ris57
.5G
enev
a73
.0Pa
ris59
.32
Lond
on32
0.6
New
York
55.5
Toky
o58
.8Pa
ris52
.9Va
ncou
ver
56.4
Zuric
h71
.5Lo
ndon
59.0
3Pa
ris30
8.7
Beijin
g55
.0Bo
ston
42.5
New
York
51.1
Osa
ka51
.6Fr
ankf
urt
70.5
New
York
49.3
4To
kyo
304.
3Lo
ndon
53.8
Lond
on42
.1Si
ngap
ore
34.0
Berli
n49
.8Be
rlin
67.4
Toky
o44
.65
Sing
apor
e25
5.3
Sing
apor
e45
.4Se
oul
40.0
Toky
o30
.0To
kyo
49.2
Vien
na64
.7Fr
ankf
urt
44.1
6Be
rlin
234.
8Ho
ng K
ong
45.0
Los
Ange
les
38.4
Hong
Kon
g29
.5Fu
kuok
a48
.9To
kyo
64.5
Amst
erda
m41
.47
Seou
l23
3.4
Paris
44.7
Paris
37.9
Berli
n28
.3Am
ster
dam
48.8
Amst
erda
m63
.3Si
ngap
ore
41.1
8Ho
ng K
ong
231.
1Sh
angh
ai43
.3Si
ngap
ore
37.1
Beijin
g28
.2M
adrid
48.3
Sao
Paul
o62
.9Se
oul
40.2
9Am
ster
dam
226.
6Zu
rich
42.5
Hong
Kon
g31
.7Lo
s An
gele
s27
.5Vi
enna
48.2
Mad
rid60
.1Ho
ng K
ong
39.0
10Fr
ankf
urt
225.
1G
enev
a41
.7Ch
icag
o29
.0Sh
angh
ai25
.6M
ilan
47.9
Cope
nhag
en59
.2M
osco
w36
.111
Sydn
ey21
5.8
Cope
nhag
en40
.8Sa
n Fr
anci
sco
26.6
Sydn
ey25
.0Fr
ankf
urt
47.1
Sing
apor
e59
.2Bo
ston
34.5
12Vi
enna
215.
3Sy
dney
39.5
Osa
ka24
.7Vi
enna
24.5
Taip
ei46
.7Lo
ndon
58.3
Cope
nhag
en34
.313
Los
Ange
les
212.
2Am
ster
dam
38.9
Berli
n22
.2Ba
ngko
k23
.4Co
penh
agen
46.4
Sydn
ey58
.2Br
usse
ls34
.014
Zuric
h21
1.4
Fran
kfur
t38
.5Sy
dney
21.2
Seou
l22
.2G
enev
a46
.4Lo
s An
gele
s58
.0Ba
ngko
k33
.915
Osa
ka20
5.8
Vien
na36
.8To
ront
o18
.2M
adrid
20.8
Lond
on46
.0Pa
ris56
.5M
adrid
33.6
16Bo
ston
205.
7To
ront
o36
.5Zu
rich
17.7
Brus
sels
20.5
Shan
ghai
45.9
Seou
l55
.7Sh
angh
ai33
.117
Gen
eva
205.
2Se
oul
36.3
Gen
eva
17.7
Chic
ago
19.2
Zuric
h44
.3Fu
kuok
a55
.1Be
rlin
32.6
18Be
ijing
204.
2Va
ncou
ver
35.1
Mos
cow
17.1
Mila
n19
.0Br
usse
ls44
.1Va
ncou
ver
55.1
Mila
n32
.619
Cope
nhag
en20
3.2
Berli
n34
.4Va
ncou
ver
16.9
Amst
erda
m17
.5To
ront
o43
.3Sa
n Fr
anci
sco
54.9
Osa
ka32
.220
Mad
rid20
2.8
San
Fran
cisc
o34
.4Am
ster
dam
16.7
Mos
cow
16.4
San
Fran
cisc
o43
.1Br
usse
ls54
.5Be
ijing
31.4
21Sa
n Fr
anci
sco
201.
5O
saka
32.9
Fuku
oka
15.0
San
Fran
cisc
o15
.2Sy
dney
42.3
Kual
a Lu
mpu
r54
.4To
ront
o30
.822
Vanc
ouve
r20
1.3
Brus
sels
32.8
Fran
kfur
t14
.7To
ront
o14
.7M
umba
i40
.7Ho
ng K
ong
52.2
Kual
a Lu
mpu
r30
.523
Shan
ghai
199.
3Ta
ipei
32.7
Taip
ei13
.8Ku
ala
Lum
pur
12.6
Beijin
g40
.5O
saka
52.0
Chic
ago
30.3
24Br
usse
ls19
9.2
Bost
on32
.6Be
ijing
13.7
Osa
ka12
.4Se
oul
39.0
New
York
51.5
Sydn
ey29
.625
Toro
nto
194.
6Ch
icag
o30
.1Br
usse
ls13
.3Bo
ston
12.0
Sing
apor
e38
.5To
ront
o50
.9Zu
rich
28.7
26Ch
icag
o18
9.4
Los
Ange
les
30.0
Cope
nhag
en12
.8Va
ncou
ver
11.8
Sao
Paul
o38
.0M
umba
i50
.9Vi
enna
28.3
27M
ilan
183.
6M
osco
w30
.0Vi
enna
12.8
Cairo
10.9
Kual
a Lu
mpu
r37
.8Ba
ngko
k50
.2Fu
kuok
a27
.628
Fuku
oka
177.
0M
adrid
29.8
Shan
ghai
11.4
Fran
kfur
t10
.2Ne
w Yo
rk37
.2Bo
ston
49.3
San
Fran
cisc
o27
.329
Taip
ei17
5.2
Kual
a Lu
mpu
r29
.2M
adrid
10.1
Cope
nhag
en9.
6Ca
iro37
.0Ta
ipei
48.4
Taip
ei27
.030
Bang
kok
171.
8Sa
o Pa
ulo
28.8
Mila
n9.
4M
umba
i9.
0Ch
icag
o36
.7M
ilan
48.2
Cairo
27.0
31Ku
ala
Lum
pur
167.
2Fu
kuok
a26
.8Ba
ngko
k4.
8Sa
o Pa
ulo
8.5
Bang
kok
36.1
Chic
ago
44.2
Vanc
ouve
r26
.032
Sao
Paul
o16
1.5
Mila
n26
.5M
umba
i2.
6Zu
rich
6.7
Mos
cow
36.0
Cairo
43.3
Los
Ange
les
22.5
33M
osco
w16
0.8
Bang
kok
23.4
Sao
Paul
o2.
6Ta
ipei
6.5
Los
Ange
les
35.7
Shan
ghai
40.0
Gen
eva
21.9
34M
umba
i14
2.4
Mum
bai
22.0
Kual
a Lu
mpu
r2.
6G
enev
a4.
5Bo
ston
34.9
Beijin
g35
.4Sa
o Pa
ulo
20.7
35Ca
iro13
9.1
Cairo
20.2
Cairo
0.7
Fuku
oka
3.5
Hong
Kon
g33
.6M
osco
w25
.2M
umba
i17
.2
Tota
l Sco
reA
cces
sibi
lity
Econ
omy
R&
DC
ultu
ral I
nter
actio
nLi
vabi
lity
Envi
ronm
ent
9

2-3.
Act
or-s
peci
fic R
anki
ng
Tabl
e 2-
2 A
ctor
-spe
cific
Ran
king
Rank 1
Lond
on55
.3Ne
w Yo
rk64
.7Pa
ris60
.6Lo
ndon
54.8
Paris
62.5
2Si
ngap
ore
53.7
Toky
o53
.6Lo
ndon
52.1
New
York
52.4
Lond
on56
.03
Hong
Kon
g49
.6Lo
ndon
49.8
New
York
51.6
Paris
51.8
Toky
o54
.04
New
York
48.2
Paris
47.6
Toky
o47
.2Ho
ng K
ong
43.3
New
York
53.4
5Be
ijing
47.5
Bost
on37
.0Be
rlin
44.3
Toky
o42
.0Zu
rich
50.8
6Pa
ris47
.2Se
oul
36.4
Vien
na39
.5Be
ijing
41.5
Berli
n50
.67
Shan
ghai
47.1
Sing
apor
e34
.0Lo
s An
gele
s37
.1Sh
angh
ai41
.4Fr
ankf
urt
50.5
8To
kyo
44.8
Los
Ange
les
33.7
Amst
erda
m34
.0Si
ngap
ore
38.6
Vien
na48
.99
Zuric
h42
.2Sa
n Fr
anci
sco
32.2
Mad
rid33
.0Be
rlin
37.6
Vanc
ouve
r48
.110
Gen
eva
42.2
Hong
Kon
g30
.2M
ilan
32.9
Seou
l35
.4G
enev
a47
.411
Amst
erda
m41
.0Sy
dney
30.0
San
Fran
cisc
o31
.6Vi
enna
34.9
Amst
erda
m47
.212
Cope
nhag
en40
.6Ch
icag
o28
.7Be
ijing
30.9
Bang
kok
34.1
Cope
nhag
en46
.913
Seou
l40
.5Be
rlin
28.4
Osa
ka30
.6M
adrid
33.3
Osa
ka46
.514
Vanc
ouve
r40
.4Va
ncou
ver
25.9
Chic
ago
30.3
Amst
erda
m32
.5Ho
ng K
ong
45.8
15Vi
enna
40.3
Osa
ka25
.7Co
penh
agen
30.2
Mila
n32
.0M
ilan
45.4
16Be
rlin
38.2
Amst
erda
m25
.7Br
usse
ls30
.1Br
usse
ls30
.3Bo
ston
45.2
17Fr
ankf
urt
38.2
Zuric
h25
.3To
ront
o29
.7Sy
dney
30.0
San
Fran
cisc
o44
.718
Sydn
ey37
.7G
enev
a24
.9Sy
dney
29.1
Osa
ka30
.0Se
oul
43.4
19To
ront
o37
.4Be
ijing
24.8
Vanc
ouve
r28
.9Ta
ipei
29.3
Sydn
ey42
.520
Taip
ei36
.9Vi
enna
24.6
Fran
kfur
t28
.3Fr
ankf
urt
28.6
Fuku
oka
42.4
21Ku
ala
Lum
pur
36.4
Cope
nhag
en24
.4Sh
angh
ai27
.4Lo
s An
gele
s28
.5Br
usse
ls42
.222
Mad
rid36
.2To
ront
o23
.5Bo
ston
26.8
Toro
nto
28.1
Sing
apor
e42
.023
Bost
on35
.6Br
usse
ls21
.7Se
oul
26.1
Chic
ago
27.1
Mad
rid41
.824
Brus
sels
35.3
Mos
cow
21.6
Mos
cow
25.2
Vanc
ouve
r27
.0To
ront
o41
.725
Osa
ka33
.5Sh
angh
ai21
.2Ba
ngko
k24
.6Ca
iro26
.2Be
ijing
41.7
26Sa
n Fr
anci
sco
33.1
Taip
ei20
.3Ku
ala
Lum
pur
23.8
Bost
on25
.9Ta
ipei
39.6
27Sa
o Pa
ulo
32.8
Fran
kfur
t19
.0Ta
ipei
23.7
San
Fran
cisc
o25
.6Lo
s An
gele
s37
.528
Los
Ange
les
32.2
Mila
n18
.1Fu
kuok
a23
.7Co
penh
agen
25.4
Shan
ghai
36.7
29Ch
icag
o32
.2M
adrid
17.6
Sing
apor
e23
.7Zu
rich
24.6
Chic
ago
35.6
30Fu
kuok
a30
.6Fu
kuok
a17
.4Sa
o Pa
ulo
22.9
Kual
a Lu
mpu
r24
.3M
osco
w35
.031
Bang
kok
30.3
Sao
Paul
o15
.9Zu
rich
22.6
Fuku
oka
23.8
Bang
kok
29.0
32M
ilan
29.1
Bang
kok
15.0
Mum
bai
22.5
Mos
cow
23.6
Mum
bai
27.5
33M
osco
w29
.0Ku
ala
Lum
pur
13.5
Gen
eva
22.3
Mum
bai
22.3
Sao
Paul
o26
.734
Cairo
27.6
Mum
bai
11.8
Cairo
20.5
Gen
eva
20.9
Cairo
26.2
35M
umba
i27
.4Ca
iro8.
2Ho
ng K
ong
20.4
Sao
Paul
o17
.2Ku
ala
Lum
pur
23.3
Resi
dent
Man
ager
Rese
arch
erAr
tist
Visi
tor
10

2-4. Comparison of Top 4 Cities
Fig. 2-2 Function-specific Deviation Scores
2-5. Comparison of Major Asian Cities
Fig. 2-3 Function-specific Deviation Scores
30.0
40.0
50.0
60.0
70.0
80.0
90.0
Economy Research and Development
Cultural Interaction Livability Environment Accessibility
Function-specific Deviation Scores (Top 4 Cities)
New York(1st) London(2nd) Paris(3rd) Tokyo(4th)
30.0
35.0
40.0
45.0
50.0
55.0
60.0
65.0
70.0
75.0
Economy Research and Development
Cultural Interaction Livability Environment Accessibility
Function-specific Deviation Scores (Major Asian Cities)
Tokyo(4th) Singapore(5th) Seoul(7th) Hong Kong(8th) Beijing(18th) Shanghai(23th)
11
2-6. Analysis of the Strengths and Weaknesses of Tokyo
Tokyo's Strengths and Weaknesses by Indicator Group
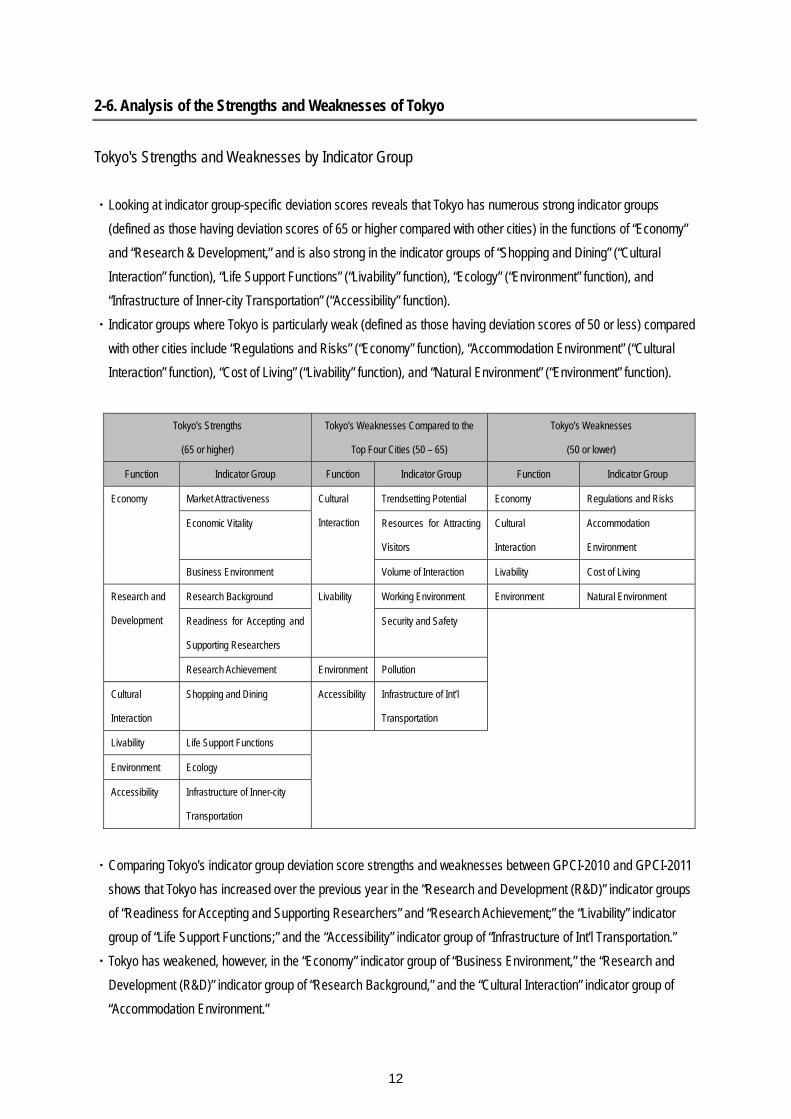
・Looking at indicator group-specific deviation scores reveals that Tokyo has numerous strong indicator groups
(defined as those having deviation scores of 65 or higher compared with other cities) in the functions of “Economy”
and “Research & Development,” and is also strong in the indicator groups of “Shopping and Dining” (“Cultural
Interaction” function), “Life Support Functions” (“Livability” function), “Ecology” (“Environment” function), and
“Infrastructure of Inner-city Transportation” (“Accessibility” function).
・Indicator groups where Tokyo is particularly weak (defined as those having deviation scores of 50 or less) compared
with other cities include “Regulations and Risks” (“Economy” function), “Accommodation Environment” (“Cultural
Interaction” function), “Cost of Living” (“Livability” function), and “Natural Environment” (“Environment” function).
・Comparing Tokyo's indicator group deviation score strengths and weaknesses between GPCI-2010 and GPCI-2011
shows that Tokyo has increased over the previous year in the “Research and Development (R&D)” indicator groups
of “Readiness for Accepting and Supporting Researchers” and “Research Achievement;” the “Livability” indicator
group of “Life Support Functions;” and the “Accessibility” indicator group of “Infrastructure of Int'l Transportation.”
・Tokyo has weakened, however, in the “Economy” indicator group of “Business Environment,” the “Research and
Development (R&D)” indicator group of “Research Background,” and the “Cultural Interaction” indicator group of
“Accommodation Environment.”
Tokyo’s Strengths
(65 or higher)
Tokyo’s Weaknesses Compared to the
Top Four Cities (50 – 65)
Tokyo’s Weaknesses
(50 or lower)
Function Indicator Group Function Indicator Group Function Indicator Group
Economy Market Attractiveness Cultural
Interaction
Trendsetting Potential Economy Regulations and Risks
Economic Vitality Resources for Attracting
Visitors
Cultural
Interaction
Accommodation
Environment
Business Environment Volume of Interaction Livability Cost of Living
Research and
Development
Research Background Livability Working Environment Environment Natural Environment
Readiness for Accepting and
Supporting Researchers
Security and Safety
Research Achievement Environment Pollution
Cultural
Interaction
Shopping and Dining Accessibility Infrastructure of Int’l
Transportation
Livability Life Support Functions
Environment Ecology
Accessibility Infrastructure of Inner-city
Transportation
12
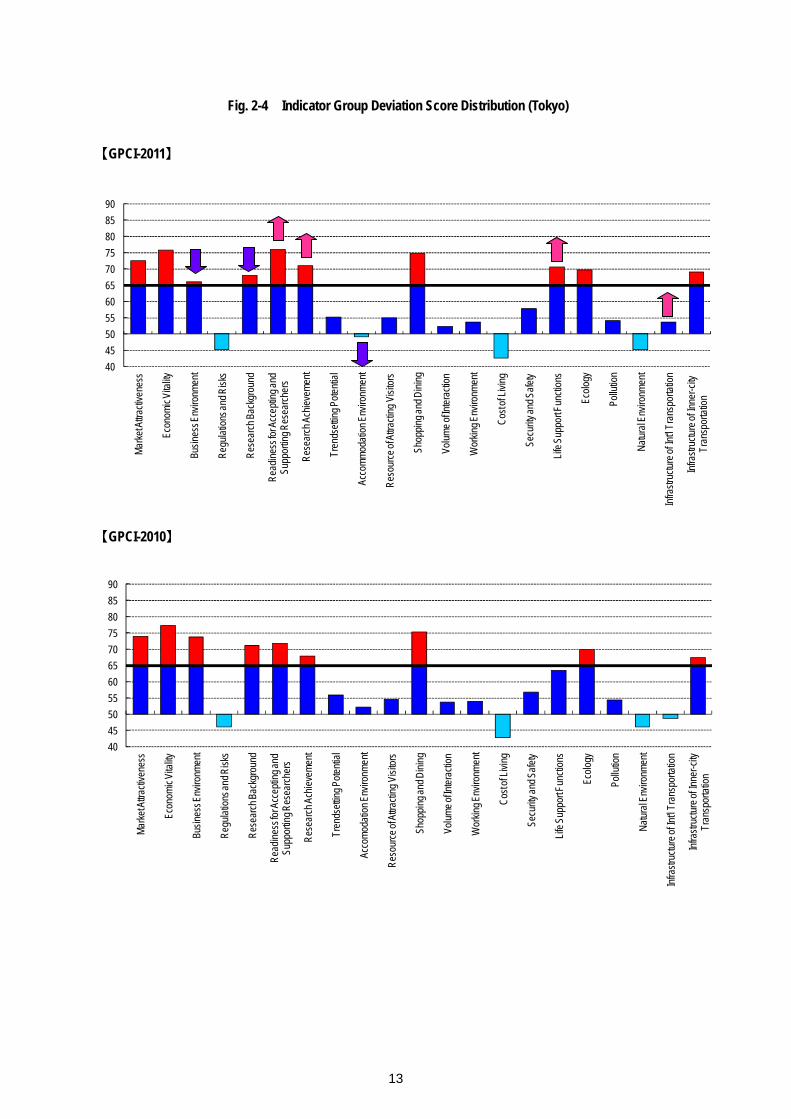
Fig. 2-4 Indicator Group Deviation Score Distribution (Tokyo)
【GPCI-2011】
【GPCI-2010】
40
45
50
55
60
65
70
75
80
85
90
Mar
ket A
ttrac
tiven
ess
Econ
omic
Vita
lity
Busi
ness
Env
ironm
ent
Reg
ulat
ions
and
Ris
ks
Res
earc
h Ba
ckgr
ound
Rea
dine
ss fo
r Acc
eptin
g an
d Su
ppor
ting
Res
earc
hers
Res
earc
h Ac
hiev
emen
t
Tren
dset
ting
Pote
ntia
l
Acco
mm
odat
ion
Envi
ronm
ent
Res
ourc
e of
Attr
actin
g Vi
sito
rs
Shop
ping
and
Din
ing
Volu
me
of In
tera
ctio
n
Wor
king
Env
ironm
ent
Cos
t of L
ivin
g
Secu
rity a
nd S
afet
y
Life
Sup
port
Func
tions
Ecol
ogy
Pollu
tion
Nat
ural
Env
ironm
ent
Infra
stru
ctur
e of
Int'l
Tran
spor
tatio
n
Infra
stru
ctur
e of
Inne
r-city
Tr
ansp
orta
tion
40
45
50
55
60
65
70
75
80
85
90
Mar
ket A
ttrac
tiven
ess
Econ
omic
Vita
lity
Busi
ness
Env
ironm
ent
Reg
ulat
ions
and
Ris
ks
Res
earc
h Ba
ckgr
ound
Rea
dine
ss fo
r Acc
eptin
g an
d Su
ppor
ting
Res
earc
hers
Res
earc
h Ac
hiev
emen
t
Tren
dset
ting
Pote
ntia
l
Acco
mod
atio
n En
viro
nmen
t
Res
ourc
e of
Attr
actin
g Vi
sito
rs
Shop
ping
and
Din
ing
Volu
me
of In
tera
ctio
n
Wor
king
Env
ironm
ent
Cos
t of L
ivin
g
Secu
rity a
nd S
afet
y
Life
Sup
port
Func
tions
Ecol
ogy
Pollu
tion
Nat
ural
Env
ironm
ent
Infra
stru
ctur
e of
Int'l
Tran
spor
tatio
n
Infra
stru
ctur
e of
Inne
r-city
Tr
ansp
orta
tion
13

2-7. Over year trends
An interannual comparison for some of the indicators where Tokyo shows a declining trend is given below based on
the indicator data obtained from previous GPCI rankings. The indicator data used in each of the GPCI from 2009 to
2011 is applied in the comparison here.
1) World's Top 300 Companies (Indicator Group: Economic Vitality)
Fig. 2-5 World's Top 300 Companies Score Periodical change
2) Number of Visitors from Abroad (Indicator Group: Volume of Interaction)
Fig. 2-6 Number of Visitors from Abroad Periodical change
0
2,000,000
4,000,000
6,000,000
8,000,000
10,000,000
12,000,000
14,000,000
16,000,000
Toky
o
Sin
gapore
Seoul
Hong
Kong
Beiji
n
Shangh
ai
Person Number of Visitors from Abroad (Major Asian Cities)
2009 2010 2011
0
2,000,000
4,000,000
6,000,000
8,000,000
10,000,000
12,000,000
14,000,000
16,000,000
New
Yor
k
Lon
don
Paris
Tok
yo
Person Number of Visitors from Abroad (Top 4 Cities)
2009 2010 2011
0
500
1000
1500
2000
2500
3000
3500
4000
4500
5000
New Y
ork
Londo
n
Par
is
Toky
oScore World's Top 300 Companies (Top 4 Cities)
2009 2010 2011
0
500
1000
1500
2000
2500
3000
3500
4000
4500
5000
Toky
o
Sin
gapo
re
Seoul
Hong
Kong
Beiji
n
Shan
ghai
Score World's Top 300 Companies (Major Asian Cities)
2009 2010 2011
14

Published on October 19, 2011 Edited and published by The Mori Memorial Foundation For inquiry about this report, please contact directly to:
Chiharu Hirota, Yasuyuki Miwa Institute for Urban Strategies The Mori Memorial Foundation
ARK Mori Building
1-12-32 Akasaka, Minato-ku, Tokyo
107-6004 JAPAN
Facsimile: +81-3-3224-7227 Email: [email protected] Copyright © 2011 The Mori Memorial Foundation All Rights Reserved. Unauthorized reproduction of this document is forbidden.
JPY 500+TAX

