global portfolio optimization revisited: a least discrimination … · 2017-05-05 · icma centre...
TRANSCRIPT
Global Portfolio Optimization Revisited:
A Least Discrimination Alternative to Black-Litterman
ICMA Centre Discussion Papers in Finance DP2007-07
This Version: 7th July 2007
Jacques Pézier
ICMA Centre, University of Reading
Copyright 2007 Pézier. All rights reserved.
ICMA Centre • The University of Reading Whiteknights • PO Box 242 • Reading RG6 6BA • UK Tel: +44 (0)1183 788239 • Fax: +44 (0)1189 314741 Web: www.icmacentre.rdg.ac.uk Director: Professor John Board, Chair in Finance The ICMA Centre is supported by the International Capital Market Association

ABSTRACT
Global portfolio optimization models rank among the proudest achievements of modern finance
theory, but practitioners are still struggling to put them to work. In 1992, Black and Litterman
recognized the difficulties portfolio managers have in expanding their personal views about some
expected asset returns into full probabilistic forecasts about all asset returns and developed a method
to facilitate this task. We propose a more general method based on a least discrimination (LD)
principle. It produces a probabilistic forecast that is true to personal views but is otherwise as close as
possible to a chosen reference forecast. For this purpose we expand the concept of optimal portfolio
to include non-linear pay-offs and derive an economic measure of distance – a generalized relative
entropy distance – between probabilistic forecasts. The LD method produces optimal portfolios
matching any views, including views on volatility and correlation as well as expected returns, and
containing option-like pay-offs, if allowed. It also justifies a simple linear interpolation between
reference and personal forecasts, should a compromise need be reached.
JEL Classification Codes: G11, C53
Keywords: Global portfolio optimization, Black-Litterman model, least discrimination, utility theory, mean-variance analysis, relative entropy, generalized relative entropy, non-linear pay-offs.
Author Details: Jacques Pézier Visiting Professor, ICMA Centre, Business School, The University of Reading, PO Box 242 Reading RG6 6BA, United Kingdom Tel: +44 (0)1183 786675 (ICMA Centre) Fax: +44 (0)1189 314741 Email: [email protected] Disclaimers: The contents of this paper are presented in good faith, and neither the authors, the ICMA Centre nor the University, will be held responsible for any losses, financial or otherwise, resulting form actions taken on the basis of its contents. Any persons reading the paper are deemed to have accepted this.

ICMA Centre Discussion Papers in Finance, DP2007-07
Copyright © 2007. Pézier. All Rights Reserved. 3
I QUANTITATIVE MODELS FOR GLOBAL PORTFOLIO OPTIMIZATION
Academics and practitioners generally agree that quantitative asset allocation models – based on the
pioneering work of Markowitz more than fifty years ago – have not played the important role they
should in global portfolio management, largely because the supposedly optimal resulting allocations are
often too extreme, oversensitive to small input changes and possibly biased (Michaud [1989], Broadie
[1993]). Various techniques have been developed over the years to alleviate these problems. They
encompass robust estimation techniques of model parameters (see Jorion [1986]), the use of allocation
constraints to improve stability and realism (Jagannathan and Ma [2003]) and, more recently,
conservative, max-min type, robust optimization techniques (Fabozzi et al [2007]), to name the main
strands. Most of these techniques are designed to cope, directly or indirectly, with statistical estimation
errors. But all information does not come from statistics and Black and Litterman [1992] raised the
more general issue of assisting portfolio managers in making probabilistic forecasts faithfully reflecting
their personal views, wherever these views may come from.
Fifteen years on, we observe the Black and Litterman (BL) approach has been much discussed in
academic circles but has had only moderate success with professional portfolio managers. One reason
may that the BL approach is based on ad hoc assumptions and requires parameters that are not easy to
assess. Many subsequent authors tried to explain the intuition behind the BL approach, but we think
the approach itself needs to be rebuilt on a firmer rationale. We develop here a more general approach
based on a principle of least discrimination.
Formal quantitative decision models are successfully used in many fields. One would not think of
running an oil refinery, guiding a spacecraft to a distant planet or pricing an exotic option without such
models. Complexity, the need to combine various sources of expertise, sometimes the need to balance
the conflicting interests of several concerned parties, justify the use of formal models; modern
information technology facilitate their implementation. And yet we would not use formal models to
choose, say, where to live and whom to live with – these are not trivial matters but they are usually left
to unaided intuition. The optimisation of investment portfolios sits somewhere between these two
extremes; one could say that it remains an art as much as a science. On one hand, there is a wealth of
relevant information to be processed, there are well-developed financial theories and models to do so,
and computers are up to the task of carrying out the most sophisticated analyses. On the other hand,
both the specification of investors’ objectives and their forecast of future returns remain ultimately
vague and subjective, hence the superficial impression that formal quantitative models for portfolio
optimization may not be of much help. But dealing with uncertainty is no excuse for fuzzy reasoning;
whether knowledge is vague or precise, formal models help bring coherence in thoughts.

ICMA Centre Discussion Papers in Finance, DP2007-07
Copyright © 2007. Pézier. All Rights Reserved. 4
A major challenge in using formal quantitative portfolio optimization models is in the translation of
subjective, often qualitative views into sensible quantitative inputs, specifically, in the translation of
personal views on some asset returns1 into probabilistic forecasts for all asset returns. In this paper, we
define a personal opinion, or view, as a statement about any characteristic of some asset returns at the
investment horizon; it could be a statement about an expected value, volatility, correlation, or some
combination thereof. We call probabilistic forecast, on the other hand, a joint probability distribution
for all asset returns at the investment horizon. We do not discuss here how portfolio managers form
their opinions (i.e., the sources of information and the arguments they use), but focus on the way they
express their opinions and on how to interpret what is left unsaid. Indeed, what is left unsaid is
supposedly in tacit agreement with some agreed forecast. BL suggest that a portfolio manager should
know what asset allocation she would pick by default before doing her research – call this her
‘reference’ or ‘market’ portfolio. It may be the current portfolio she manages, a benchmark against
which her performance is measured, or any other portfolio she thinks would best satisfy her investors
and fulfil her mandate. According to Markowitz’s one-period, unconstrained portfolio mean-variance
analysis, and given a covariance matrix of returns and a statement of investors’ risk attitude2, there is a
unique set of expected returns for which the reference portfolio is optimal. It is this combination of
expected returns and covariances together with an assumption of normality that we shall call the
‘reference’ forecast, or ‘market’ forecast. The closer a personal forecast is to the market forecast, the
closer the matching optimal portfolio should be to the market portfolio.
We formalize this approach by deriving a relevant measure of distance between two probability
forecasts. Discrepancies between a personal and a market forecast can be exploited by adding an active
allocation to the market portfolio, which leads to an expectation of outperforming the market portfolio.
We take this expectation, defined as an increase in certainty equivalent, as a distance measure between
forecasts and introduce the following principle of least discrimination (LD): the expectation of
outperforming the market portfolio should be kept to a minimum, subject to matching the personal
views of the portfolio manager. Indeed, that expectation would be illusory if it arose inadvertently
rather than as a necessary consequence of consciously held views. The LD principle can be
implemented through an iterative process starting with the market forecast and going through a
sequence of least discriminatory forecasts taking into account successive refinements of the portfolio
manager’s views until she agrees with the last least discriminatory forecast presented to her.
When a portfolio manager agrees with all market implied covariances and has personal views only
about some expected returns, we find that the optimal active portfolio consists only of positions, long
or short, in the corresponding assets and the risk free asset. But if the portfolio manager has personal

ICMA Centre Discussion Papers in Finance, DP2007-07
Copyright © 2007. Pézier. All Rights Reserved. 5
views about volatilities and correlations or is willing to put into question the market forecast of
covariances, the optimal active portfolio is a non-linear pay-off in the asset returns, i.e. an option-like
pay-off. Such pay-off may be constructed by combining listed options or, more generally, by entering
into OTC contracts, or by dynamically investing in the underlying assets.
The optimal active portfolio produced by the LD method may still appear surprisingly large or
unrealistic in some way. As with any formal decision model, the results should never be accepted until
the decision maker is satisfied, on balance, with the complete analysis, that is, with the inputs, the
choice of objective and the logical structure of the model, as well as with the consequences. Laying out
assessments and assumptions to critical examination is what formal models are for. We are therefore
averse to suggesting a recipe for bringing the optimal portfolio closer to the market portfolio. But if, in
the end, the portfolio manager is resigned to mitigate her views in order to achieve such proximity, we
show that a simple weighted average between her personal forecast and the market forecast is a logical
compromise. In the absence of constraints, this weighted forecast leads to scaling down the active
portfolio. If the allocation is constrained, the weighted forecast should be fed into an appropriate
optimizer.
In Section II and Appendix A we analyse the weaknesses of the BL approach and suggest a less
problematic limiting case with a more intuitive parameterization. In Section III and Appendices B and
C we demonstrate the equivalence between a generalized relative entropy (GRE) distance between two
probability distributions and the increase in certainty equivalent that can be achieved with an optimal
active portfolio. We show how to minimise this distance to generate least discriminatory forecasts. A
variety of views and the corresponding optimal allocations, both linear and non-linear, are analysed. In
Section IV and Appendix D we derive weighted forecasts between market and personal forecasts. We
summarise our findings and suggest extensions in Section V.
II A REVIEW OF THE BLACK-LITTERMAN APPROACH
Few people have been trained to translate their knowledge into probabilistic statements; yet, without
training, one may unwittingly mislead or be misunderstood.3 Expressing imperfect knowledge about an
uncertain quantity in the form of a probability distribution is not a trivial task. Classical statisticians
limit themselves to describing the likelihood of empirical evidence given some hypothesis. To obtain a
posterior probability distribution of the uncertain quantity one needs to start with prior probabilities.
But studies in cognitive sciences have shown that we are all susceptible to numerous cognitive biases
when expressing prior probabilities (see Tversky and Kahneman [1974]). To build up a coherent joint
probabilistic forecast of a number of uncertain quantities based on opinions about a few and some

ICMA Centre Discussion Papers in Finance, DP2007-07
Copyright © 2007. Pézier. All Rights Reserved. 6
general background information is an even greater challenge involving the assessment of conditional
probabilities. The BL approach is an attempt to guide the task of combining general market
information about asset returns with personal views.
The BL approach was introduced originally in 1990 and refined in 1992. It has been discussed
extensively. It has been red-derived, extended and explained by Satchell and Scowcroft [1997], He and
Litterman [1999], Drobetz [2001] and Idzorek [2004], among others. Examples of applications have
been given by Fabozzi et al [2006] and Jones et al [2007]. But, whereas these authors attempt, as they
say, to ‘demystify’, provide ‘intuition’, ‘put to work’ or give a ‘guide’ for using the BL approach, we find
that the BL approach relies on several ad hoc assumptions that call for a critical review. We develop
here a limiting case of BL with more intuitive parameters, but it still lacks a fundamental rationale. A
mathematical description of BL and of this limiting case are given in Appendix A.
CRITIQUE OF THE UNCERTAINTY ASSUMPTIONS UNDERPINNING BL
The BL method rests on two ingenious assumptions. First, BL assume that expected returns are
uncertain and interpret the market forecast and personal views as two independent and complementary
estimates of expected returns, as if they were readings from two imperfect but independent measuring
instruments. Consequently, they calculate a posterior distribution of expected returns by taking the
product (re-normalised) of the probability densities of expected returns from the two information
sources. The relative degree of accuracy attributed to the market forecast compared to the personal
views determines how close the posterior distribution of expected returns is to the market forecast.
Second, they make distributional assumptions about the uncertainties attributed to the two information
sources. Specifically, they assume that: (i) the covariance matrix of market expected returns is a scaled
down version of the covariance matrix of returns, and (ii) the covariance matrix of personal views
about expected returns is diagonal, i.e., uncertainties among personal views are uncorreletad. The
choice of covariance matrices determines how views on some expected returns affect other expected
returns. For example, if the portfolio manager opines that the expected return of an asset should be
higher than according to the market forecast, ipso facto, all positively correlated expected returns are
raised and negatively correlated expected returns are reduced. It seems therefore appropriate to
question the basis for BL’s distributional assumptions as well as the means of assessing the
uncertainties attributed to the two information sources.
How are we meant indeed to quantify uncertainties in opinions about expected returns? We would
argue that, no matter how uncertain one may be about some future return, the subjective probability

ICMA Centre Discussion Papers in Finance, DP2007-07
Copyright © 2007. Pézier. All Rights Reserved. 7
distribution describing this uncertainty has but one expected value and one would be at a loss – as
indeed many portfolio managers are – to express an uncertainty about this expected value (or any other
characteristic of the probabilistic forecast of returns, for that matter). This not an argument for single
point estimates. On the contrary, we recognize that probability distributions are often specified with a
few parameters, for example, an expected value and a variance, about which we have limited
information. In such cases, relying on point estimates of parameters would be wrong. We need to
integrate the distribution of returns conditional on the value of the parameters over the full
distributions of these parameters in order to obtain an unconditional distribution of returns. But asset
allocation decisions depend only on the unconditional distribution of returns, it is therefore both
inoperational and meaningless to discuss uncertainties in the expected returns of the unconditional
distribution.4 In the case at hand, there is not even the suggestion of a statistical model for arriving at
personal views about expected returns;5 therefore we find no basis for assessing uncertainties about
expected returns, and for assuming that such uncertainties would be uncorrelated.
We would argue that uncertainty in the expected value of the market forecast of returns is also
irrelevant for the same reason: investment decisions are based on the unconditional distribution of
returns which has but one expected value. However, since we use inference models yielding estimates
of expected returns, we may be curious to analyse the size and shape of the estimation errors. What
inference models are available? There is no information on expected returns in futures and option
prices (except when arbitrage between spot and forward prices is impossible, restricted or very
expensive). Only vague information can be obtained from time series analysis of historical returns.6 So,
BL rely on the expected returns implied by the choice of a reference portfolio; the logic for deriving an
optimal asset allocation from a forecast of asset returns is used in reverse to retrieve a forecast
consistent with an optimal asset allocation. According to mean-variance analysis, the relationship
between expected returns, µµµµ,7 the covariance matrix of returns, ΣΣΣΣ, the risk aversion coefficient of the
investor, γ, and the asset weights in the reference portfolio, ωωωω, is simply8
µµµµ = γΣωΣωΣωΣω (1)
The weights are those defining the market portfolio. The covariance matrix of returns can be estimated
from historical data9 and current option prices with a fair degree of accuracy10. The coefficient of risk
aversion is the least well-known quantity in (1) and is a major source of uncertainty in any estimate of
market implied expected returns.11 Yet, this uncertainty is not critical if the reference portfolio is limited
to a universe of risky assets, leaving to the investor the choice of leverage with a risk-free asset, because
the coefficient of risk aversion acts as a scaling factor that does not affect relative allocations to risky
assets. So, to determine the optimal mix of risky assets, it is sufficient to express all expected returns –
ICMA Centre Discussion Papers in Finance, DP2007-07
Copyright © 2007. Pézier. All Rights Reserved. 8
market and personal – in relative terms only. With relationship (1), neither the uncertainty about the
coefficient of risk aversion nor the uncertainty about the covariance matrix of returns would justify a
multivariate normal distribution for µµµµ with a covariance matrix proportional to ΣΣΣΣ.12
Finally, BL’s assumption of independence between the two sources of information is dubious. Analysts
whose views are sought after are careful students of the markets; they can hardly be expected to
provide independent information. Several implausible consequences follow. For example, the posterior
forecast of expected returns is more precise than the more precise of the two information sources;13 the
more opinions are gathered, no matter how much they may differ, the more precise the posterior
forecast becomes; the posterior distribution is different whether one tacitly does not disagree with a
market view or one expressly approves of it.
Instead of relying on this independence assumption, we argue that there is no automatic way to
combine information from various sources to form a posterior distribution: it all depends on the degree
of credibility attributed to each source and to what extent each source provides independent and
complementary information. For example, a portfolio manager may rely on forecasts from two
analysts. If they agree, the portfolio manager may adopt their common view. She might even feel
slightly more confident if the two analysts arrive at the same conclusion using different arguments – a
form of complementarity rather than repetition of information. If the two analysts disagree, the
portfolio manager may choose to rely on a mixture of the two forecasts, each given relative credibility
weights. So, combining probabilistic forecasts from different sources is ultimately a matter of judgment.
Many techniques (Delphi and others) have been used to combine expert judgments. Depending on
circumstances, the posterior distribution is more or less precise than any of the sources.
BL WITH CREDIBILITY WEIGHTS INSTEAD OF UNCERTAINTY ASSUMPTIONS
Fortunately, BL’s assumptions about uncertainties in expected returns and how to combine them may
not be critical because they are only used as devices for combining market and personal opinions. We
show in Appendix A that there is a simpler alternative that does not require these assumptions and
therefore avoids some of the undesirable consequences. When uncertainties about expected returns
both from market forecasts and personal views are shrunk by the same factor, the posterior expected
returns remain unchanged but their distribution is shrunk until it becomes singular when the shrinkage
factor becomes nil. We call this limit the BL singular model (BLS); the only required inputs are
credibility weights from 0% to 100% for each personal view compared to the corresponding market
implied view. Furthermore, in the case where the personal credibility weights are 100% for some

ICMA Centre Discussion Papers in Finance, DP2007-07
Copyright © 2007. Pézier. All Rights Reserved. 9
views, the posterior return distributions produced by BL and BLS converge towards the same
distribution conditional on the views held for certain; we call this case the BL conditional (BLC) model.
We illustrate the basic features of the BLC model with a two risky asset portfolio. In the next section,
we use the same portfolio and personal views to illustrate the LD model. We take the volatilities of
risky assets A and B to be 10% and 20% respectively with a correlation of 062.5% (we deliberately
choose these parameters so as to create an unstable optimal portfolio: the two assets have similar
Sharpe ratios and their relatively high correlation reduces the benefits of diversification, thus the
optimal portfolio should be sensitive to small changes in expected returns and volatilities). We assume
that the market portfolio is fully invested half in asset A and half in asset B and that the risk aversion
coefficient of investors is equal to 4. We deduce from (1) that the market forecasts of expected returns
are πA = 4.5% and πB = 10.5%. The market expected returns and corresponding allocation are
represented as scenario ‘M’ in Exhibit 1.
Note that if the portfolio manager were to use the BL approach and assign an uncertainty to the market
implied expected returns of, say, 30% of the return volatilities, that is, if she were to choose a scaling
factor τ = 0.09 for the covariance matrix of market expected returns, then the variances of market
returns would be increased by a factor of 1.09; the revised yearly standard deviations would be 10.44%
for A and 20.88% for B. To be consistent, the market implied expected returns should also be revised
upwards by a factor of 1.09 to πA = 4.95% and πB = 11.45%. The BLS model eliminates these
undesirable adjustments.
Suppose now that the portfolio manager accepts the market covariances for A and B but believes that
the expected returns for A should be slightly higher, namely, pA = 5.5% instead of 4.5% according to
the market. She might choose to express her opinion in many different ways, for example, as one of the
following scenarios:
P1: pA = 5.5% and pB = 10.5% as per market implied forecast
P2: pA = 5.5%, nothing said about pB
P3: pB − pA = 5%
P4: 11pB − 21pA = 0%
These four statements are not contradictory; superficially, they might even appear similar, but they are
not as we shall see. P1 fixes both pA and pB and therefore specifies completely the personal forecast,
there is no room left for any adjustment; P2 fixes pA but leaves pB free to be revised away from the
market forecast; P3 and P4 are the least specific statements, fixing neither pA nor pB, but stating only

ICMA Centre Discussion Papers in Finance, DP2007-07
Copyright © 2007. Pézier. All Rights Reserved. 10
some linear relationship between the two. P3 states an absolute difference between the two, whereas P4
states a relative difference. Note that statement P4 should suffice for determining the optimal mix of
risky assets.
Applying the BLC model, i.e., with 100% credibility attributed to the personal views, we observe large
differences in posterior expected returns and optimal allocations according to the choice of scenario.
The results are shown in Exhibit 1. Posterior expected returns for (pA, pB) are as high as (5.5%,
11.75%) with P2 and as low as (4.5%, 9.25%) with P4. Optimal allocations range from 60% to 91% for
A, from 37.2% to 50% for B, and from neutrality to 25% borrowing at the risk free rate.
In summary, we have shown that the BLC model achieves the results intended with the BL model but
without some of its complexities (assessment of uncertainties about expected returns) and drawbacks
(increase in the total variance of returns). However, the posterior expected returns it produces (and
therefore the corresponding optimal allocations) seem very sensitive to apparently small variations in
the way opinions are expressed. We are left to ponder whether such high sensitivity is simply the
consequence of some unwarranted assumptions in the BL method.
III LEAST DISCRIMINATORY PERSONAL FORECAST AND OPTIMAL ACTIVE PORTFOLIO
A simple yet powerful principle in finance is that of no arbitrage, which we restate as follows: based on
market information, there are no financial strategies that can lead to gains but no losses. Indeed if there
were such strategies, investors, regardless of their risk attitudes, would immediately adopt them and
thus weigh on market prices, bringing them back to a no arbitrage equilibrium. But what if an
individual does not fully agree with the market forecast? What expectations can he reasonably hold?
We propose the following least discrimination (LD) principle: among all forecasts satisfying a set of
personal views, one should select the forecast that yields the minimum increase in certainty equivalent
when optimally acted upon. Any other forecast would lead to gains in certainty equivalent not
supported by personal views and therefore illusory. No arbitrage is commonly described as a ‘no free
lunch’ principle, least discrimination could be described as ‘no illusion’ principle.
Strategies exploiting personal views generally lead to uncertain consequences and therefore must be
evaluated in terms of risks as well as returns. This is why the LD principle is expressed in terms of
certainty equivalent (minimum selling price of a risky opportunity), which reflects the risk attitude of
the investor. Certainty equivalents could be assessed intuitively by investors on a case by case basis, but
ICMA Centre Discussion Papers in Finance, DP2007-07
Copyright © 2007. Pézier. All Rights Reserved. 11
it is more efficient to encode the risk attitude of an investor in a utility function and then use it to
calculate his certainty equivalent for any risky opportunity.
OPTIMAL PAY-OFF AND CERTAINTY EQUIVALENT
To evaluate certainty equivalents over a wide range of investment strategies, we first extend the concept
of optimal portfolio to that of optimal pay-off. An optimal portfolio is usually understood as an
optimal static asset allocation yielding a return that is a linear combination of the component asset
returns. More generally, an investment strategy may lead to a non-linear, i.e., option-like, pay-off in the
component assets returns. It may be generated by option positions or a dynamic asset allocation
strategy.
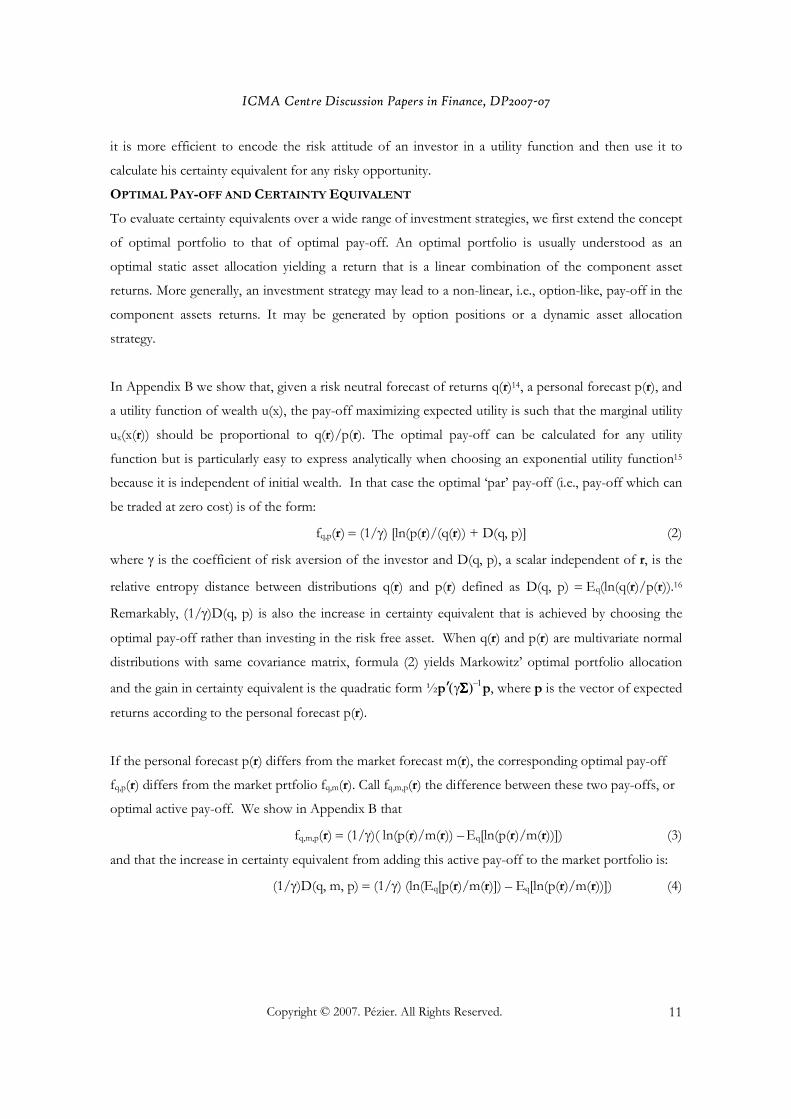
In Appendix B we show that, given a risk neutral forecast of returns q(r)14, a personal forecast p(r), and
a utility function of wealth u(x), the pay-off maximizing expected utility is such that the marginal utility
ux(x(r)) should be proportional to q(r)/p(r). The optimal pay-off can be calculated for any utility
function but is particularly easy to express analytically when choosing an exponential utility function15
because it is independent of initial wealth. In that case the optimal ‘par’ pay-off (i.e., pay-off which can
be traded at zero cost) is of the form:
fq,p(r) = (1/γ) [ln(p(r)/(q(r)) + D(q, p)] (2)
where γ is the coefficient of risk aversion of the investor and D(q, p), a scalar independent of r, is the
relative entropy distance between distributions q(r) and p(r) defined as D(q, p) = Eq(ln(q(r)/p(r)).16
Remarkably, (1/γ)D(q, p) is also the increase in certainty equivalent that is achieved by choosing the
optimal pay-off rather than investing in the risk free asset. When q(r) and p(r) are multivariate normal
distributions with same covariance matrix, formula (2) yields Markowitz’ optimal portfolio allocation
and the gain in certainty equivalent is the quadratic form ½p’(γΣΣΣΣ)−1p, where p is the vector of expected
returns according to the personal forecast p(r).
If the personal forecast p(r) differs from the market forecast m(r), the corresponding optimal pay-off
fq,p(r) differs from the market prtfolio fq,m(r). Call fq,m,p(r) the difference between these two pay-offs, or
optimal active pay-off. We show in Appendix B that
fq,m,p(r) = (1/γ)( ln(p(r)/m(r)) – Eq[ln(p(r)/m(r))]) (3)
and that the increase in certainty equivalent from adding this active pay-off to the market portfolio is:
(1/γ)D(q, m, p) = (1/γ) (ln(Eq[p(r)/m(r)]) – Eq[ln(p(r)/m(r))]) (4)
ICMA Centre Discussion Papers in Finance, DP2007-07
Copyright © 2007. Pézier. All Rights Reserved. 12
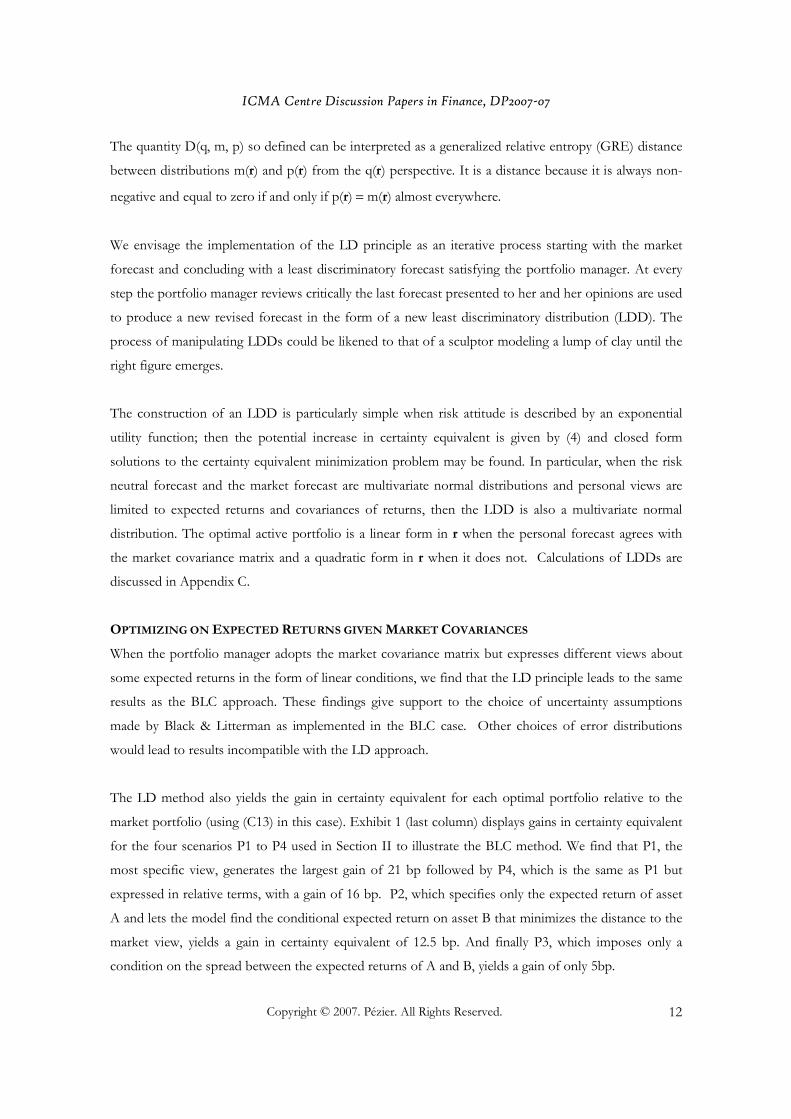
The quantity D(q, m, p) so defined can be interpreted as a generalized relative entropy (GRE) distance
between distributions m(r) and p(r) from the q(r) perspective. It is a distance because it is always non-
negative and equal to zero if and only if p(r) = m(r) almost everywhere.
We envisage the implementation of the LD principle as an iterative process starting with the market
forecast and concluding with a least discriminatory forecast satisfying the portfolio manager. At every
step the portfolio manager reviews critically the last forecast presented to her and her opinions are used
to produce a new revised forecast in the form of a new least discriminatory distribution (LDD). The
process of manipulating LDDs could be likened to that of a sculptor modeling a lump of clay until the
right figure emerges.
The construction of an LDD is particularly simple when risk attitude is described by an exponential
utility function; then the potential increase in certainty equivalent is given by (4) and closed form
solutions to the certainty equivalent minimization problem may be found. In particular, when the risk
neutral forecast and the market forecast are multivariate normal distributions and personal views are
limited to expected returns and covariances of returns, then the LDD is also a multivariate normal
distribution. The optimal active portfolio is a linear form in r when the personal forecast agrees with
the market covariance matrix and a quadratic form in r when it does not. Calculations of LDDs are
discussed in Appendix C.
OPTIMIZING ON EXPECTED RETURNS GIVEN MARKET COVARIANCES
When the portfolio manager adopts the market covariance matrix but expresses different views about
some expected returns in the form of linear conditions, we find that the LD principle leads to the same
results as the BLC approach. These findings give support to the choice of uncertainty assumptions
made by Black & Litterman as implemented in the BLC case. Other choices of error distributions
would lead to results incompatible with the LD approach.
The LD method also yields the gain in certainty equivalent for each optimal portfolio relative to the
market portfolio (using (C13) in this case). Exhibit 1 (last column) displays gains in certainty equivalent
for the four scenarios P1 to P4 used in Section II to illustrate the BLC method. We find that P1, the
most specific view, generates the largest gain of 21 bp followed by P4, which is the same as P1 but
expressed in relative terms, with a gain of 16 bp. P2, which specifies only the expected return of asset
A and lets the model find the conditional expected return on asset B that minimizes the distance to the
market view, yields a gain in certainty equivalent of 12.5 bp. And finally P3, which imposes only a
condition on the spread between the expected returns of A and B, yields a gain of only 5bp.

ICMA Centre Discussion Papers in Finance, DP2007-07
Copyright © 2007. Pézier. All Rights Reserved. 13
An examination of (C13) sheds light on these results; (C13) states that forecasts leading to equal gains
in certainty equivalent are along ellipsoids centered at the market expected returns. In our two risky
asset example, the ellipse corresponding to a gain of 16 bp is drawn in Exhibit 1. According to view P2,
which states only that pA = 5.5%, the value of pB that is least discriminatory, i.e., yields the lowest
increase in certainty equivalent is pB = 11.75% because that is the point of tangency of the line pB =
5.5% with the ellipse of allocations 16 bp away from the market (one can verify that the beta of asset B
versus asset A is equal to (0.625)(0.2)/(0.1) = 1.25 so that when the expected return on A is increased
by 1%, the expected return on B is increased by 1.25%). Scenario P1 is more constraining because it
also sets pB = 10.5%, as a result P1 is more distant from the market view than P2. We also verify that
points P3 and P4 are tangency points with ellipses at distances of 5 bp and 16 bp respectively from the
market.
The variety of optimal portfolios and gains in certainty equivalent according to scenarios highlights the
importance describing opinions in the most faithful way. The portfolio manager should ponder which
expression P1 through P4, or perhaps others, best reflect her belief that asset A will perform better
than implied by the market. Is it that the expected return on A should be 1% higher than implied by
the market with nothing else changed (as in P1), or should she also accept to increase her forecast on
asset B because she trusts the positive correlation between asset A and B (as in P2), or should she not
put into question the market forecast of volatilities and correlation? Are her views simply about the
relative performance of A and B (as in P3 and P4)? If the portfolio manager cares only about the risky
asset mix and leaves the leveraging decision to investors, a view expressed in relative terms, as in P4, is
sufficient to determine the optimal mix; but does it understate the views of portfolio manager?
OPTIMIZING ON EXPECTED RETURNS GIVEN ANY COVARIANCE MATRIX
BL rely on the acceptance of market implied covariance matrix and does not extend easily to personal
views on volatilities and correlations. We argue that minimizing the GRE distance and therefore
minimizing the increase in certainty equivalent that can be obtained by exploiting personal views may
be applied to any type of views. Using this approach, we find in particular that expected returns should
be adjusted to minimize the impact of views on covariances in such a way that the active portfolio
contains only non-linear pay-offs. In other words, the expected returns are adjusted so that the
reference portfolio is still the optimal linear portfolio with the new covariance matrix. One may find
something intuitively pleasant about this result. Vice versa, covariances may be adjusted to reduce the
impact of views on expected returns. These adjustments are explained in Appendix C. Of course, the
GRE minimization process is not analytically tractable except in a few simple cases, but widely available

ICMA Centre Discussion Papers in Finance, DP2007-07
Copyright © 2007. Pézier. All Rights Reserved. 14
numerical solvers (e.g., the solver available in Excel) can be used without difficulty – at least when the
number of parameters is not very large – because the GRE distance is a well behaved objective
function.
To gain insight into these adjustments we use two illustrations based on the previously analysed two-
risky asset portfolio. In the first illustration we stipulate covariances different from the market implied
covariances and use an analytical formula to derive the adjustment to expected returns. In the second
illustration we revisit our previously examined scenarios about expected returns and use a solver to find
the adjustments to covariances as well as to expected returns that minimize the GRE.
The market implied correlation between assets A and B in our previous example is 62.5%. Suppose
now that the portfolio manager wants to revise this figure down to 37.5% for the investment horizon,
volatilities remaining as per market forecast. If the portfolio manager accepts to have her forecast of
expected returns adjusted because of her view on correlation, expression (C8) in Appendix C gives the
solution. The new expected returns in that case are pA = 3.5% and pB = 9.5%. They are such that the
reference portfolio with 50% allocations to each of A and B is still optimal except for the need to
introduce a quadratic active pay-off. The active pay-off is fq,m,p(r) = 5.97 rA2 –7.37 rArB + 1.49 rB2 –
0.027 (from (B9) with coefficients rounded to two decimal places) and is higher when rA and rB are of
opposite signs than when they are of same sign, thus taking advantage of a lower correlation than the
market implied correlation. The corresponding gain in certainty equivalent is 1.57% (from (B10))
If expected returns were maintained at their implied market forecast of pA = 4.5% and pB = 10.5%, the
optimal active pay-off would contain additional weights of 23.6% in A and 1.8% in B (and therefore a
borrowing at the risk free rate of 25.4%). The corresponding gain in certainty equivalent would be
1.70%; but this gain and the additional active weights in both assets are unwarranted unless the
portfolio manager insists on holding on to the market forecast of expected returns.
The quadratic active pay-off can be constructed with option positions. The coefficients of the
quadratic active pay-off determine the required gammas and therefore the required options. For
example, the above pay-off could be approximated with the folllowing 3-month straddles (a long put
and a long call at-the-money forward): long 0.29 straddles on A, short 0.55 straddles on B and long 0.86
straddles on the spread (A – B). This calculation is based on approximate gammas, namely, for an ATM
forward straddle on asset A, (0.8/σA), and for an ATM forward straddle on the spread (A – B),

ICMA Centre Discussion Papers in Finance, DP2007-07
Copyright © 2007. Pézier. All Rights Reserved. 15
(0.8/σA) with respect to asset A, (0.8/σB) with respect to asset B, and -(0.8/σA-B) for the cross gamma.
On a basket (A+B) the cross gamma would be +(0.8/σA+B).
OPTIMIZING ON BOTH EXPECTED RETURNS AND COVARIANCES
We now revisit our previously examined scenarios about expected returns assuming that covariances
may be adjusted to minimize the GRE. This is an example of the general situation in which any views
can be imposed on some expected returns and covariances and we minimize the GRE with respect to
what is left as free parameters. This situation calls for the use of a general solver.
The results for scenarios P1 to P4 are shown in Exhibits 2 and 3. For all scenarios, adjusting
covariances leads to further reductions of the GRE and a smaller linear active portfolio, however the
active portfolio now contains quadratic terms, i.e, requires option positions. Differences with previous
optimal allocations are shown in Exhibit 2 with arrows linking the old allocations to the new allocations
for each scenario. Take for example scenario P1 setting both expected returns (pA = 5.5%, pB =
10.5%). Without covariance adjustments, the optimal allocation is 91% for A, 37.2% for B and a
borrowing of 28.2% leading to a gain in certainty equivalent of 20.5 bp. However, allowing for
covariance adjustments, the new optimal allocation consists of 79.3% for A, 39.7% for B and a
borrowing of 19%. This is much closer to the 50%/50% market portfolio and implies a gain in
certainty equivalent of only 15 bp. However this implies also a small quadratic active pay-off as shown
in Exhibit 3, because views on volatilities and correlation have been adjusted by small amounts to
10.36% for A, 19.95% for B and 63.88% for the correlation.
In this instance, the quadratic pay-off contains the product of the return, rArB, and therefore requires a
correlation dependent option, for example a straddle on the spread (A-B). Unfortunately such options
are usually traded in not very liquid OTC markets and the bid-ask spreads may be expensive. One can
only hope that such products, or specially designed correlation futures and options, will become more
available in the future so that investors exercise their views on correlations. In the meantime, if a
portfolio manager cannot deal in such products, she will want an optimal portfolio without cross
product terms between asset returns. It is a simple matter to add this constraint in the solver; it
produces the optimal results shown on the last line of Exhibits 2 and 3 under scenario P10. Scenario
P10 leads to an optimal portfolio 82.8% in A and 41.2% in B, therefore not as close to the market
portfolio as when correlation is adjusted. Nonetheless, it is not as far from the market portfolio as
when volatilities are not adjusted. Because the volatility of asset A is adjusted upwards from 10% to
10.19% and the volatility of B is adjusted downwards from 20% to 19.63%, the optimal portfolio

ICMA Centre Discussion Papers in Finance, DP2007-07
Copyright © 2007. Pézier. All Rights Reserved. 16
includes a small short volatility position on A and a small long volatility position on B (with three
months at-the-money forward straddles, and using the same approximate gammas as before, the
positions would be short 0.096 staddles on A and long 0.047 straddles on B.
This example illustrates how tricky the expression of opinions may be and the complex interactions
with the constraints that must be taken into account to arrive at a realistic optimal portfolio. For these
reasons, we would not expect a portfolio manager to be able to state definitely in a single step the views
she wants to implement. It is more likely that the final expression of views and constraints should
emerge from an iterative process using the feedback from successive optimization results. The key is
the choice of objective function for the optimization; the optimisation process itself is simple enough
with modern solvers and can handle a wide variety of views
IV BLENDING MARKET AND PERSONAL FORECASTS
As we mentioned at the outset, there are various reasons why a supposedly optimal portfolio produced
by a formal asset allocation model may appear unrealistic or unattractive to a portfolio manager: the
optimal active portfolio may be appear too large or it may be highly sensitive to small changes in views.
The latter is a problem if personal views are expected to evolve over time and transaction costs are too
high or market liquidity too low to allow for rapid changes in asset allocations. The issue of designing
optimal dynamic allocation strategies in such circumstances has been addressed by Davis et al [1990])
among others. But if a portfolio manager is simply unhappy that her LDD forecast produces an
optimal portfolio too radically different from the benchmark she chose, she should re-examine her
forecast and the reasons why she chose that particular benchmark to try to reconcile her views with
their consequences. As a last resort only, should she rely on a mechanistic approach to reach a
compromise between her forecast p(r) and the market forecast m(r). The question then becomes: what
is the best family of blended forecasts b(r) bridging the gap between market and personal forecasts?
Based on the LD principle and GRE as the appropriate distance between probability distributions, it is
reasonable to consider that among all blended forecasts a given distance away from the market forecast,
a portfolio manager should select the one that is closest to her personal forecast. In Appendix D, we
derive the unique solution to this problem when forecasts are represented by multivariate normal
distributions. We find that the best blended forecasts are simple linear interpolations between market
and personal forecasts. In other words, all expected returns and covariances from market and personal
forecasts are combined with the same weights (note in passing that correlations are not combined with
the same weights unless covariances in the personal forecast are proportional to those of the market
forecast).

ICMA Centre Discussion Papers in Finance, DP2007-07
Copyright © 2007. Pézier. All Rights Reserved. 17
The BL model is not compatible with this linear interpolation. The blended posterior expected returns
(formula (A3)) are not obtained by interpolating expected returns between market and personal views
held with certainty (formula (A6)) barring exceptional circumstances such as when personal views are
only about uncorrelated returns. To illustrate, consider scenario P5 in Exhibit 1. It is designed as giving
equal credibility to scenario P1 and the market forecast. The BLS approach is specially designed to
handle such blended views. We might well expect that the equal credibility weights would lead to the
average posterior forecast (5%, 10.5%) – average between the market (4.5%, 10.5%) and scenario P1
(5.5%, 10.5%) – but, surprisingly, BLS yields the posterior forecast (4.95%, 10.85%). In contrast, the
LD method justifies the linear interpolation (5%, 10.5%) shown as P6 in Exhibit 1. The optimal
allocations to risky assets A, B under P5 are 63.8%, 47.8% with borrowing of 11.7%, whereas under P6
they are 70.5%, 43.6% with a borrowing of 14.1%. Similarly surprising results would be obtained with
BLS applied to the blending of other scenarios with the market forecast. The two methods lead to
significantly different results both in terms of blended forecasts and in terms of corresponding optimal
allocations. An empirical application of the linear interpolation technique can be found in Pezier and
White [2006].
V SUMMARY AND CONCLUSIONS
Black and Litterman examined how partial views may be best expanded into a full probabilistic forecast
Their solution– to assume that what is left unsaid must be in close agreement with some shared market
forecast – is intuitive. But their method, though ingenious, is unnecessarily complex, limited in scope
and not founded on a clear principle. Also, they put great emphasis on limiting the credibility attached
to personal views in order to bring the optimal portfolio close to the market portfolio. In contrast, our
primary objective is to produce a probabilistic forecast that remains true to the views expressed by a
portfolio manager, whatever they may be, whilst remaining as close as possible to the market forecast
on other matters. To this end we have derived a distance measure between forecasts based on the gains
that can be expected from holding views that differ from the market forecast and have proposed the
following principle of least discrimination: one should not expect gains not supported by expressed
opinions. We have also found that the blending of personal and market views should take the form of a
simple linear interpolation, but regard this procedure as a last resort for those who do not have the
discipline or time for refining their own opinions.
Minimizing our distance measure is a straightforward process. In some simple instances, closed form
analytical solutions are available; they shed light on the reasons why some parameters are adjusted in
the minimization process. For example, views on covariances call for an adjustment of expected returns

ICMA Centre Discussion Papers in Finance, DP2007-07
Copyright © 2007. Pézier. All Rights Reserved. 18
so that the optimal linear portfolio remains as in the market portfolio. But to be fully exploited, such
views require the addition of non-linear, option like positions. Our method indicates the optimal mix of
straight positions and options positions and should encourage portfolio managers to make more
systematic use of derivative products. There are liquid markets in a large number of single asset options,
but correlation sensitive derivatives, e.g., spread options, basket options, currency protected options,
correlation futures and options, are still relatively underdeveloped or non-existent. Understanding
better when to use such products should contribute to their growth.
Closed form analytical solutions will generally not be available to cope with the large number of assets,
the potential multiplicity and complexity of personal views and the operational constraints a portfolio
manager needs to take into account. However, our objective function can be easily calculated and used
in a general solver; so, portfolio managers should find it easy to explore the consequences of their views
and to revise them accordingly until they reach satisfactory combination of forecast and optimal
portfolio. The next stage is to examine how this methodology can be expanded into optimal dynamic
asset allocation strategies taking into account transaction costs and evolving views.
ICMA Centre Discussion Papers in Finance, DP2007-07
Copyright © 2007. Pézier. All Rights Reserved. 19
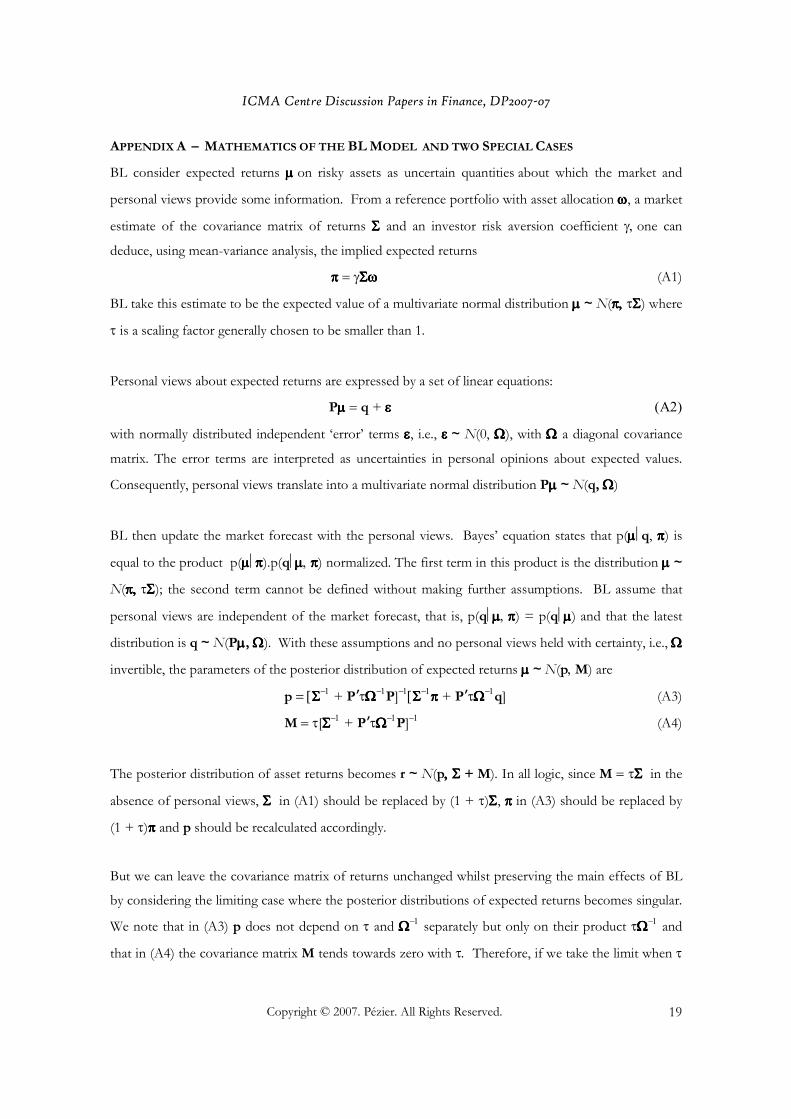
APPENDIX A – MATHEMATICS OF THE BL MODEL AND TWO SPECIAL CASES
BL consider expected returns µ µ µ µ on risky assets as uncertain quantities about which the market and
personal views provide some information. From a reference portfolio with asset allocation ωωωω, a market
estimate of the covariance matrix of returns ΣΣΣΣ and an investor risk aversion coefficient γ, one can
deduce, using mean-variance analysis, the implied expected returns
ππππ = γΣωΣωΣωΣω (A1)
BL take this estimate to be the expected value of a multivariate normal distribution µµµµ ~ N(π, π, π, π, τΣΣΣΣ) where
τ is a scaling factor generally chosen to be smaller than 1.
Personal views about expected returns are expressed by a set of linear equations:
Pµµµµ = q + εεεε (Α2)
with normally distributed independent ‘error’ terms εεεε, i.e., ε ε ε ε ~ N(0, ΩΩΩΩ), with ΩΩΩΩ a diagonal covariance
matrix. The error terms are interpreted as uncertainties in personal opinions about expected values.
Consequently, personal views translate into a multivariate normal distribution Pµµµµ ~ N(q, ΩΩΩΩ)
BL then update the market forecast with the personal views. Bayes’ equation states that p(µµµµq, ππππ) is
equal to the product p(µµµµππππ).p(qµµµµ, ππππ) normalized. The first term in this product is the distribution µµµµ ~
N(π, π, π, π, τΣΣΣΣ); the second term cannot be defined without making further assumptions. BL assume that
personal views are independent of the market forecast, that is, p(qµµµµ, ππππ) = p(qµµµµ) and that the latest
distribution is q ~ N(Pµµµµ, ΩΩΩΩ). With these assumptions and no personal views held with certainty, i.e., ΩΩΩΩ
invertible, the parameters of the posterior distribution of expected returns µµµµ ~ N(p, M) are
p = [ΣΣΣΣ−1 + P’τΩΩΩΩ−1P]−1[ΣΣΣΣ−1ππππ + P’τΩΩΩΩ−1q] (A3)
M = τ[ΣΣΣΣ−1 + P’τΩΩΩΩ−1P]−1 (A4)
The posterior distribution of asset returns becomes r ~ N(p,,,, Σ Σ Σ Σ + M). In all logic, since M = τΣ Σ Σ Σ in the
absence of personal views, Σ Σ Σ Σ in (A1) should be replaced by (1 + τ)ΣΣΣΣ, π π π π in (A3) should be replaced by
(1 + τ)ππππ and p should be recalculated accordingly.
But we can leave the covariance matrix of returns unchanged whilst preserving the main effects of BL
by considering the limiting case where the posterior distributions of expected returns becomes singular.
We note that in (A3) p does not depend on τ and ΩΩΩΩ−1 separately but only on their product τΩΩΩΩ−1 and
that in (A4) the covariance matrix M tends towards zero with τ. Therefore, if we take the limit when τ

ICMA Centre Discussion Papers in Finance, DP2007-07
Copyright © 2007. Pézier. All Rights Reserved. 20
and ΩΩΩΩ are reduced to zero whilst keeping τΩΩΩΩ−1 constant, M vanishes, p is unchanged and so is the
covariance matrix of returns. We call this limiting case the Black-Litterman Singular (BLS) model and
suggest an intuitive parameterization. The diagonal elements of ΩΩΩΩ are the variances assigned to personal
views, the diagonal elements of PτΣτΣτΣτΣP’ are the variances for the corresponding market views. Personal
and market views are weighted in the BL approach according to the reciprocals of their variances. This
weighting scheme can be restated by defining a diagonal matrix C of credibility weights for personal
views, each weight being assigned a value in the semi-open interval [0, 1) and setting τΩΩΩΩ−1 for use in
(A3) and (A4) as follows:
τΩΩΩΩ−1 = Diag[(PτΣΣΣΣP’)-1]C(I – C)-1 (A5)
When P and q describe personal views held with certainty, ΩΩΩΩ is not invertible and the posterior
distribution of returns becomes the conditional return distribution given Pµµµµ = q; the conditional
expected returns are:
p = ππππ + ΣΣΣΣP’[PΣΣΣΣP’]−1[q – Pππππ] (A6)
We call this special case the Black-Litterman Conditional (BLC) model.
APPENDIX B – GENERALIZED RELATIVE ENTROPY AS A GAIN IN CERTAINTY EQUIVALENT
Consider an investment universe with a risk free asset and n risky assets with excess returns r over a
certain investment horizon. Any asset and, more generally, any pay-off defined on the returns
(derivative product) can be bought or sold at fair price under a risk neutral pdf q(r). An investor
entertains a personal forecast p(r). We seek the pay-off fp(r) that maximises the expected utility of the
investor’s wealth at the investment horizon. In mathematical terms, we seek to maximize over the
choice of pay-off fp(r) the expected utility:
Ep[u(fp(r) – Eq[fp(r)] + w0)] (B1)
where Eq[fp(r)] is the cost of the pay-off fp(r), w0 the initial wealth of the investor and u(.) the investor’s
utility.
The optimum pay-off is obtained by setting to zero the first order derivative of the expected utility with
respect to f, that is, (with ux denoting the first derivative of u(x) with respect to x = fp(r) – Eq[fp(r)] +
w0), for any r:
p(r).ux(x(r)) – q(r).Ep[ux] = 0 (B2)
This obtains for ux(x(r)) proportional to q(r)/p(r).

ICMA Centre Discussion Papers in Finance, DP2007-07
Copyright © 2007. Pézier. All Rights Reserved. 21
The optimal pay-off is particularly easy to calculate with an exponential utility function because it does
not depend on the level of initial wealth, which we can therefore set to zero without loss of generality.
With u(x) = – exp(-γx), it follows that ux = γ.exp(-γx) and (B2) yields the optimal net pay-off
fq,p(r) = (1/γ) ln(p(r)/(q(r)) + C(fq,p|q, p) (B3)
where fq,p(r) = fp(r) – Eq[fp(r)] is the optimal net pay-off and C(fq,p |q, p) is a scalar independent of r.
Substituting (B3) into (B1) with the exponential utility function gives the maximum expected utility
Ep[u(fq,p(r))] = −exp(-γC(fq,p|q, p))
Therefore, C(fq,p|q, p) is the certainty equivalent of the optimal net pay-off fq,p(r). It is obtained as a
function of p(r) and q(r) by taking the expected value of both sides of (B3) under the risk neutral
distribution q(r). The result is:
C(fq,p|q, p) = (1/γ)Eq(ln(q(r)/p(r)) = (1/γ)D(q, p) (B4)
where we recognize the relative entropy distance D(q, p) between pdfs q(r) and p(r).
We now evaluate the active portfolio an investor should add to the market portfolio when he entertains
a personal forecast p(r) different from the market implied forecast m(r). Using (B3) and (B4), we find
by difference the active net pay-off:
fq,m,p(r) := fq,p(r) – fq,m(r) = (1/γ)( ln(p(r)/(m(r)) + D(q, p) – D(q, m)) (B5)
The gain in certainty equivalent from adding this active net pay-off is the difference between the
certainty equivalent C(fq,p|q, p) of receiving the net pay-off fq,p(r) and the certainty equivalent C(fq,m|q,
p) of receiving the pay-off fq,m(r) for an investor forecasting p(r). We evaluate the latest as follows
using again (B3) and (B4):
–exp(–γC(fq,m|q, p)) = Ep[–exp(–ln(m(r)/q(r)) – D(q, m))]
= –exp(ln(Eq[p(r)/m(r)] – D(q, m))]
and therefore
C(fq,m|q, p) = (1/γ) (D(q, m) – ln(Eq[p(r)/m(r)]))
Thus, the gain in certainty equivalent from adding the optimal active portfolio is:
C(fq,p|q, p) – C(fq,m|q, p) = (1/γ) (ln(Eq[p(r)/m(r)]) – Eq[ln(p(r)/m(r))]) := (1/γ)D(q, m, p) (B6)
D(q, m, p) can be interpreted as a generalized relative entropy distance (GRE) between distributions m
and p, based on a third distribution q. One can verify that D(q, m, p) is always non-negative and is
equal to zero only when the distributions m and p are the same, except possibly on the null set of q
(from Jensen’s inequality). But D(q, m, p) is not a metric as, in general, it is not symmetrical in m and p
and does not respect the triangular inequality. Note also that D(m, m, p) = D(m, p).

ICMA Centre Discussion Papers in Finance, DP2007-07
Copyright © 2007. Pézier. All Rights Reserved. 22
When distributions q, m, and p are maximum entropy distributions satisfying conditions on first and
second order moments, that is, when they are multivariate normal distributions (Tribus [1969]), the
optimal active portfolio fq,m,p(r) and the distance D(q, m, p) can be expressed simply as a function of
the parameters of these distributions. So we consider the case where q is a risk neutral distribution
N(0, Σ Σ Σ Σ) and m and p are represented by N(ππππ, Σ Σ Σ Σ) and N(p, S), respectively. In this case, according to
(B3) and (B4), the market portfolio is the linear pay-off:
fq,m(r) = ππππ’(γΣΣΣΣ)−1r (B7)
It can also be written as fq,m(r) = ωωωω’r with ωωωω = (γΣΣΣΣ)−1ππππ. It is the optimal static asset allocation obtained
by traditional mean-variance analysis. The corresponding certainty equivalent is
(1/γ)D(q, m) = ½ππππ’(γΣΣΣΣ)−1ππππ (B8)
which is always non-negative (Σ Σ Σ Σ being positive definite) and equal to zero only if π π π π = 0.
The optimal active pay-off and the corresponding increase in certainty equivalent are:
fq,m,p(r) = (1/γ) (p – SΣΣΣΣ−1ππππ)’ S−1r – (1/2γ) [ r’(S−1 – ΣΣΣΣ−1)r +n – Tr(ΣΣΣΣS−1)] (B9)
(1/γ)D(q, m, p) = ½(p − − − − SΣΣΣΣ−1ππππ)’(γS)−1(p − − − − SΣΣΣΣ−1ππππ) + (1/2γ)[Tr(ΣΣΣΣS−1) – n – ln(|ΣΣΣΣS−1|)] (B10)
where Tr(.) denotes a trace and |....| a determinant. The increase in certainty equivalent is the sum of
two non negative terms. The first term is nil if and only if p = SΣΣΣΣ−1ππππ when S is positive definite. The
second is nil if and only if S = ΣΣΣΣ−1 (the trace of a matrix is the sum of its eigenvalue and the
determinant is the product of its eigenvalues and we know that (x – 1) ≥ ln(x) with equality iff x = 1).
We observe from (B9) that the term linear in asset returns (the traditional optimal static asset allocation)
is of the form ωωωω’r with allocations ωωωω = (γS)−1(p − − − − SΣΣΣΣ−1ππππ). The optimal active pay-off contains only
quadratic terms in the returns when p = SΣΣΣΣ−1ππππ. Indeed since (γΣΣΣΣ−1)π π π π is the market portfolio, p so
calculated is the expected return corresponding to the market portfolio under covariance matrix S. We
also observe from (B10) that the locus of expected returns p in distributions N(p, S) that are
equidistant from the market forecast N(ππππ, Σ Σ Σ Σ) is an ellipsoid centered on SΣΣΣΣ−1ππππ. This observation gives a
geometric interpretation to the construction of LDDs in Appendix C.
In the special case where S ==== ΣΣΣΣ, the terms in square brackets in (B9) and (B10) are nil and these two
expressions reduce to:
fq,m,p(r) = (p − π − π − π − π)’ (γΣΣΣΣ)−1r (B11)
(1/γ) D(q, m, p) = ½(p − π − π − π − π)’(γΣΣΣΣ−1)(p − π − π − π − π) (B12)

ICMA Centre Discussion Papers in Finance, DP2007-07
Copyright © 2007. Pézier. All Rights Reserved. 23
To illustrate, consider an investor with a risk aversion coefficient γ = 4 who is given the opportunity to
invest in a single risky asset with excess return of 8% and volatility of 20% according to the market
forecast. If he agrees with the market, he should, according to (B7), allocate half of his wealth to the
risky asset and the other half to the risk free asset; this would, according to (B8), increase his certainty
equivalent by 2% compared to investing exclusively in the risk free asset.
But if the same investor changes his mind and now puts the expected return of the risky asset at 6%
only, he should, according to (B9), reduce his holding of the risky asset by one eighth; this would
increase his certainty equivalent by 0.125%, according to (B10). One verifies that comparing the latter
view directly with the risk neutral view leads immediately to an optimal investment of 3/8 in the risky
asset and a gain in certainty equivalent of 1.125%. As is evident from the form of expression (B5), the
addition of active pay-offs corresponding to successive changes in views always leads to the optimal
poay-off matching the last views. However, successive increases in certainty equivalents do not add up
to the increase in certainty equivalent from the initial pay-off to the final pay-off.
APPENDIX C – LEAST DISCRIMINATORY DISTRIBUTION (LDD) AND OPTIMAL ALLOCATION
Consider a market forecast of returns r with pdf m(r) and a set of personal views about some first and
second order moments of returns expressed by the following linear equations (the conditioning
equations):
Pp = q (C1)
G.Vech(S) = h (C2)
In these conditioning equations, P and G are matrices expressing linear combinations of expected
returns and covariances, respectively; p and S are the vector of expected return and the covariance
matrix of returns in the personal forecast p(r); q and h are the column vectors of parameters specifying
the views on expected returns and covariances.
We call least discriminatory distribution (LDD) with respect to the market forecast m(r) and the risk
neutral distribution q(r) the personal distribution of returns p(r) that satisfies the conditioning equations
and minimises the potential increase in certainty equivalent from exploiting optimally the forecast p(r).
With exponential utilities, this means minimizing the distance D(q, m, p) defined in (B6) and therefore
minimizing the Lagrangian
L = D(q, m, p) – λ0(Ep[1] – 1) – λλλλ1’(Pp – q) – λλλλ2’(G.Vech(S) – h) (C3)
where λ0 is the Lagrange multiplier corresponding to the normalisation condition for p(r) and λλλλ1 and λλλλ2
are column vectors of Lagrange multipliers for the conditions on first and second order moments.

ICMA Centre Discussion Papers in Finance, DP2007-07
Copyright © 2007. Pézier. All Rights Reserved. 24
We explore this minimization problem in a few simple instances, assuming that the risk neutral forecast
q(r) and the market forecast m(r) are multivariate normal distributions N(0, S) and N(ππππ, Σ Σ Σ Σ) respectively;
consequently, the GRE distance is given by (B10).
C1 –Views on Complete Covariance Matrix and on some Expected Returns
The minimization of the GRE distance under condition (C1) and S being set leads to minimizing over
p the Lagrangian:
L = ½(p − − − − SΣΣΣΣ−1ππππ)’S−1(p − − − − SΣΣΣΣ−1ππππ) + ½[Tr(ΣΣΣΣS−1) – n – ln(|ΣΣΣΣS−1|)] – λλλλ1’(Pp – q) (C4)
We set the differentials with respect to p equal to zero:
∂∂∂∂L/∂∂∂∂p = S−1(p − − − − SΣΣΣΣ−1ππππ) − P’λλλλ1 = 0
hence, p − − − − SΣΣΣΣ−1ππππ = SP’λλλλ1
Now, setting the differentials with respect to λλλλ1 equal to zero (that is, applying condition (C1)) gives
λλλλ1 = (PSP’)−1(q − P SΣΣΣΣ−1ππππ) (C5)
so that
p = SΣΣΣΣ−1ππππ + SP’(PSP’)−1(q – P SΣΣΣΣ−1ππππ) (C6)
This vector of expected returns satisfies condition (C1) for any choice of the covariance matrix S. The
corresponding GRE is:
D(q, m, p) = ½(q – P SΣΣΣΣ−1ππππ)’(PSP’)−1(q – P SΣΣΣΣ−1ππππ)+ ½ [Tr(ΣΣΣΣS−1) – n – ln(|ΣΣΣΣS−1|)] (C7)
Two remarks need be made:
(i) In the absence of views on expected returns (i.e., no condition (C1), or P = 0) the forecast
of expected returns should be, according to (C6),
p = SΣΣΣΣ−1ππππ (C8)
In other words, a view on covariances should lead to an active portfolio with non-linear
linear pay-offs only. The expected return vector in (C8) is the vector that is compatible
with the existing linear market portfolio when the covariance forecast is S instead of ΣΣΣΣ.
The corresponding GRE is:
D(q, m, p) = ½ [Tr(ΣΣΣΣS−1) – n – ln(|ΣΣΣΣS−1|)] (C9)
(ii) With S = ΣΣΣΣ and views on some expected returns, the vector of expected returns is
p ==== ππππ + ΣΣΣΣP’[PΣΣΣΣP’]−1[q – Pππππ] (C10)

ICMA Centre Discussion Papers in Finance, DP2007-07
Copyright © 2007. Pézier. All Rights Reserved. 25
as with the BLC model (re (A6)). The matching optimal active allocation is obtained by
substituting (C10) into (B9):
fq,m,p(r) = (q – Pππππ)’(PγΣΣΣΣP’)−1Pr (C11)
It is a linear combination of returns with asset weights:
ωωωω = P’(PγΣΣΣΣP’)−1(q – Pππππ) (C12)
The corresponding gain in certainty equivalent is, according to (B10):
(1/γ) D(q, m, p) = ½(q – Pππππ)’(PγΣΣΣΣP’)−1(q – Pππππ) (C13)
Recovering the BLC results in this case is not surprising since the GRE distance under the
condition S = ΣΣΣΣ reduces to the quadratic distance ½(p − π − π − π − π)’ΣΣΣΣ−1(p − π − π − π − π) that is minimized
under the constraint (C1) in BLC; the LD method justifies the choice of objective
function in BLC.
C2 – Views on Expected Returns but no Views on some Covariances
When the covariance matrix S is not completely determined by personal views, we can minimize the
Lagrangian (C4) over the choice of parameters in both p and S. The minimisation over p leads to (C6)
and we are left with minimising the GRE (C7) over S subject to condition (C2). It is easy to see that
even with total absence of views on correlations, the choice S = ΣΣΣΣ minimizes the term between square
brackets in (C7) but generally does not minimize the leading quadratic expression and therefore is
generally not optimal. Thus, with the covariance matrix not fully determined, a view on some expected
returns different from the market forecast should induce not only an adjustment of other expected
returns but also an adjustment of the covariance matrix away from the market covariance matrix.
An analytical solution to this general GRE minimization problem requires solving a set of simultaneous
non-linear equations that may rapidly become intractable. A general solver is best suited to this task.
We can illustrate analytically the fact that the choice S = ΣΣΣΣ is generally not optimal when conditioning
on some expected returns by revisiting the single risky asset example at the end of Appendix B. There,
an investor with a risk aversion coefficient γ = 4 can invest in a single risky asset with excess return of
8% and volatility of 20% according to the market forecast. We found that if he agrees with the market
forecast, he should allocate half of his wealth to the risky asset and the other half to the risk free asset,
but if his personal view was that the excess return should be only 6% and he still trusts a volatility of
20%, he should put in place an active portfolio of –1/8th, that is, allocate only 3/8th to the risky asset.
That would increase his certainty equivalent by 1.125%. But suppose now that the investor is willing to

ICMA Centre Discussion Papers in Finance, DP2007-07
Copyright © 2007. Pézier. All Rights Reserved. 26
let the volatility forecast be adjusted away from 20%, what would be his new forecast, the
corresponding active pay-off, and the increase in certainty equivalent?
In this univariate example the GRE (C7) reduces to:
D(q, m, p) = ½(p – (s/σ)2π)2/s2 + ½ [(σ/s)2 – 1 – 2ln(σ/s)]
Setting the derivative with respect to s to zero yields the solution
s2 = ½ (σ4/π2)[ –1 + (1+ 4(σ2 + q2)π2/σ4)0.5]
Note that s = σ is a solution only when q = π. With the personal forecast p = 6%, volatility should be
adjusted down from 20% to s = 19.46%. The corresponding active portfolio would be
fq,m,p(r) = – 0.104r – 0.176 r2 + 0.007
and the gain in certainty equivalent would be only 0.10%. Thus, allowing for volatility adjustment, the
active linear portfolio is less short in the risky asset (–0.104 instead of –0.125) but contains a short
volatility position.
This finding is not immediately intuitive. However we note that when r = p, the sensitivity of the active
portfolio to interest rate changes is –0.125, same as when s = σ . This is a general result that can be
seen immediately from (B9). Assuming S = ΣΣΣΣ leads to a linear active portfolio with weights (i.e., first
order sensitivities) ωωωω = (γΣΣΣΣ−1)(p − π − π − π − π). When S may be adjusted, the same first order sensitivities are
obtained when the returns are at their expected values, but not elsewhere because of the non-linear
component of the active pay-off .
APPENDIX D – BLENDED FORECASTS
Consider a risk neutral forecast q(r), a market forecast m(r) and a personal forecast p(r); we define as
best compromise forecasts b(r), the solutions to:
Argmin(b): D(q, p, b)
Subject to: D(q, m, b) = constant (D1)
where D(. . .) is the GRE distance between the relevant probability densities.
(D1) can be solved analytically when q(r), m(r) and p(r) are multivariate normal distributions, then b(r)
should also be a multivariate normal distribution. Using parameters N(0000, ΣΣΣΣ), N(ππππ, ΣΣΣΣ), N(p, S) and N(b,
B) respectively for q(r), m(r), p(r) and b(r), we minimise the Lagrangian of the constrained
minimization problem:
Argmin(b, B): L = D(q, p, b) + λ[D(q, m, b) – constant] (D2)

ICMA Centre Discussion Papers in Finance, DP2007-07
Copyright © 2007. Pézier. All Rights Reserved. 27
Using (B10) for the GRE distances, the Lagrangian is such that:
2L = (b − − − − BS−1p)’B−1(b − − − − BS−1p) + Tr(SB−1) – n – ln(|SB−1|)
+ λ[ (b − − − − BΣΣΣΣ−1ππππ)’B−1(b − − − − BΣΣΣΣ−1ππππ) + Tr(ΣΣΣΣB−1) – n – ln(|ΣΣΣΣB−1|) – constant] (D3)
Setting the differential of L with respect to b equal to zero gives:
B−1(b − − − − BS−1p) + λB−1(b − − − − BΣΣΣΣ−1ππππ) = 0
for any B, so that:
b = B(S−1p + λΣΣΣΣ−1ππππ)/(1 + λ) (D4)
but of course, B can always be expressed as
B = B(S−1S + λΣΣΣΣ−1ΣΣΣΣ)/(1 + λ) (D5)
Therefore the parameters of b and B of the best compromise forecast can be obtained by interpolation
between the corresponding parameters of the market and personal forecasts using the same weights.

ICMA Centre Discussion Papers in Finance, DP2007-07
Copyright © 2007. Pézier. All Rights Reserved. 28
REFERENCES
Black, F., and R. Litterman, “Global Portfolio Optimization.” Financial Analysts Journal, 48(5) (Sep/Oct
1992), pp. 28-43.
Broadie, M., “Computing Efficient Frontiers using Estimated Parameters.”, Annals of Operations Research,
Special Issue of Financial Engineering, 45 (1993), pp. 21-58
Davis, M. H. A. and A. R. Norman, “Portfolio Selection with Transactions Costs.” Mathematics of
Operations Research 15 (1990), pp.676-713.
Drobetz, W., “How to avoid the Pitfalls in Portfolio Optimization? Putting the Black-Litterman
Approach at Work.” Financial Markets and Portfolio Management, 15(1) (2001), pp. 59-75.
Fabozzi, F. J., S. M. Focardi, and P. N. Kolm, “Incorporating Trading Strategies in the Black-Litterman
Framework., Journal of Trading, (Spring 2006), pp. 28-36
Fabozzi, F. J., Kolm, P. N., Pachamanova, D.A. & Focardi, S. M. “Robust Portfolio Optimization.” The
Journal of portfolio Management, (Spring 2007), pp. 40-48
Idzorek, T.,M., “A Step-by-step Guide to the Black-Litterman Model.” Working Paper (2004), Duke
University
Jagannathan, R. & Ma, T. “Risk Reduction in Large Portfolios: Why Imposing the Wrong Constraint
Helps.” The Journal of Finance, 53 (August 2003), pp. 1651-1683
Jobson, J. D. and R. Korkie, “Estimation for Markowitz Efficient Portfolios.” Journal of the American
Statistical Association, 75, 371 (1980), pp. 544-554
Jones, R.., T. Lim and P. J. Zangari, “The Black-Litterman Model for Structured Equity Portfolios.” The
Journal of Portfolio Management, (Winter 2007), pp. 24-33
Jorion, Ph., “Bayes-Stein Estimation for Portfolio Analysis”, Journal of Financial and Quantitative Analysis,
21 (1986), pp. 279-292
Michaud, R..,O., “The Markowitz Optimization Enigma: Is ‘optimized’ Optimal?” Financial Analysts
Journal, 45 (1989), pp. 31-42.
Litterman, R., and G. He, “The Intuition Behind Black-Litterman Model Portfolios.” Unpublished manuscript,
(1999), Goldman Sachs, New York.
Pézier, J., and A. White, “The Relative Merits of Investable Hedge Fund Indices and Funds of Hedge
Funds in Optimal Passive Portfolios”, DP2006_10, (2006), ICMA Centre, university of Reading
Satchell, S. and A. Scowcroft, “A Demystification of the Black-Litterman Model: Managing
Quantitative and Traditional Portfolio Construction”, Journal of Asset management, Vol 1, 2 (1997), pp.
138-150
Tribus, M., Rational Descriptions, Decisions and Designs, (1968) MIT Press
Tversky, A. and D. Kahneman, “Judgment under Uncertainty: Heuristic and Biases”, Science, 185
(1974), pp. 1124-31

ICMA Centre Discussion Papers in Finance, DP2007-07
Copyright © 2007. Pézier. All Rights Reserved. 29
EXHIBIT 1: LD WITH MARKET COVARIANCES ON TWO-RISKY ASSET PORTFOLIO
Posterior Expected Returns (%)
Optimal Allocations (%) and Gains in CE
Market (M) and Personal Views (P) on Expected
Returns (%) A B A B Riskless CE+
M P1 P2 P3 P4 P5 P6
pA = 4.5, pB = 10.5 pA = 5.5, pB = 10.5 pA = 5.5 pB − pA = 5.0 11111111pB − 21212121pA = 0 50% P1 and 50% M Interpol. (M, P1)
4.50 5.50 5.50 4.40 4.94 4.95 5.0
10.5 10.5 11.75 9.4 9.43 10.85 10.5
50.0 91.0 75.0 60.0 81.7 63.8 70.5
50.0 37.2 50.0 40.0 33.4 47.8 43.6
0.0 -28.2 -25.0 0.0
-15.1 -11.7 -14.1
0.000 0.205 0.125 0.050 0.160 0.025 0.050
Posterior Expected Returns (%)
with Market Covariances
9
9.5
10
10.5
11
11.5
12
4 4.5 5 5.5 6
Asset A
Asset B
P1
P2
M
P3P4
P5
P6
Optimal Allocations (%) and CE Gains (bp)
with Market Covariances
20
30
40
50
60
40 50 60 70 80 90 100
Asset A
Asset B
M(0)
P1(21)
P2(13)
P3(5)
P4(16)
P6(5)
P5(5)
Risk free borrowing

ICMA Centre Discussion Papers in Finance, DP2007-07
Copyright © 2007. Pézier. All Rights Reserved. 30
EXHIBIT 2: LD WITH ADJUSTED COVARIANCES ON TWO-RISKY ASSET PORTFOLIO
Posterior Expected Returns (%)
Optimal Allocations (%) and Gains in CE
Market (M) and Personal Views (P) on Expected
Returns (%) A B A B Riskless CE+
M P1 P2 P3 P4 P10
pA = 4.5, pB = 10.5 pA = 5.5, pB = 10.5 pA = 5.5 pB − pA = 5.0 11111111pB − 21212121pA = 0 P1 with 62.5% correl
4.50 5.50 5.50 4.35 4.95 5.50
10.5 10.5 11.92 9.35 9.45 10.5
50.0 79.3 64.9 57.3 74.7 82.8
50.0 39.7 50.0 42.7 37.1 41.2
0.0 -19.0 -14.9 0.0
-11.7 -24.0
0.000 0.150 0.077 0.036 0.123 0.17
EXHIBIT 3: ADJUSTED COVARIANCES AND COEFFICIENTS OF QUADRATIC PAY-OFFS
Scenarios Vol A (%)
Vol B (%)
Correl(A,B) (%)
rA2
(A straddles) rA rB rB
2
M P1 P2 P3 P4 P10
10.00 10.36 10.32 9.97 10.18 10.19
20.00 19.95 20.46 19.62 19.62 19.63
62.50 63.88 64.63 61.84 62.63 62.50
0.00 -0.84 -0.37 -0.16 -0.65 -0.75
0.00 -0.23 -0.31 0.02 -0.08 0.00
0.00 0.18 0.00 0.13 0.21 0.19
Optimal Allocations (%) and CE Gains (bp)
with Covariance Adjustments
20
30
40
50
60
40 50 60 70 80 90 100
Asset A
Asset B
M(0) P2(8)
P1(15)
Risk free borrowing
P3(4)
P4(12)

ICMA Centre Discussion Papers in Finance, DP2007-07
Copyright © 2007. Pézier. All Rights Reserved. 31
ENDNOTES
1 For short, throughout this paper we use the term ‘return’ to mean ‘excess return’ above the appropriate risk free rate over the investment horizon. The ‘risk-free’ asset depends naturally on the choice of objective (e.g., final wealth or buying power) and the investment horizon. 2 A quantitative expression of risk attitude is not even necessary if one is concerned about selecting a portfolio of risky assets only, leaving the choice of leveraging to investors. 3 Analysts often go to extraordinary lengths to avoid making quantitative probabilistic forecasts, whether for fear of being challenged or for fear of being misunderstood. Most prefer to use qualitative forecasts or to make direct investment recommendations (such as “buy” or “hold”) although they may not know fully their clients’ positions, objectives and constraints. 4 Even when the objective of portfolio management depends on a single characteristic of the return distribution, for example a value-at-risk constraint with severe penalties, there is no point in delving into the uncertainty in the evaluation of that characteristic. This uncertainty should bear no relevance to allocation decisions. Take a more vivid example: if I had to cross a flimsy bridge for the pleasure of exploring the other side of a precipice, I would balance those pleasures against the inconvenience of falling to my death should the bridge break. I would therefore assess with great care the probability of the bridge collapsing under my weight. But whatever uncertainty there may be about that probability, it should not affect in my decision to cross the bridge or not. 5 It is more likely that forecasts of expected returns would be based on information pertaining to the future rather than historical price series, for example in the case of a share price, information about a change of management, new contracts, new technologies, pending lawsuits, etc. 6 Even with constant trends and volatilities – and there is little empirical evidence for that in asset returns – statistical trend estimates are highly uncertain The statistical error (standard deviation) for an average return based
on a series of n iid observations with volatility σ is equal to σ/√n. For example, to estimate with a 1% statistical error the yearly trend of a price series with 20% volatility would require 400 years of observations. 7 We use the following notations: bold lower case letters for column vectors and bold upper case letters for matrices. An apostrophe denotes a transpose and a (–1) exponent marks an inverse. Otherwise we keep as closely as possible to the notations in Black and Litterman [1992]. 8 This relationship results from the unconstrained maximization of the certainty equivalent ππππ'ωωωω –(γ/2)ωωωω'ΣωΣωΣωΣω 9 With continuous time price models and continuous observations, deterministic volatilities and correlations, would be perfectly known instantaneously. For estimation errors when these assumptions are relaxed, see Jobson and Korkie[1980]). Some estimation methods use structural models to reduce the number of correlation parameters (e.g., linear factor models) and shrinkage techniques to obtain robust estimates (Jorion [1986]). 10 Option prices yield implied volatilities and correlations over their tenor, though correlation sensitive instruments – spread options, basket options, exchange options, etc. – mare often illiquid and give therefore only approximate estimates of correlations. Options implied volatilities and correlations are especially relevant when these instruments are included in the universe of assets available for investment. 11 The average risk attitude of a group of investors is difficult to estimate. One would need to know their total wealth (including, the evaluation of human capital, illiquid assets, etc.) and how it is allocated. Due to lack of information and heterogeneity among investors, one finds illustrative figures for risk aversion coefficients in the literature ranging from less than 2 to more than 6. 12 Only if expected returns were estimated statistically from historical price series, which they are not in this
instance, would the asymptotic distribution of estimates be multivariate normal with covariance matrix ΣΣΣΣ/√n. 13 Strictly speaking, this is only true with some types of probability distributions. 14 The risk neutral forecast corresponds to market implied covariances and zero expected returns for all assets and traded derivatives. In a complete market, it determines the market price of any derivative contract. 15 An exponential utility function can generally be used as a first approximation of other utility functions over a limited range of risks. 16 The relative entropy distance between two distributions with pdf’s m and p, where the support of m is included
in the support of p, is defined as D(m, p) = Em[ln(m/p)]; it is used in many fields, especially in information theory where it is also known as the Kullback-Leibler divergence. The relative entropy distance is always non-negative
and equal to zero if and only if m = p. But it is not a metric because it is not symmetric and does not satisfy the triangular inequality.